
Abstract
Fire is a critical risk in reinforced concrete (RC) structures and appropriate structural resistance against it has to be ensured. In this contribution, an approach using corotational layered beam finite elements is employed in which the cross-section temperature is derived from a low-cost closed form model, as opposed to the more commonly used fully computational thermal analysis. The effect of geometrical and material nonlinearities (constitutive behavior fitted to experimental data for concrete and steel), material degradation as a function of temperature rise, and the contributions of thermal, transient, and creep strains are incorporated in the structural analysis. The computational results are favorably compared to experimental data from the literature for an RC beam and for a larger RC frame. Taking benefit of the layered beam formulation offering local insight into the cross-sectional and material behavior, the relationship between the structural degradation and data extracted from the cross-sectional behavior is successfully established. Noteworthy originalities of the contribution are the use of ultimate strain and its evolution as a function of temperature for both materials and the explanation of the observed structural response in fire conditions from cross-sectional data.
Introduction
Fire is one of the accidental loads to which reinforced concrete (RC) structures may be subjected during their lifetime. Despite the disparate data on fires in the European Union (EU) member states, figures suggest that there are at least 5000 fire incidents each day in the EU (Brushlinsky et al., 2006), of which approximately 90% in buildings. To understand the thermo-mechanical performance of RC structures at high temperatures, significant experimental and numerical research has been carried out and continues to be performed today.
Experiments are clearly the most physically sound way to investigate RC structures under fire. From an experimental point of view, several RC structure test programs have focused on columns (Ali et al., 2004; Franssen and Dotreppe, 2003; Hass, 1986; Hertz, 2003; Lie and Irwin, 1990; Raut and Kodur, 2010), beams (Dotreppe and Franssen, 1985; Dwaikat and Kodur, 2009; Lin et al., 1981; Wu et al., 1993), and fewer have looked at frames (Li et al., 2018; Raouffard and Nishiyama, 2015, 2017) or varied experimental parameters (e.g. types of fire exposure (ASTM, 2008, ISO 834-1, 1999)). No doubt very valuable, experiments, however, demand specialized and sophisticated equipment, take a long time and are costly. Additionally, generally the validity of the experimental results is limited to the particular scenario from which it is not always straightforward to extrapolate to other cases or setups.
For a rapid estimate of fire safety, analytical or simplified approaches are available (Bajc et al., 2015; Desai, 1998; El-Fitiany and Youssef, 2009, 2010, 2017; Purkiss et al., 1989; Tan and Tang, 2004) and design graphs specified in standards and codes (ACI 216.1 (ACI, 2007) and Eurocode 2 (Eurocode 2, 2004)) can be used, usually limited to single elements.
When large RC structures are the focus, numerical approaches become increasingly more useful, allowing for the treatment of complex interactions between structural members. The vast majority of the recent numerical efforts use commercial software (Jiang et al., 2017; Nguyen et al., 2018), specific in-house developed codes (Wu et al., 2018), or open sources packages (Jiang et al., 2014) with sometimes a limited set of constitutive models by default. The numerical approaches can be classified into two main types, namely: the detailed models (full 3D meshing using solid FE) (Ba et al., 2016; Balaji et al., 2016; Gao et al., 2013; Raouffard and Nishiyama, 2018; Sanad et al., 2000) and reduced approaches using fiber/layer cross-section discretization in 2D/3D (Cai et al., 2003; Franssen, 2005; Kodur and Dwaikat, 2008).
Detailed models are able to describe the complex structural and cross-sectional geometries and usually incorporate nonlinear material behavior. Most of the studies with such models show their good predictive capability; however, because of their high computational cost they are mostly limited to individual RC members or small frames. It is a noteworthy disadvantage that they require a very large set of input model parameters and their identification.
For a higher computational efficiency, reduced approaches have been proposed based on fiber cross-section discretization of beam FE (Biondini and Nero, 2010; Dotreppe and Franssen, 1985; Kodur and Dwaikat, 2008; Kodur et al., 2009; Wu and Lu, 2009). These models can incorporate computationally expensive hydro-thermo-mechanical or a simpler thermo-mechanical coupling (neglecting spalling) or are based on more phenomenological models (Kodur et al., 2013, 2017). Bamonte and Lo Monte (2010, 2015), developed a thermo-mechanical approach taking into account both transient and creep deformations, second-order effects, however, limited to RC columns. Noteworthy recent developments incorporate a two-way thermo-mechanical coupling in 2D (Prakash and Srivastava, 2018b) and 3D (Prakash and Srivastava, 2018a) based on a direct stiffness method.
The objectives of the present contribution are double: (i) proposal of a computationally efficient and relatively simple layered beam approach and assessing its performance by comparing to available experimental data and (ii) exploitation of the cross-sectional results (strains and stresses) from the simulation to explain the observed structural response. A particularity of the present work is to employ a closed form thermal model (Kodur et al., 2013) to feed the nonlinear FE mechanical analysis (Iribarren et al., 2011; Oliveira et al., 2014). Additionally, it is noteworthy that (i) the constitutive model incorporates layer fracture by an ultimate strain condition for both constituents and that (ii) all material parameters were adjusted to match experimental data, including their temperature induced evolution and that (iii) the model incorporates properly thermally induced strains (i.e. thermal and load induced thermal strains (LITS)). This corresponds to an unprecedented set of modeling ingredients and hence numerical results, to the authors’ best knowledge.
The explanation of the proposed thermo-mechanical multilayered beam computational tool is given in the Computational Formulation section. The qualitative and quantitative comparisons between computational and experimental results from the literature are presented in the Applications section for a RC beam and a frame. A good match in displacement and time quantities is shown, accompanied by a detailed analysis bridging the global response of the structure and data extracted from the cross-sectional behavior. In the final section, conclusions are drawn outlooks are discussed.
Computational formulation
A corotational multilayered Bernoulli beam approach for planar frames (2D), initially developed in Iribarren et al. (2011) and Oliveira et al. (2014) is used in this work, similar to Fujikake et al. (2009) and Oliveira et al. (2008). Using the Bernouilli beam theory that neglects shear strains is recognized to be a good approximation for beams with a length/height aspect ratio of roughly over 10 and was shown to yield good results in Kodur and Dwaikat (2008) and Prakash and Srivastava (2018a, 2018b). This assumption could, however, be lifted by using Timoshenko beam finite elements (as in Lin and Zhang (2013)), which is part of future work. The Bernoulli beam assumption was adopted here because (i) the examples considered in this contribution satisfy the requirement above, (ii) the numerical results correspond well to the experimentally observed main failure modes, (iii) it allowed employing 1D constitutive laws that can be directly identified from experimental data (this simplification also results in lower model complexity and cost).
The corotational formulation serves the purpose of capturing geometrically nonlinear effects that are related to internal force reorientation as a consequence of large displacements and rotations that require updating the deformed configuration of the structure, such as catenary effects (Crisfield, 1997; Oliveira et al., 2014). This corotatinal formulation can be looked upon as a surrounding box around the routines that compute stress increments from strain increments; that can be based upon a linear or a nonlinear strain measure. Using a linear strain measure for concrete is appropriate, considering the relatively low ultimate strain values. It is a more debatable choice for steel at large strains; however, the influence of the variation of the material properties as a result of temperature increase is overwhelming compared to the difference that comes from using a linear, instead of a nonlinear strain measure. For the reasons above and for allowing for a simpler and cheaper computational treatment of the problem, the linear strain measure was adopted for concrete as well as for steel.
The multilayered framework consists in the discretization of the beam cross section into a finite number of layers along the height of the cross section. The generalized stresses (normal force N and bending moment M) are computed at the integration points from the generalized strains (i.e. average axial strain
1D constitutive models for concrete and steel
In the formulation 1D, strain rate independent elasto-plastic constitutive models are used for concrete and steel (Figure 1). Although a strain rate dependent material behavior (Iribarren et al., 2011) and advanced stirrups modeling are available in the developed framework (Berke and Massart, 2018), they were not incorporated because of the low loading rates in the simulations and to keep the number of model parameters to identify more manageable. The 1D concrete behavior has zero strength in tension, as adopted by Berke and Massart (2018), Iribarren et al. (2011), and Oliveira et al. (2014), and in compression, the plastic regime is assumed to soften following 1D elasto-plastic consititutive behavior of concrete in compression (zero tensile strength) and of steel in traction/compression.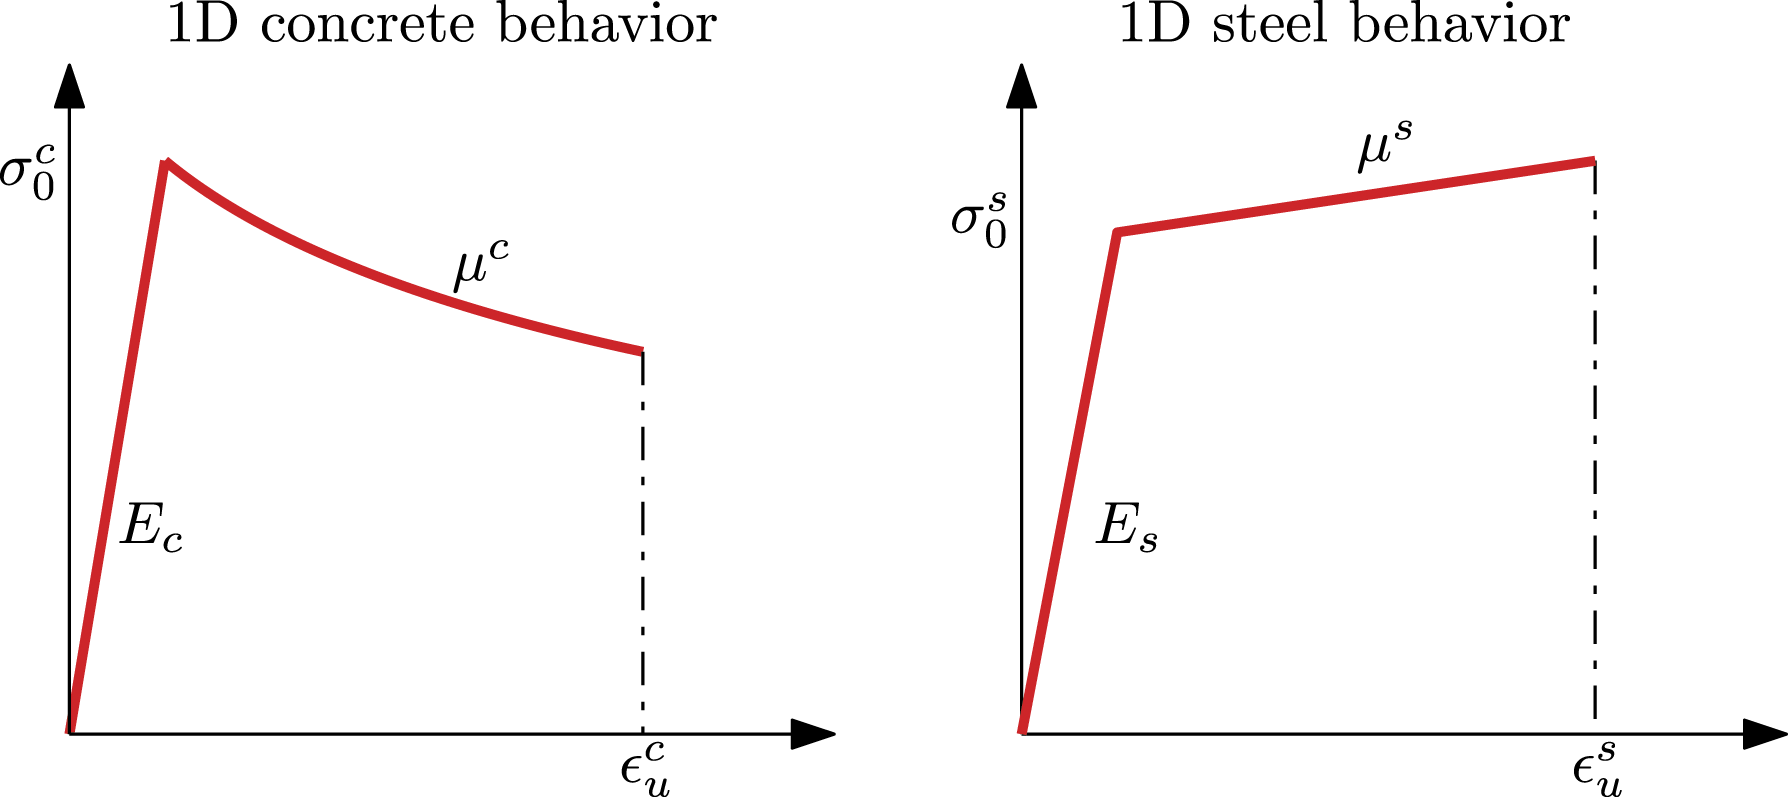


An original feature is that both materials’ constitutive models include ultimate strain parameters. The mechanical strain in each material is compared to its ultimate strain (varying as function of temperature) and the stress is set to zero and kept at zero in the subsequent load steps as soon as the mechanical strain reaches the ultimate strain. This allows capturing in the multilayered framework gradual cross-sectional degradation due to subsequent layer failures and is a key ingredient of the formulation.
Material parameters variation as a function of temperature
A special attention is paid to use material properties evolution fitted to experimental results from the literature, since capturing correctly the material parameter variation as a function of temperature is essential to obtain reliable and physically sound results.
A monotonic temperature increase is considered in the simulations and the post-fire cooling is ignored, allowing to consider a straightforward mapping between material parameters and the current temperature (i.e., the material parameters are independent from the thermal history). The material parameters that are assumed to vary in both steel and concrete constitutive models are: the Young’s modulus (E), the yield strength (σ o ) and the ultimate strain (ɛ u ). These parameters are a minimum set used to define a material law accounting for its elastic behavior, the elasto-plastic transition and fracture, that were observed to be nonlinear features with the most impact on the structural behavior in earlier efforts (Iribarren et al., 2011; Oliveira et al., 2014). Due to a lack of data the steel hardening and especially on concrete softening behavior at high temperatures these are assumed to be governed by nominal values of the corresponing parameters.
Models for material parameters evolution as a function of temperature were adopted here that are representative in an average sense, by choosing best fit models to gathered experimental data (Anderberg and Thelandersson, 1976; Bahr et al., 2013; Cooke, 1988; Schneider, 1988; Takeuchi et al., 1993; Xiao and König, 2004) (Figure 2). Relative material parameters variation with respect to their their values at 20°C versus temperature.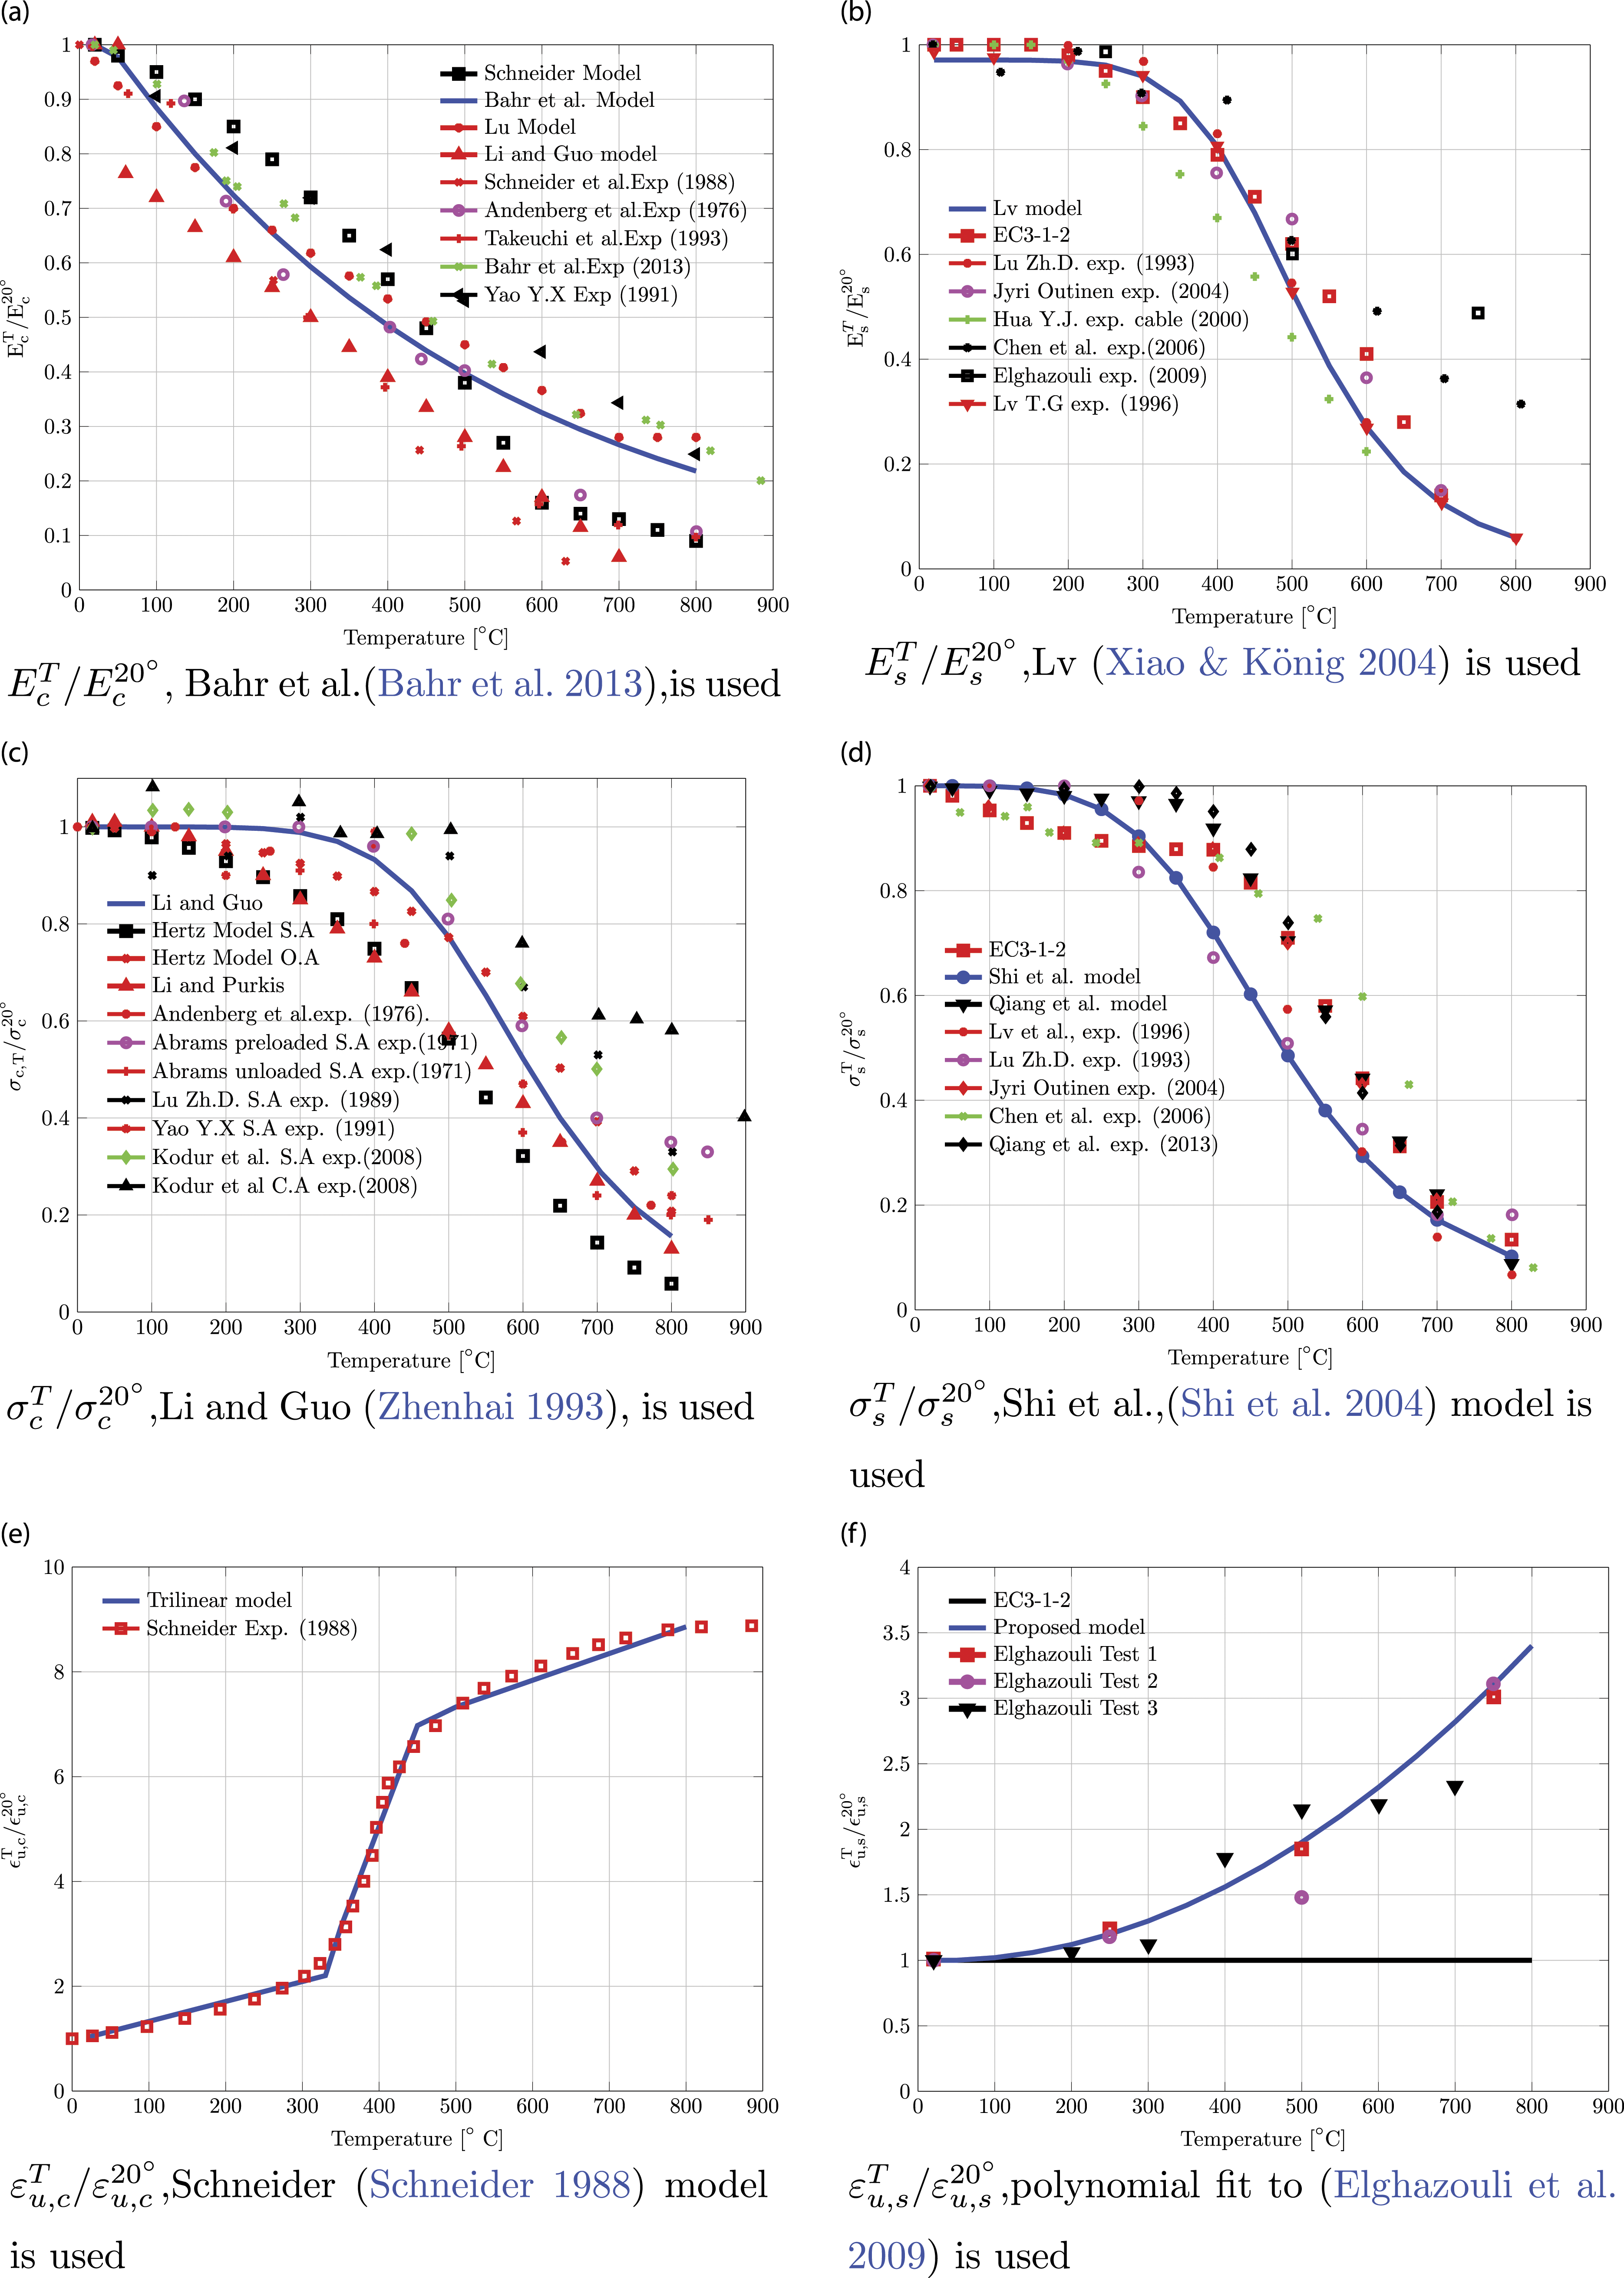
The expression used in this work is the model of Bahr et al. (2013) for the Young’s modulus, the model of Zhenhai (1993) for the yield strength variation, and a tri-linear expression fitted to Schneider (1988) is used for concrete ultimate strain. The steel elastic modulus and yield strength relative evolution are assumed to follow Xiao and König (2004) and Shi et al. (2004), respectively. Based on a more limited set of experimental data dedicated to the ultimate strain of steel at different temperatures a polynomial fit to data given in Elghazouli et al. (2009) is used in this work.
Both materials’ elastic modulus and strength decrease with temperature rise while their ultimate strain monotonously increases. It is worth noting that both materials are more ductile at high temperatures; therefore, the decrease of the elastic stiffness and an important plastic behavior are prone to dominate the structural behavior.
Thermally induced strains
The structural response in the proposed multilayered approach incorporates the effects of thermal, transient (induced by load and depending on the properties of cement type) and creep strains (due to the effect on the rate of bond breakage of both temperature and water micro-diffusion between capillary and gel pores (Bazant et al., 1997)). At a given layer i, an additive decomposition of the total strain

Phenomenological models which combine transient and creep strains, called LITS, are proposed in the literature (Anderberg and Thelandersson, 1976; Bratina et al., 2007; Khoury, 2000) to represent the stress and temperature-dependent strains in concrete. The transient and creep strains are irreversible strains due to permanent damage of the cement paste caused during heating (Khoury, 2000) and they only occur during the first heating cycle, that is, they do not evolve unless the previous maximum heating temperature is exceeded (Torelli et al., 2017).
The strain corresponding to the LITS actually has both an elastic and a plastic component and be can expressed as (Torelli et al., 2016)
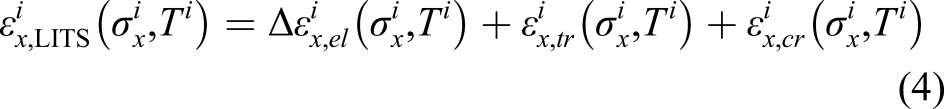
The expression of Anderberg and Thelandersson (1976) is used to calculate the transient strain and Harmathy’s expression for the creep strain in concrete (Harmathy, 1993).
The thermal strain in layer i (
Closed form thermal model
Similar to the vast majority of the works in the dedicated literature, the two most popular standard fire curves from ASTM E119 (ASTM, 2008) and ISO 834-1 (International Organization for Standardization, 1999) are used in the present work to calculate the gas temperature as a function of time.
In most of the numerical works with unilateral thermal-to-mechanical coupling, the cross-sectional temperature distribution is obtained from a thermal FE analysis preceding the mechanical computation which makes the simulation costly. In this work, however, the cross-sectional temperature distribution is derived using closed form expressions developed in Kodur et al. (2013). This model consists of two main equations that approximate the thermal field in the cross section varying along the height and thickness, obtained through fitting them to numerical results from a thermal FE analysis. The interested reader about the implementation details is referred to Kodur et al. (2013).
The appropriate approximation of temperature in the cross section is important since the material properties variation, as well as the thermally induced strains depend on it. The particularity and main simplification of the layered beam approach here is to average the temperature along the beam thickness, naturally resulting in a temperature that varies only along the beam height (i.e., from layer to layer). Simpson’s rule is used to integrate the temperature distribution along the layer width and to calculate an equivalnt average temperature, assumed to be homogeneous in each layer. Note that this assumption is more inaccurate for columns heated from their four sides, that is, for capturing the temperature gradients induced by a cold core.
For beams (elements primarily loaded in bending), a limited number of concrete layers on the top (or bottom) bear the highest stresses. With the assumed zero strength in tension for concrete, zones in which (compressive) stresses develop were observed to be close to the heated surface, that is, in less than 1/3 of the cross-section height, the stress magnitude decreasing rapidly with increasing distance from the outer surface (Figure 8). Close to the exposed bottom surface and on the opposite cold (top) side, temperature gradients are small along the beam width and taking a layer average temperature is a valid assumption. The above reasons, together with a relatively good estimate of the temperature of close to surface steel reinforcements explains why even a simple layer model allows well capturing the response to fire of beam elements and, conversely, why it is less accurate for columns. A future extension of the model that could possibly be a remedy to this may be a material parameter averaging along the layer thickness, instead of a direct temperature averaging.
Applications
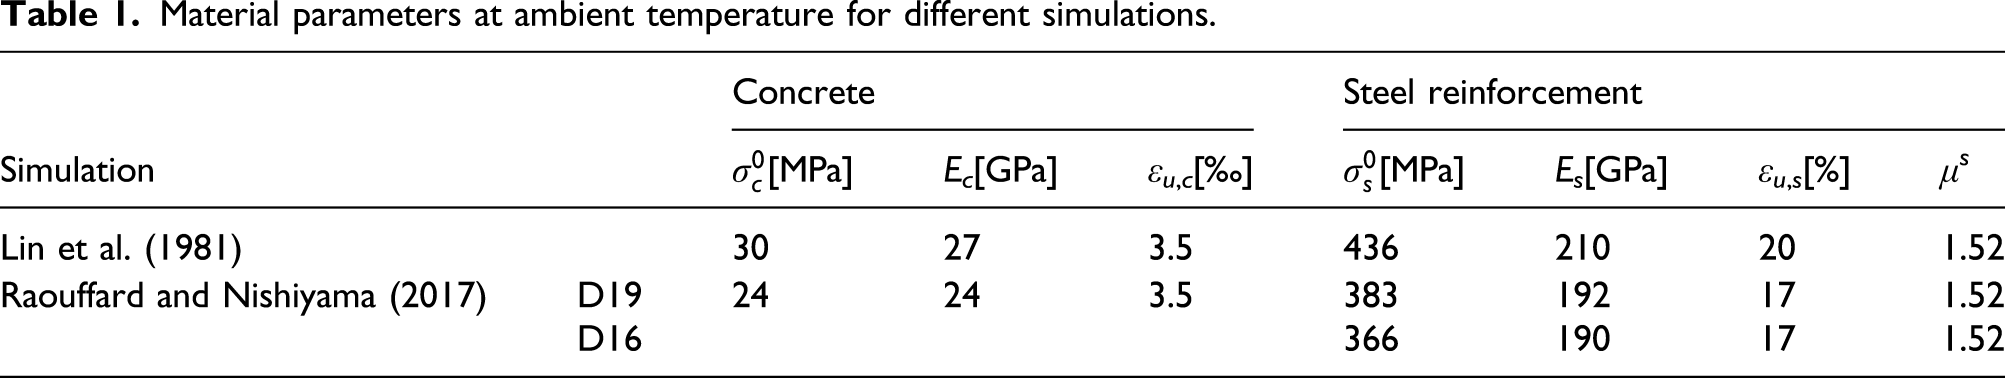
Material parameters at ambient temperature for different simulations.
Lin et al. beam test
A simply supported beam made of carbonate aggregate (called beam B-124 in Lin et al. (1981)) heated at three faces by standard fire ASTM E119 (ASTM, 2008) is considered first. The geometry of the beam discretized into 34 FE and its cross-sectional details, as well as the applied loads and boundary conditions are depicted in Figure 3. The thickness of the layers that discretize the cross section was taken as a maximum of 5 mm. Geometry, loading, and boundary conditions of studied single beam. The bottom left reinforcement in red is the point where the internal temperature was measured in the experiment.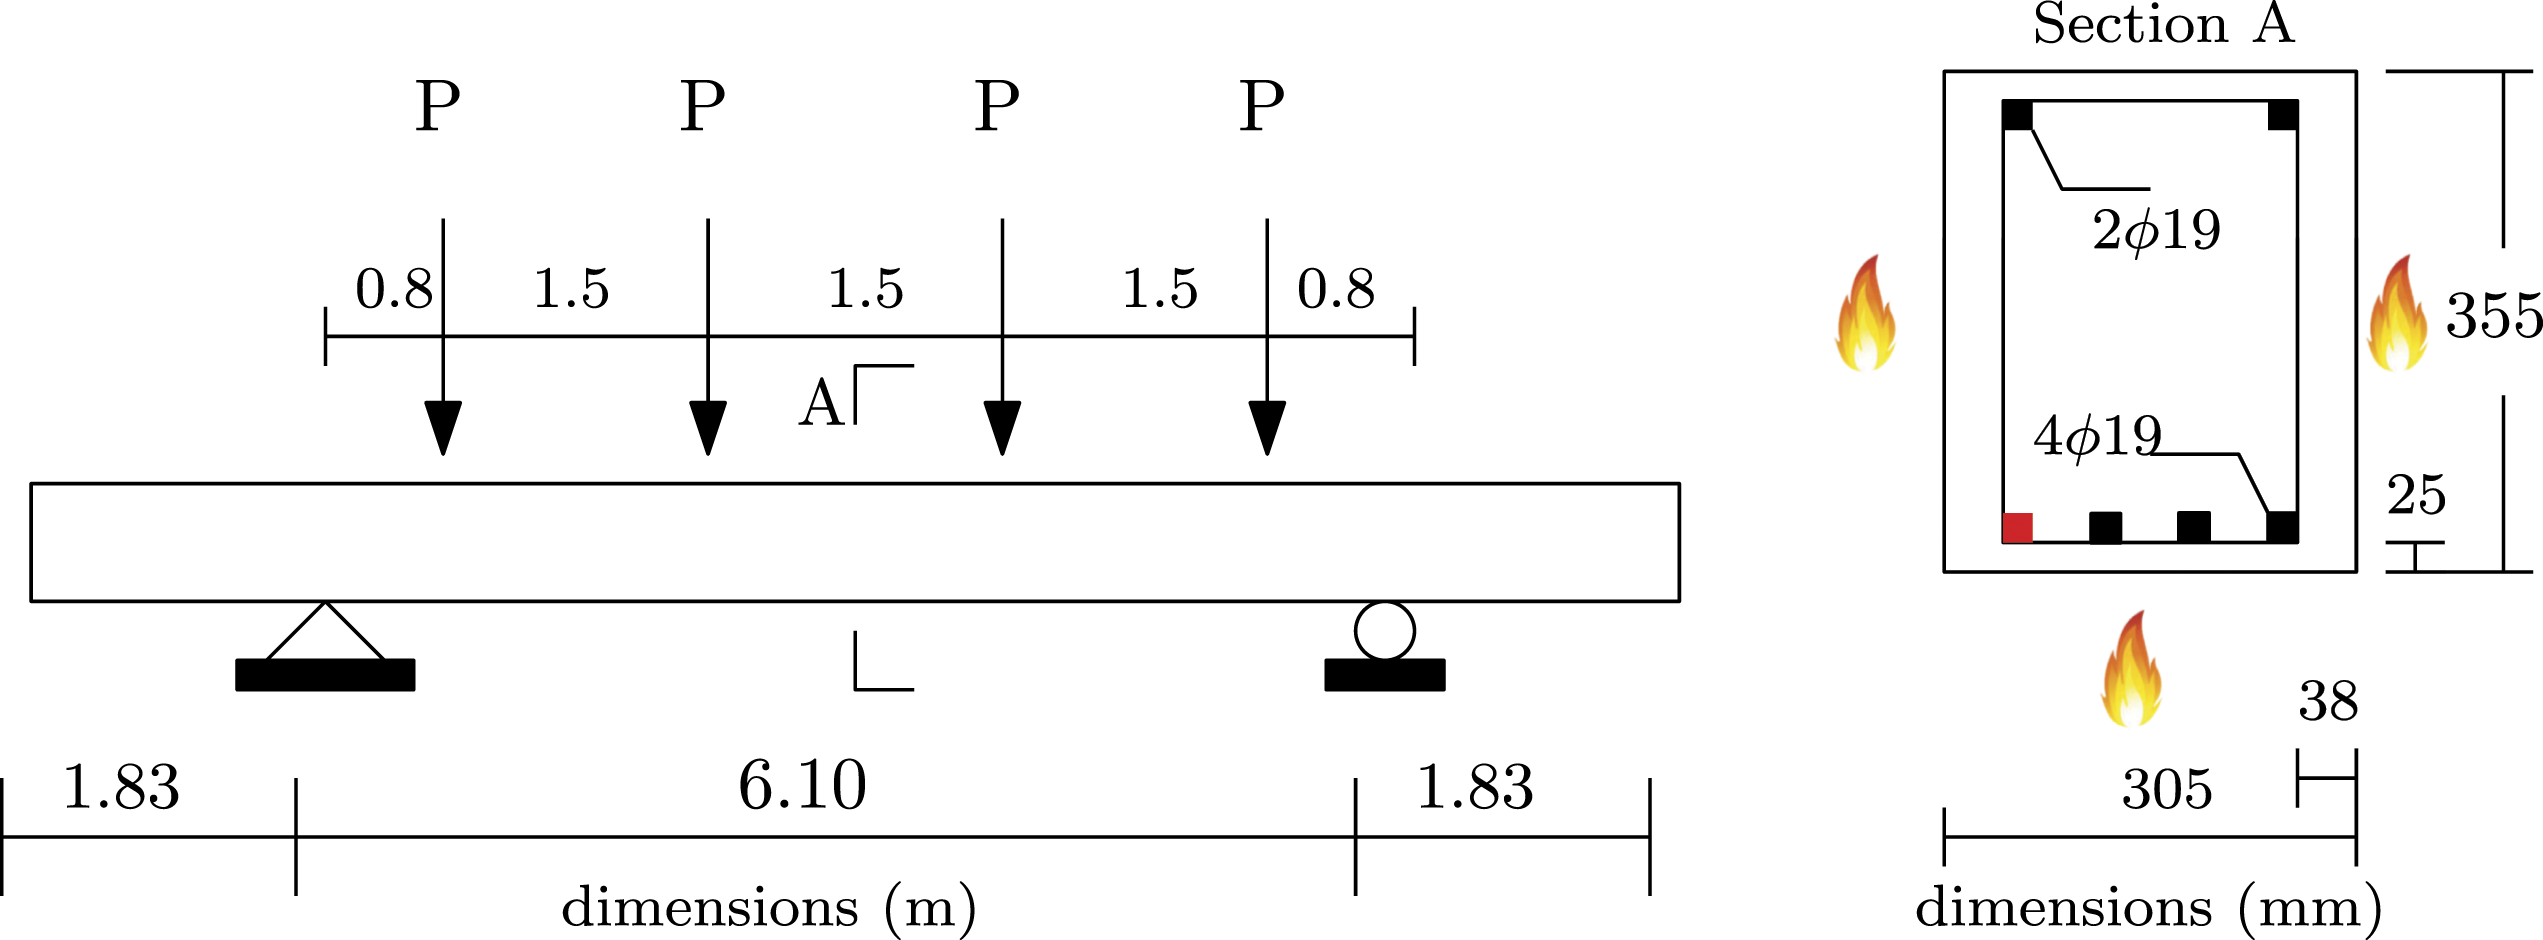
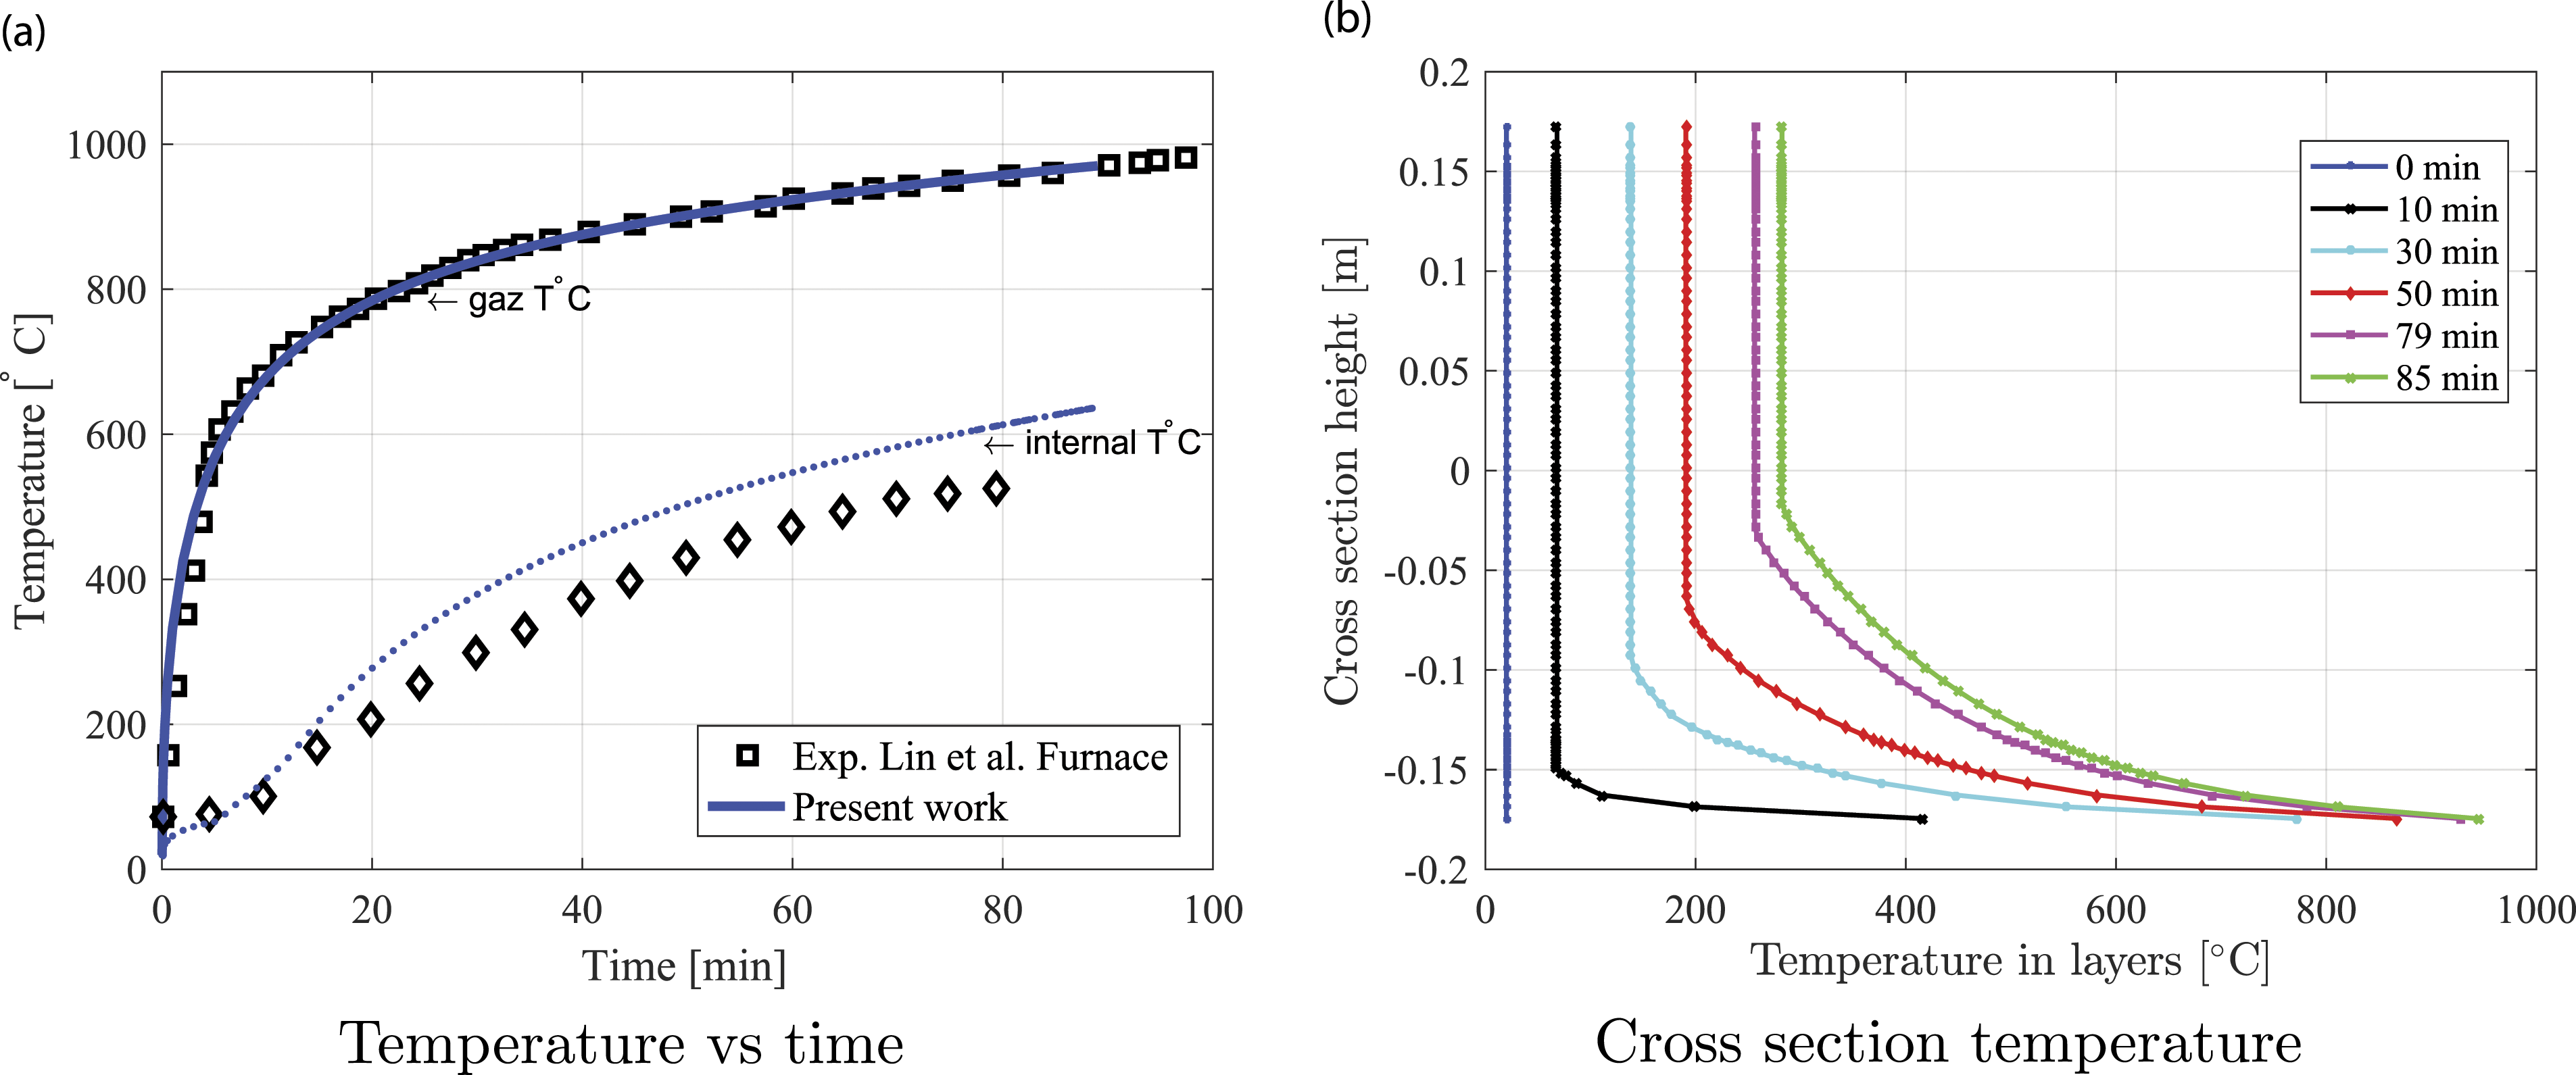
The vertical displacement at mid-span and corner reinforcement temperature evolution at 25 mm from the bottom are depicted together with experimental data in Figures 4 and 5(a), respectively. The FE results agree well with the experiment throughout the entire duration of the fire exposure and structural failure times are very similar (i.e., 80 vs 79 min). Vertical displacement at mid-span versus time for the single beam test. (a) Temperature versus time of the gas and of the bottom left reinforcement shown in red in Figure 3 and (b) cross-section temperature distribution at different times.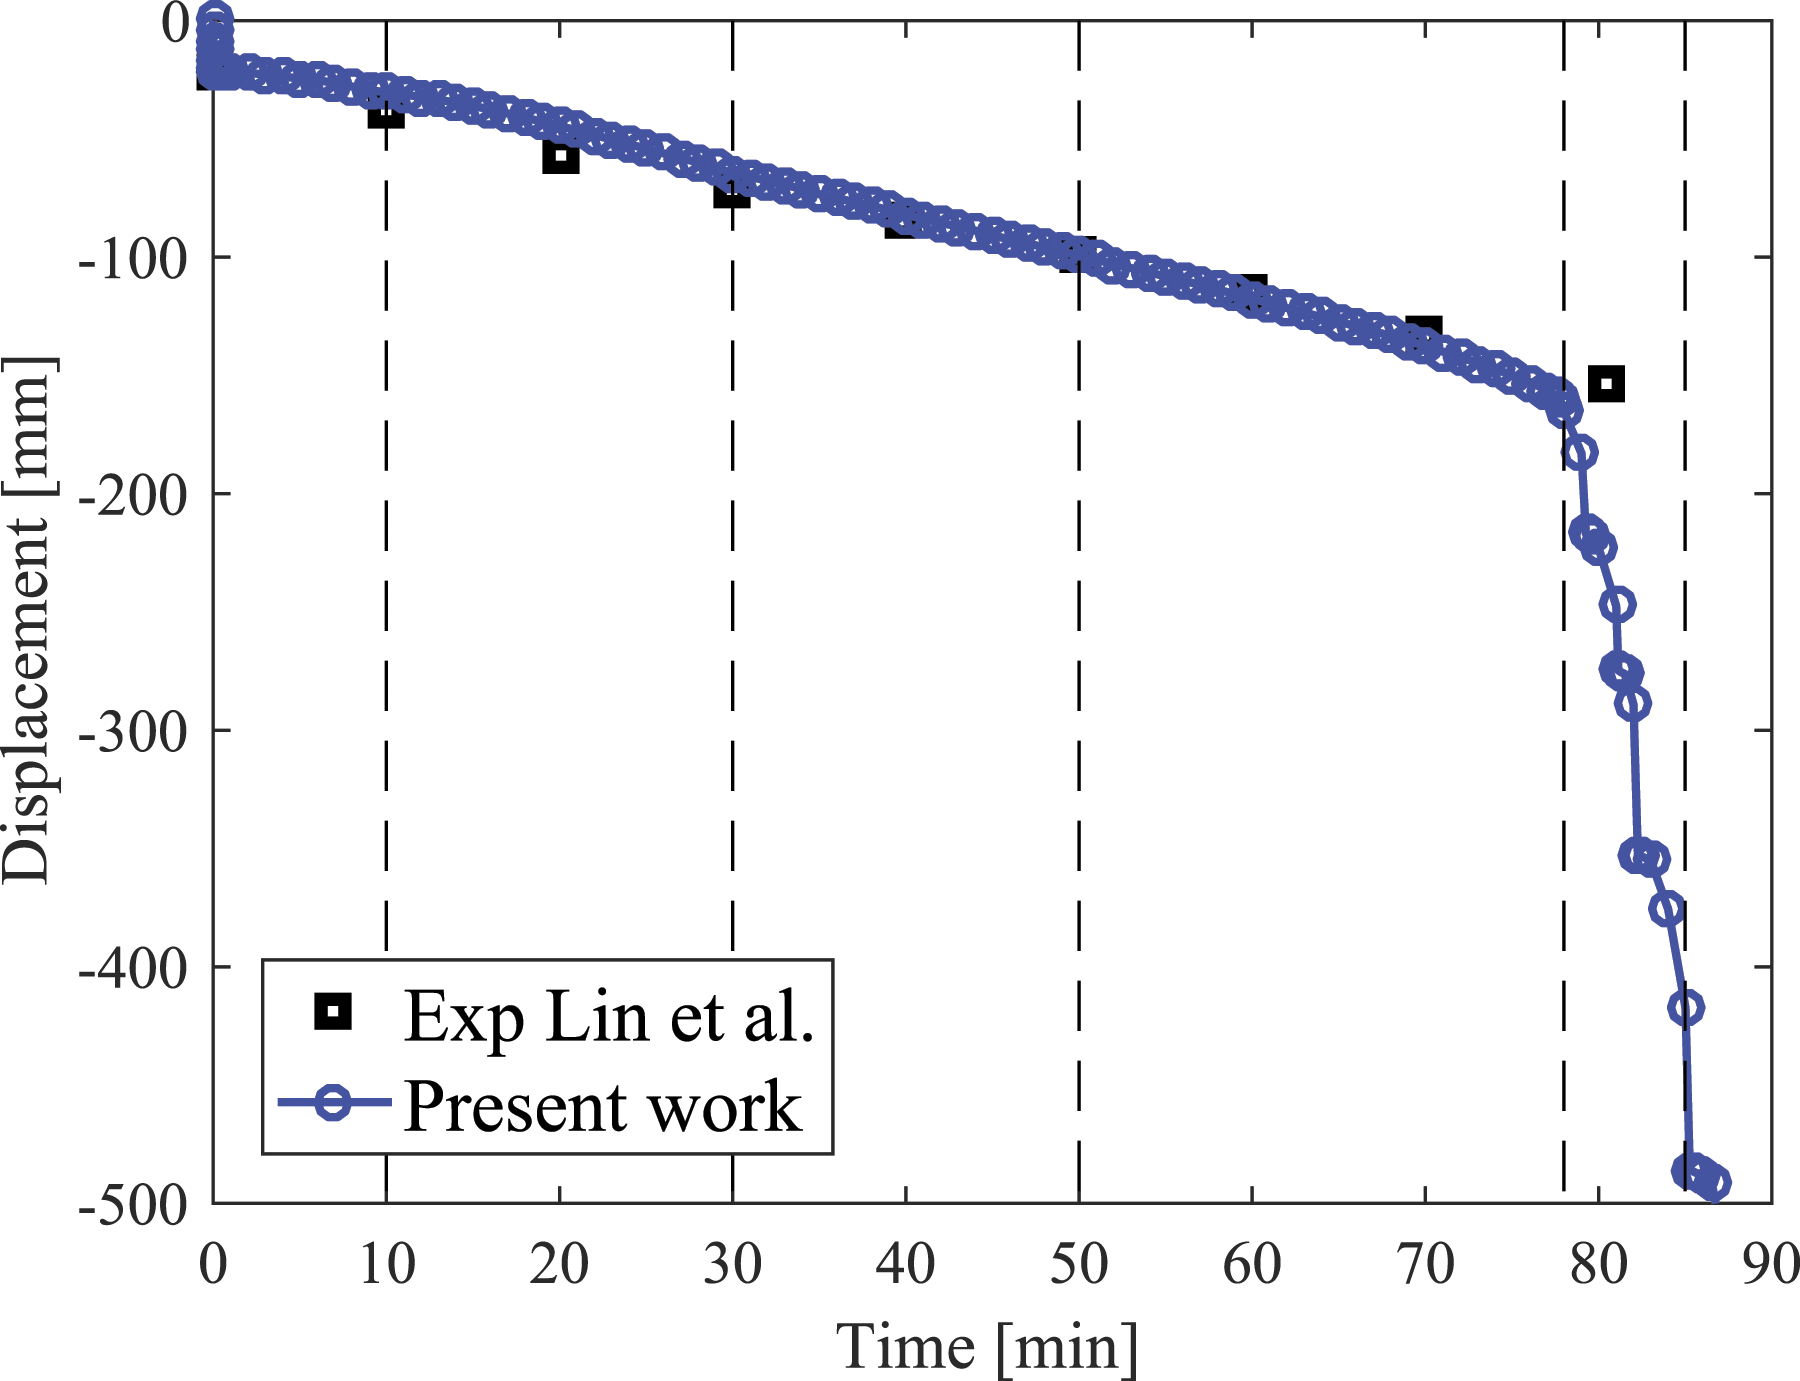
The simulation was run beyond the last experimentally measured point, which was not possible in the experiment due to safety precautions.
The maximum displacement reached in the numerical model before loss of convergence is ≈500 mm, which implies catenary effects were active at this final stage. The vertical displacement at mid-span versus fire exposure time curve has three slope changes. First, from 0 to 8 min the slope is almost constant, characterized by a narrow temperature gradient, limited to a small number of bottom layers (Figure 5(b)) and a typical flexural stress–strain distribution with a small mid-span displacement (≈24 mm). Between 8 and 78 min the tangent is different and close to linear (≈24–170 mm deflection), accompanied by the development of compressive concrete strain in the bottom layers (Figure 7(f)), thermally induced straining (Figures 7(c) and (d)), and mechanical properties degradation (Figure 6) in an increasing fraction of the cross section. A somewhat underestimated vertical displacement is observed between 10 and 30 min of fire exposure, which may be explained by the migration of moisture to the internal part of the beam (Gao et al., 2013) that is not represented computationally. In the third part, above 78 min, the slope of the curve becomes almost vertical, the bottom concrete layers stresses are very low (close to zero), and the bottom steel reinforcement plastic behavior dominates the structural performance and failure.
Despite the simplified thermal model adopted in this study, Figure 5(a) shows a good agreement between the experimental and the averaged rebar layer temperature.
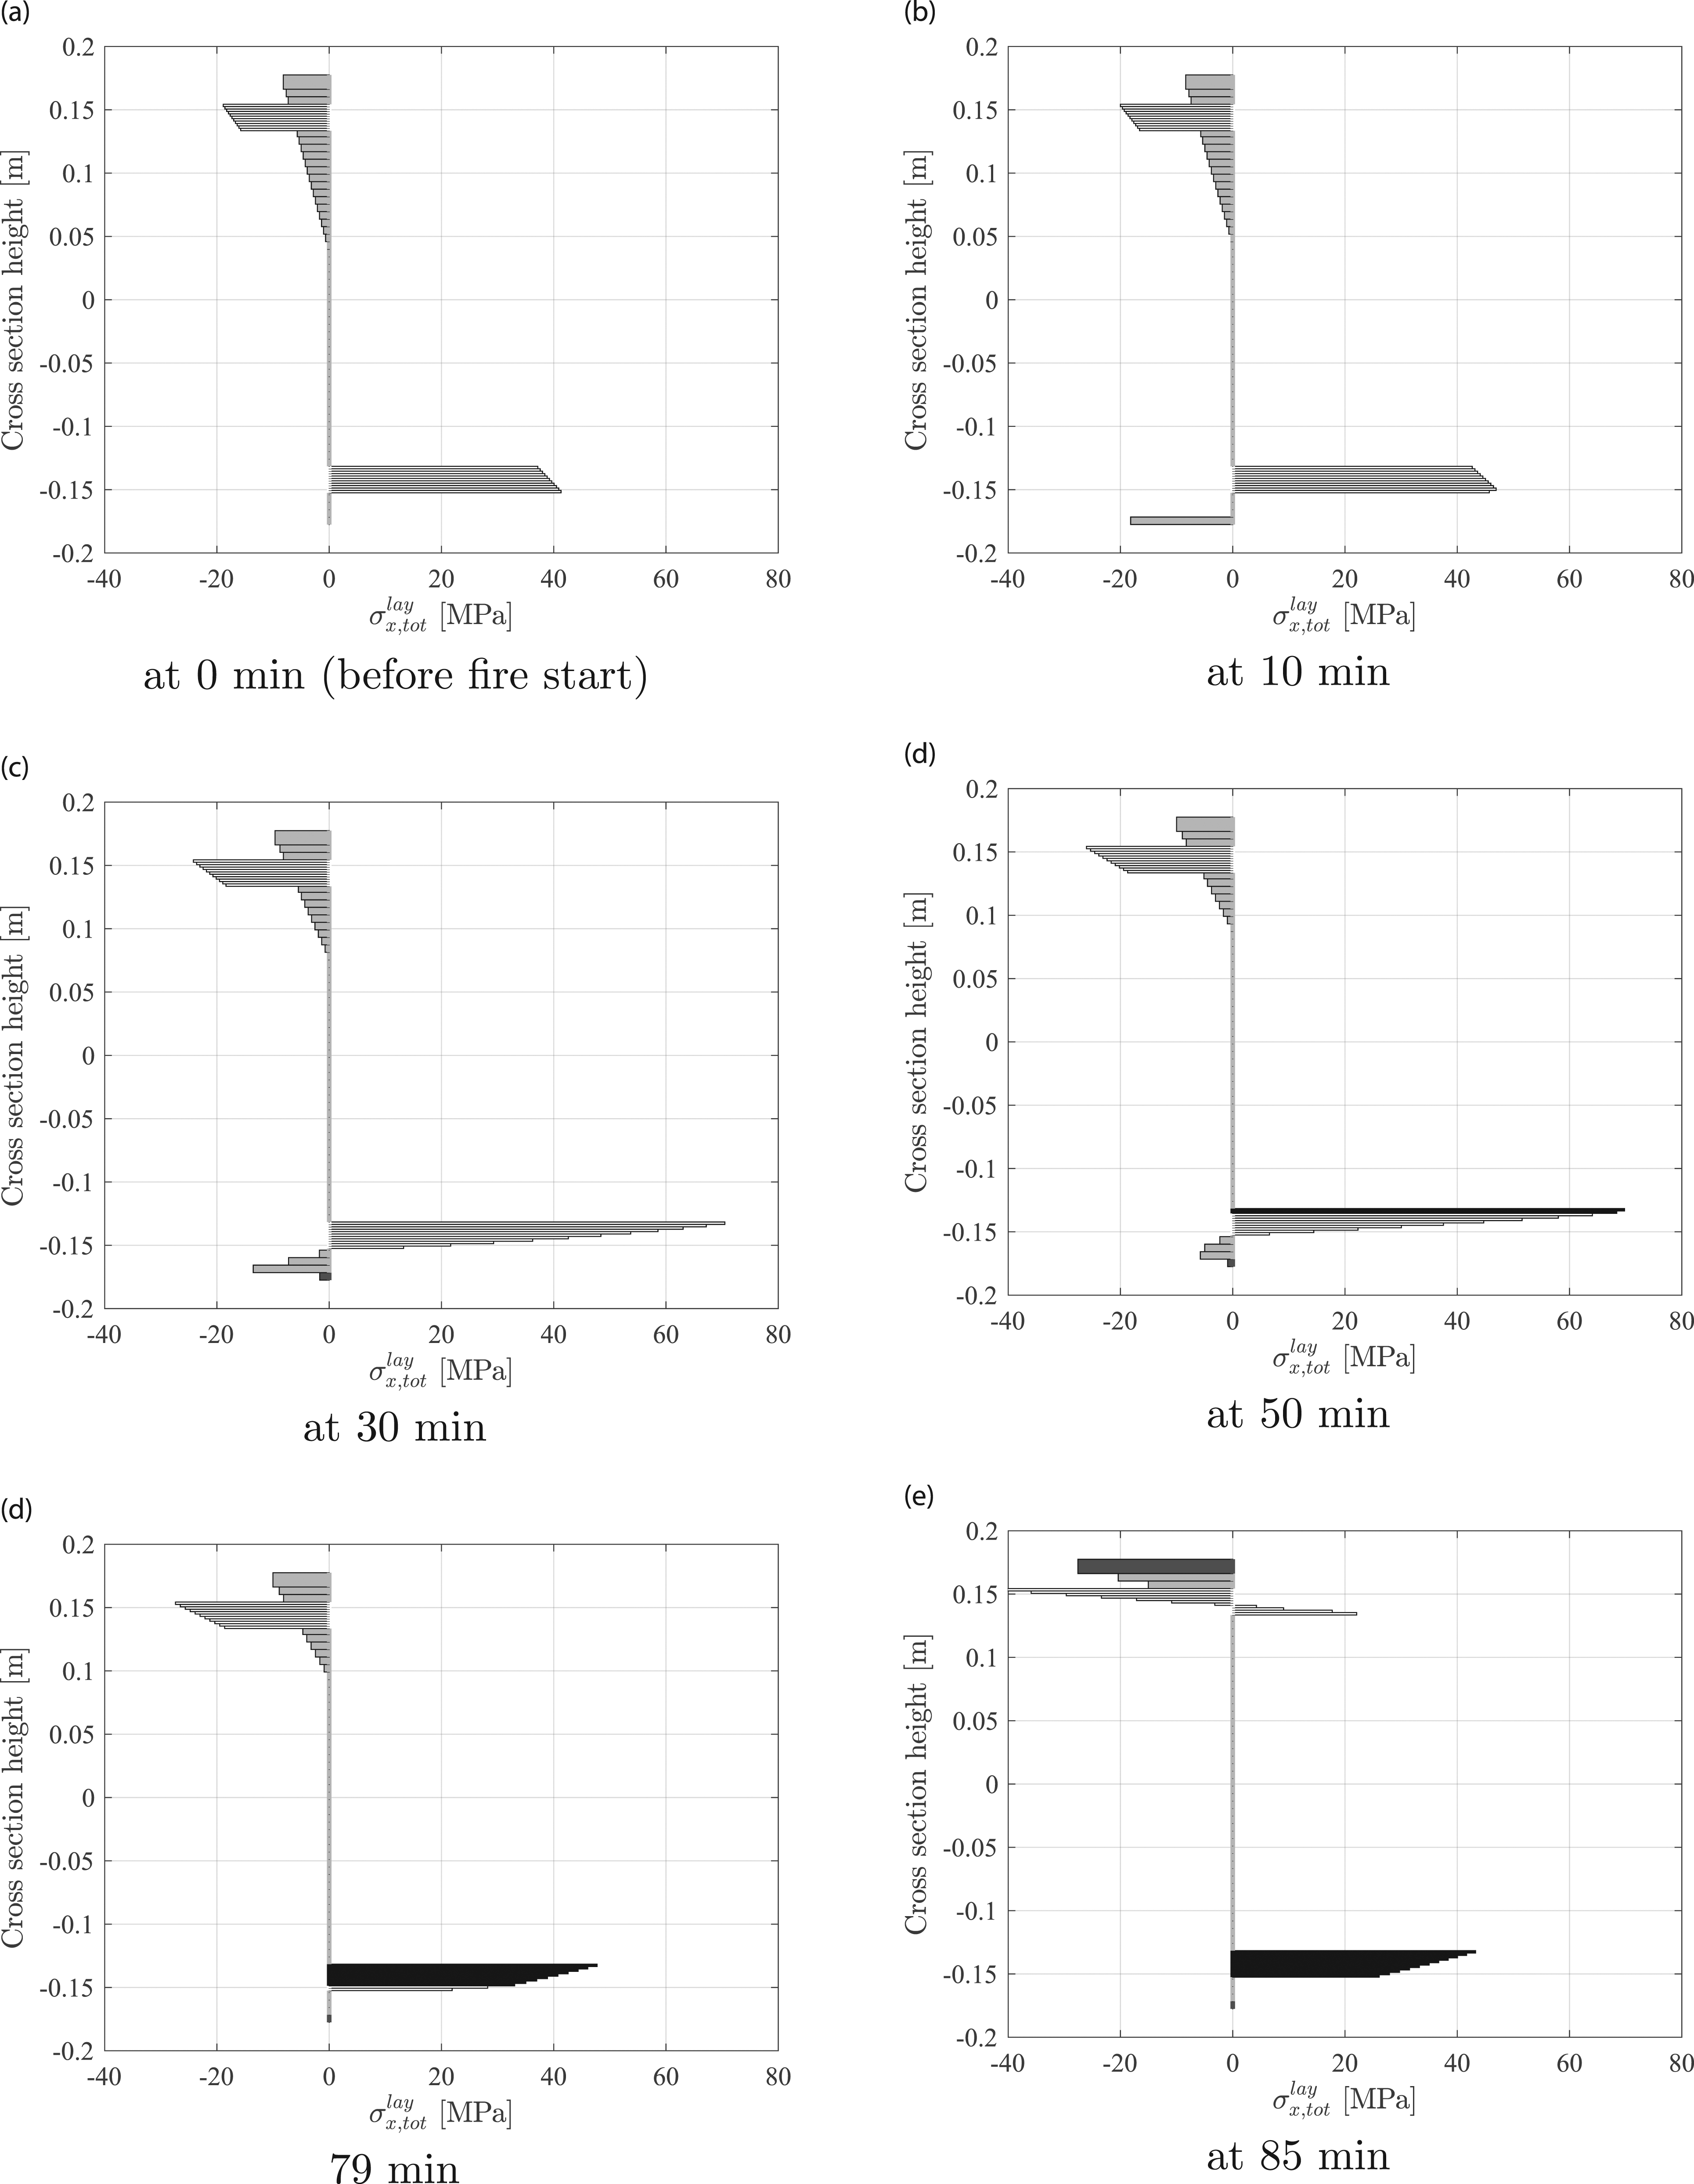
Cross-sectional information at mid-span are shown in Figures 6–8 and are consistent with the material parameters evolution models described in the section Material Parameters Variation as a Function of Temperature and the cross-sectional temperature distribution in Figure 5(b). Concrete and steel material parameters relative variation as a function of temperature along the height of cross section A (Figure 3) at different times. Deformed shape and thermally induced and mechanical strain distribution at cross section A (Figure 3) at different times. Total axial stress evolution in cross section A (Figure 3) at different times with elastic and plastic concrete layers shown in light and dark gray; elastic and plastic rebars shown in white and black, respectively. Please refer to the online version for color figures.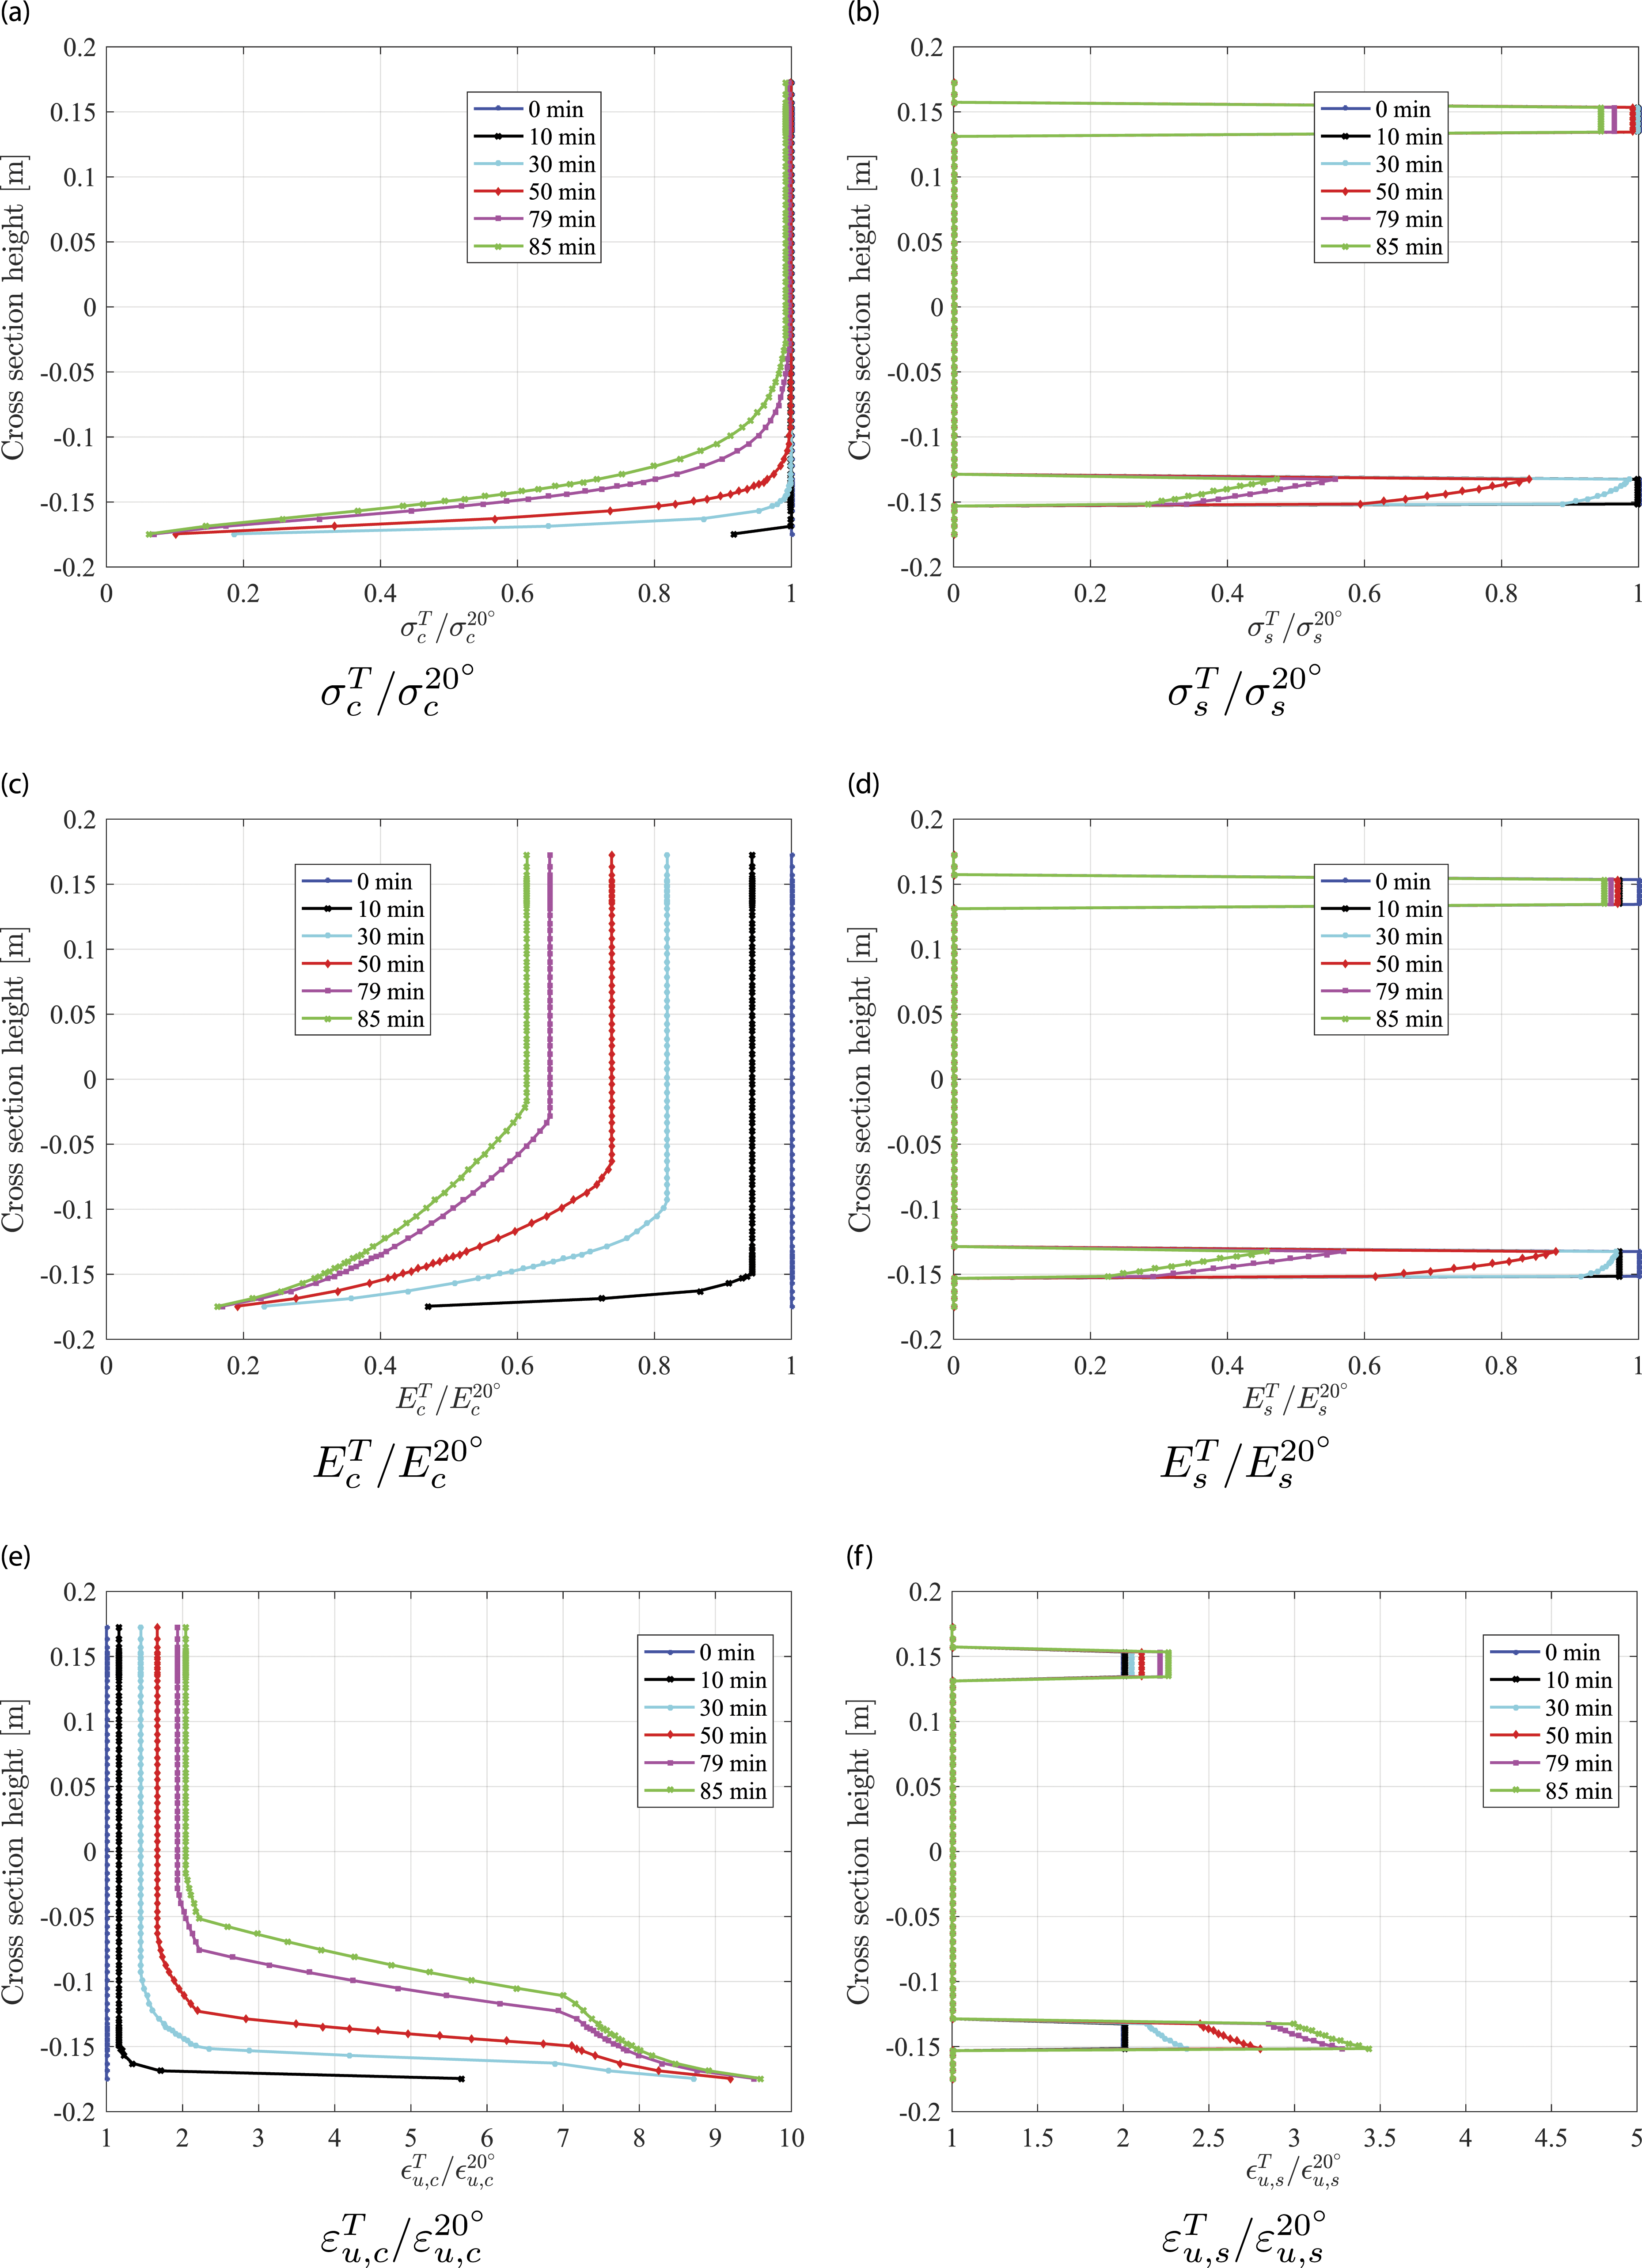
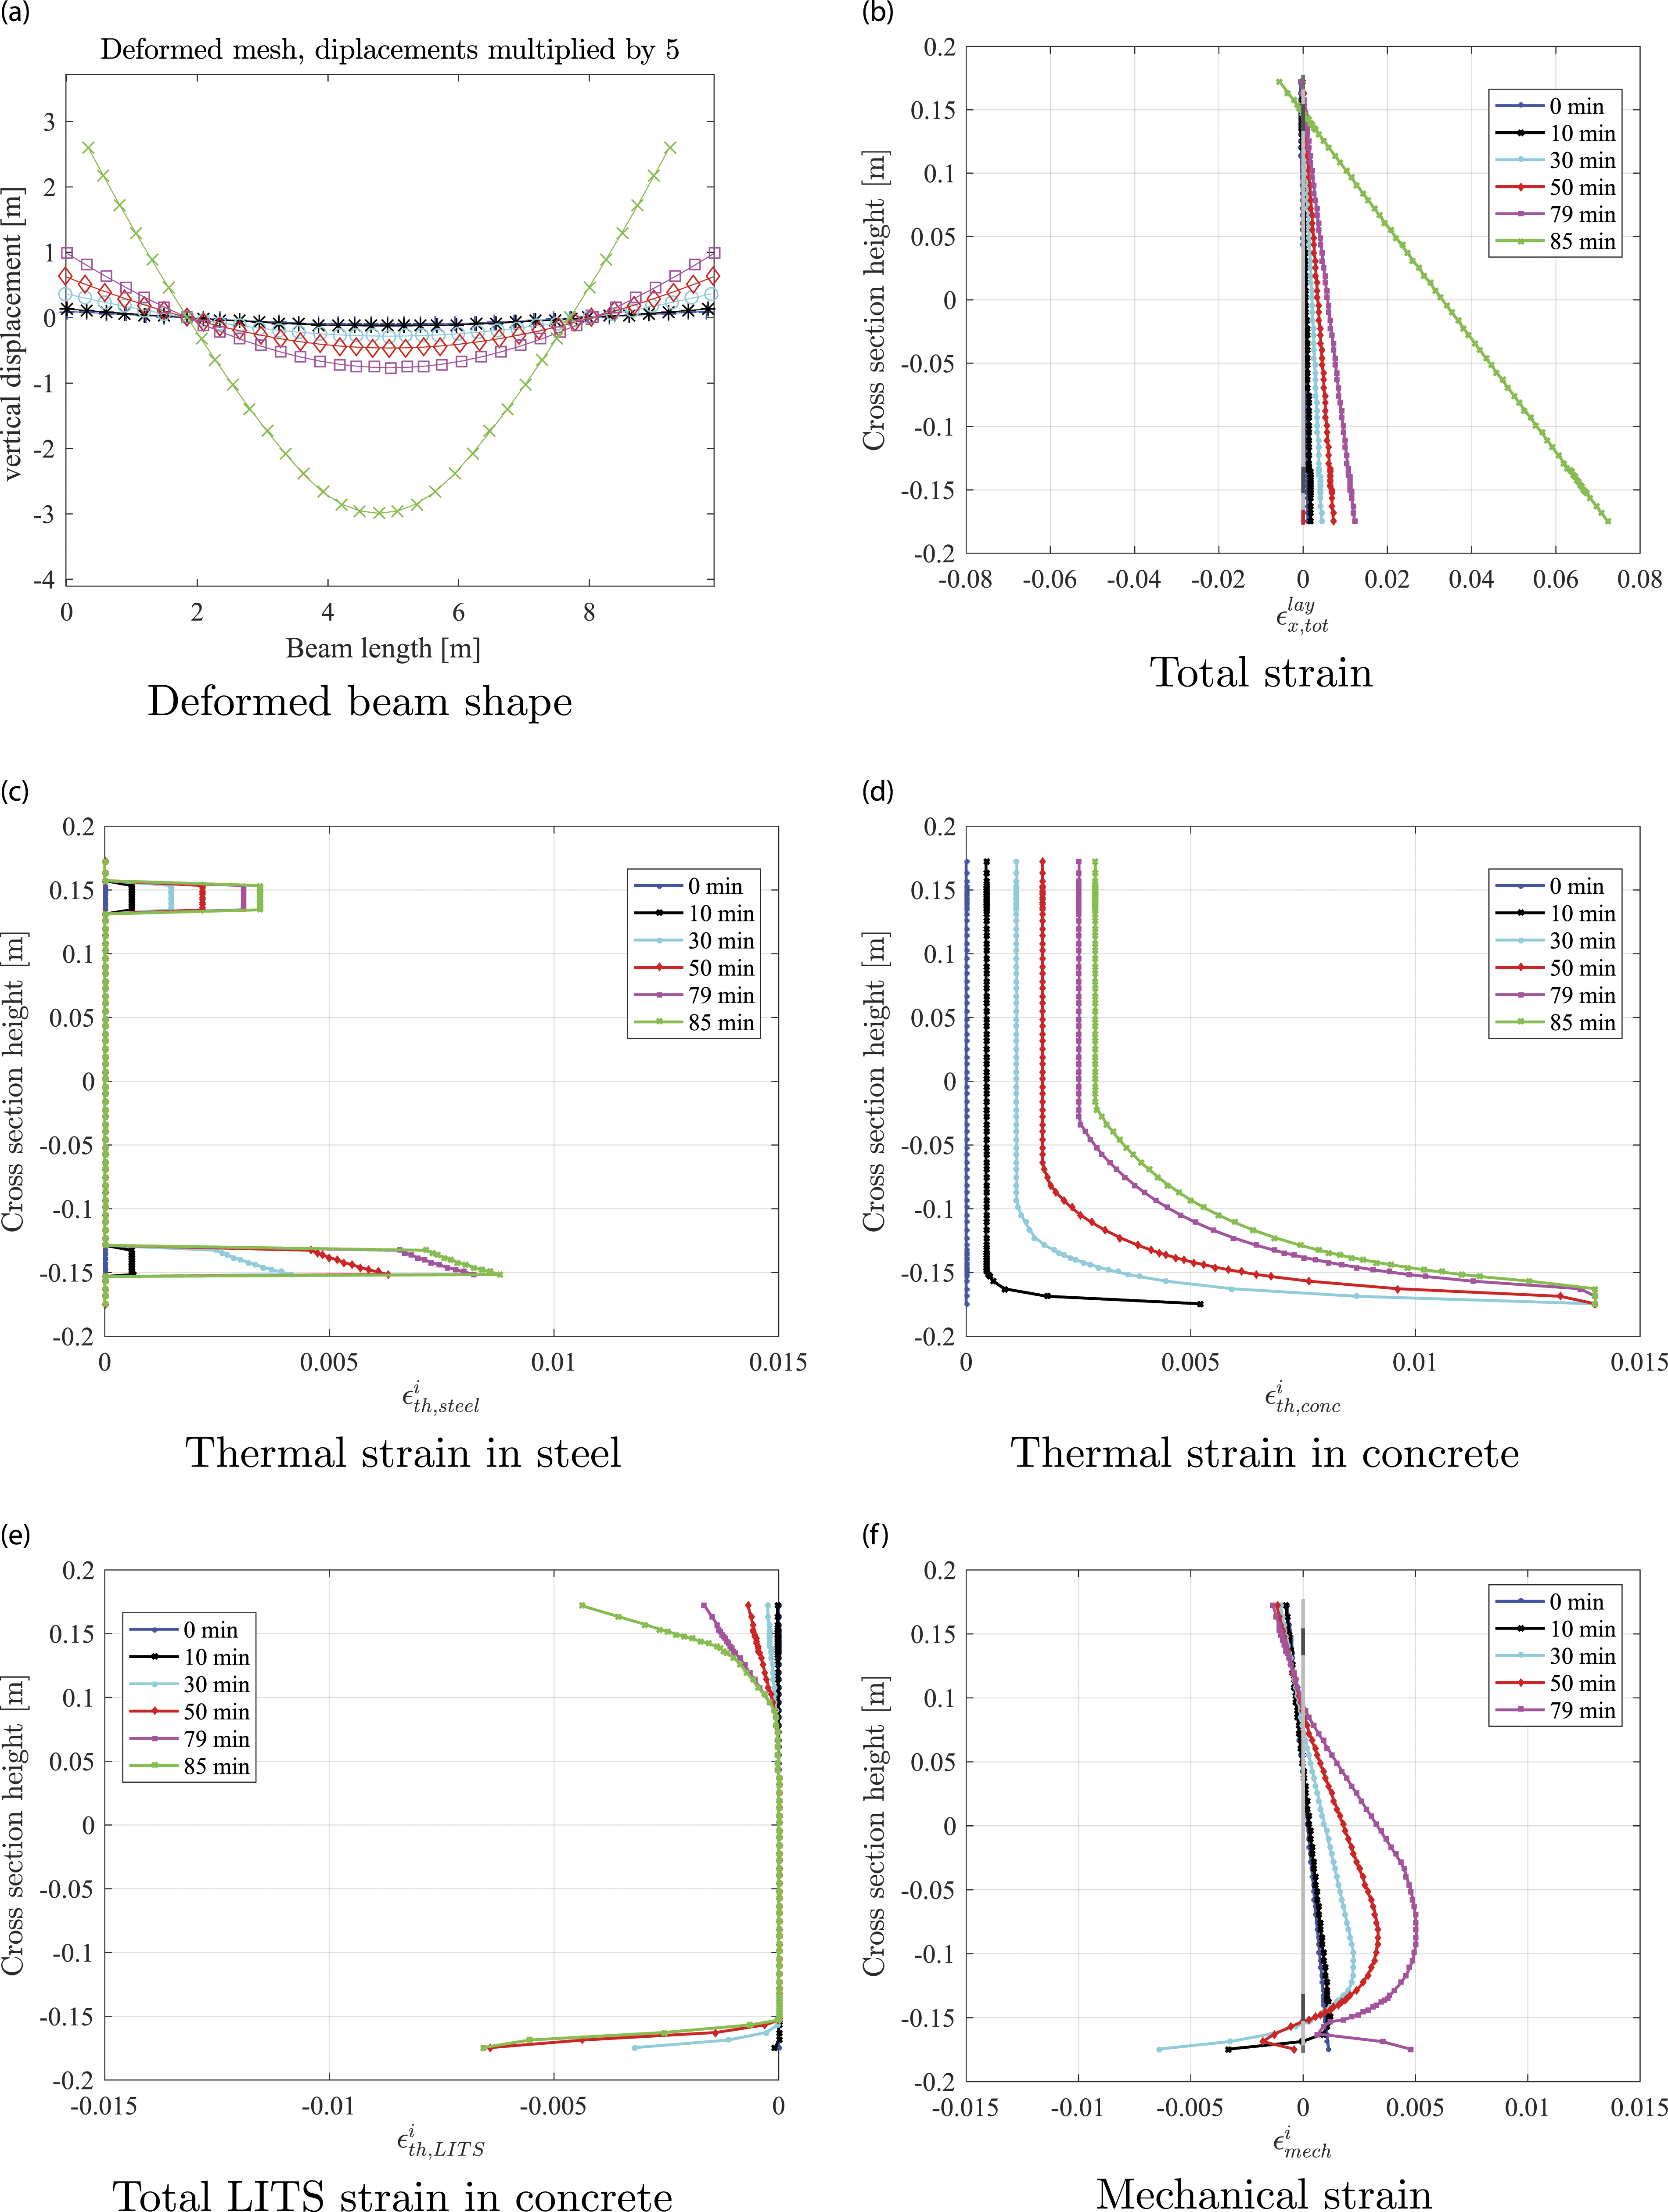
The temperature globally increases with time and its distribution in Figure 5(b) can be divided into two parts: (i) a top zone with a close to uniform temperature and (ii) a bottom part with a temperature gradient. With time, the top zone shrinks in the cross section with an increasing constant temperature (and nearly constant material parameters and fire induced strains), while the bottom zone and the induced bottom temperature gradient grow. At 79 min, the temperature gradient in the cross section is the highest with ≈900°C in the bottom surface layer while the constant temperature zone is at ≈ 250°C with the bottom zone spread along more than 1/3 of the cross-section height, inducing substantial material parameters change. It should be noted that from 0 to 79 min the bottom layers have been subjected to a temperature increase of up to 880°C whereas the top zone underwent only +230°C. This leads to a more advanced degradation of material properties in the bottom zone (Figure 6) and results in structural a failure governed by material degradation here, as observed in the experiments.
Concrete strength degradation (Figure 6(a)) shows a large local drop already from 0 to 10 min in the bottom zone (
An observed significant increase in ɛu,c has to be emphasized; more than fivefold in the first 10 min (Figure 6(e)) in the bottom layer (
During the fire, the stress in the bottom steel reinforcement (i.e., in tension) first increased, followed by progressive mechanical properties degradation (Figure 8). The steel yield strength, elastic modulus, and ultimate strain were more impacted (in a similar fashion to the concrete), in the bottom zone Figure 6(b), (d) and (f). The steel yield strength (σ
s
) and elastic modulus (E
s
) vary practically in the same way in the bottom rebars (
During fire exposure, the beam curvature and length continuously increased, correlated to the total strain distribution in Figure 7(b). In the following, the different strain components of the total strain are investigated, with a special attention to the mechanical strain that governs the stresses and hence the structural behavior. The thermally induced strains in the bottom rebars exhibit a rapid increase in Figure 7(c) (
Load induced thermal strains change in a different way, according also to the concrete stress level in the layers (i.e.,
The mechanical strain is derived from the strains above through equation (3) and is tensile or compressive, depending on the location in the cross section. It is recalled that due to the zero tensile strength assumption in concrete, only compressive strains can induce stress in concrete. Before the fire start, the mechanical strain is equal to the total strain (Figure 7(f)). However, when the thermally induced strains (
From 30 to 79 min,
The cross-section stress distribution, as expected, follows a typical distribution for flexion before fire start. Only slight changes in concrete and steel stresses are observed in the top zone, large variations are limited to the bottom layers, which is in line with previous observations. In the first 30 min, a compressive stress in the bottom concrete layers appears. These concrete layers yield at around 11 min due to increasing compressive stress; subsequently, stresses here tend toward zero for the reasons explained above. The bottom tensile steel reinforcements at the mid-span cross section yielded at around 41 min and the stress continued to decrease subsequently due to the temperature riseinduced material degradation. This results in a bottom rebar strength-dominated failure of the structure (Figure 8(f)).
Reinforced concrete frame subjected to fire
The simulation of a one-third scale RC frame made of siliceous aggregate, tested under ISO 834 (International Organization for Standardization, 1999) standard fire by Raouffard and Nishiyama (2017) is presented in the following (geometrical and loading details are depicted in Figure 9). The two cantilever beams of the test assembly are referred to as downward loaded (DL) and upward loaded (UL) beams. The layer thickness in the FE model was taken maximum equal to 3 mm and the frame was subdivided in 24 beams FE. The experiment terminated at 74 min when the bottom tensile reinforcements of the UL cantilever beam exceeded the prescribed maximal temperature of 530°C (Raouffard and Nishiyama 2017). The computation time of the frame example was only 9 min on a laptop with 2.3 GHz Intel Core TM i7-3610 QM processor and 6 GB of memory with the code implemented in a slow, high-level MatLab language (leaving ample space for improvement by recoding the routines in Fortran). Studied beam column sub-assemblage and test setup (Raouffard and Nishiyama 2017).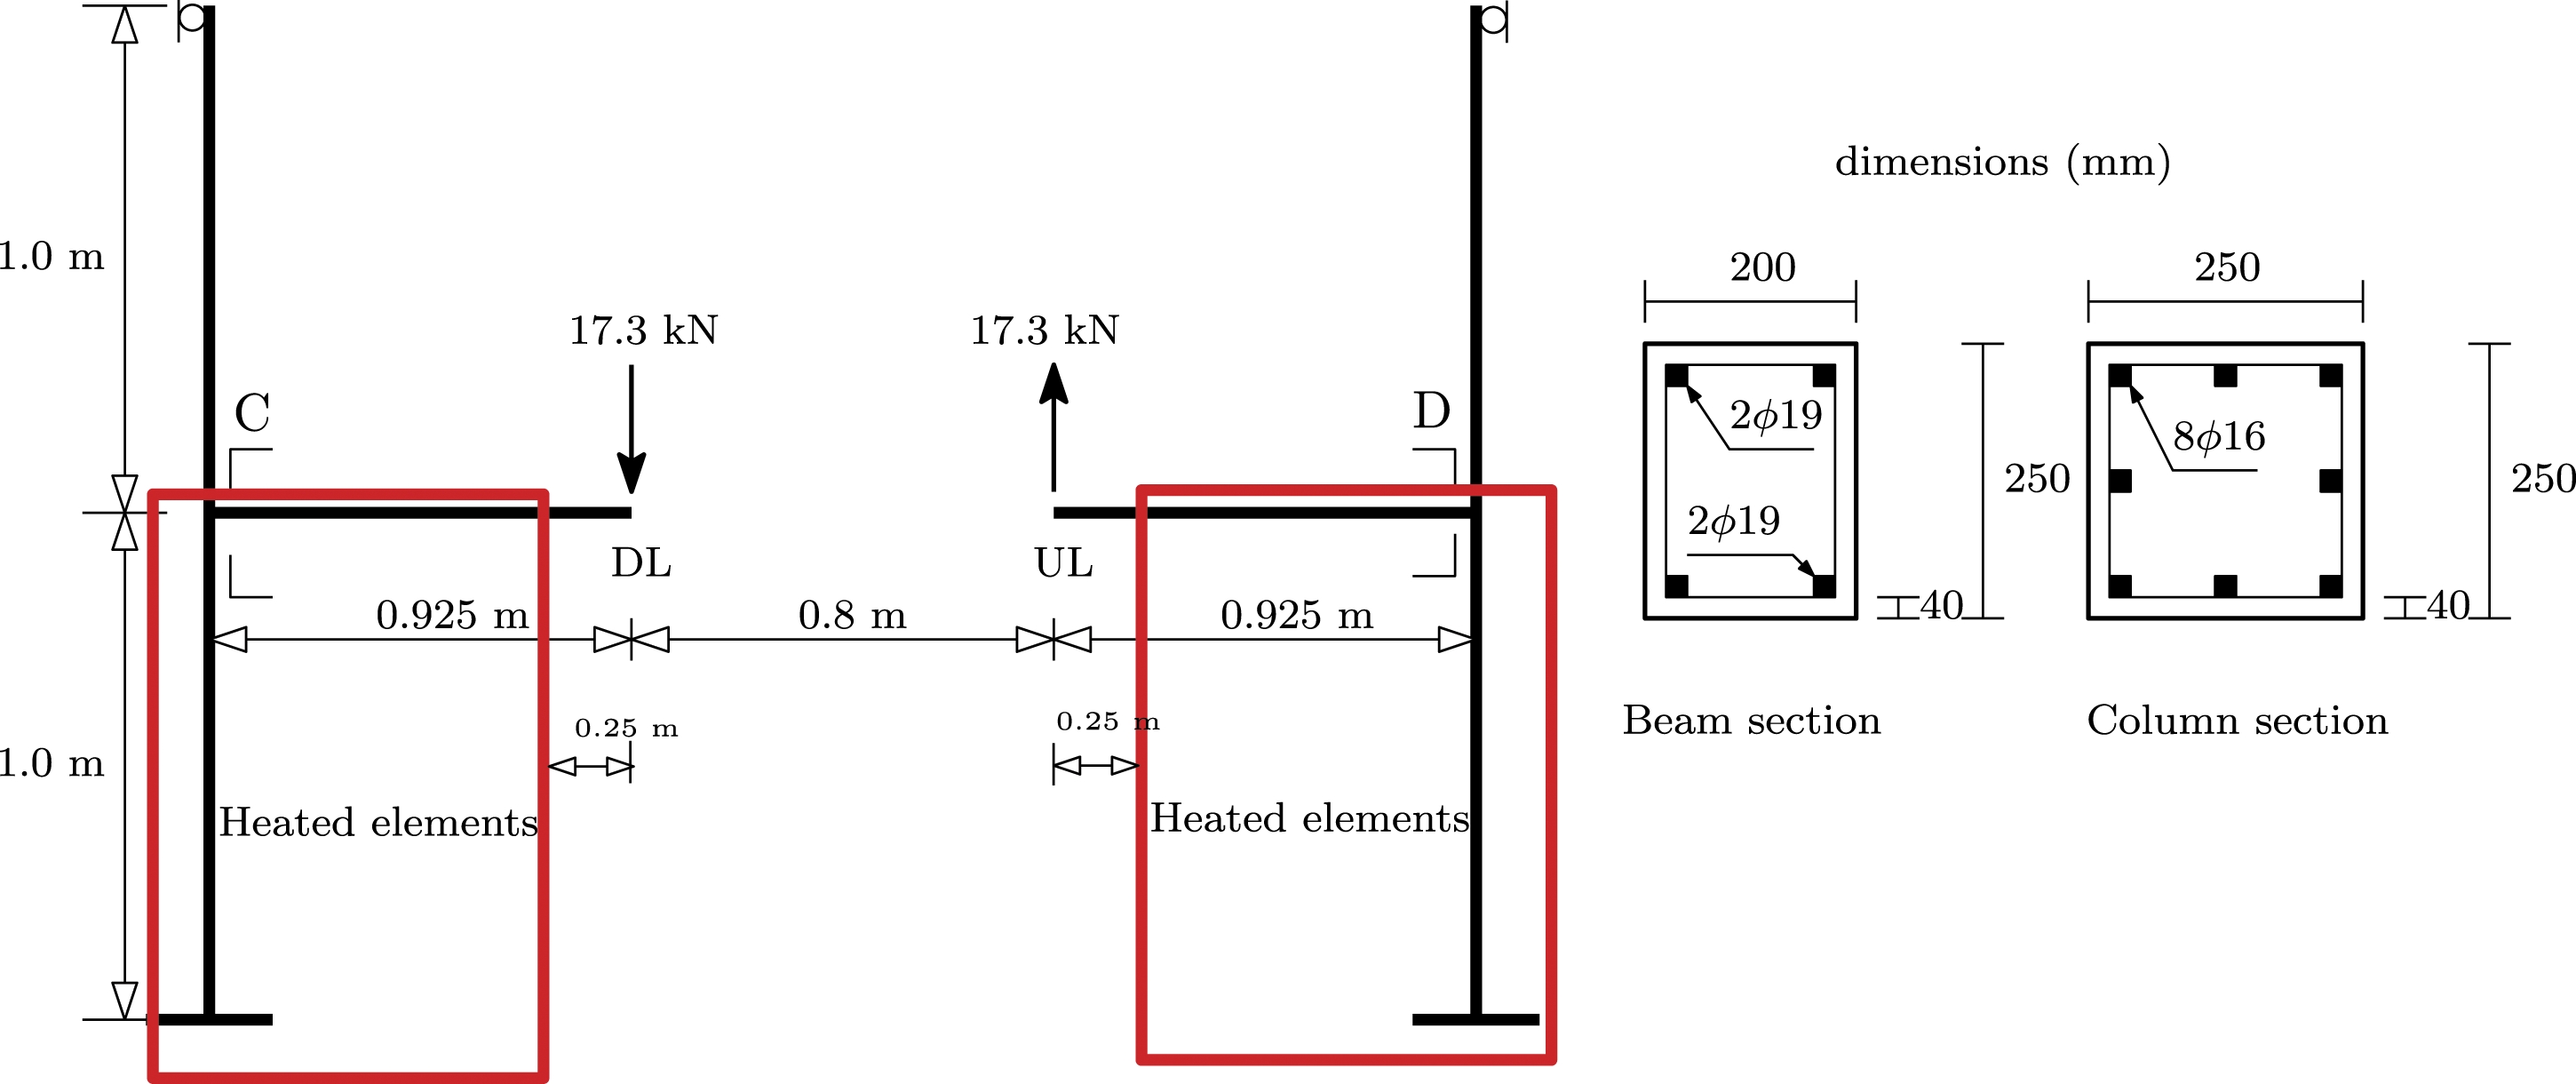
The temperature measured at different heights in the cross section of the beams and the columns in compared to the layered average prediction in Figure 10 shows a relatively good agreement for both member types, especially closer to the outer surface. Temperature versus time in downward/upward loaded beams and the columns at different height in the cross section C and D (Figure 9).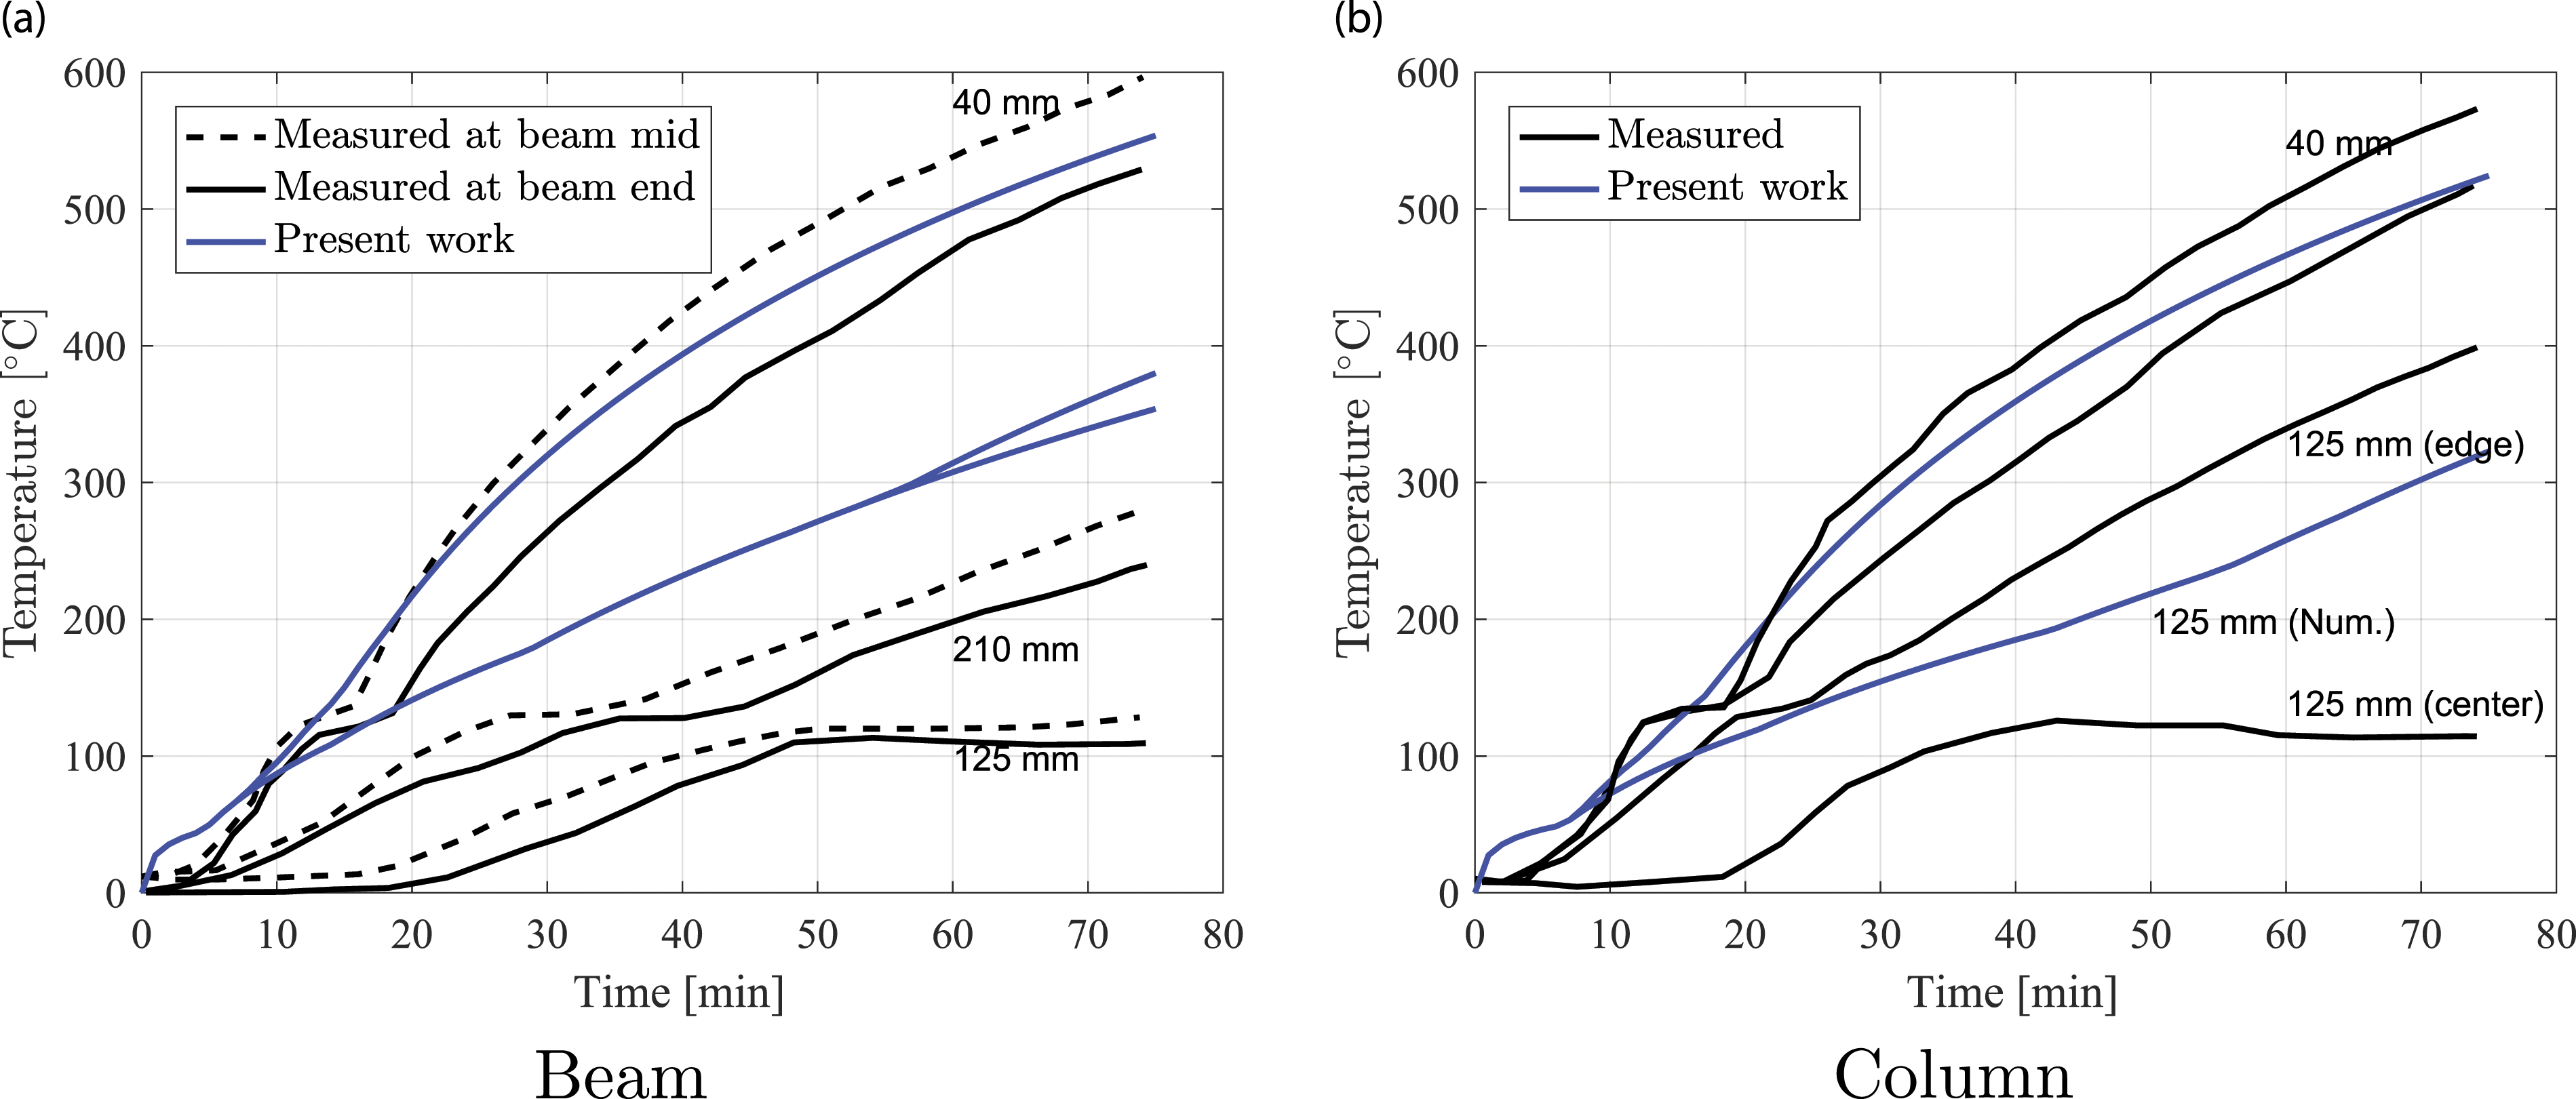
It is noteworthy that the elongation and rotation of the columns at mid-height in the numerical model approximates reasonably the experiment (Raouffard and Nishiyama, 2017). The primary structural data analyzed in this contribution is the relative displacement and rotation of the loaded beam ends, measured with respect to the pre-fire configuration, plotted in Figure 11 as a function of time. Figure 11 shows a satisfactory general experimental-numerical agreement. Oscillations were observed in the experimental data (both in the temperature and in the deflection), which may be linked to the test complexity, but were not captured by the FE model. Relative displacement and rotations versus time of the loaded end of the two cantilever beams with (blue) and without (red) updating the ultimate strains in the model as a function of the temperature. Please refer to the online version for color figures.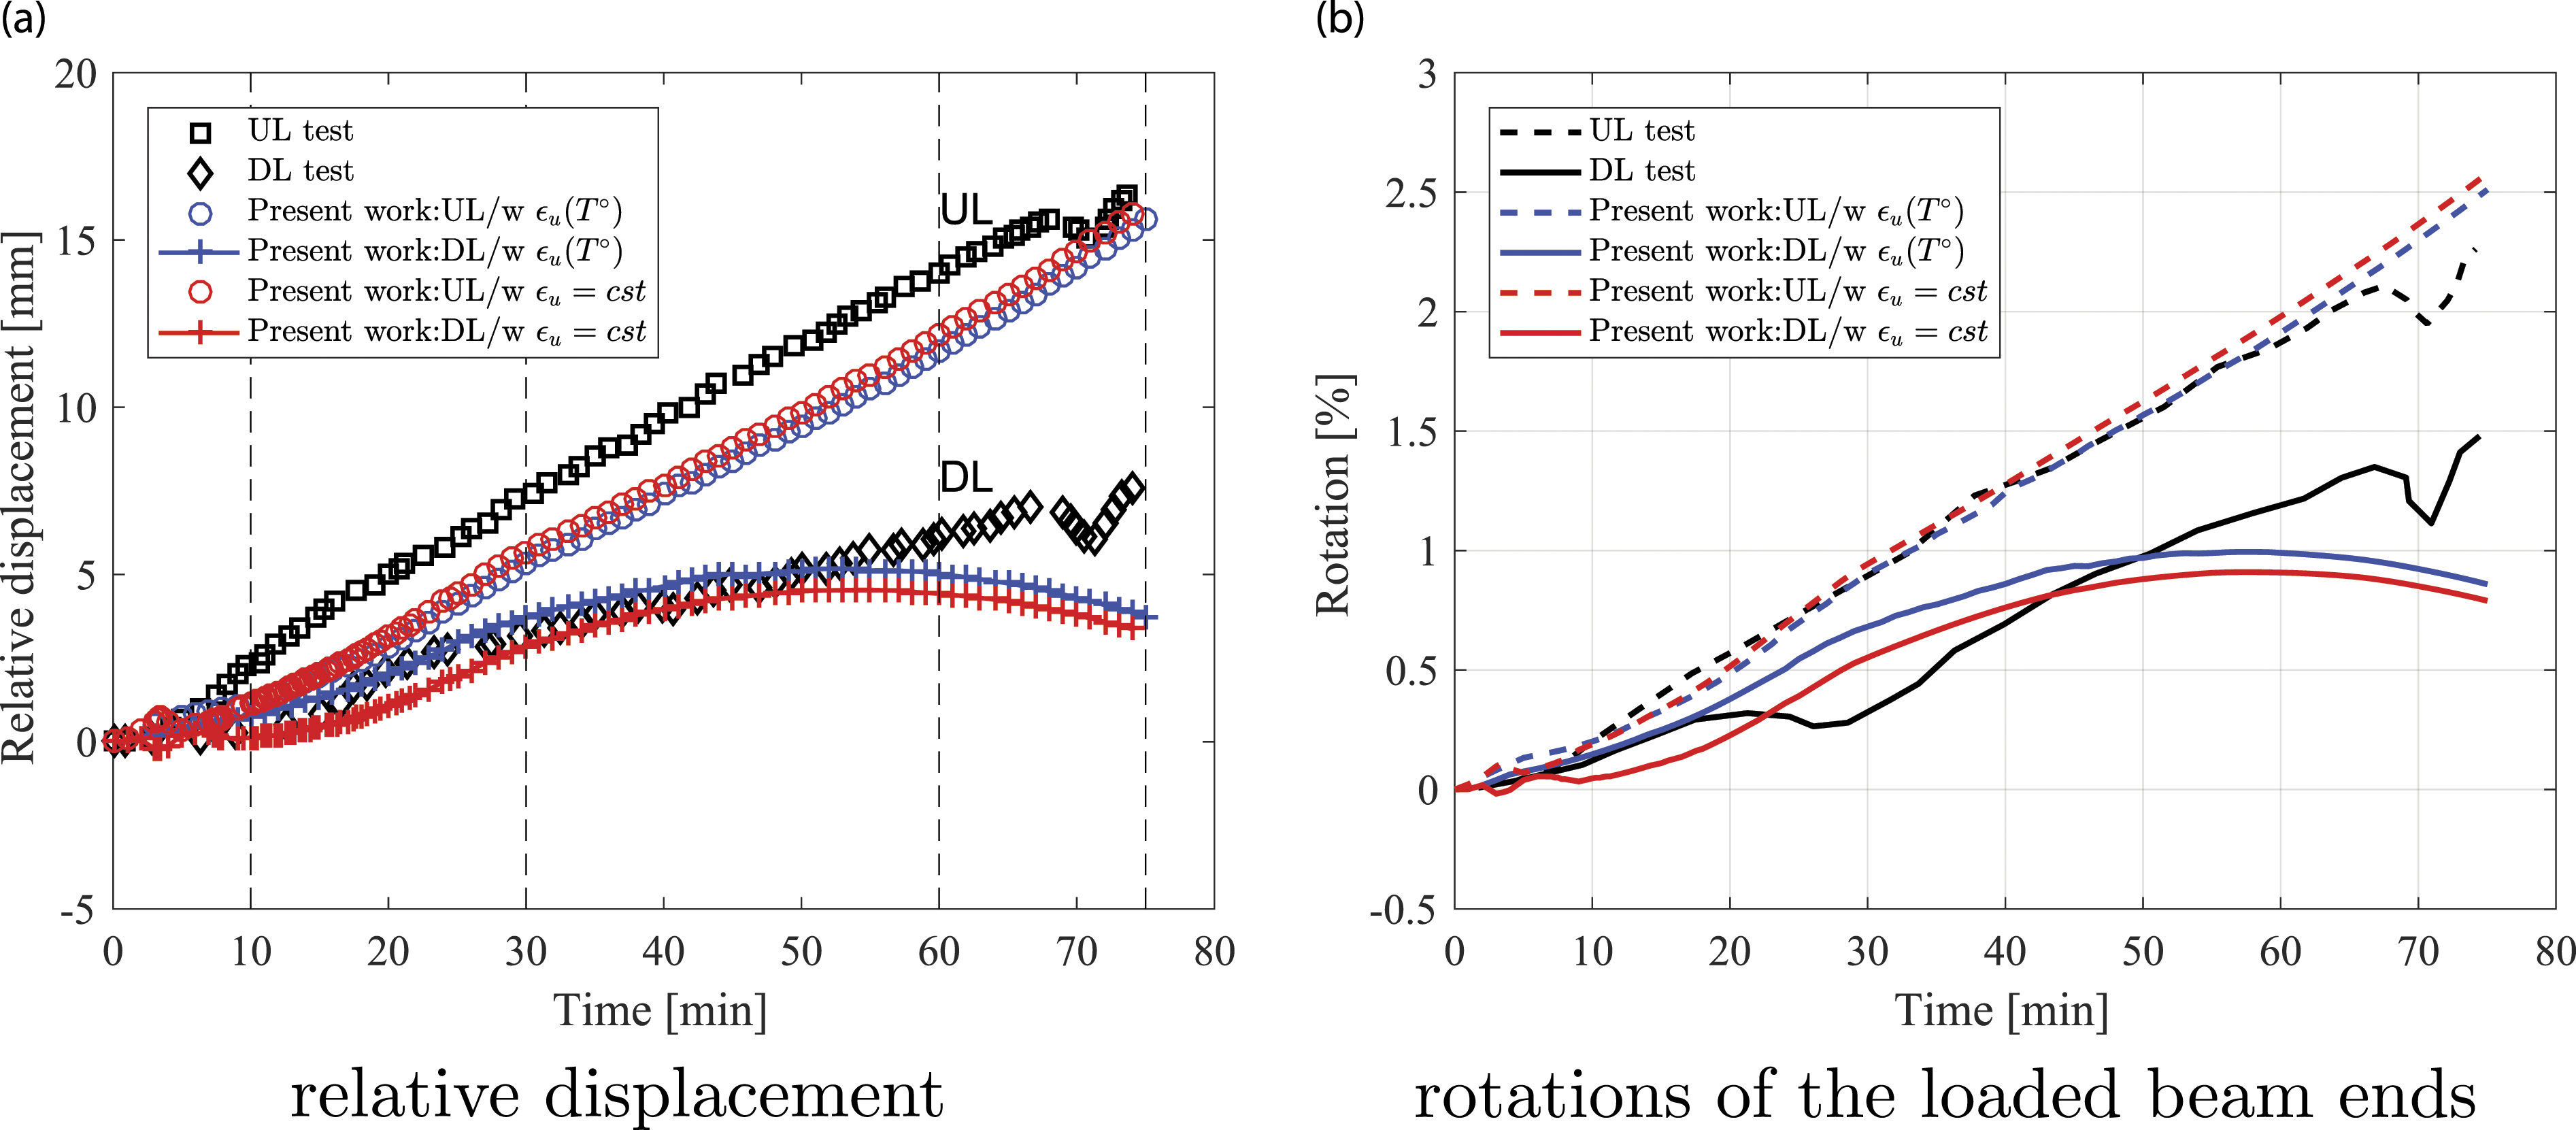
The UL beam relative displacement is positive and together with the rotation is monotonic increasing during heating, since the mechanical load, the material degradation and thermally induced strains due to the thermal gradients in the cross section all promote the same curvature. For the UL beam, the bottom zone is in tension, yielding results of similar nature to the single beam test of the previous section. Because of this and for the sake of brevity, the DL beam is analyzed more in detail in the following. The behavior of the DL beam is more complex because the mechanical loading and the thermally induced effects interact differently. The mechanical load promotes a downward deflection of the loaded end (bottom zone in compression), while the internal forces generated by the thermally induced strains tend to lift this free end. This explains that at the fire start the DL beam end moves upwards and that the beam end rotation increases. At around 50 min, the loaded end relative displacement and rotation reach a peak and from this point on decrease, as a result of dominant material degradation in this phase.
The beams cross-section temperature (Figure 12(a)) reaches approximatively 950°C, as in the case of the Lin et al. (1981) test and exhibit material properties and thermal strain variations of similar nature. The bottom zone with a large temperature gradient extends to more than half of the cross section in this model due to the different cross-sectional geometry and because of using a thermally more conductive aggregate. Cross-section temperature evolution with thermally induced and mechanical strain distribution at cross section C (Figure 9) at different times for the downward loaded beam.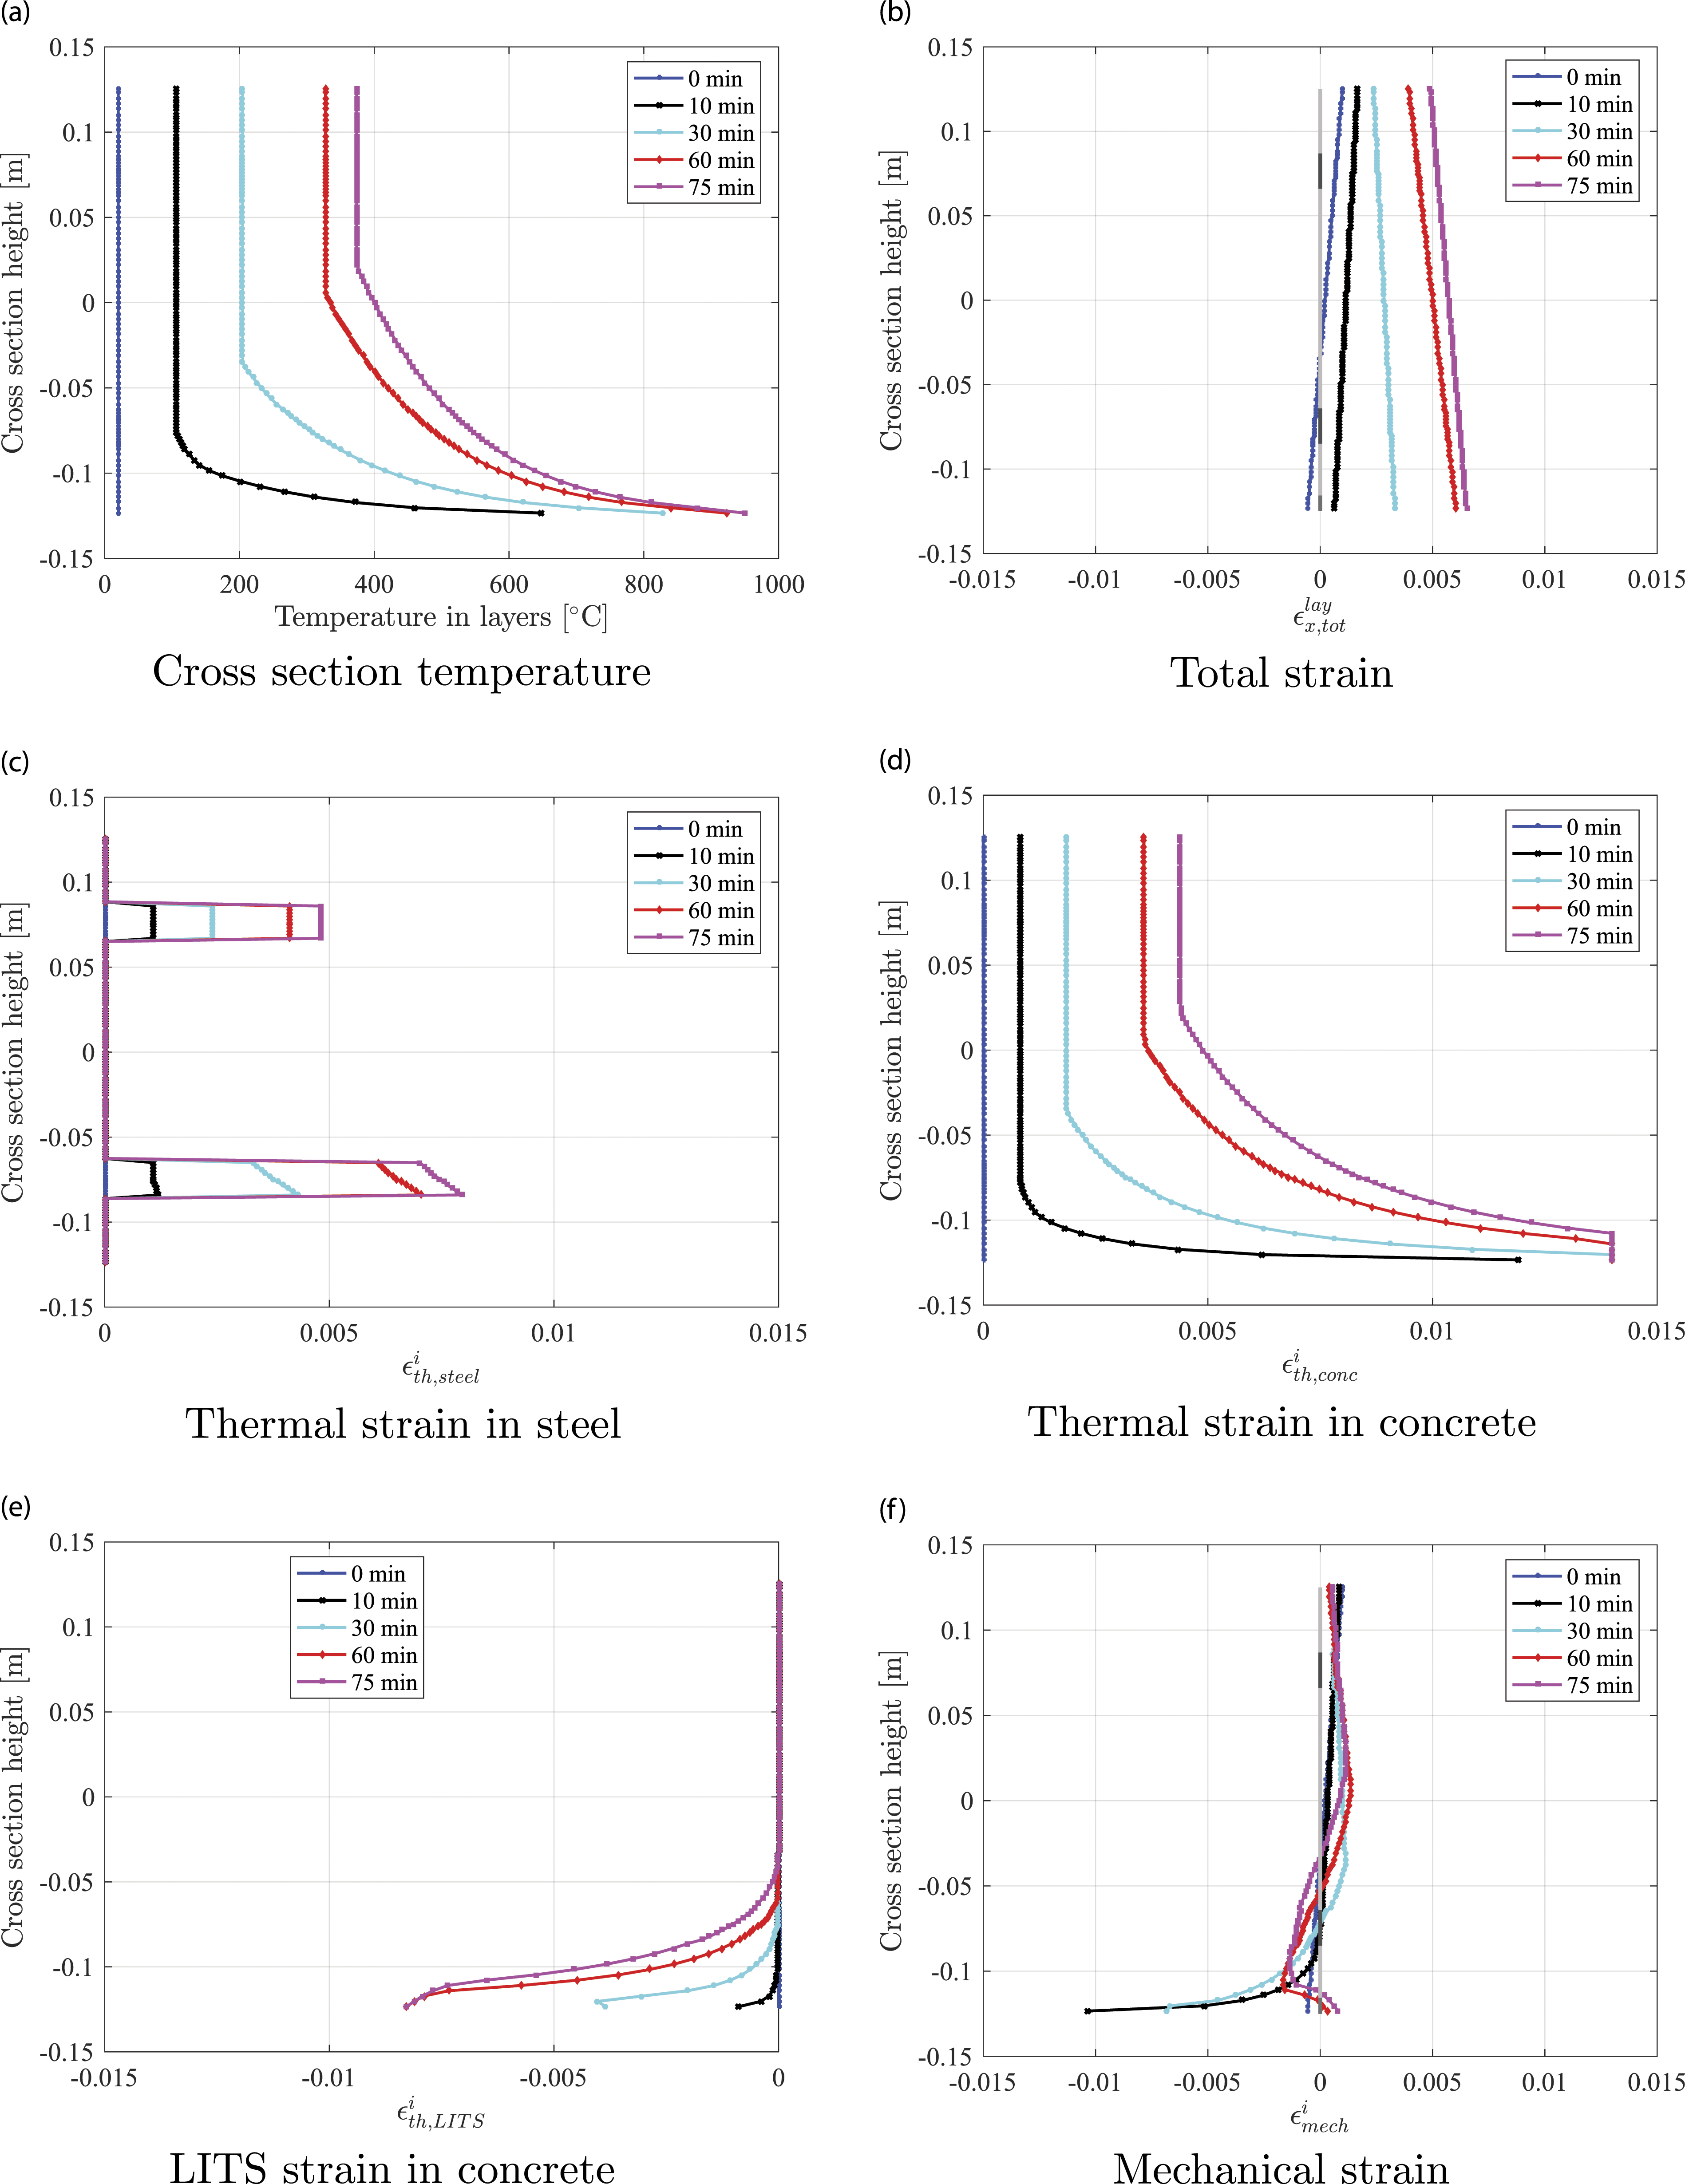
The total strains of the DL case are positive (Figure 12(b)) as from 10 min on and are analogous to a tensile normal force and downward bending. The concrete and bottom steel reinforcement thermal strains (Figure 12(c) and (d)) followed a similar evolution as in the single beam case and the top rebars reached ≈5 ‰. The different strain component in the DL beam with respect to the UL case is
The resulting mechanical strain distribution in Figure 12(f) is different from the single beam test and UL beam case. Even through Concrete and steel material parameters variation as function of temperature along the height of a beam cross section at different times.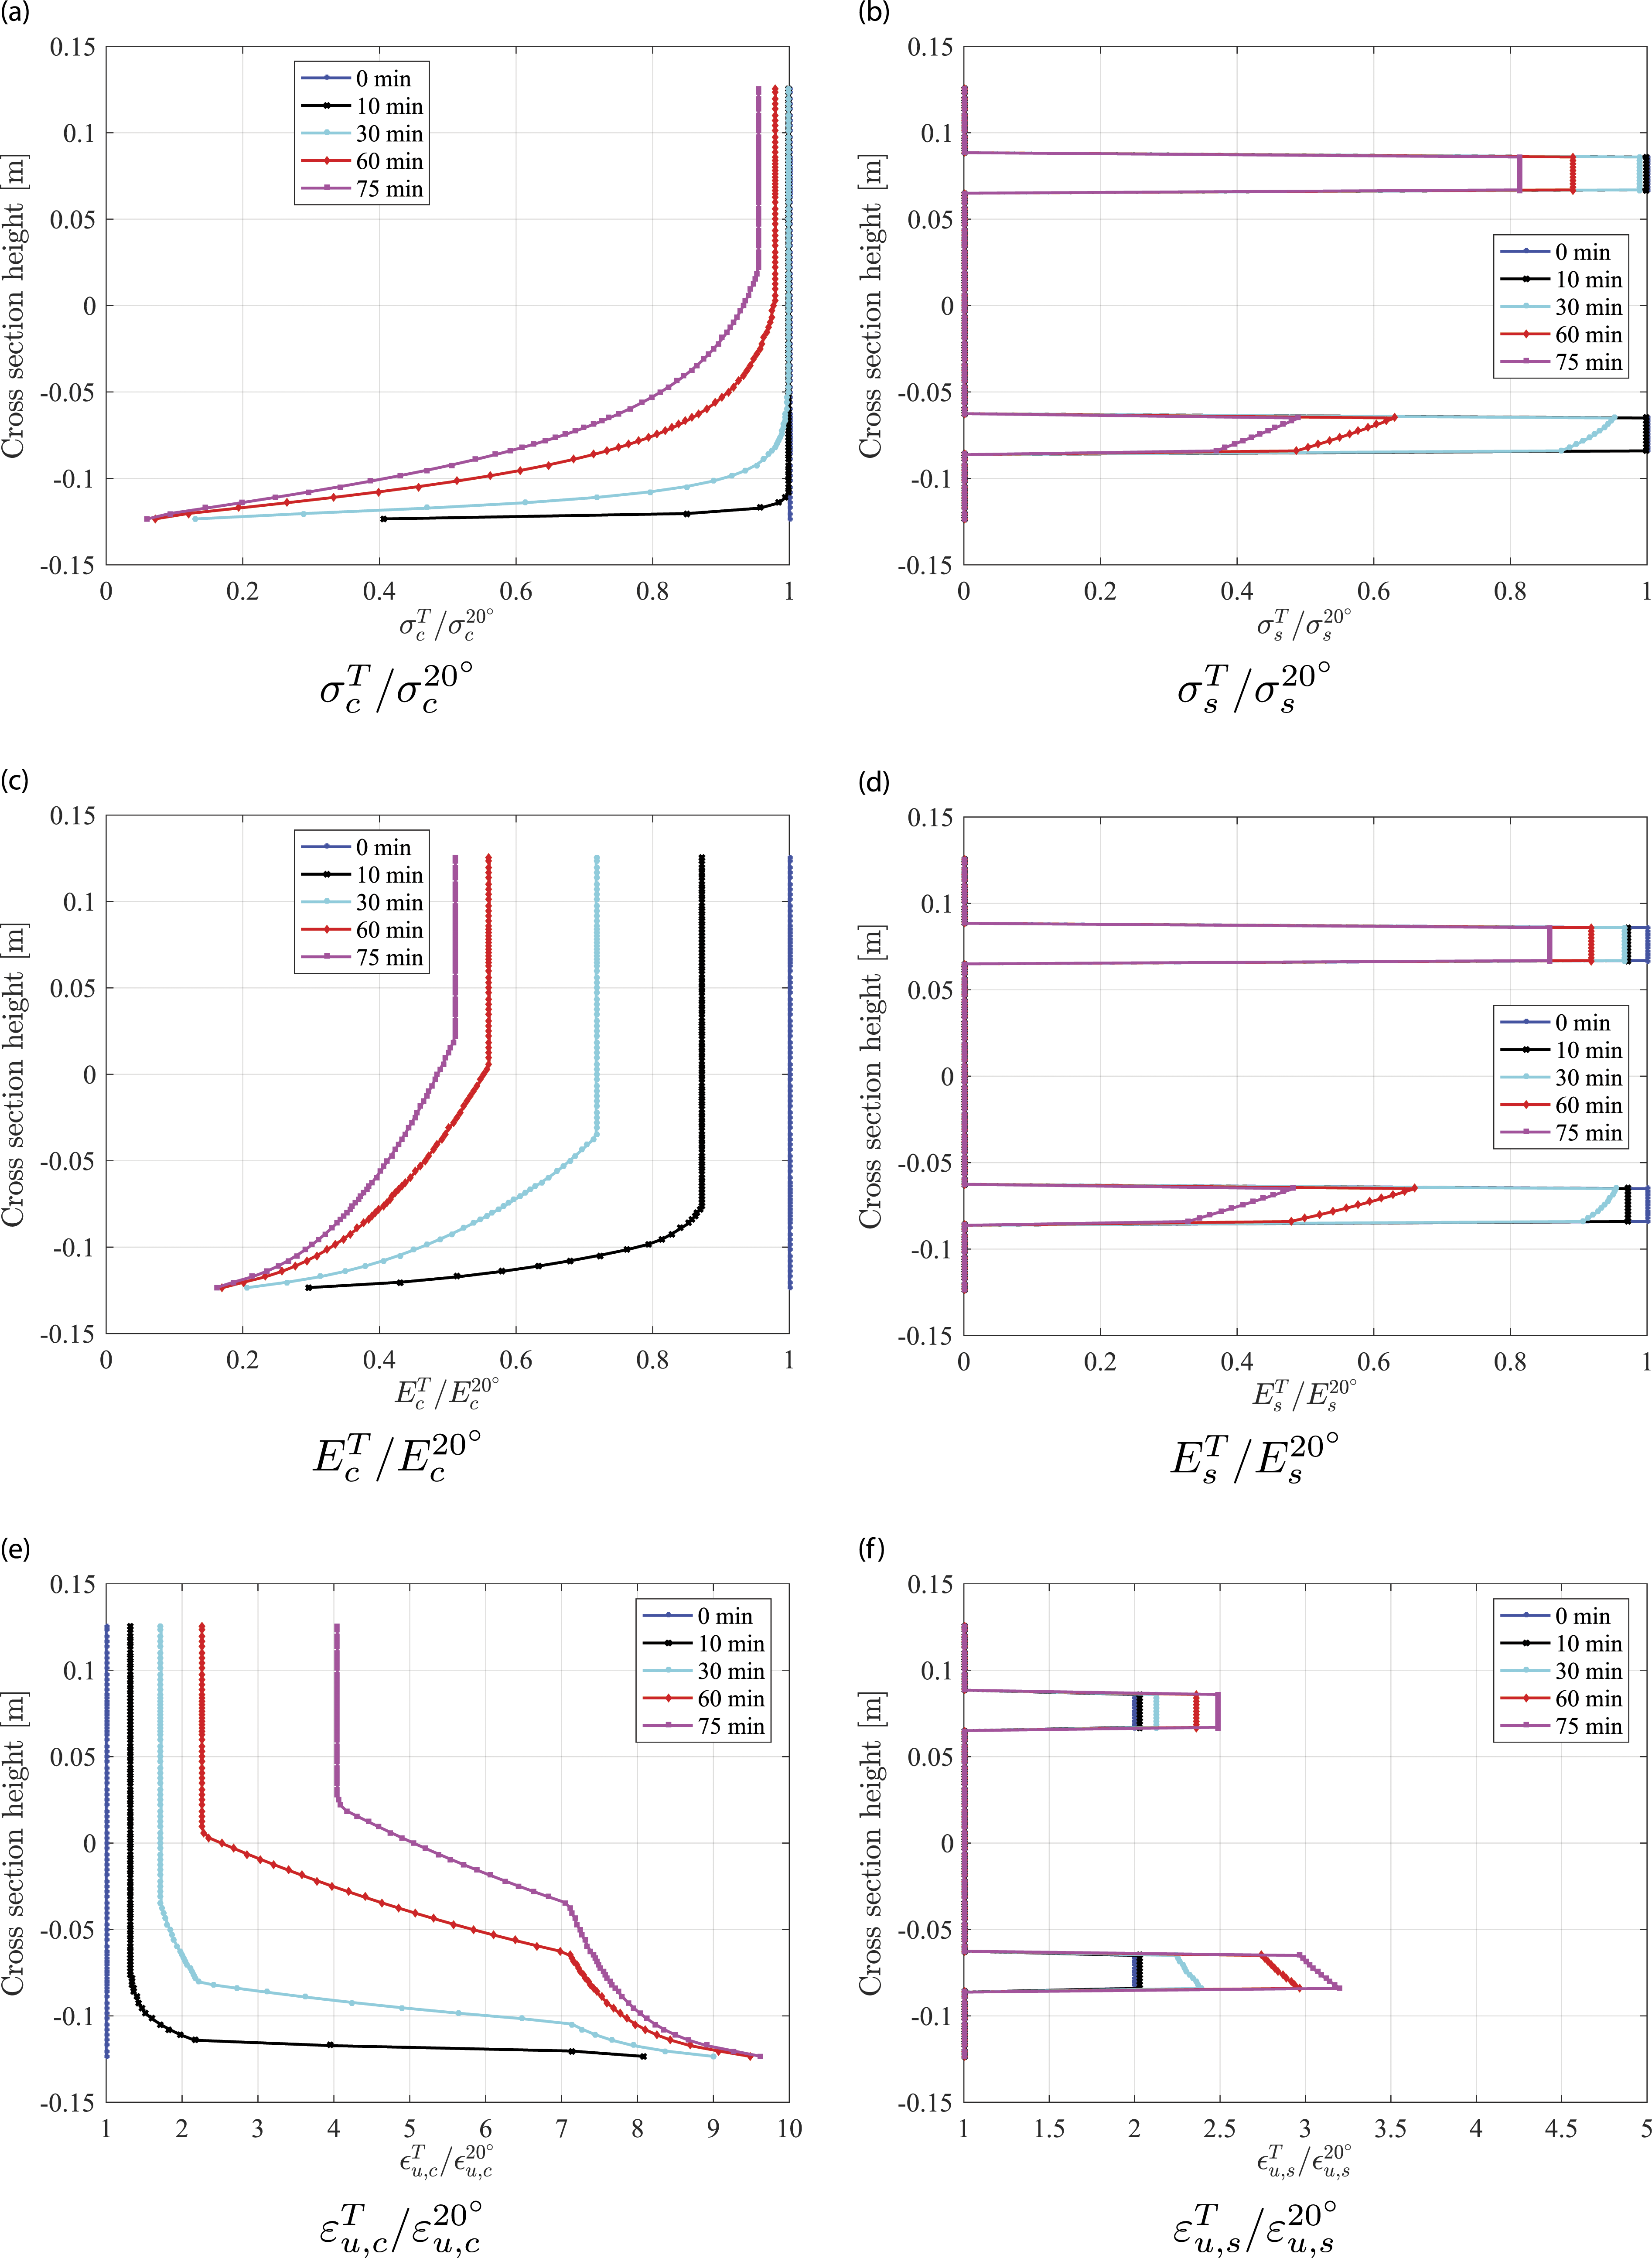
The material properties evolution as a function of time is similar to the single beam test. A noteworthy difference is that the bottom steel rebar yield strength and elastic modulus decreased only by approximately 60% (
The cross-section stress distribution in the DL beam is focused upon here considering the similarity between the UL and the single beam example. At 10 min, the bottom concrete layers of the DL beam yield in compression. Beyond 20 min, the bottom steel reinforcement is in bending due to advancing concrete deterioration in the bottom zone ( Total axial stress evolution at the cross section C (Figure 9) at different times for downward loaded beam with elastic and plastic concrete layers shown in light and dark gray; elastic rebars shown in white, respectively.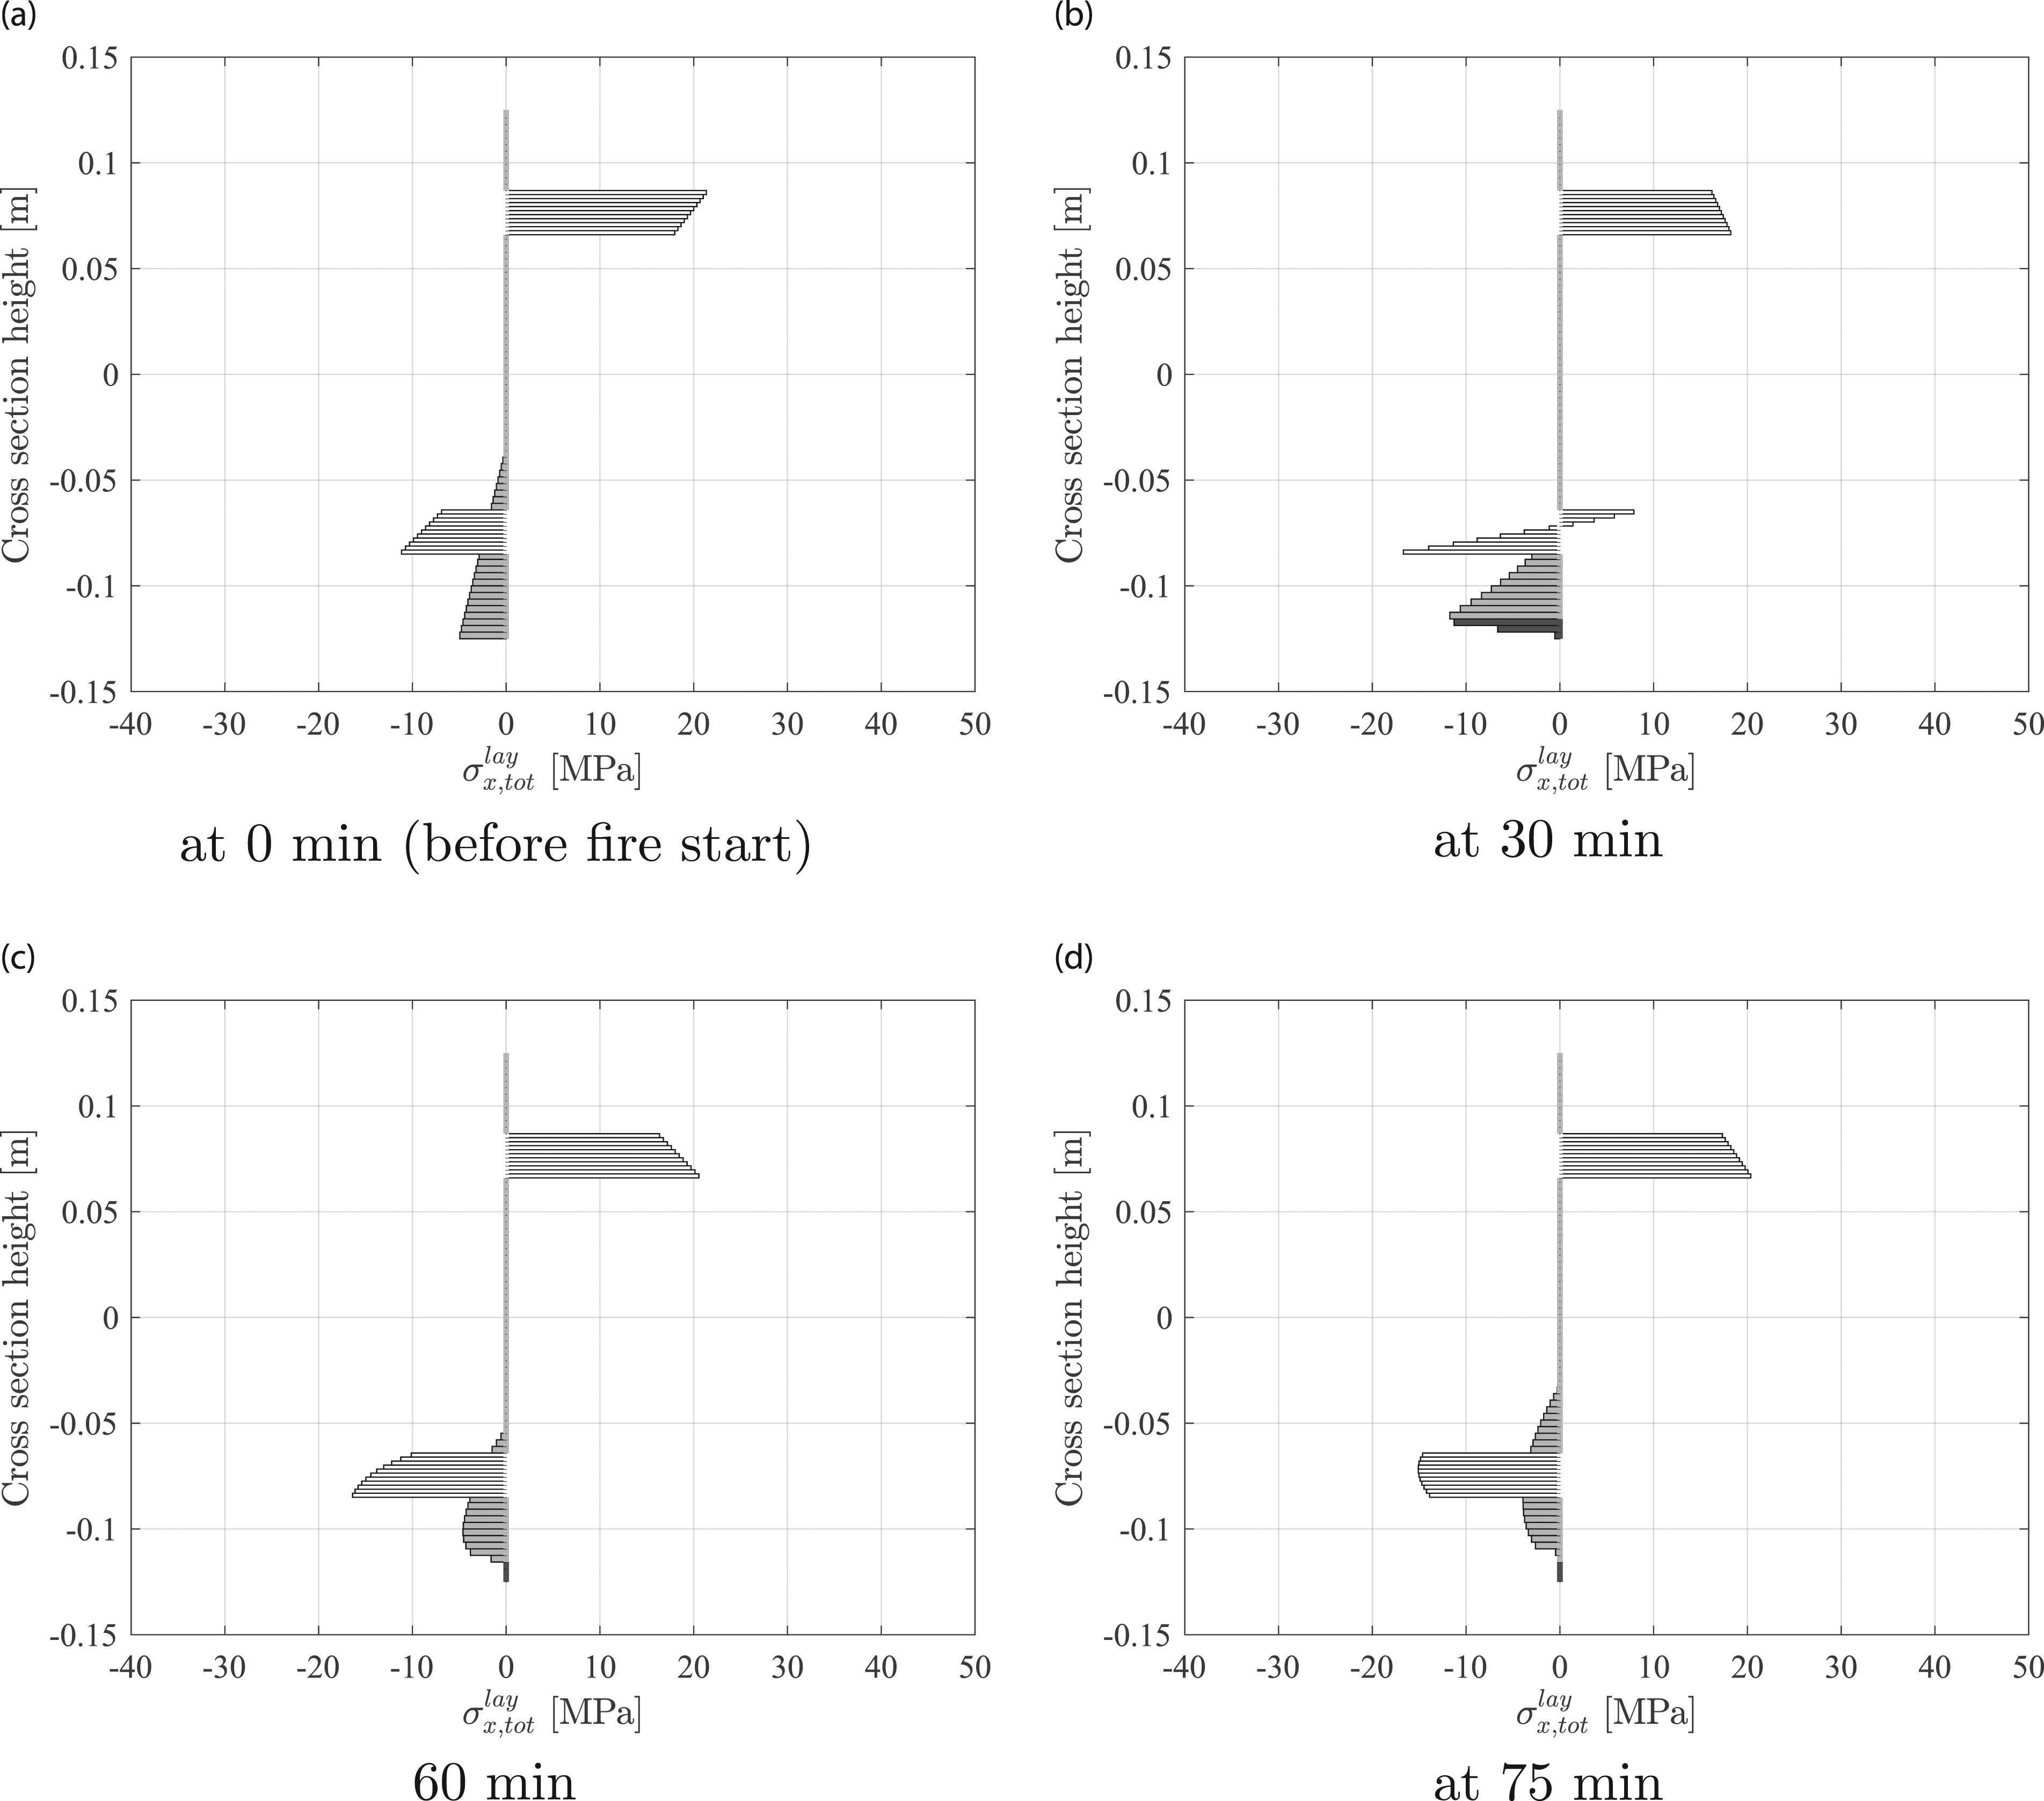
Conclusions and outlook
The above results thus show that the proposed relatively simple and computationally efficient FE model was able to predict the experimental structural response in a fire scenario, provided the ultimate strain evolution as function of temperature was properly incorporated (especially important for concrete). The employed closed form thermal model by Kodur et al. (2013) was proven to be a powerful and fast tool. The numerical model comprises a minimum set of numerical ingredients to capture relevant phenomena in a simplified way, using a physically sound, but limited parameter set. Simulations could therefore be used to explain the experimental structural behavior through a detailed analysis of the cross-sectional numerical results and the following observations were made. The material parameters’ variation as a consequence of temperature rise was quantified and observed to be dominant in the heated bottom zone of beam members with concrete exhibiting a more rapid degradation that precedes the degradation steel. For the single beam example and the UL beam bottom rebar, yielding was observed, confirming that an appropriate protective concrete layer is essential for fire safe design. A more important and lasting influence of LITS was observed for the DL beam that showed a structural response of different nature due an opposed interaction of mechanical and thermally induced loading.
Further research includes the proposal of a different layer averaging scheme (e.g., material properties instead of temperature averaging), that could allow representing columns more accurately. The high computational efficiency of the proposed formulation would allow investigating material and geometrical variability on the failure time in the future. Another point of interest is the extension of the present model to Timoshenko beam finite elements (Zhang and Bradford, 2007).
Footnotes
Declaration of conflicting interests
The author(s) declared no potential conflicts of interest with respect to the research, authorship, and/or publication of this article.
Funding
The author(s) received no financial support for the research, authorship, and/or publication of this article.