
Abstract
A hill with a lattice transmission tower presents complex wind field characteristics. The commonly used computational fluid dynamics (CFD) simulations are difficult to analyze the wind resistance and dynamic responses of the transmission tower due to structural complexity. In this study, wind tunnel tests and numerical simulations are conducted to analyze the wind field of the hill and the dynamic responses of the transmission tower built on it. The hill models with different slopes are investigated by wind tunnel tests to measure the wind field characteristics, such as mean speed and turbulence intensity. The study shows that the existence of a transmission tower reduces the wind speed on the leeward slope significantly but has little effect on the windward slope. To study the dynamic behavior of the transmission tower, a hybrid analysis procedure is used by introducing the measured experimental wind information to the finite element tower model established using ANSYS. The effects of hill slope on the maximum displacement response of the tower are studied. The results show that the maximum value of the response is the largest when the hill slope is 25° compared to those when hill slope is 15° and 35°. The results extend the knowledge concerning wind tunnel tests on hills of different terrain and provide a comprehensive understanding of the interactive effects between the hill and existing transmission tower regarding to the wind field characteristics and structural dynamic responses.
Introduction
It is of great importance to investigate the wind characteristics of hills where wind loads have been regarded as one of the dominant factors determining the structural design and safety of buildings on the hill. The transmission tower built on the hill is sensitive to the wind and may change the wind field of a small hill. In many countries, wind field characteristic parameters for wind-resistant design are specified and presented in the specifications or codes, such as the USA (ASCE/SEI 7–10, 2010), Japan (AIJ-RLB-2004, 2004), China (GB50009-2012, 2012), and Australia/New Zealand (AS/NZS1170.2, 2011). However, for wind resistance design, the wind load would be inaccurate if the values are simply designed according to the codes without considering the effects of hills of different slopes. Studies on wind characteristics have been carried out extensively through the computational fluid dynamics (CFD), wind tunnel test, and field measurement. Blocken et al. (2015) conducted a CFD study and field measurement of wind characteristics for a natural complex terrain. Since the field measurement is expensive and time-consuming, CFD becomes a useful tool to study wind characteristics (Guo et al., 2020a; Xia et al., 2011). Yan and Li (2016) proposed a field measurement and CFD simulation-coupled approach to reproduce the spatial variability of wind speed of a complex terrain. Li et al. (2017) studied the wind characteristics of a mountainous terrain by wind tunnel test and CFD simulation. Huang et al. (2018) used CFD simulation to study the wind field of a truncated mountain terrain and proposed a novel transition curve, which was applied to the simulation of a 3D wind field. Despite the extensive use of CFD for the study of wind characteristics, wind tunnel test remains the most accurate method for wind engineering research. Lubitz and White (2007) investigated the influence of wind direction on speed-up over hills and found that mean speed-up factor varied significantly with time. Lou et al. (2020) investigated both mean and fluctuating wind characteristics of a typical mountainous wind field by wind tunnel tests and CFD. It was found that the terrain-induced turbulence effects dominated the performance-based structural design of transmission system in the mountainous area. Tse et al. (2020) conducted the wind tunnel tests and CFD simulations to investigate the influence of wind flows with pitch and yaw angles of structures in built-up area. The research indicated that the variations in wind load and structural responses in wind flow were attributed to differences in flow field.
The transmission tower built on the hill is mainly affected by wind loads. Besides, the complex terrain of the hill has an impact on the aerodynamic responses of the tower (Reed et al., 2010). The lattice tower, as a new type of transmission tower, has been widely used due to its small windward area and a small wind resistance coefficient. This high-rise transmission tower is a wind-sensitive structure (Sarmasti et al., 2020), and collapse of the structure may happen in extreme weather events, such as hurricanes, typhoons, or rainstorms (Xia et al., 2014; Zhang and Xie, 2019). Xie and Sun (2013) carried out a 1:2 large scale model test on the transmission tower to study the failure principle of the tower in a strong wind environment. Hamada et al. (2017) studied the aeroelastic characteristics and structural responses of a lattice transmission system through simultaneous tests on lattice towers and conductors. Recently, Shu et al. (2018) analyzed the influence of wind loads on the ultimate bearing capacity of the transmission tower based on the experimental tests and finite element analysis. The study indicated that wind load had a significant unfavorable influence on the resistance of the transmission tower. The eastern coast of China is one of the regions severely affected by typhoons between June and September of the year that may lead to the damage of transmission towers built in this region. In recent years, the region has been attacked by some strong typhoons, such as Typhoon Chan-hom in June 2015 and Typhoon Bailu in August 2019. The interactive effects between the wind field characteristics of the hill and the dynamic responses of the transmission tower have not been studied systematically. Especially, the effects of hills to the dynamic responses of the transmission tower need further investigation.
This study presents a wind tunnel test on hill models and explores the dynamic characteristics of a transmission tower on the hill subjected to wind loads. The dynamic responses of the transmission tower are analyzed based on the wind tunnel test data and numerical simulation. First, the hill models for the experiment are introduced and the wind field characteristics of hills are studied in terms of mean speed and turbulence intensity, considering the effects of hill slope. Second, the influences of transmission tower on wind field characteristics of hill are further explored. Then, based on the wind tunnel test data, dynamic responses of the tower are examined numerically. The effects of the hill on the structural responses are studied and the conclusions are drawn at last.
Wind field analysis using wind tunnel tests
Engineering background
As shown in Figure 1(a), a hill is located near Liuheng Island, Zhoushan, in the northeast of Zhejiang Province. There is a transmission tower built on the hill, and the height of the tower is 56m, as shown in Figure 1(b). Wind tunnel tests are conducted to study the wind field characteristics of the hill models with different slopes and the impacts of the existing transmission tower on the wind field. The study objects: (a) location of the hill and (b) the transmission tower.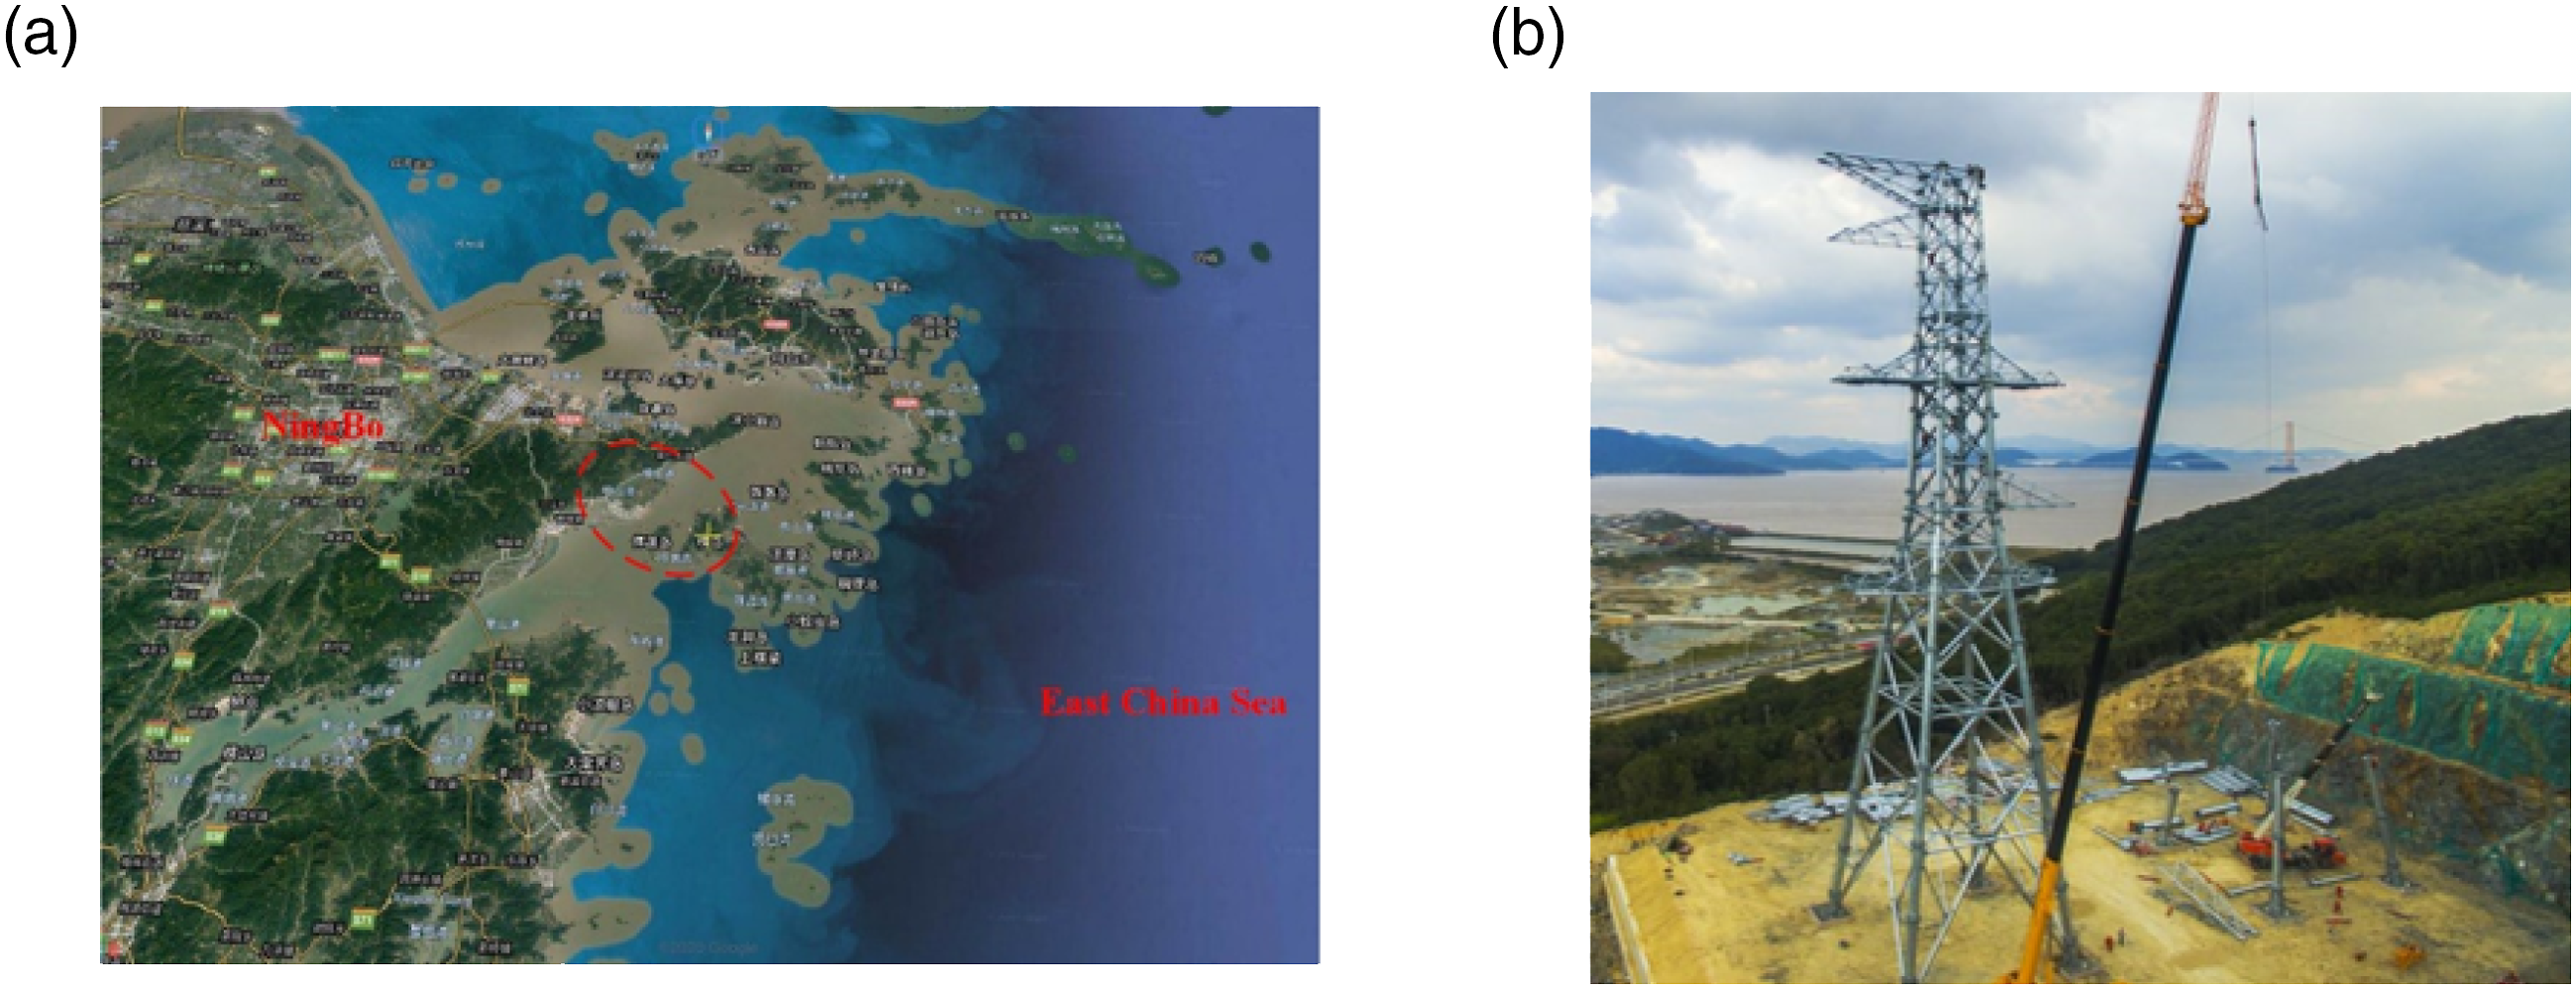
Experimental setup
Hill models
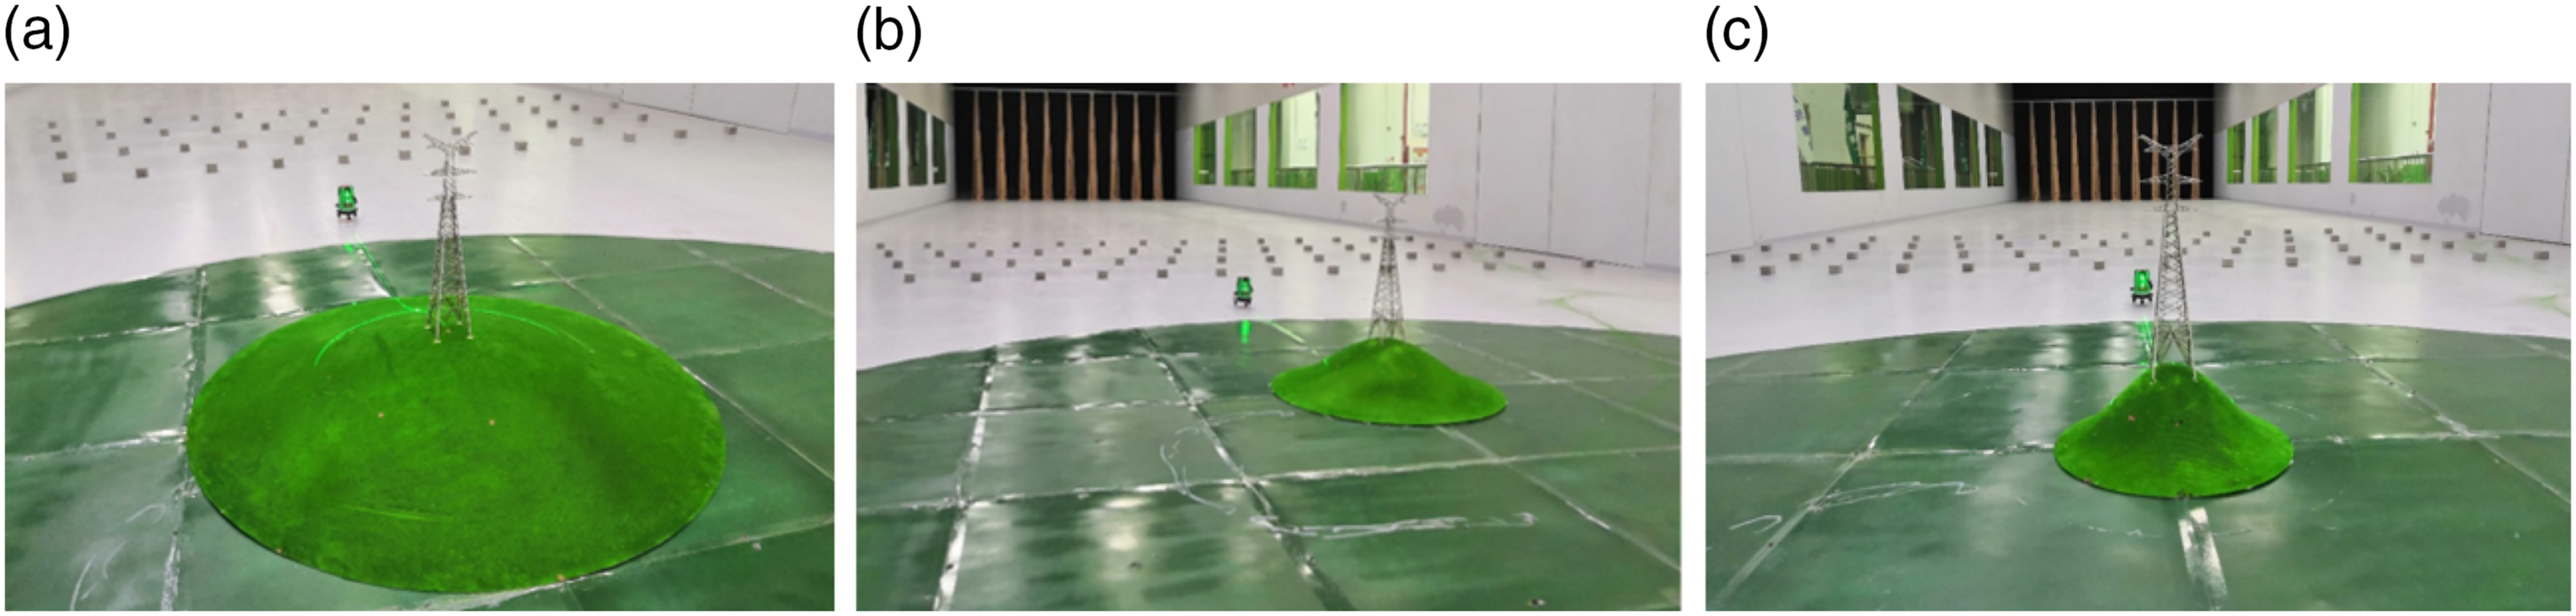
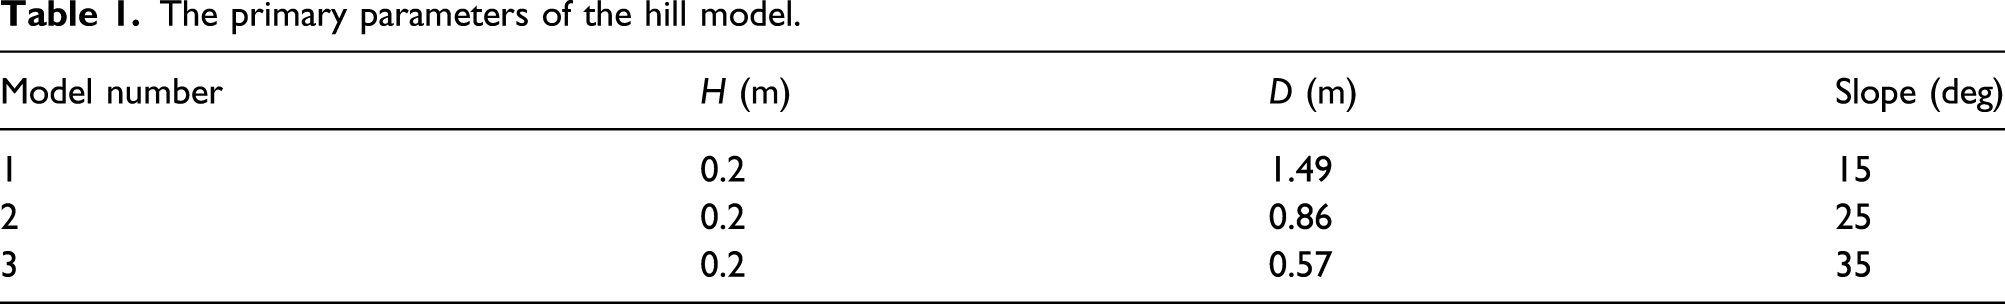
The hill shapes have distinct influences on wind field characteristics (Weng et al., 2000). For the simulation of hill shapes, there are triangle, bell Gauss, cosine square, and cosine shape. Cao et al. (2012) used cosine square to simulate the mountain shape to study the turbulent boundary layer in two-dimensional hilly area. Shen et al. (2020) carried out wind tunnel tests by using cosine square of hill model to study the streamwise and vertical wind fields on a typical three-dimensional hill. In this study, the cross-section adopted is the cosine shape, which is closest to the actual terrain. The contour in two-dimensional plane can be expressed as equation (1). The schematic diagram is shown in Figure 2 Schematic of the cosine-shaped hill. Hill models with different slopes in the wind tunnel: (a) Model 1 with hill slope 15°, (b) Model 2 with hill slope 25°, and (c) Model 3 with hill slope 35°. The primary parameters of the hill model.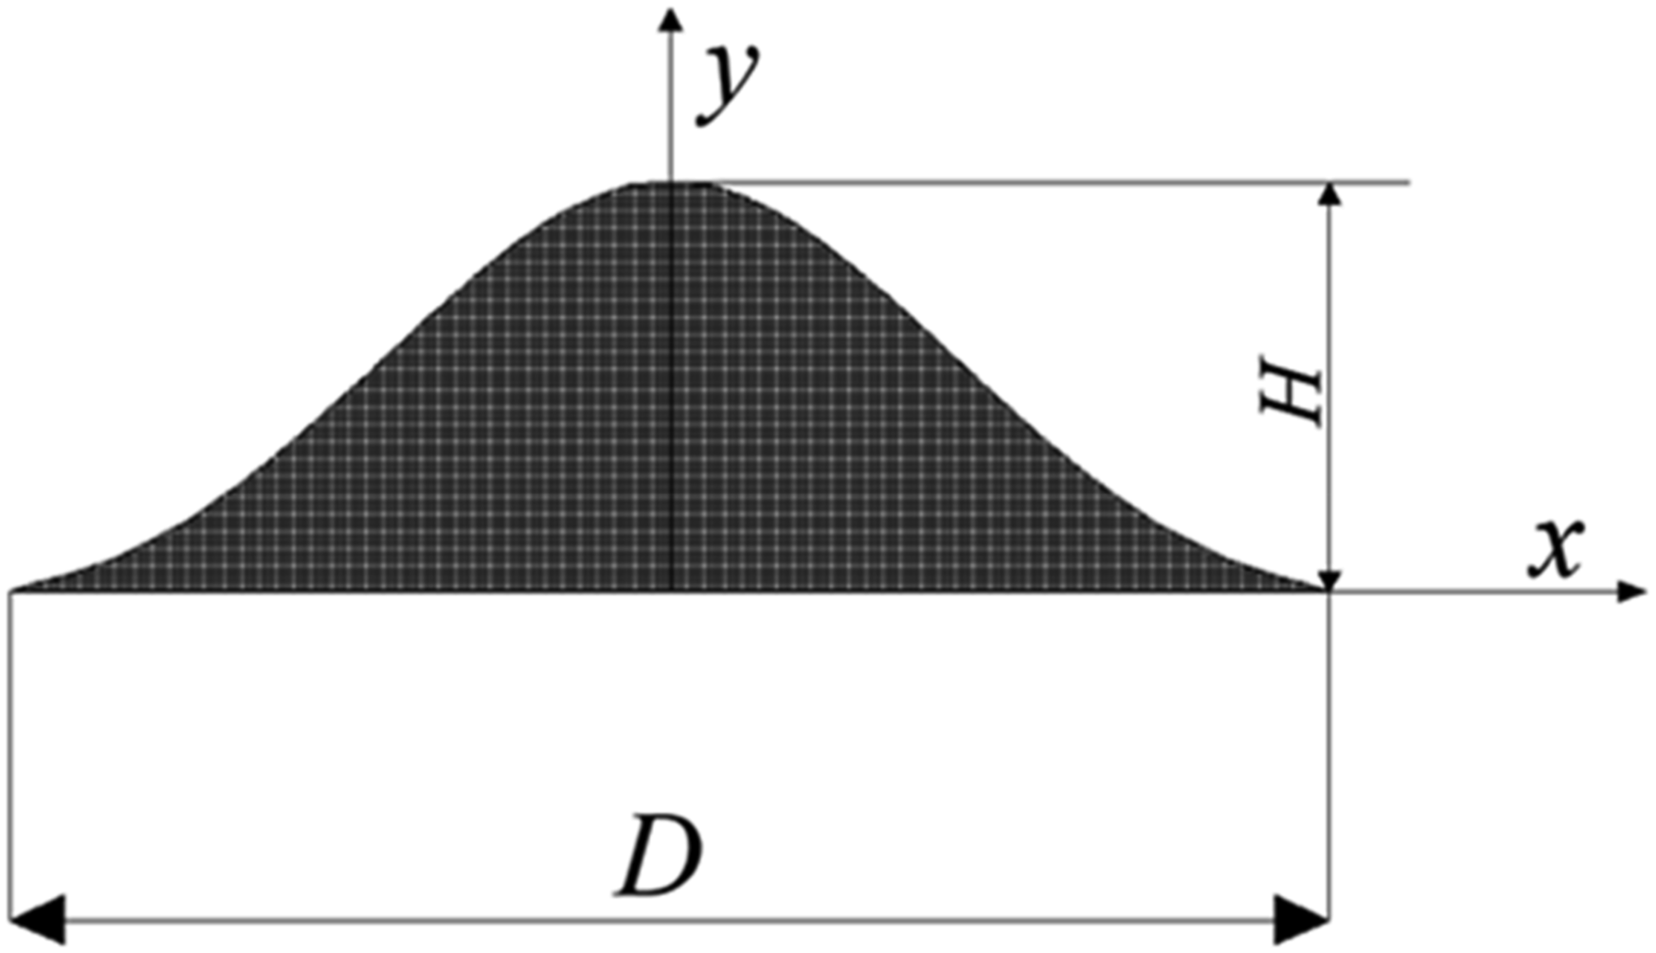

Atmospheric boundary layer wind tunnel
The section size of the boundary layer wind tunnel is 5 m (height) × 8 m (width). A Turbulent Flow Instrumentation (TFI) Cobra Probe anemometry system is applied to measure the turbulent flow over the hill models, as shown in Figure 4. The recorded raw voltage data were converted to speed data by TFI Device Control software. The measurement accuracy of the wind speed probe is about ±0.2 m/s. It has been widely used to measure the wind speed and wind direction in the different situations of hill model, which can ensure the measurement accuracy and efficiency even for highly turbulent flows. In the test, the sampling frequency of the probe was set as 1250 Hz. During the experiment, we used wedges and concrete blocks to simulate the wind field of the atmospheric boundary layer, which corresponded to Category A roughness in Chinese code (GB 50009-2012, 2012). It is proved that the roughness passive simulation can basically achieve the similarity between the simulated flow field and the real atmospheric boundary layer in respect to mean wind speed and turbulence intensity (Liang et al., 2015). During the wind tunnel tests, the mean wind speeds and turbulence intensities at various heights measured over the test section and a power spectrum of the wind speed are illustrated in Figures 5(a)–(c), respectively. In Figure 5(a), U/U
r
represents the non-dimensional mean wind speed, where U
r
is the reference wind speed in the wind tunnel, which is 13.41 m/s. In Figure 5(b), I
u
is the turbulence intensity (σz/U × 100%) at height H above ground which with calculated as 0.15(H/10)−0.2 in Chinese code, where σ
z
is the root mean square of the wind speed fluctuations, and U is the wind speed. Figure 5(c) clearly shows that the present measurement data fit well with Kaimal spectrum. TFI Cobra Probe. Experimental results for terrain Category A: (a) profile of wind speed ratio, (b) profile of turbulence intensity, (c) power spectra, and (d) wind field fitting for open space.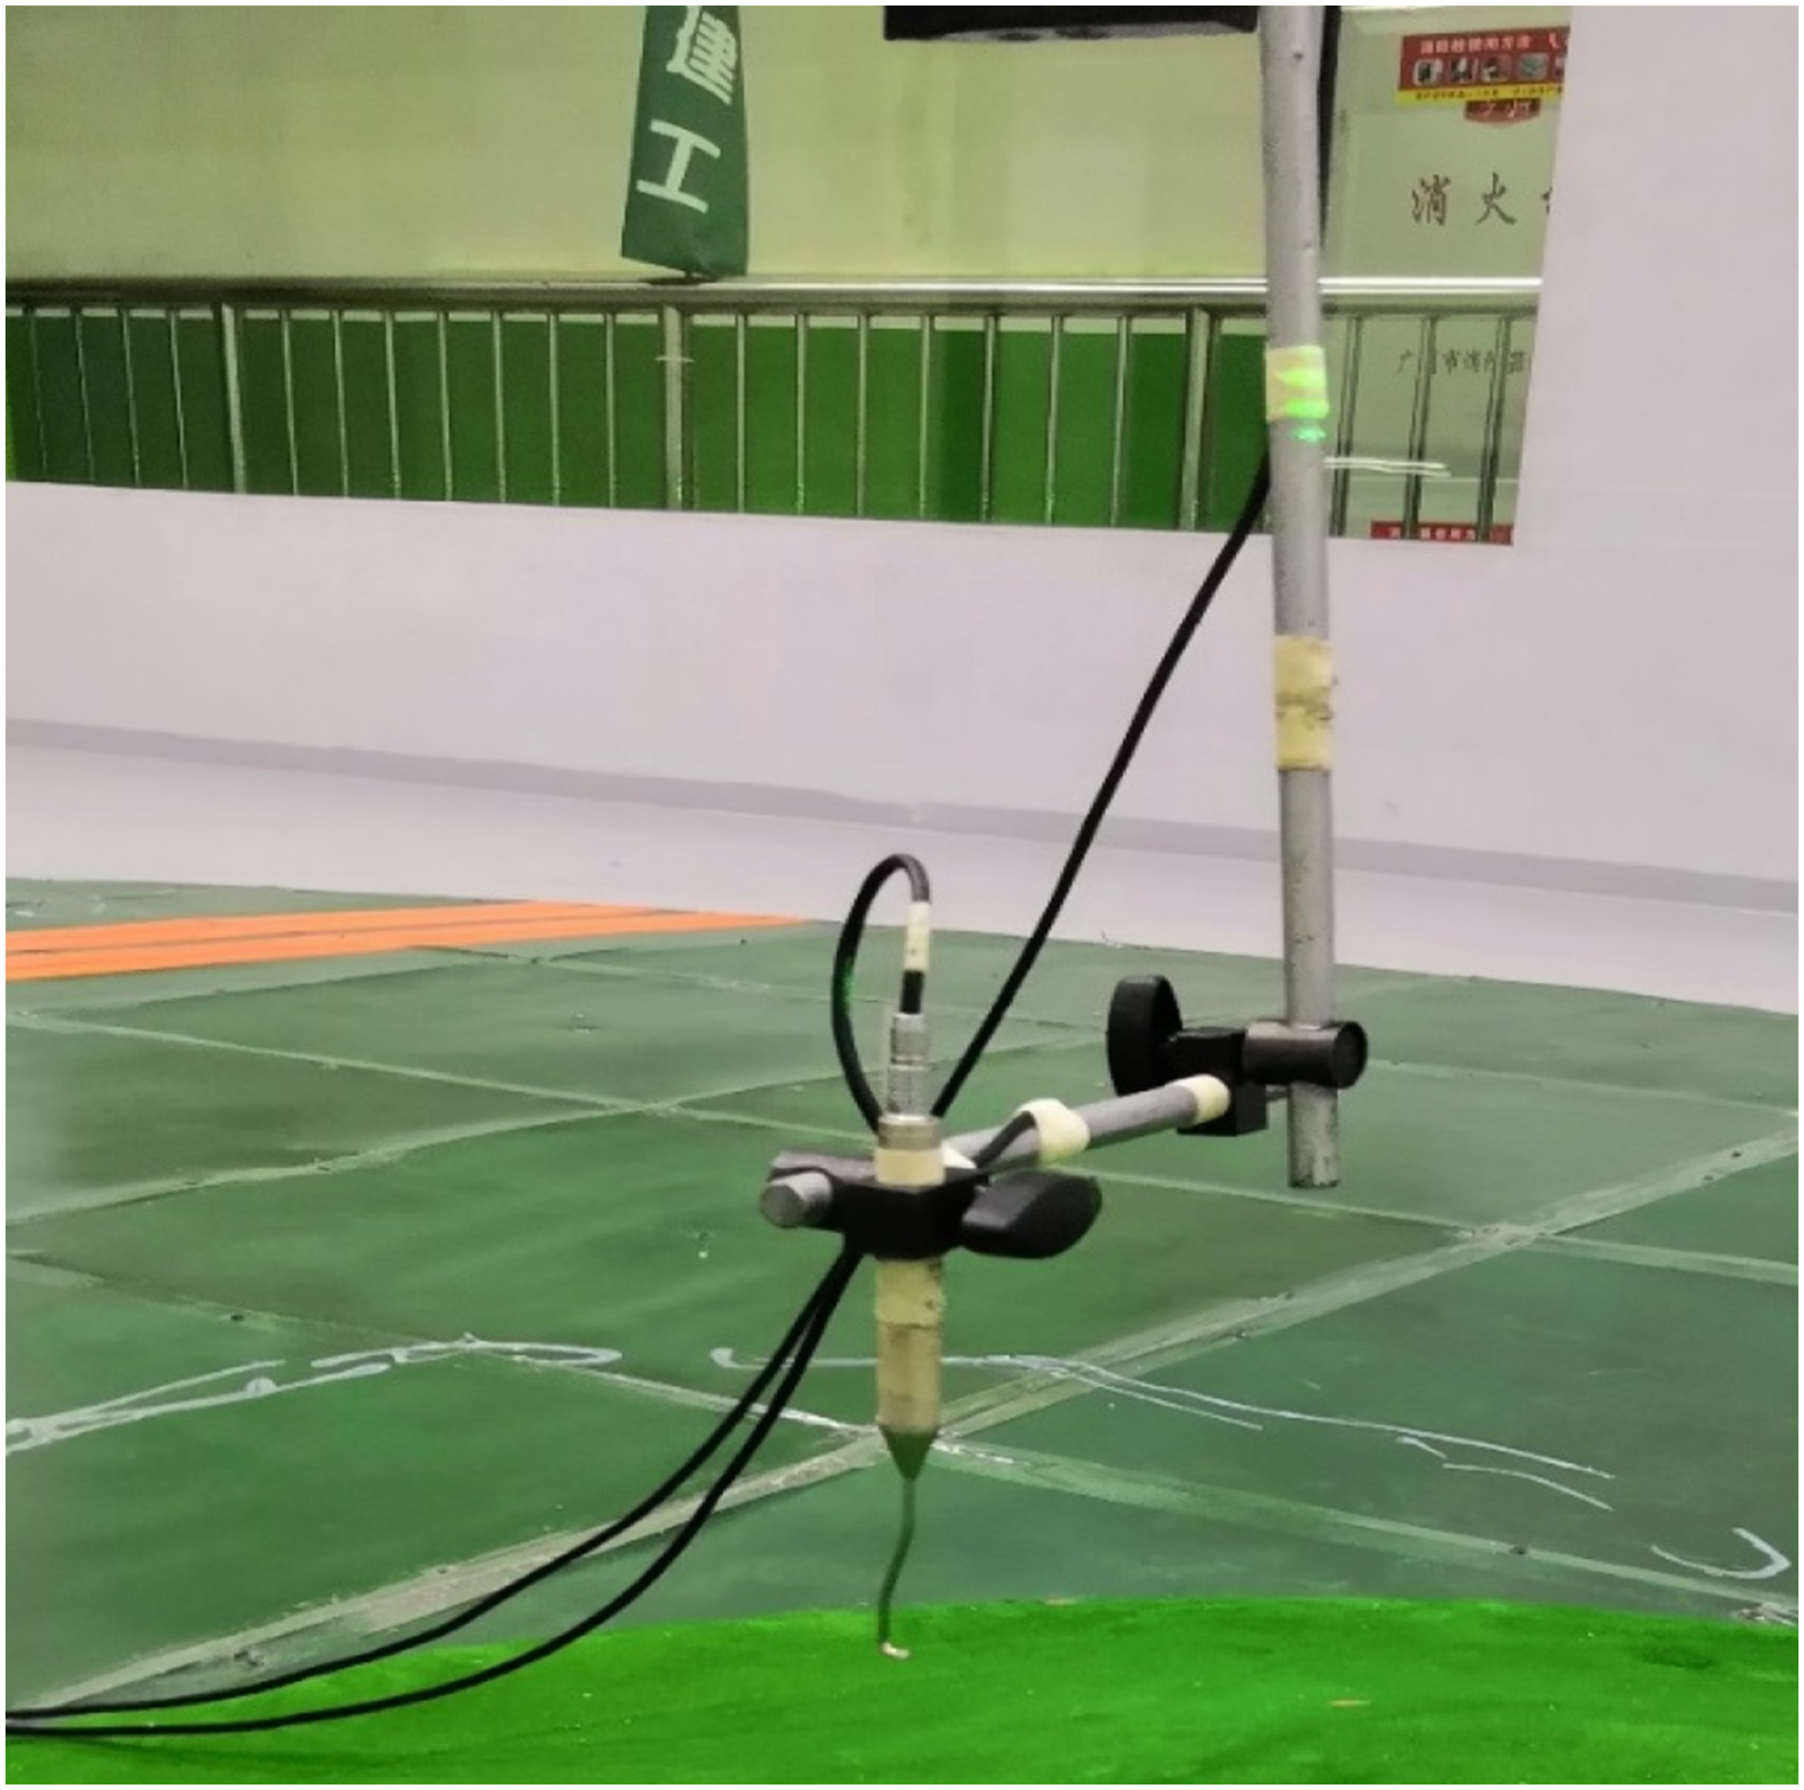
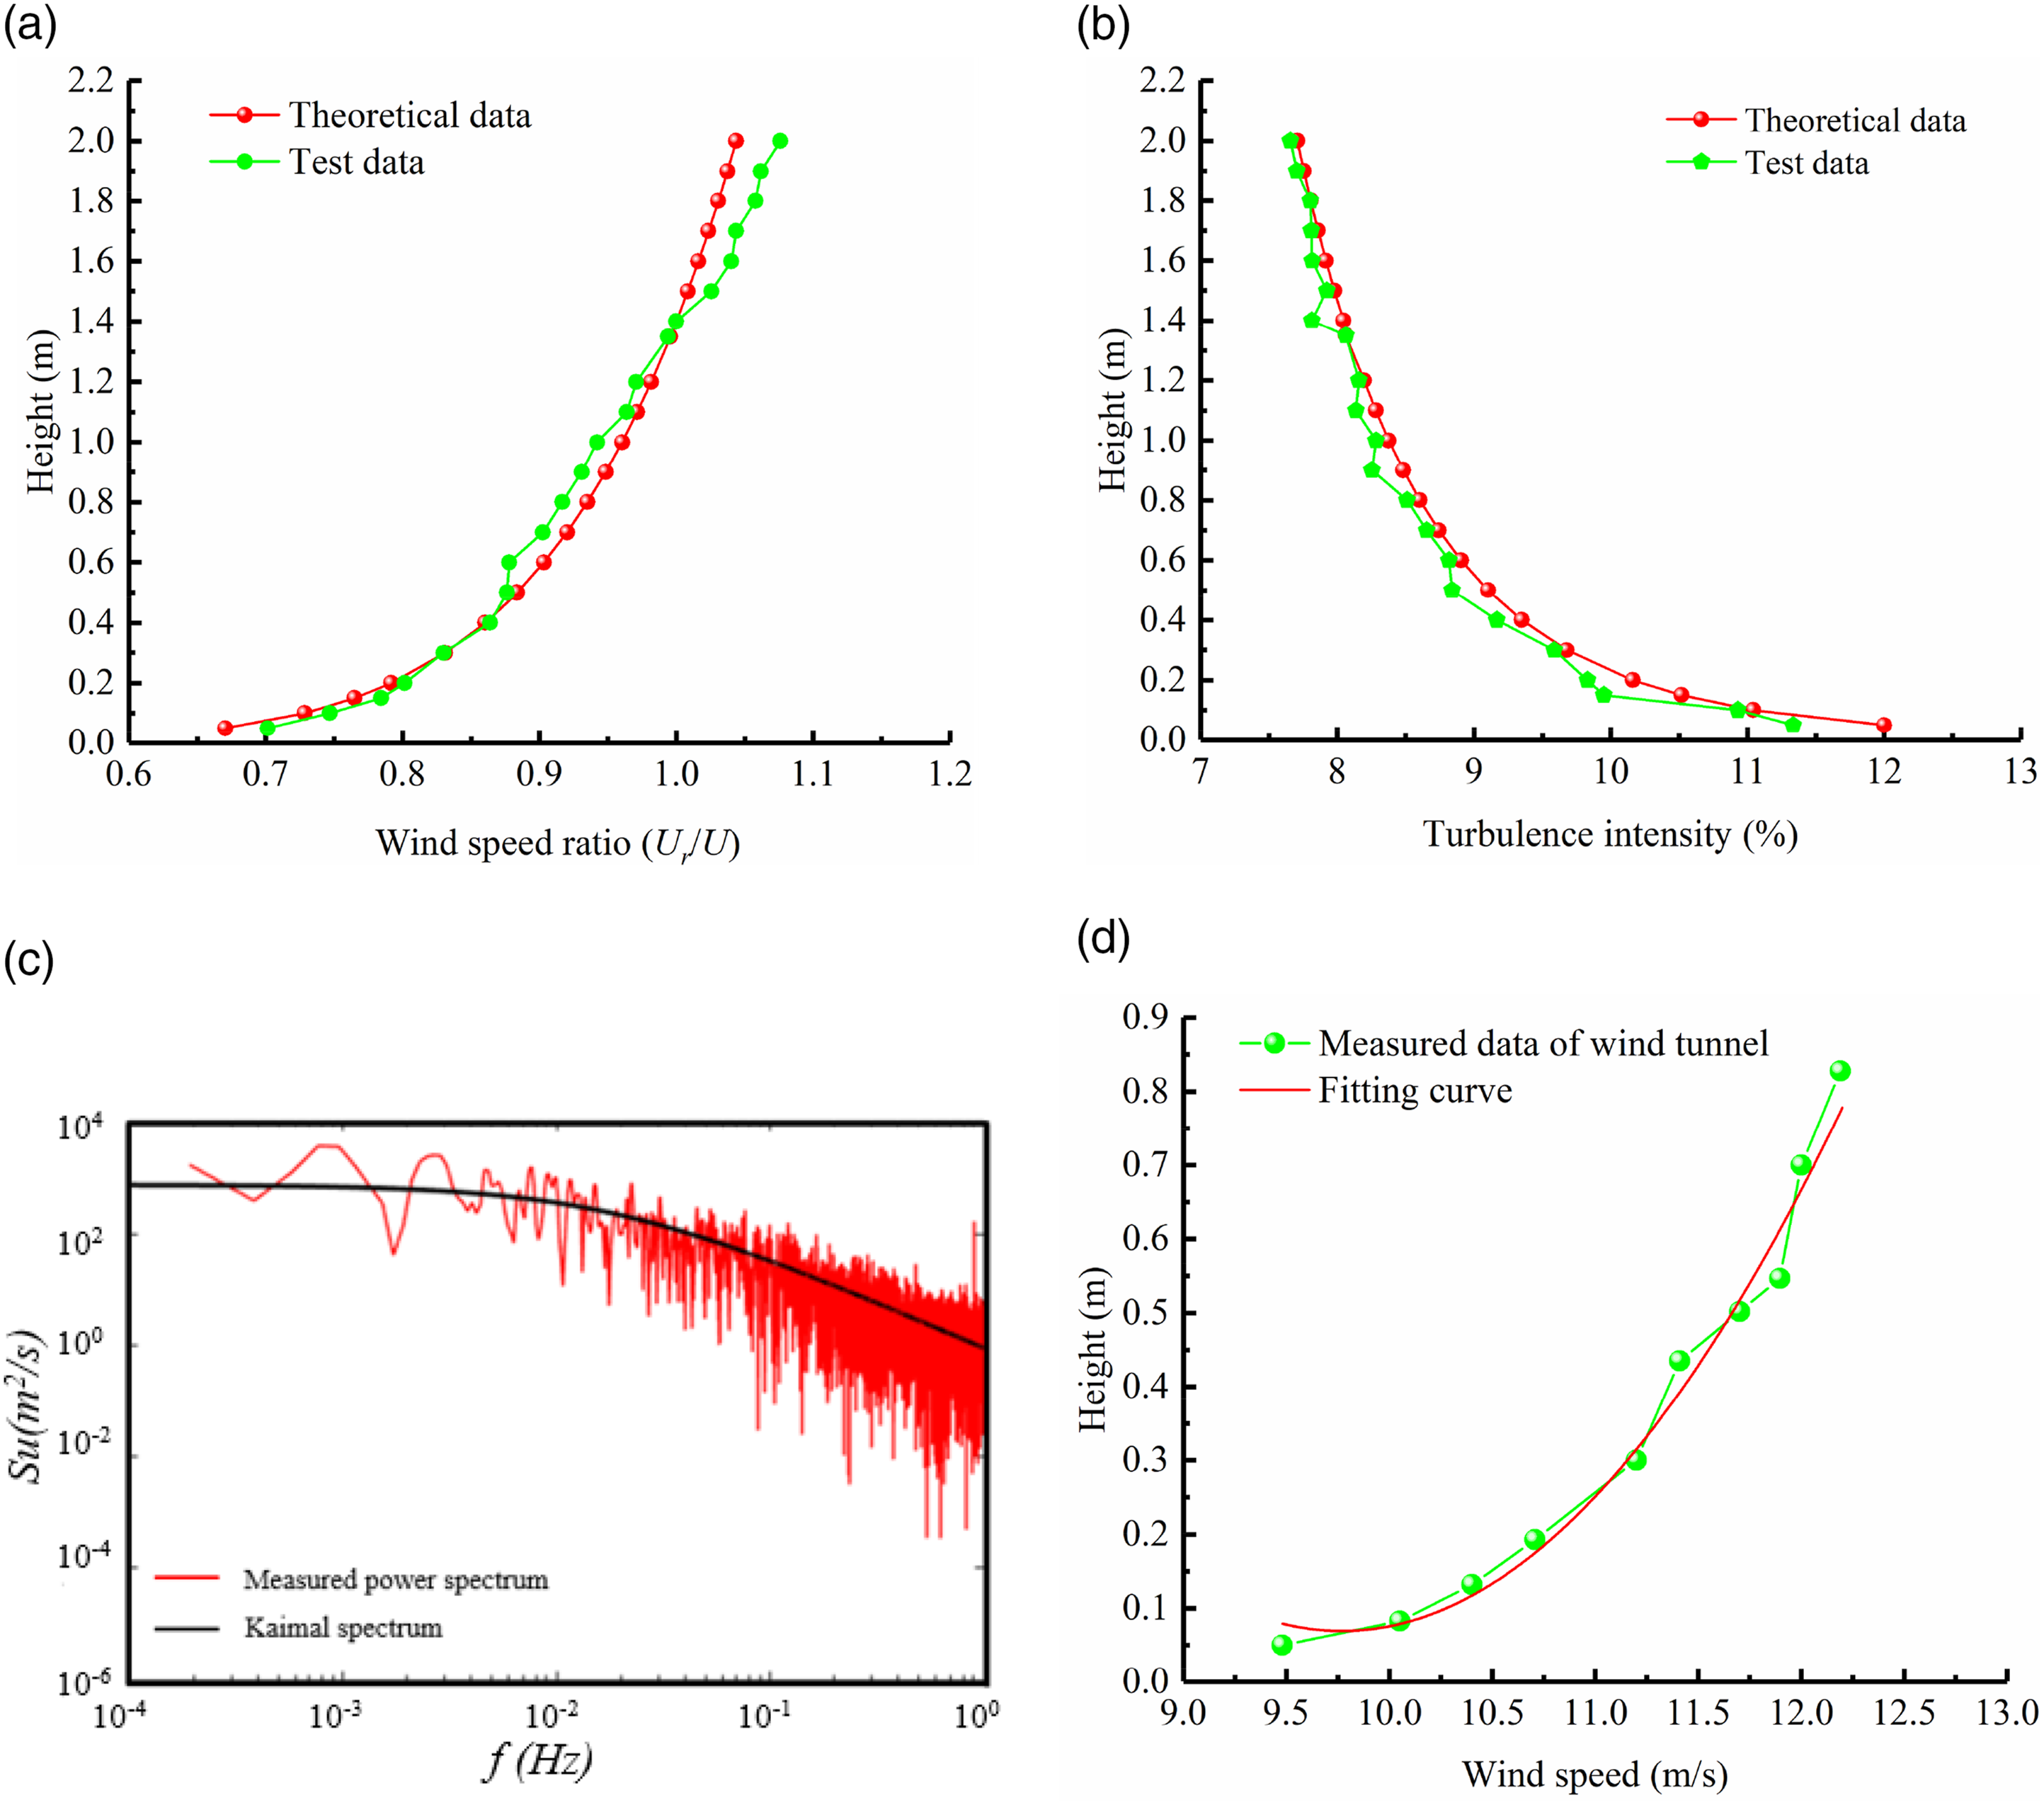
Compared with Australian code, Terrain Category A in Chinese code is identical with Category 1 described in the Australian code (AS/NZS 1170.2, 2011). The roughness length, z0, for the wind field is specified as 0.002 m in Australian code. In this study, we fit the wind speed curve on open space based on the fitting equation U H = 2.5 u* ln (H/z0) from Chinese code, where u* is the friction velocity. With the wind speed data measured from wind tunnel and the fitting equation, the fitting results are shown in Figure 5(d) with z0 = 0.0033 m. Compared with the Australian code, the setting of the roughness length in the test is reasonable.
Wind characteristic analysis of the hill
As shown in Figure 6, there are 11 wind speed measuring points on the hill, and each point has 10 wind speed measuring points along vertical height. These 10 points are at the height of 2 cm, 4 cm, 6 cm, 8 cm, 10 cm, 20 cm, 30 cm, 40 cm, 50 cm, and 60 cm above the ground corresponding to the actual height of 10 m, 20 m, 30 m, 40 m, 50 m, 100 m, 150 m, 200 m, 250 m, and 300 m measured from the hill surface, respectively. Distribution of measuring points on the hill model.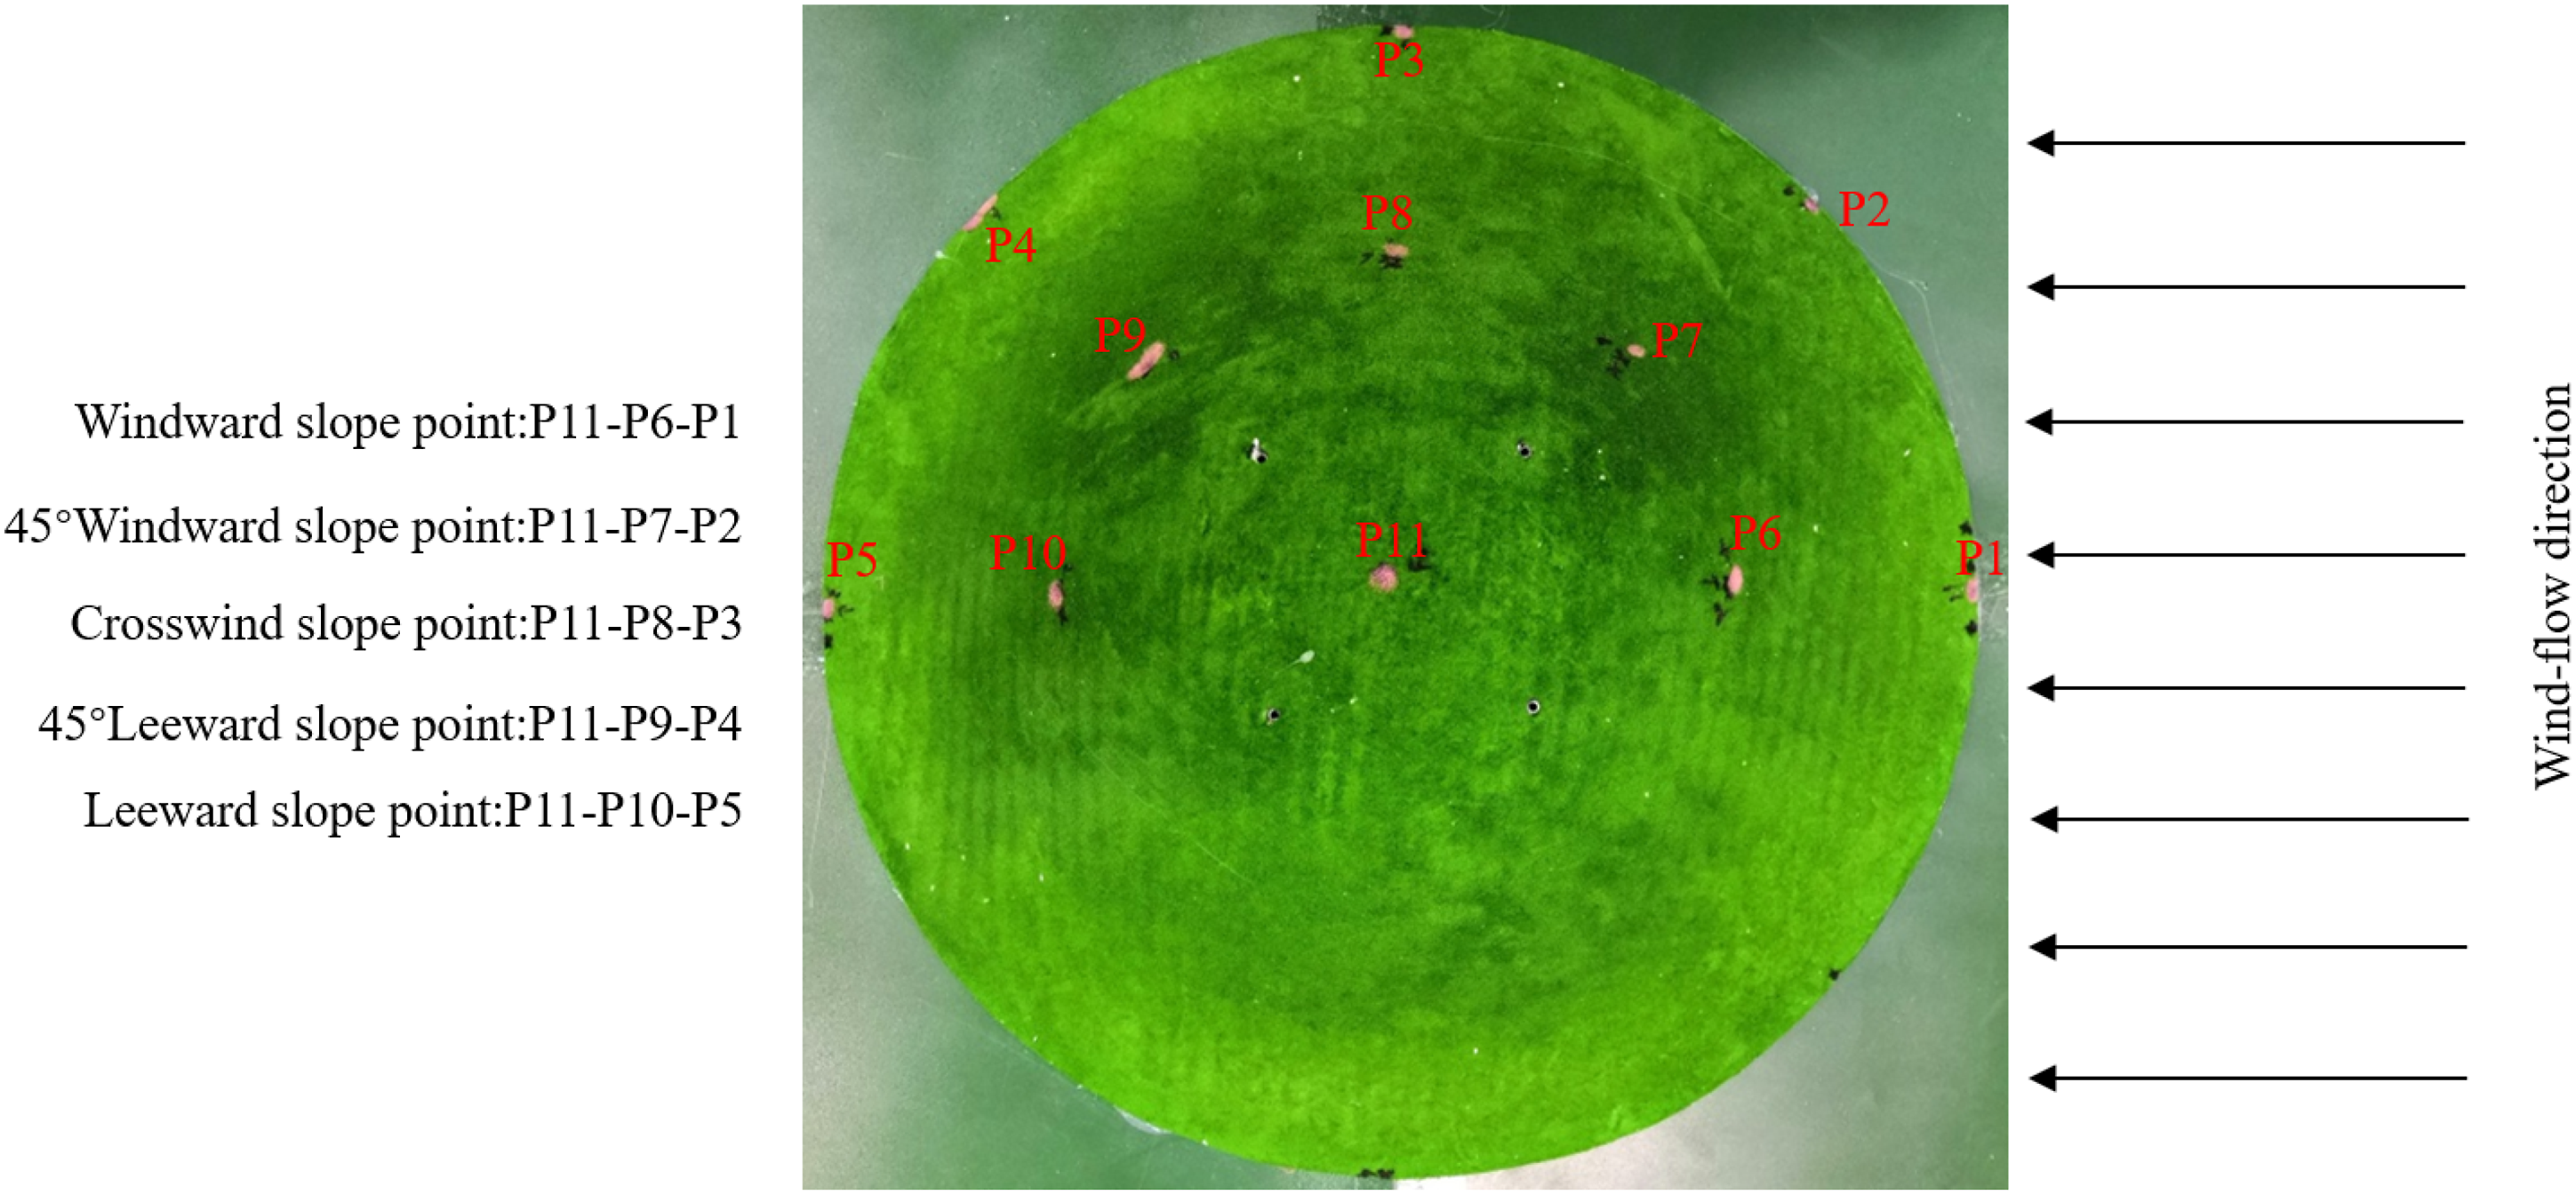
Mean wind speed
Wind is usually described in two parts: mean wind and fluctuating wind. The wind speed can be expressed as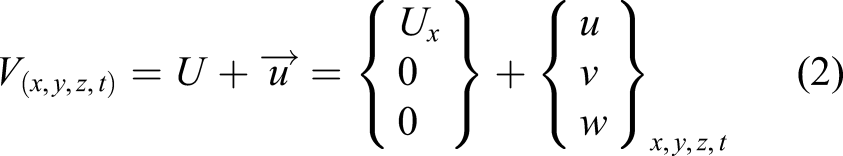
Figure 7 shows the measured wind speed in three directions when the hill slope is 25°. It can be seen that the mean wind speed in longitudinal direction is increasing with the increase of the height, and the lateral wind speed fluctuates around 0 m/s, as shown in Figures 7(a) and (b), respectively. In the vertical direction, the wind speed decreases with the increase of height on the leeward side (P4, P5, P9, and P10) except for the measuring point P5. Meanwhile, at the windward side, the measuring points (P1, P2, P6, and P7) show a trend of the wind speed decrease first and then increase, as shown in Figure 7(c). The layout of the measuring points on the hill is shown in Figure 7(d). Wind speed when hill slope is 25°: (a) longitudinal wind speed, (b) lateral wind speed, (c) vertical wind speed, and (d) layout of measuring points on the hill.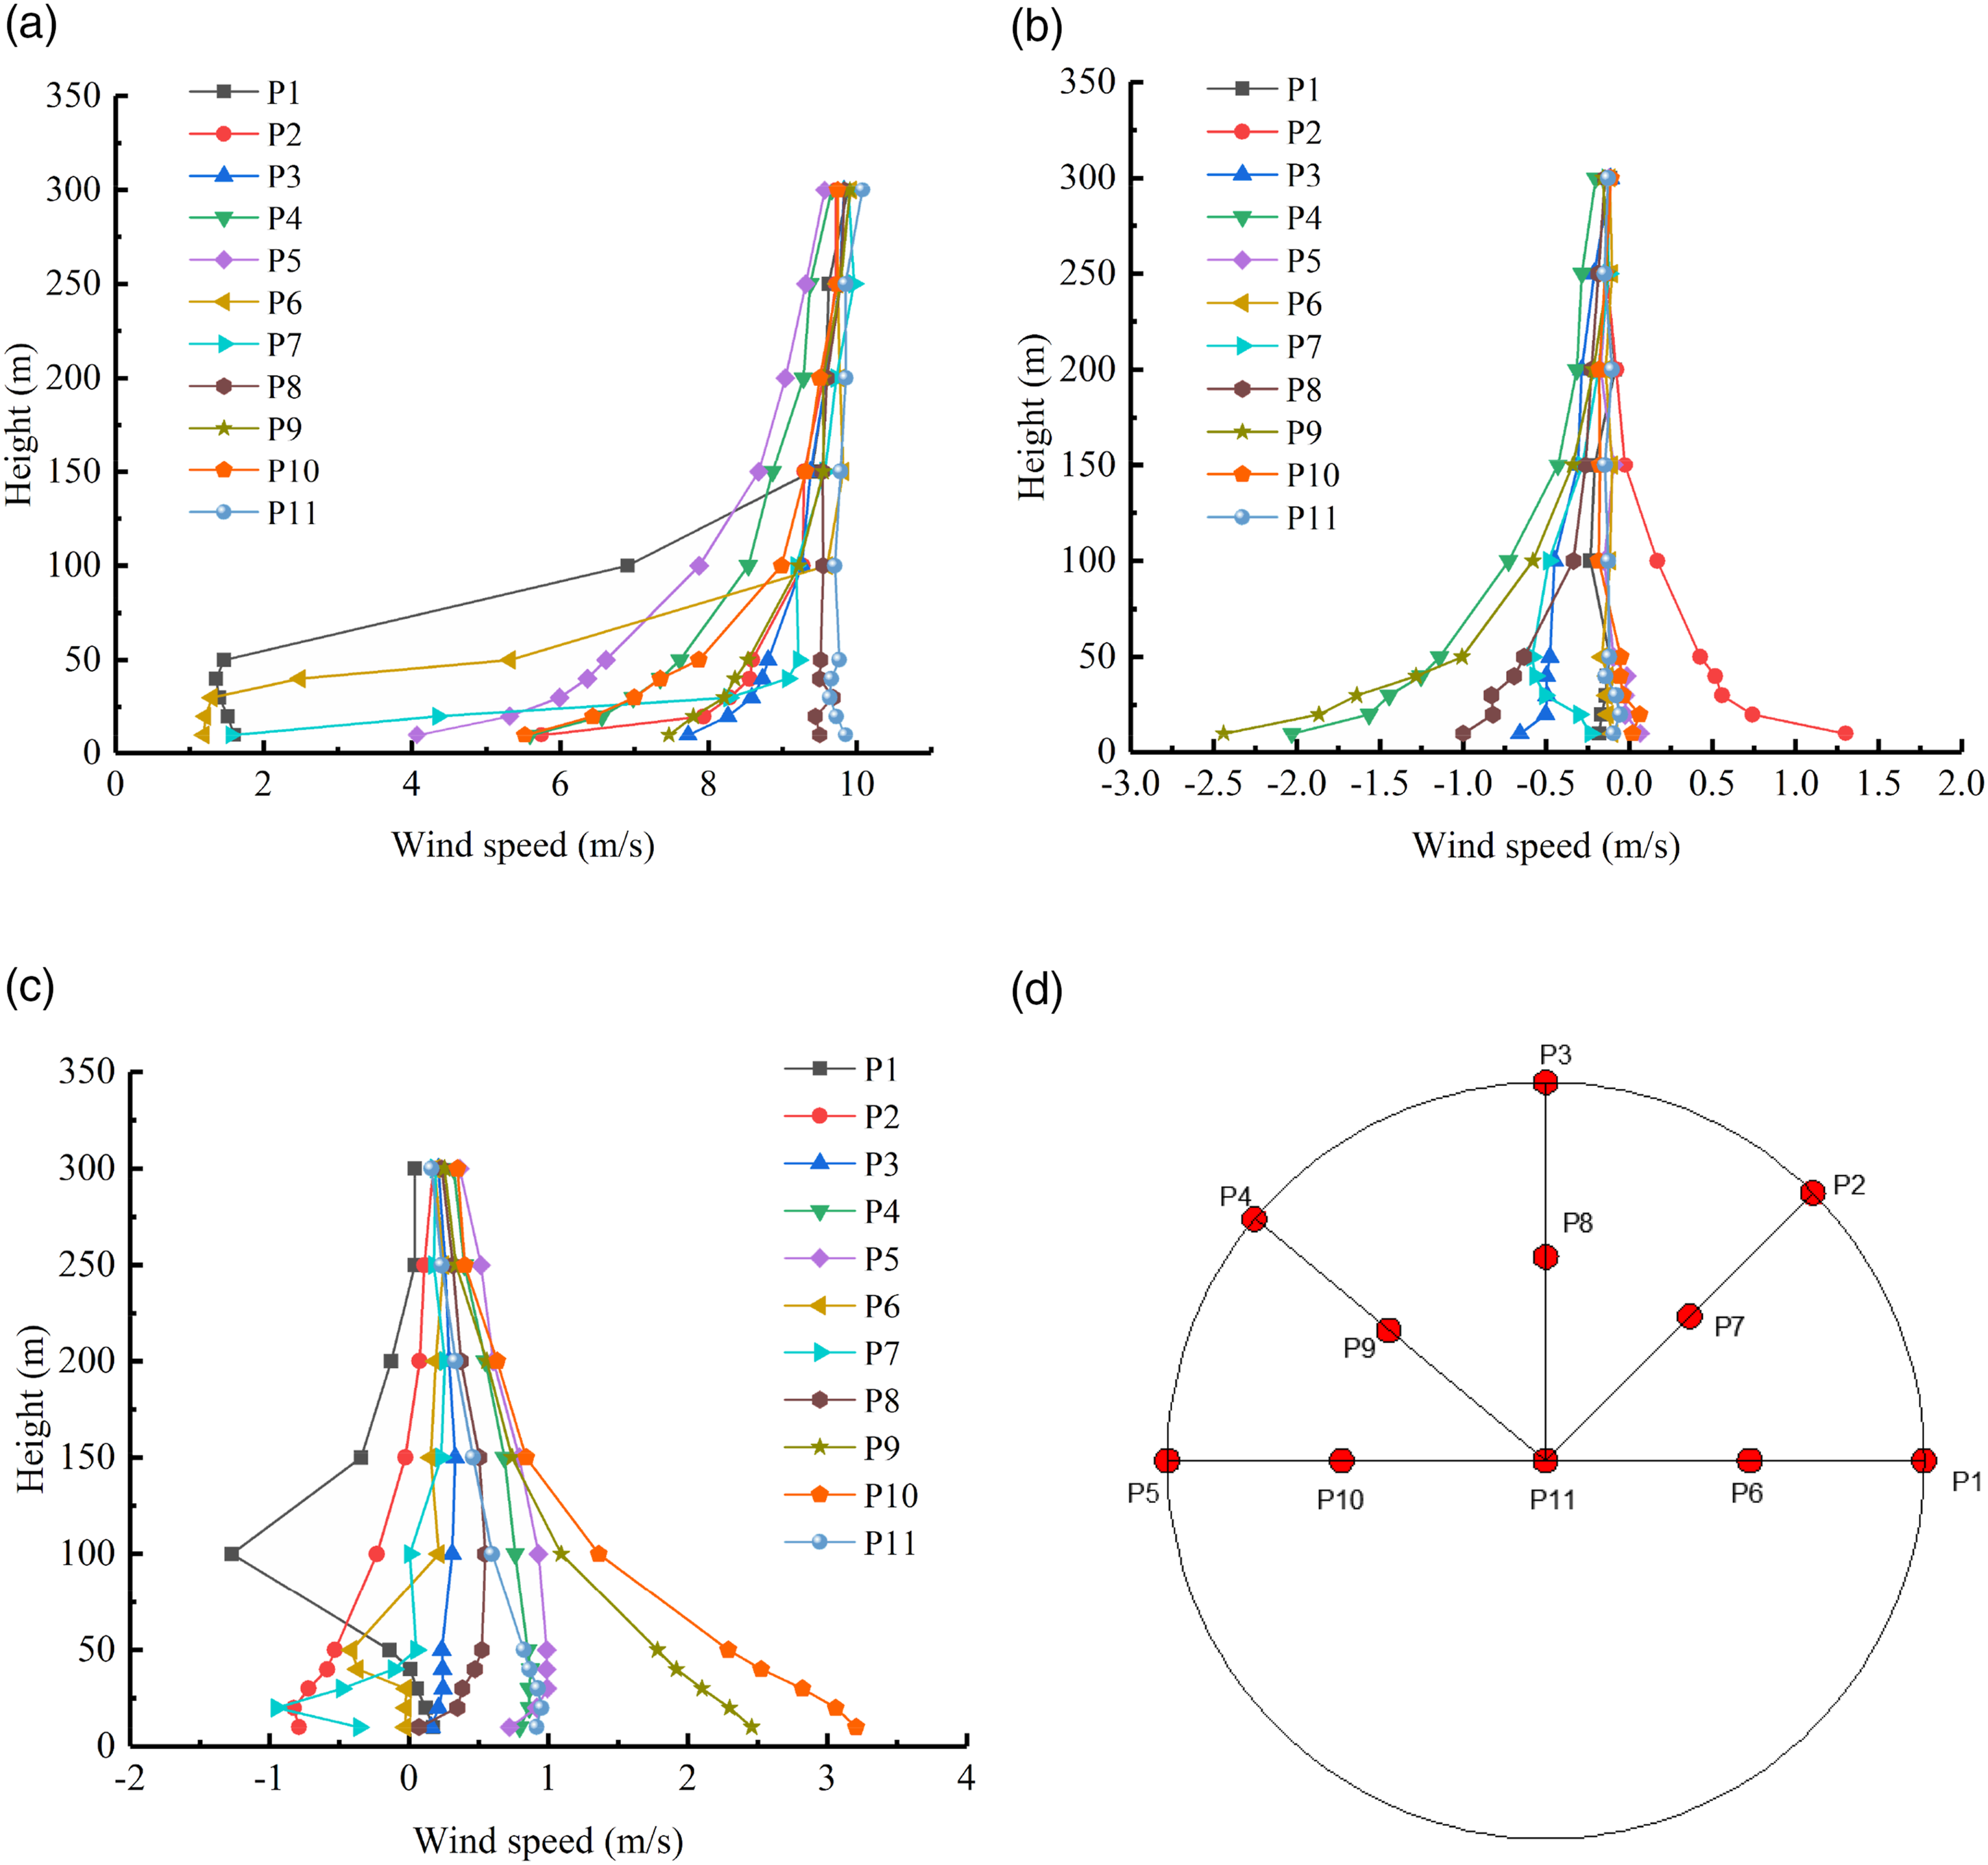
Turbulence intensity
The turbulence intensity is a critical parameter to determine the fluctuating wind loads that characterize wind speed fluctuations. It is defined as the ratio between standard deviation of fluctuating wind components and mean wind speed (10 min mean wind speed is adapted) as follows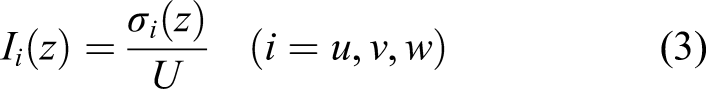
Figures 8(a)–(c) show the turbulence intensity in three directions when hill slope is 25°, respectively. It can be seen that the turbulence intensities I
u
, I
v
, and I
w
are scattered between 5% and 45%. The comparison of the turbulence intensity in three directions is I
u
> I
v
> I
w
, which is consistent with the study of Lou et al. (2020). Figure 8(d) shows the turbulence intensity of different slopes on the top of hill. It is found that the turbulence intensity in three directions decreases with the increase of height. Turbulence intensity: (a) longitudinal turbulence intensity, (b) lateral turbulence intensity, (c) vertical turbulence intensity, and (d) turbulence intensity of different slopes on the top of hills.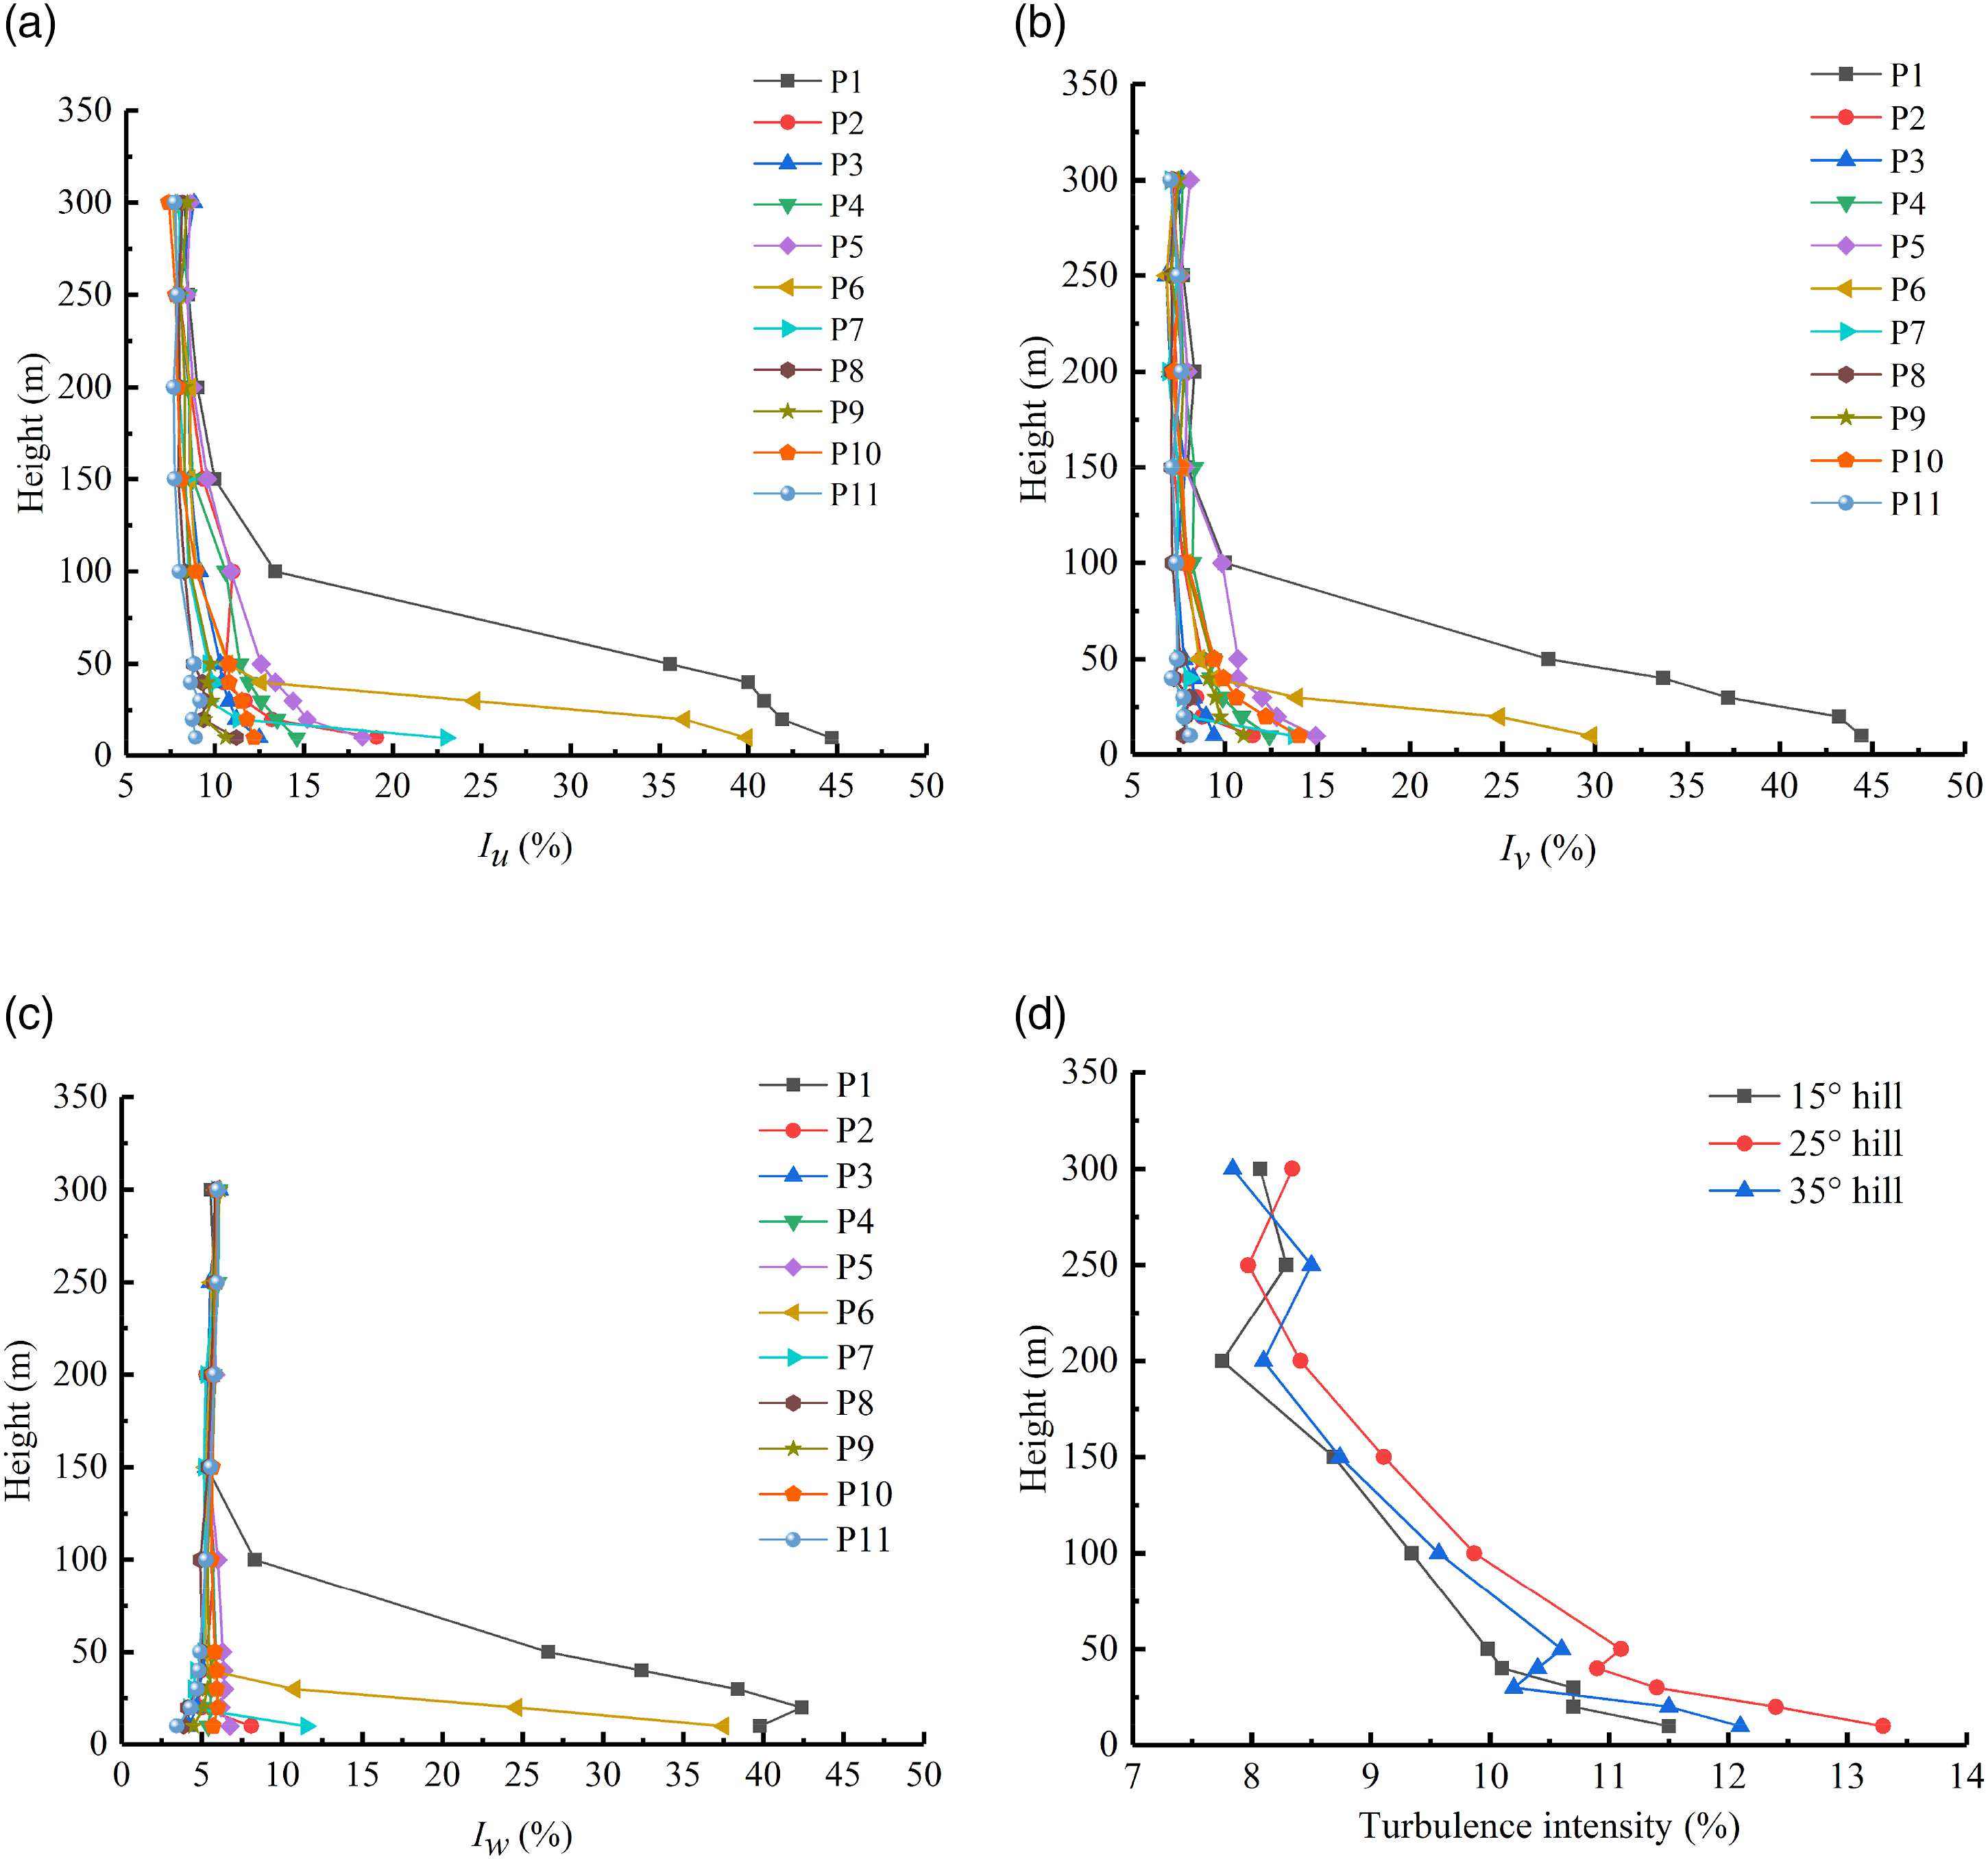
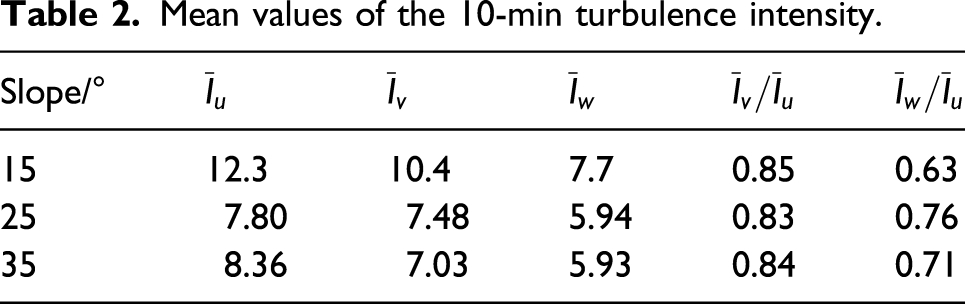
Mean values of the 10-min turbulence intensity.
Effects of the transmission tower on wind field characteristics
The transmission tower model with height 56 cm is fabricated as a rigid model with a geometric scale of 1/100 based on the discrete stiffness method (Huang et al., 2012). To study the effects of the transmission tower on the wind field, the rigid tower model is put on the hill as shown in Figure 3.
The influence of the presence of the tower on the wind speed is first studied. After mounting the tower model on the hilltops, the wind speeds of leeward and windward sides are measured and plotted in Figures 9(a) and (b), respectively. Superscript * in the figure indicates the hill with a transmission tower. The figure shows that for leeward slope, the existence of the tower does not change the wind speed much when the height is less than 100 m. However, the transmission tower reduces the wind speed by 20% on average when the height is above 100 m. For the windward slope, the tower has little effect on the wind speed. The influence of the tower on the leeward side is greater than on the windward side because of the vortex shedding phenomenon on the leeward side of the tower. Besides, the difference of wind speed above 100 m may be due to the existence of vertical speed component on the leeward side, as shown in Figure 9(c), which is obtained from the wind tunnel tests. Wind speed on the hill: (a) the leeward side of the hill at P10, (b) the windward side of the hill at P6, and (c) the vertical speed component of the hill at P10.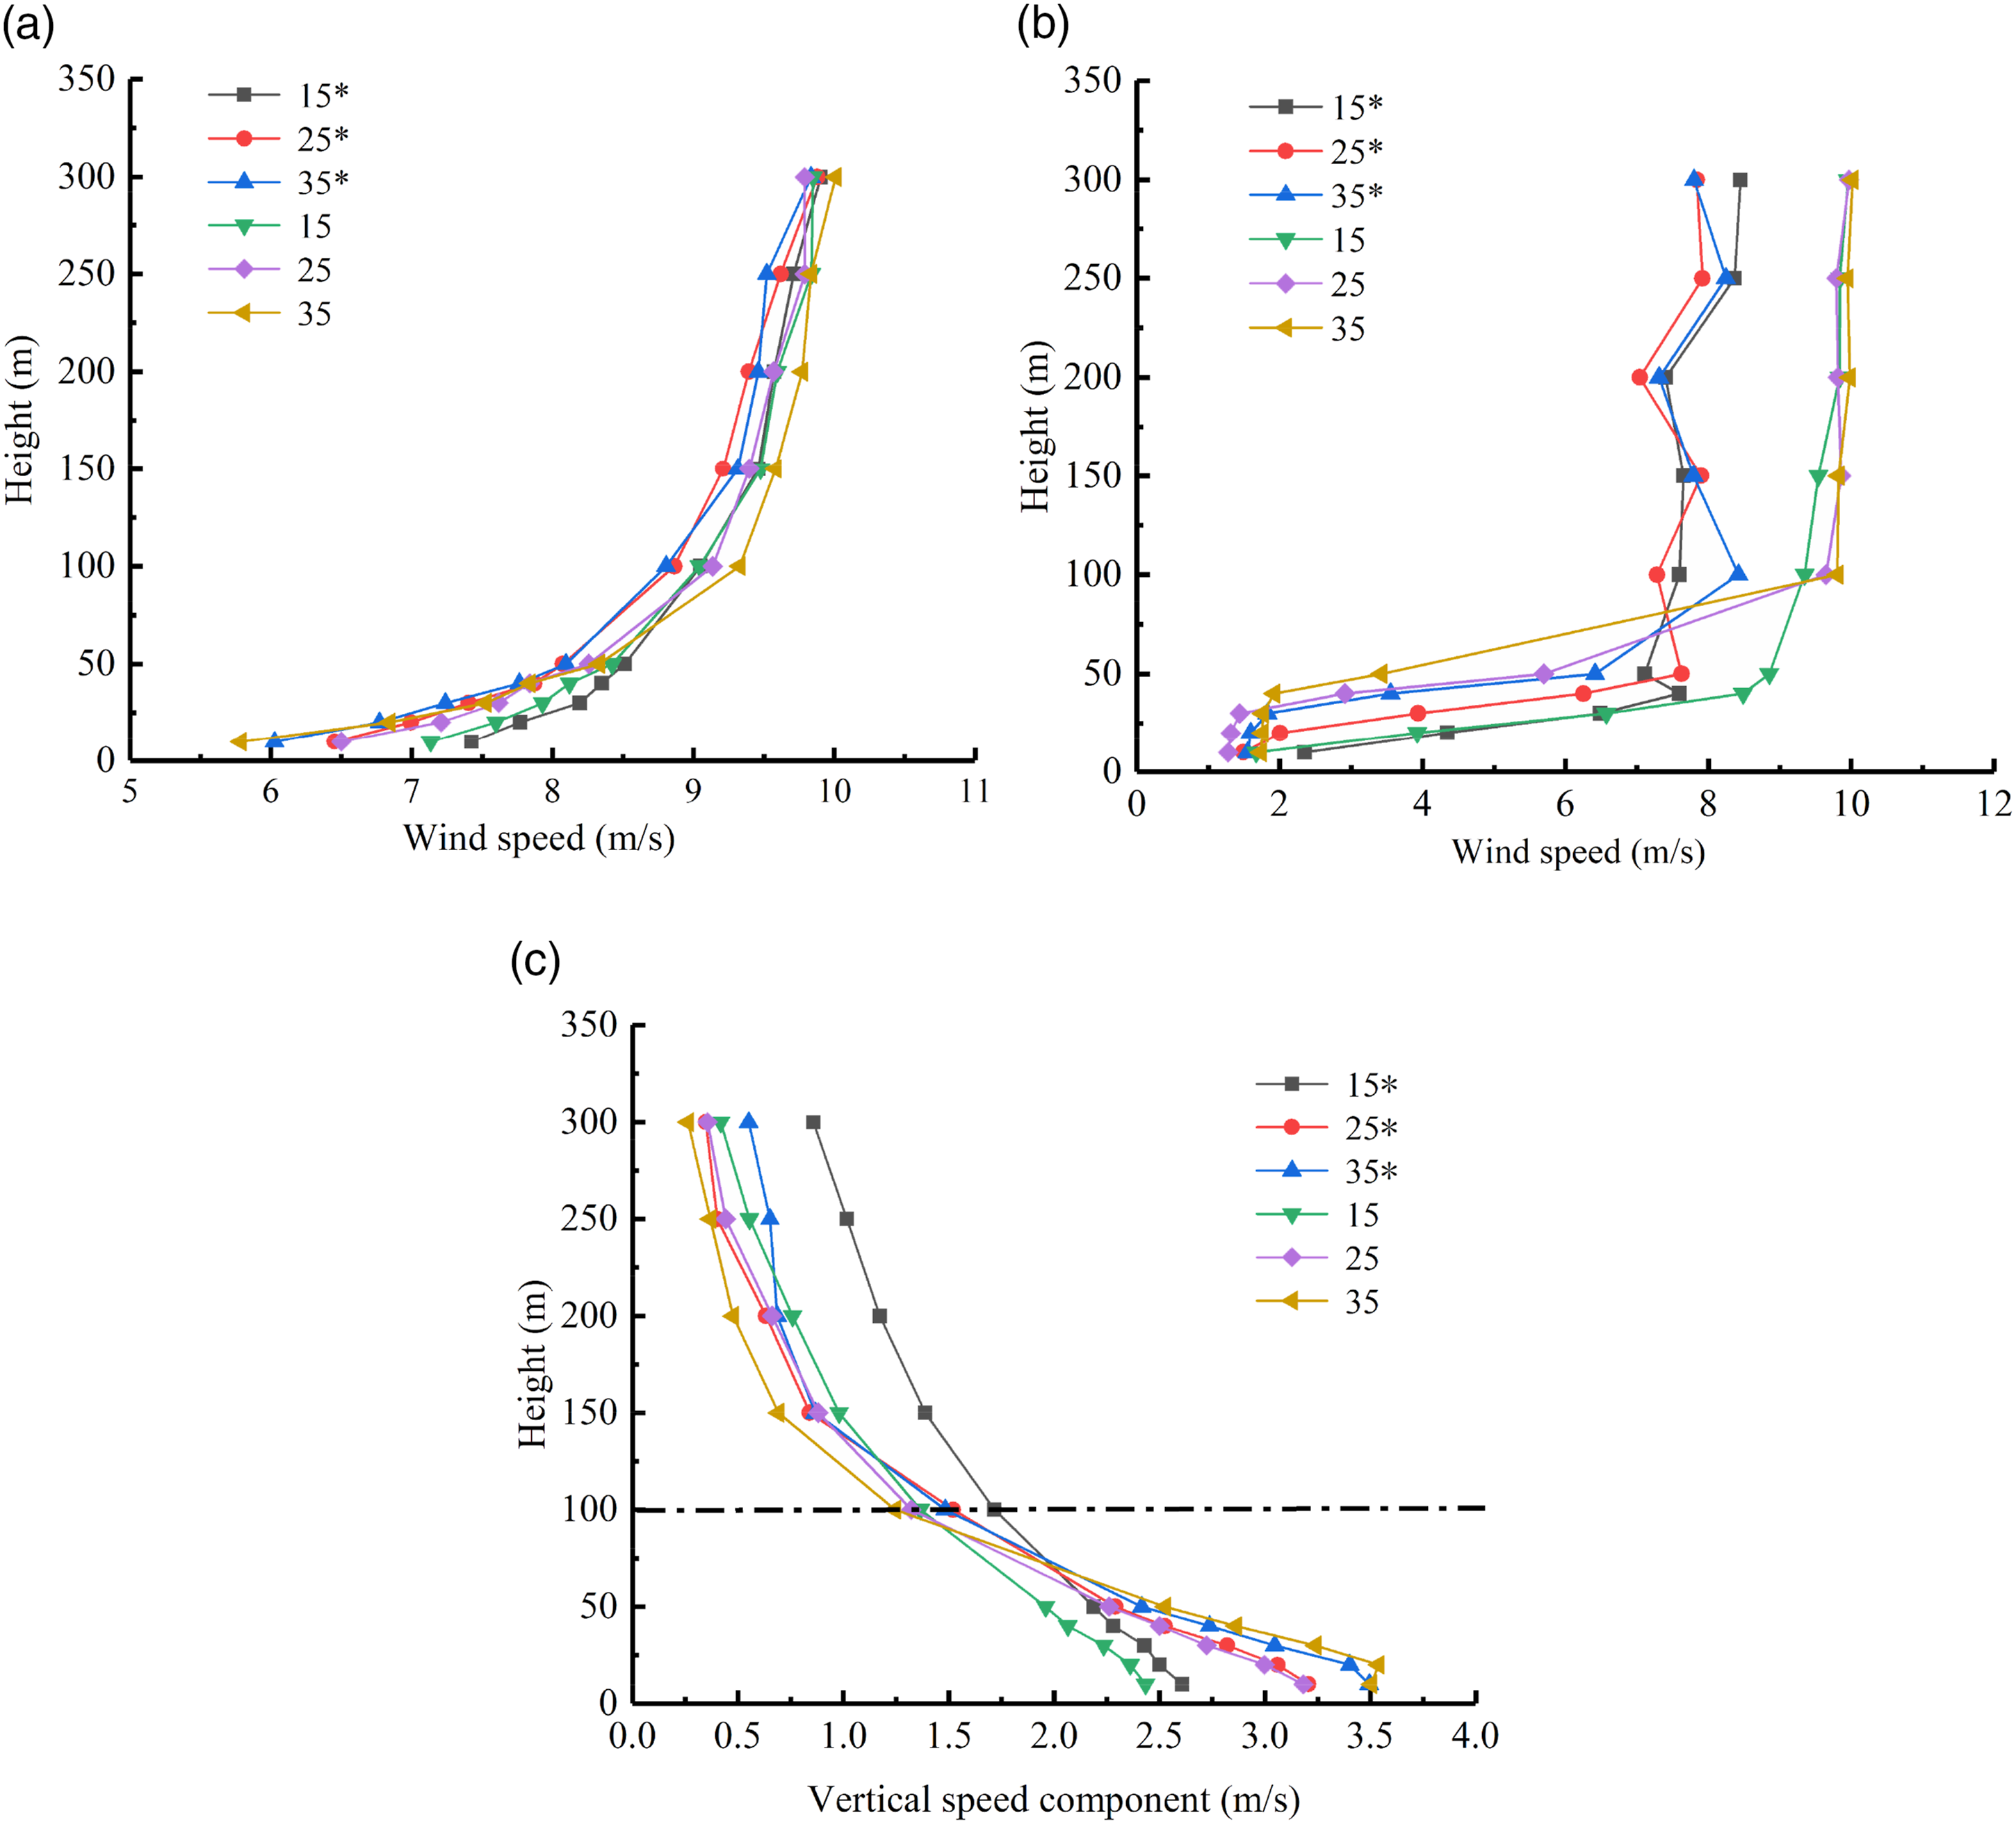
The turbulence intensity of wind field near the transmission tower is further investigated. Figure 10 shows the turbulence intensity of hill with a transmission tower at different measuring points when the hill slope is 25°. The X represents the horizontal distance between each measuring point and the measuring point P11. It can be seen from the Figure 10 that the change of the turbulence intensity on the windward side is faster than that of the leeward side, which is related to the flow separation of the leeward side. The large discrepancy among values is attributed to the presence of flow separation (Bitsuamlak et al., 2004). Three-directional turbulence intensity for hill slope of 25°: (a) longitudinal turbulence intensity, (b) lateral turbulence intensity, and (c) vertical turbulence intensity.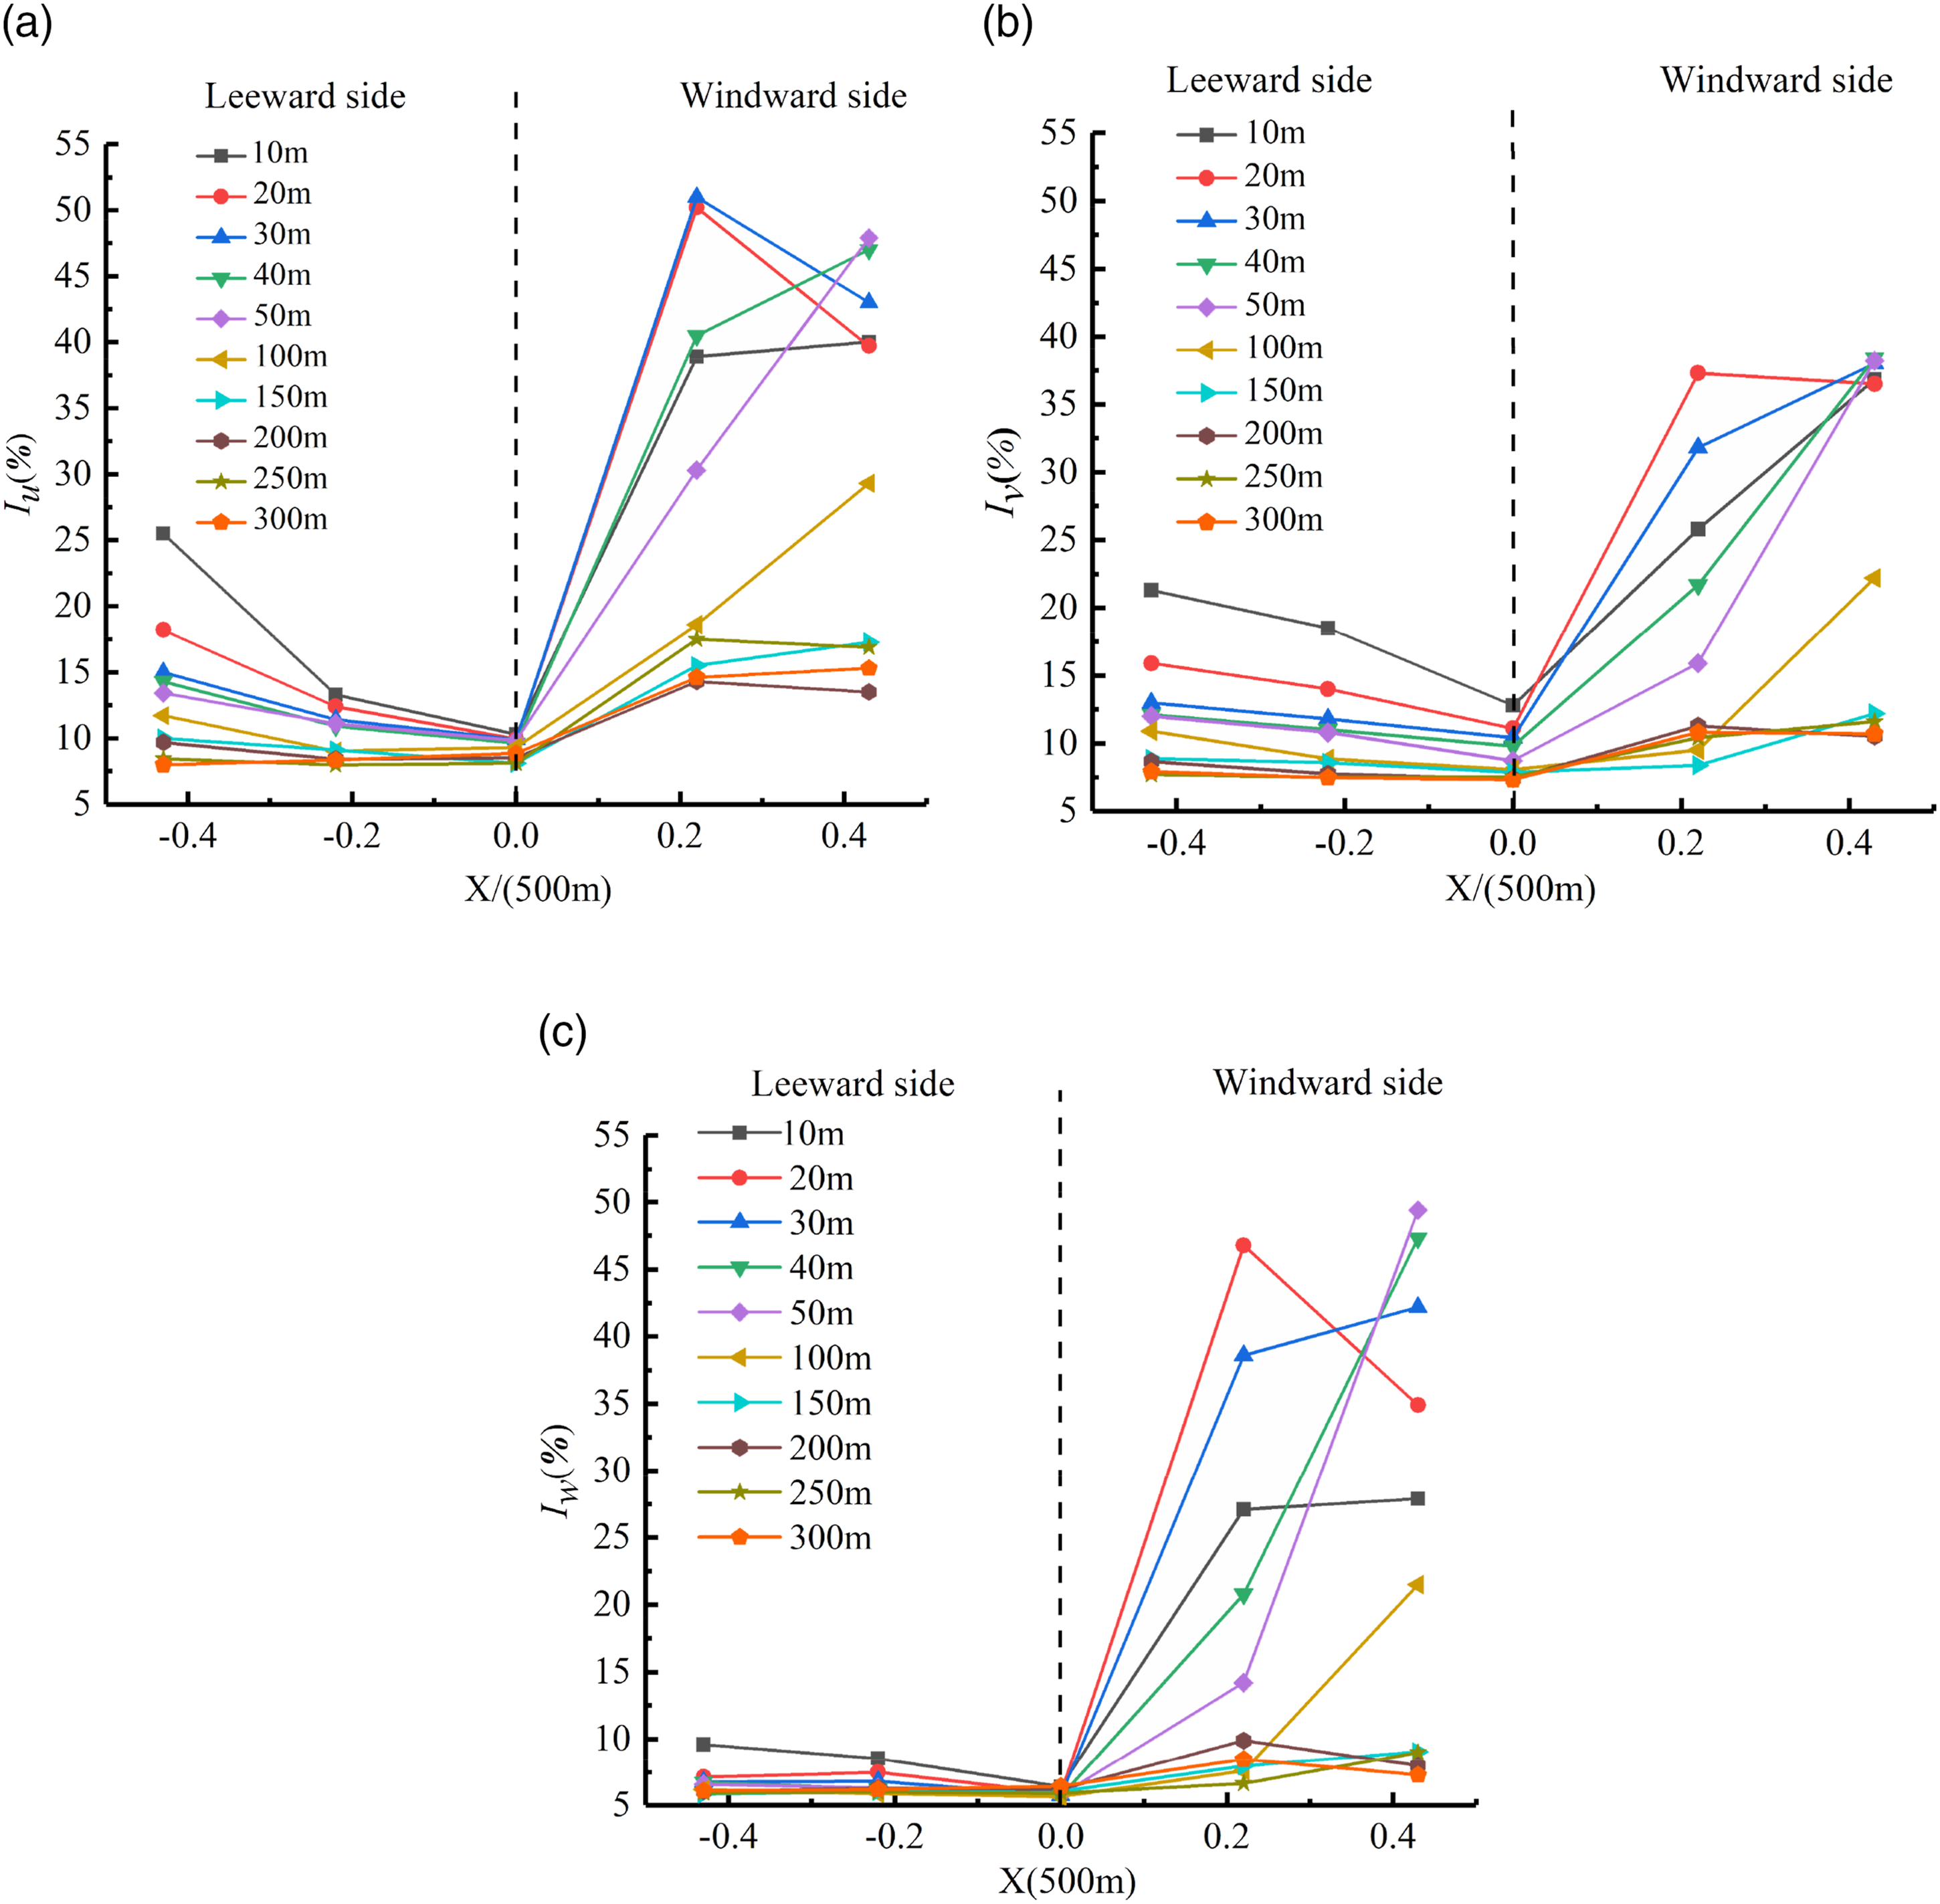
Dynamic analysis of transmission tower
From the above experimental studies, it is found that there is a certain difference in the ratio of turbulence intensity for different hill slopes, which would lead to different dynamic behaviors of transmission tower. Therefore, the dynamic analysis of transmission tower is carried out.
Numerical modal analysis
The finite element modeling has been recognized as an effective tool for dynamic analysis. The transmission tower is a flexible structure and sensitive to wind loads. In addition, the analysis of dynamic modes can more fully express the varying of structure under wind loads. In finite element modeling with ANSYS 19.0, beam element 188 is used to establish the finite element model of transmission tower, which can well reflect the structure characteristics. The elastic modulus of the material is 2.1 × 10¹¹ Pa, the density is 7800 kg/m3, and Poisson’s ratio is 0.3. The finite element model of the tower built is shown in Figure 11. The finite element model.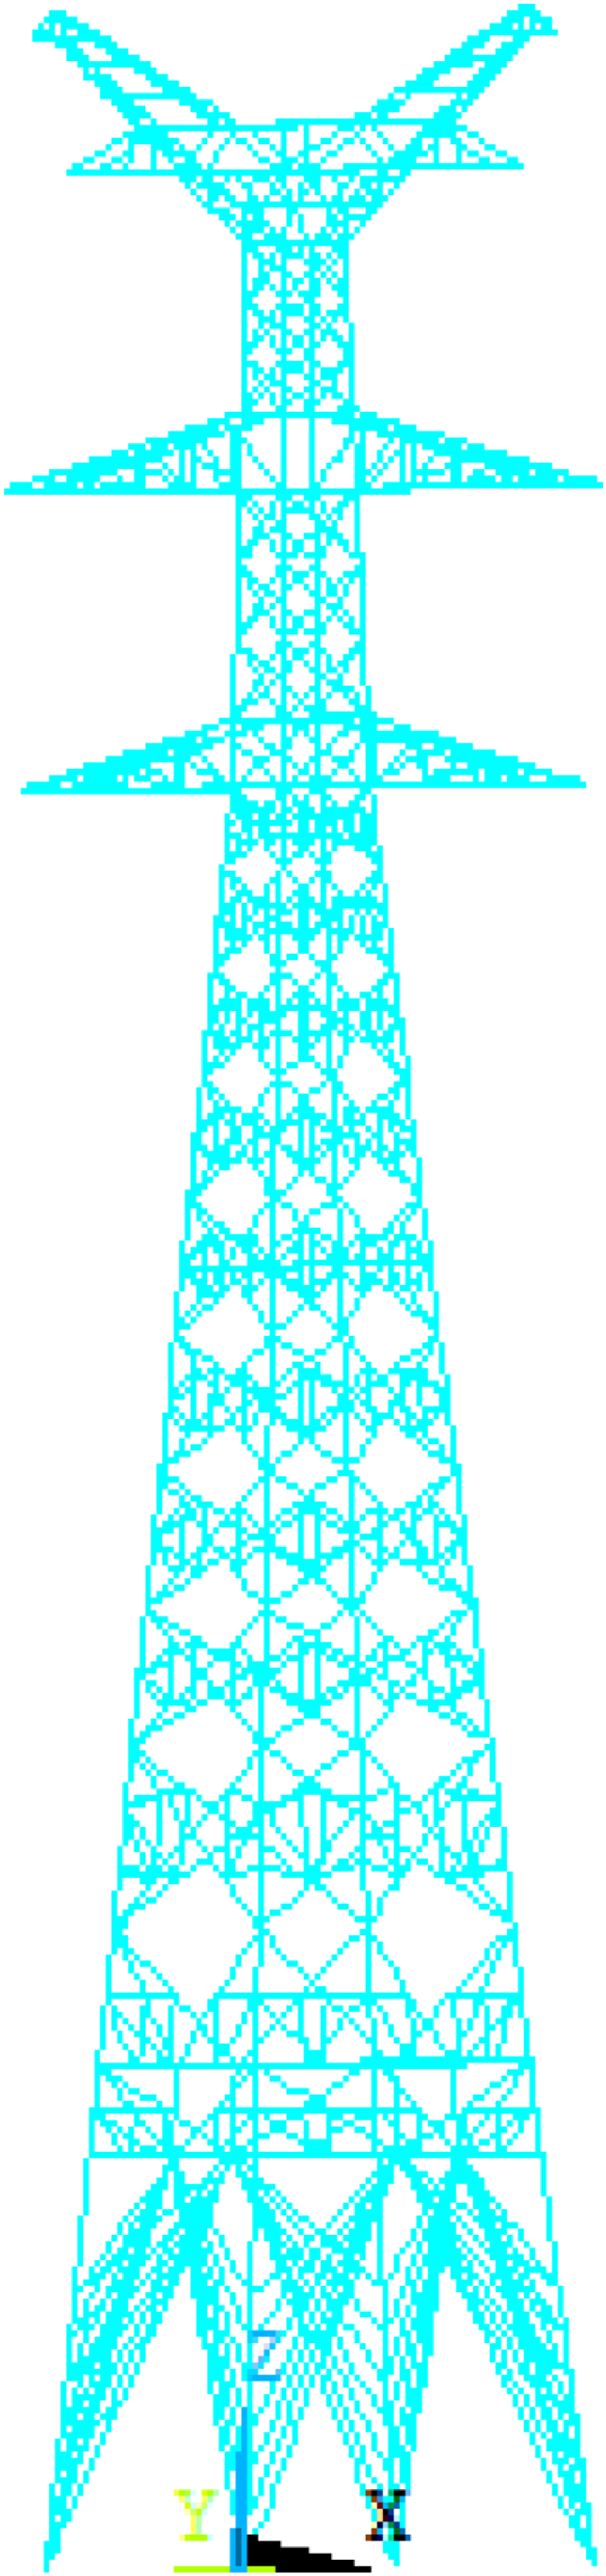
Numerical modal analysis on the model gives the first four natural frequencies of the tower as 0.99 Hz, 1.43 Hz, 1.76 Hz, and 2.87 Hz, respectively. The corresponding modal properties are shown in Figure 12. First four mode shapes: (a) first mode, (b) second mode, (c) third mode, and (d) fourth mode.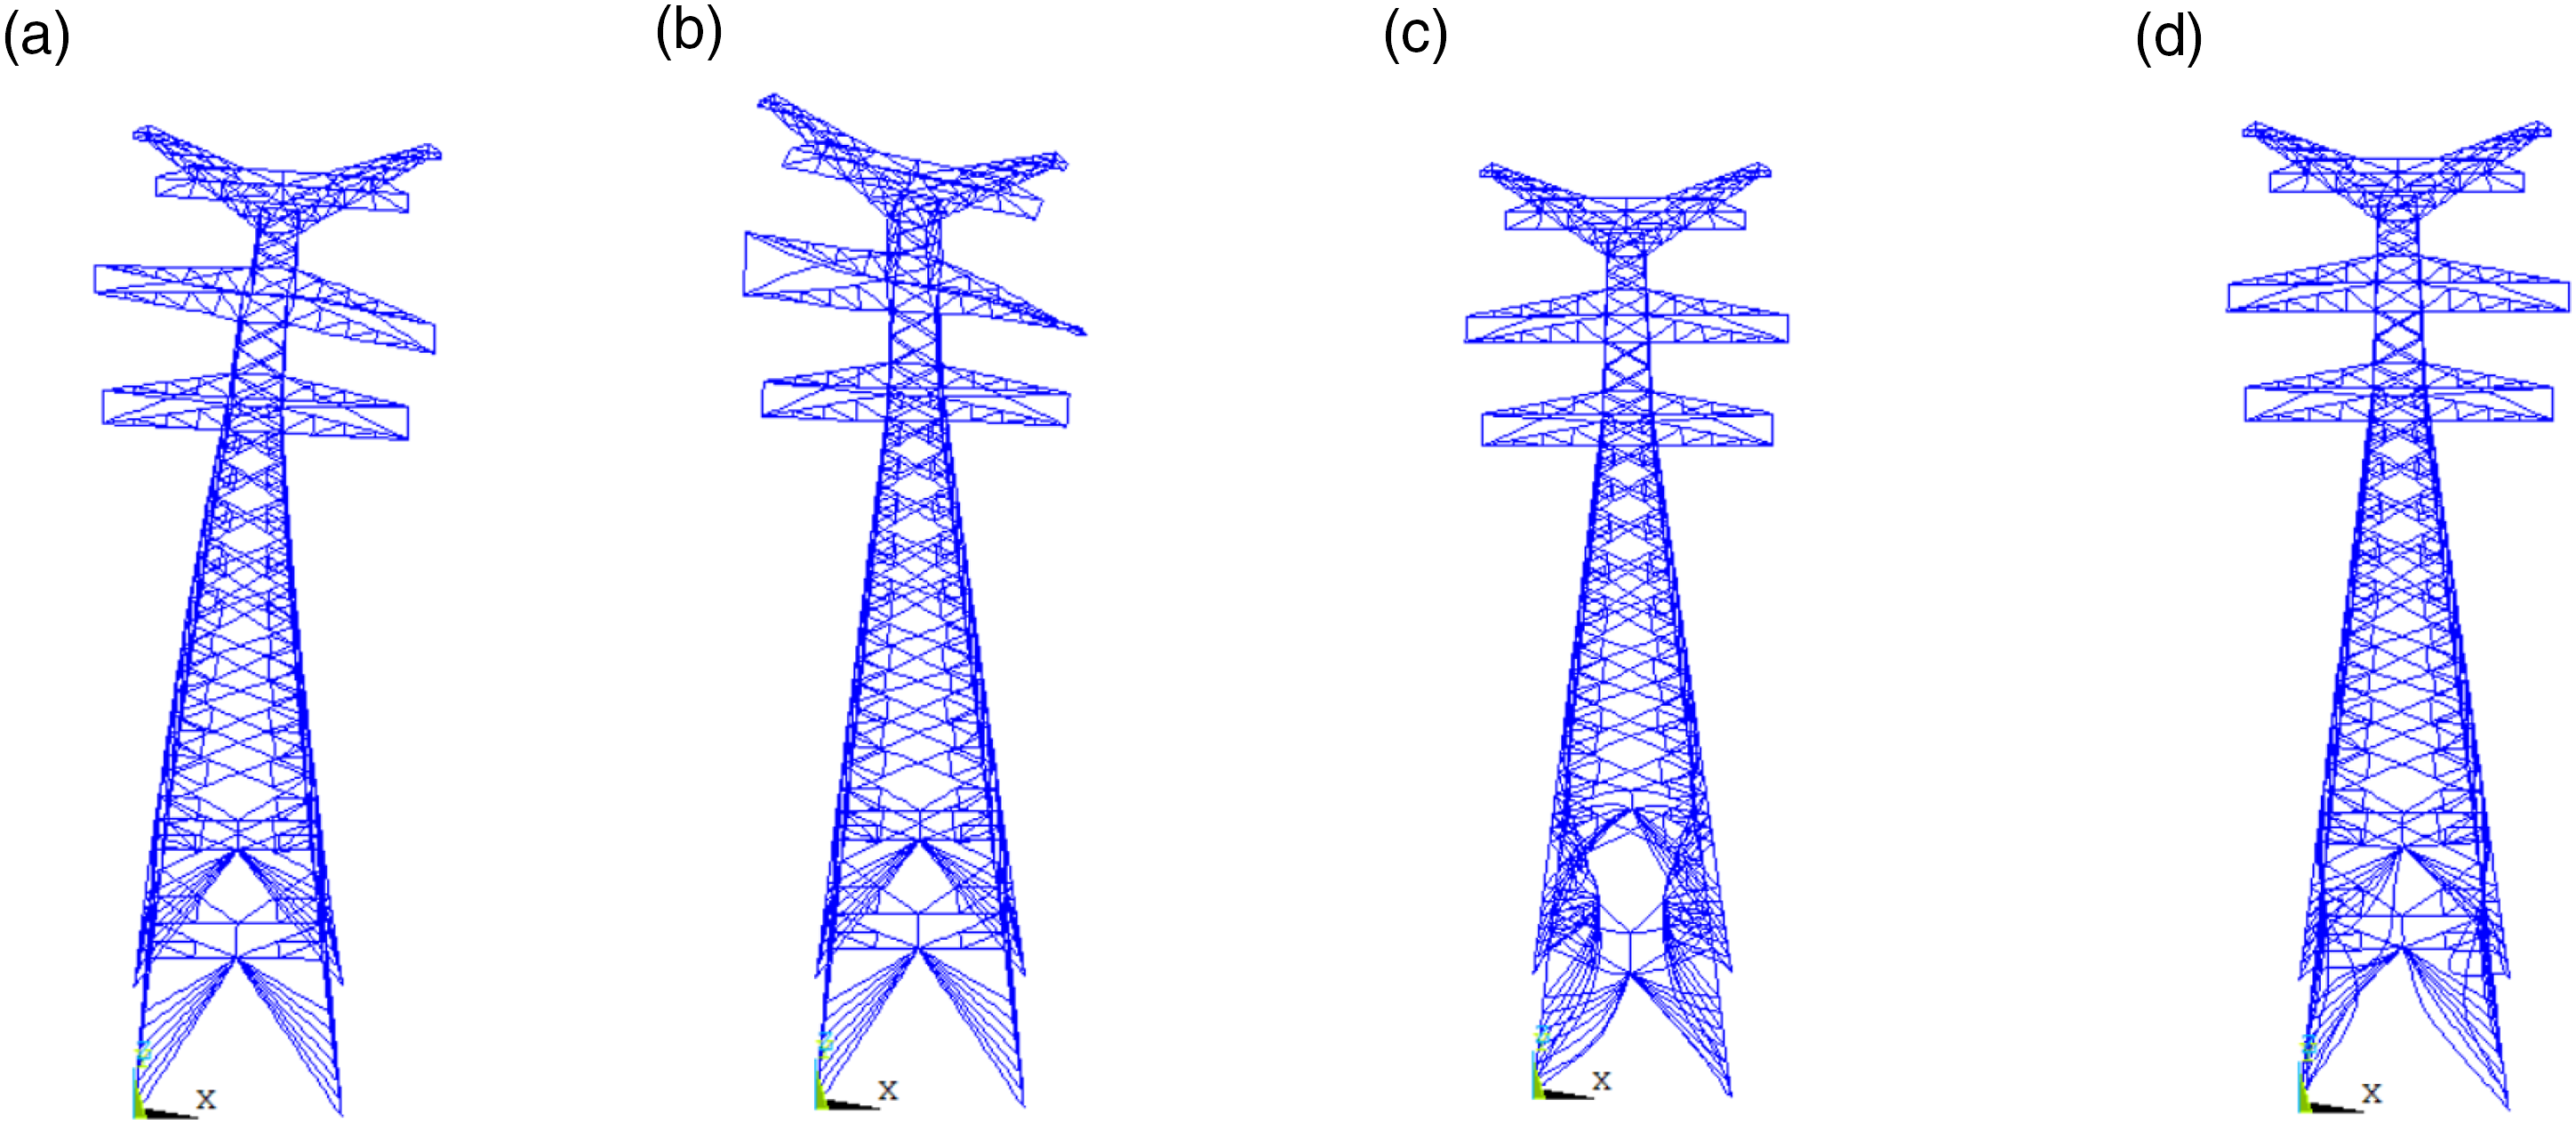
Wind load input on the tower
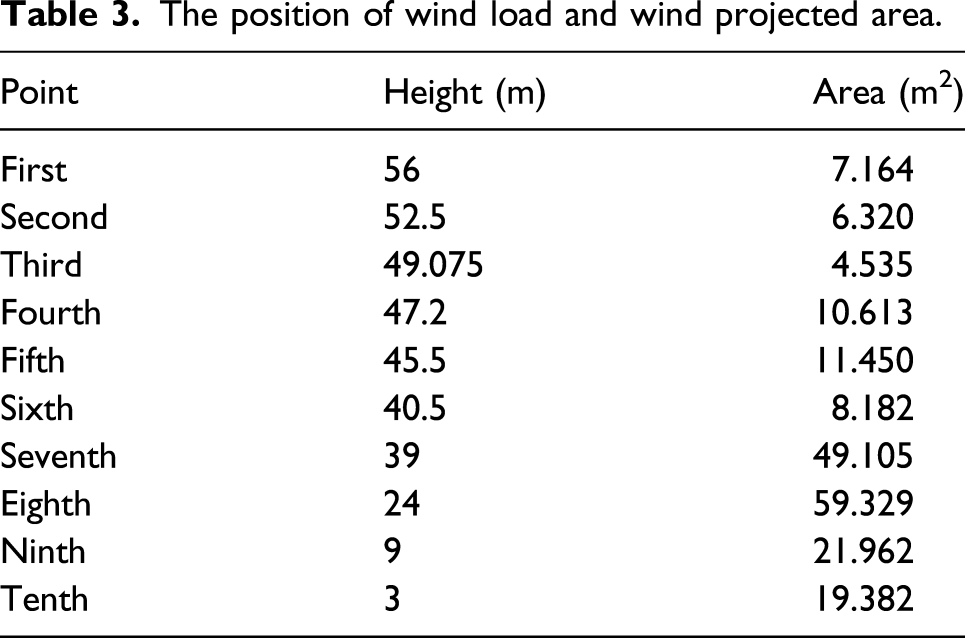
Calculating the wind loads at all points of a transmission tower model is difficult and unnecessary. Therefore, the tower is simplified to 10 nodes that are used to generate the wind speeds, as shown in Figure 13. Most of the existing studies adopted simulated wind speed on the transmission tower (Fu et al., 2019). To investigate the dynamic response of the transmission tower more practically, a combination of test measurement and simulation is used to consider the wind loads in this study. Simplified points for wind load on the transmission tower.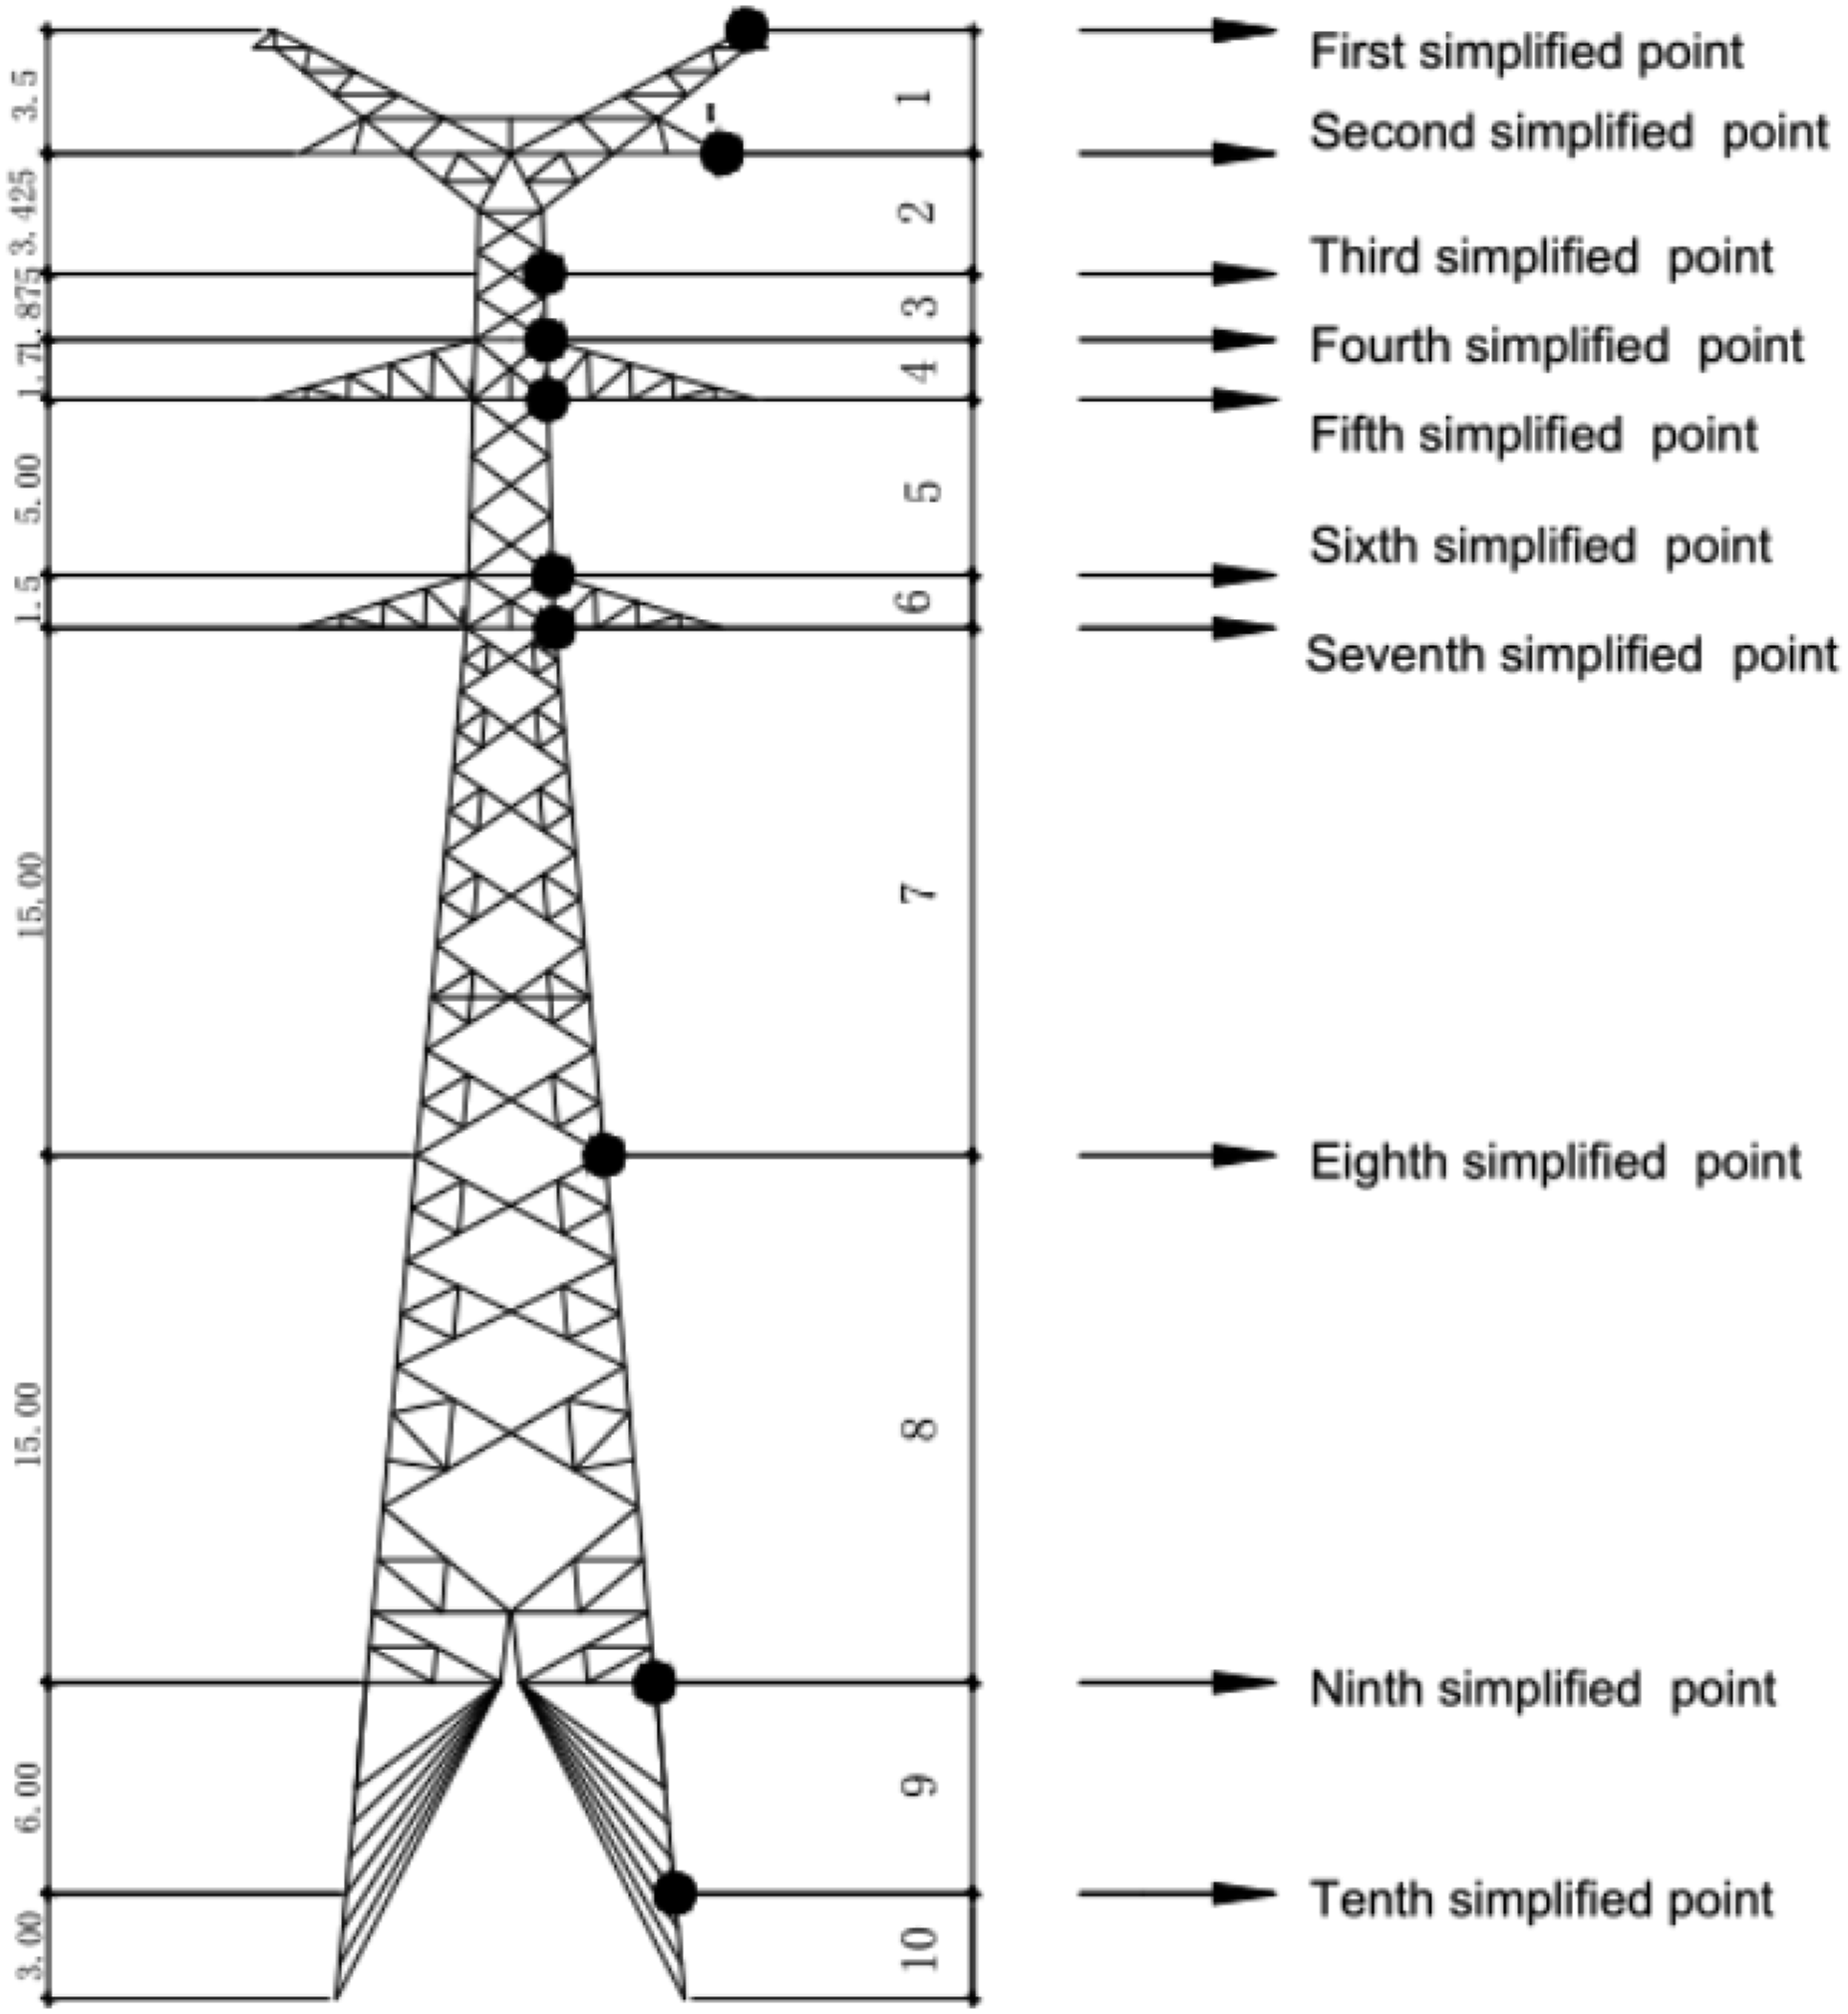
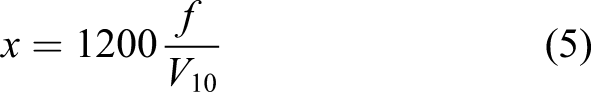
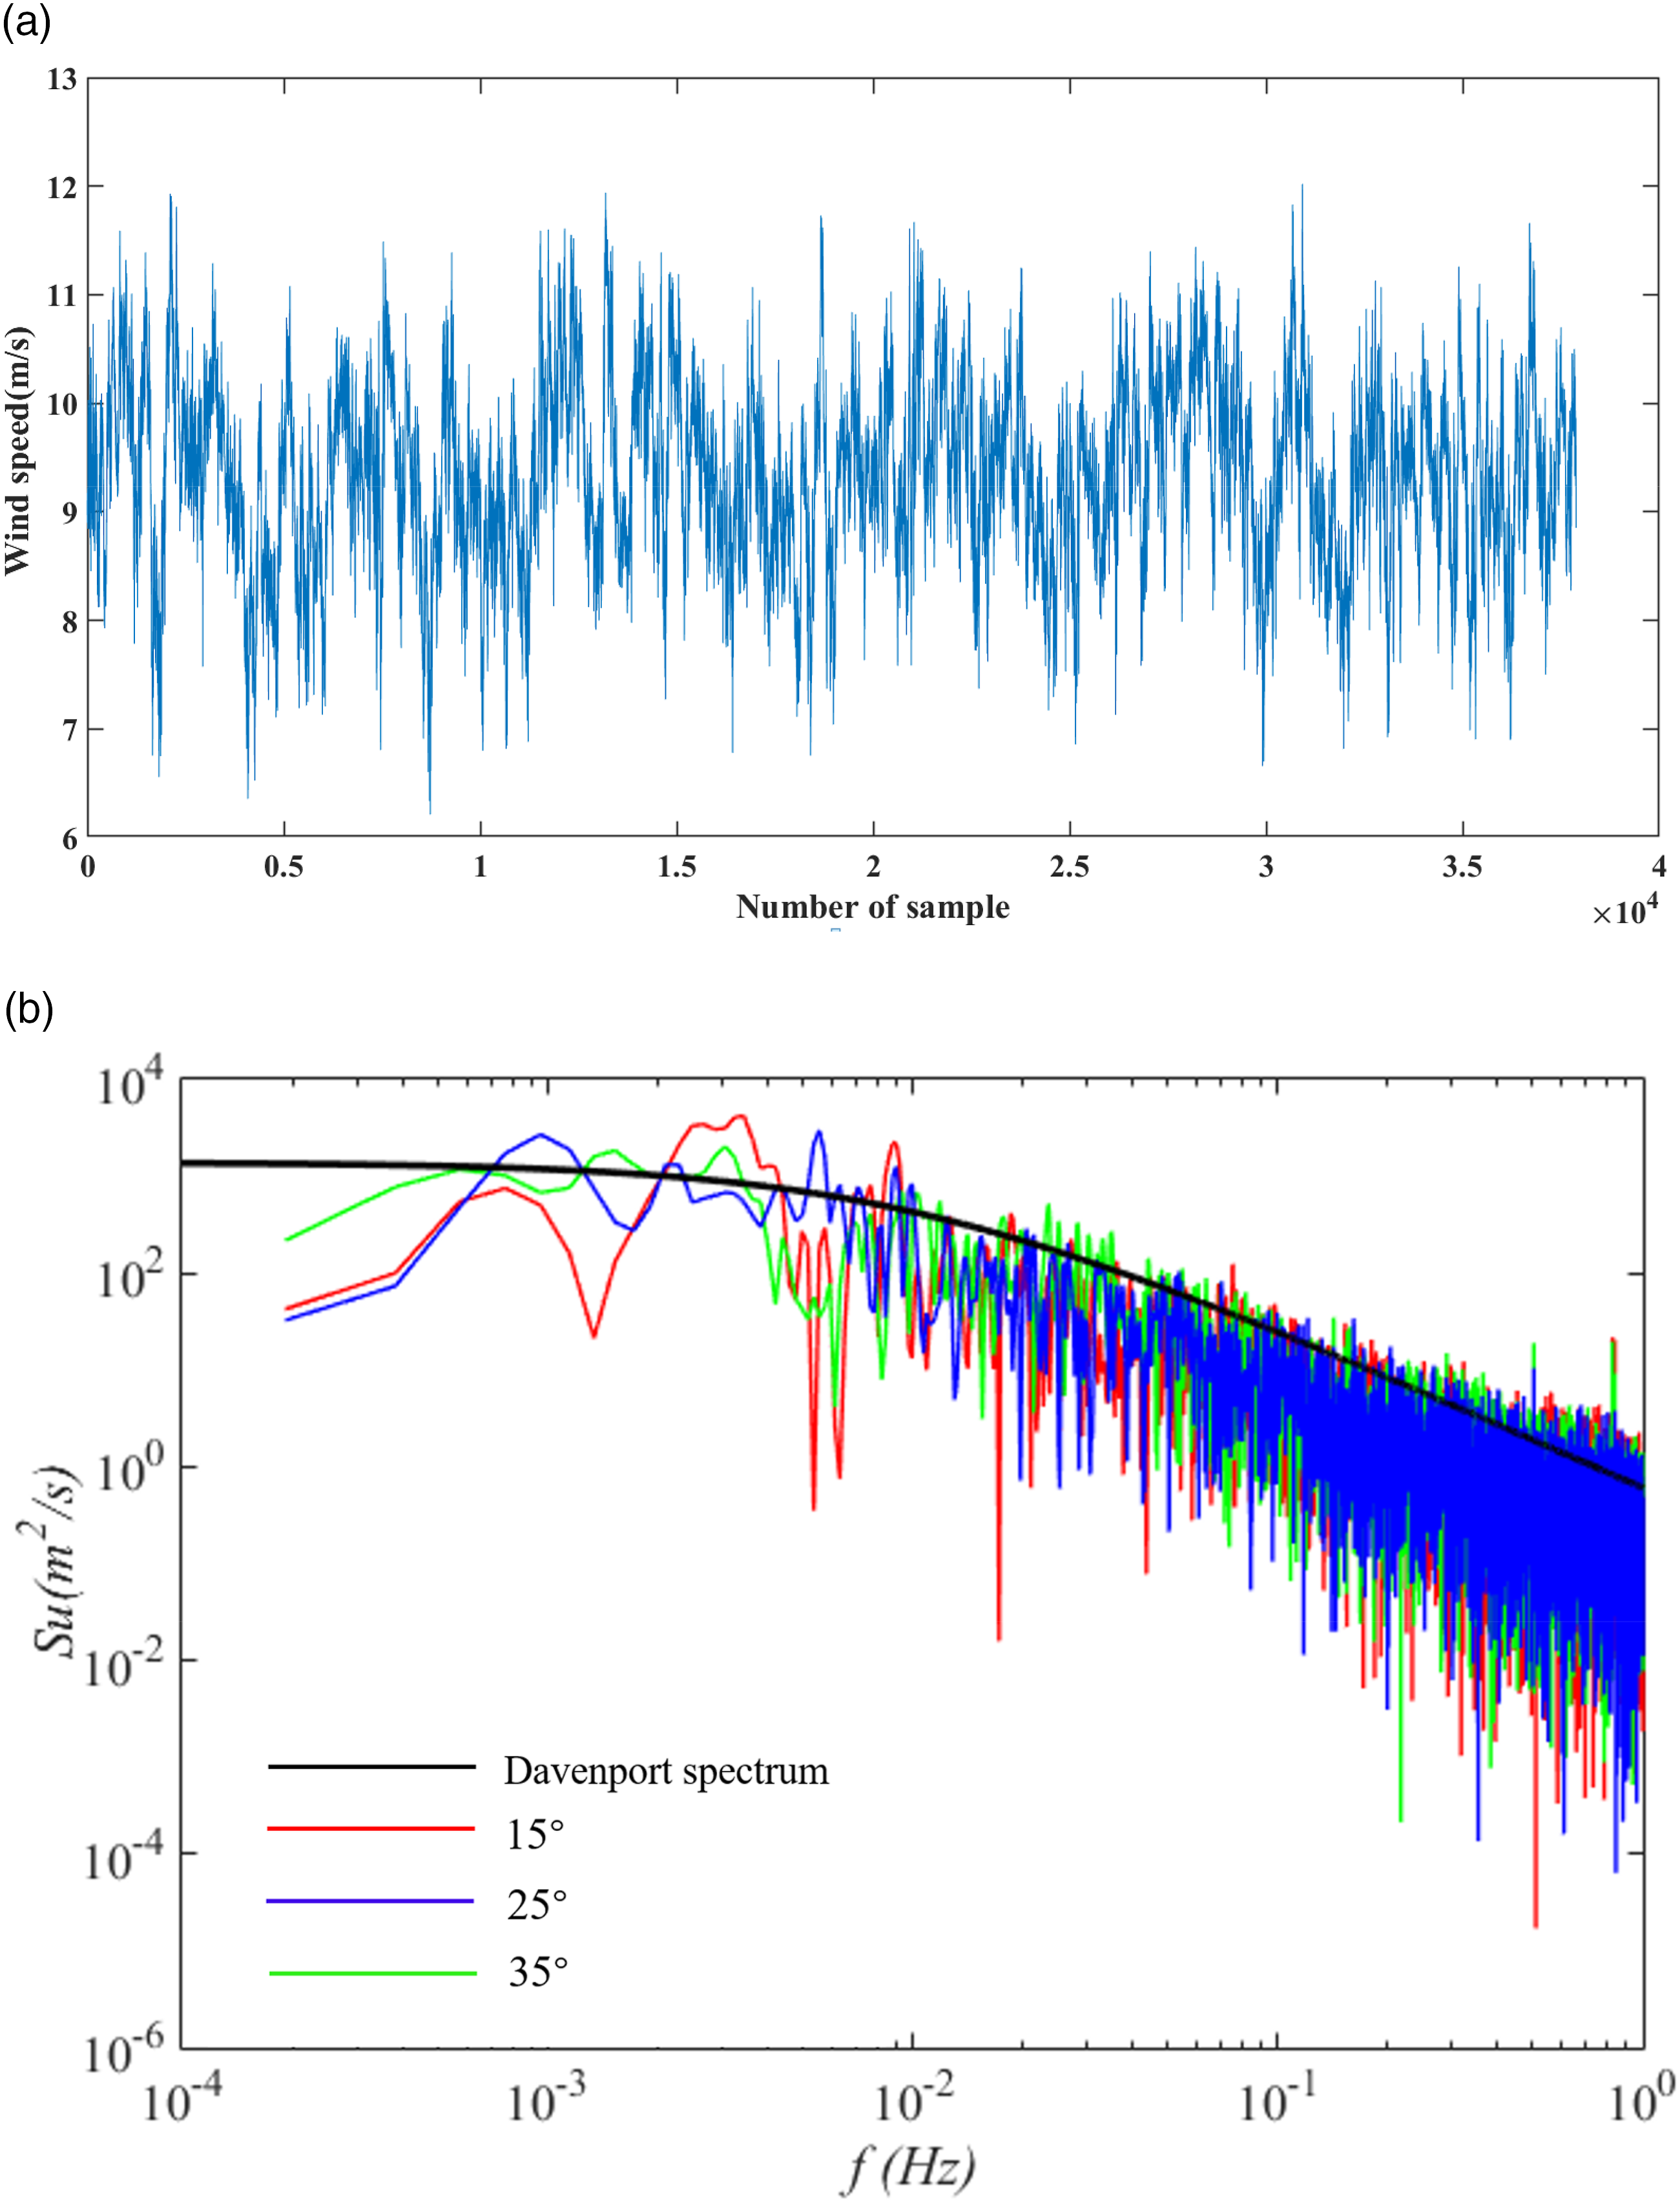
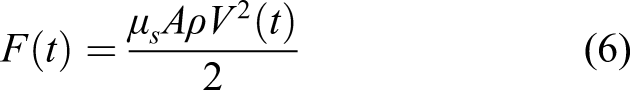
The measured wind speed of the first point of transmission tower is depicted in Figure 14(a), and the wind spectra are shown in Figure 14(b). In Figure 14(b), it can be seen that the wind spectrum from tests, which is consistent to the Davenport spectrum (Davenport, 1961). Therefore, the fluctuating components of the wind speed for the critical points are simulated using the Davenport spectrum which is expressed as following (Zhang et al., 2017) The wind speed time history and power spectra: (a) time history of measured wind speed (the slope of 25°) and (b) power spectra.
The position of wind load and wind projected area.
Transient dynamic response analysis
Transient dynamic analysis in ANSYS is a powerful tool to analyze structural dynamic characteristics (Guo et al., 2020b). The methods include complete method (Satheesh et al., 2020), reduction method (Tian et al., 2018), and mode superposition method (Bahramirad et al., 2015). The complete method uses the complete system matrix to calculate the transient response. It can apply different kinds of loads on the geometric model and consider various types of nonlinear characteristics. All dynamic responses such as displacement and acceleration of the structure can be obtained in one analysis. The complete method is used in the transient dynamic analysis. The boundary condition between the transmission tower and the foundation is regarded as a fixed support.
ANSYS Parametric Design Language (APDL) is an interpretive language which can be used for dynamic analysis to the built numerical models. The wind loads are added to the transmission tower model, and the transient analysis is carried out using APDL. The acceleration responses of the transmission tower at the top and the middle of the tower are obtained, as shown in Figure 15. Acceleration time history along wind direction.
Under the wind loads, the amplitude of the acceleration response of the transmission tower increases along with the height. Figure 16 presents the Power Spectral Density (PSD) of response at the top of the tower. The PSD curve indicates that the acceleration response is dominated by the first two and the fourth vibration modes. The first frequency is 0.96 Hz, that is close to the first natural frequency (0.99 Hz). The second identified frequency 1.34 Hz is close to the second natural frequency (1.43 Hz). The third obvious peak is 2.76 Hz corresponding to the fourth modal frequency from the modal analysis. The results show that the combination of measurement and simulation method correctly reflects the vibration modes and frequency characteristics of the transmission tower. PSD of acceleration response of the tower.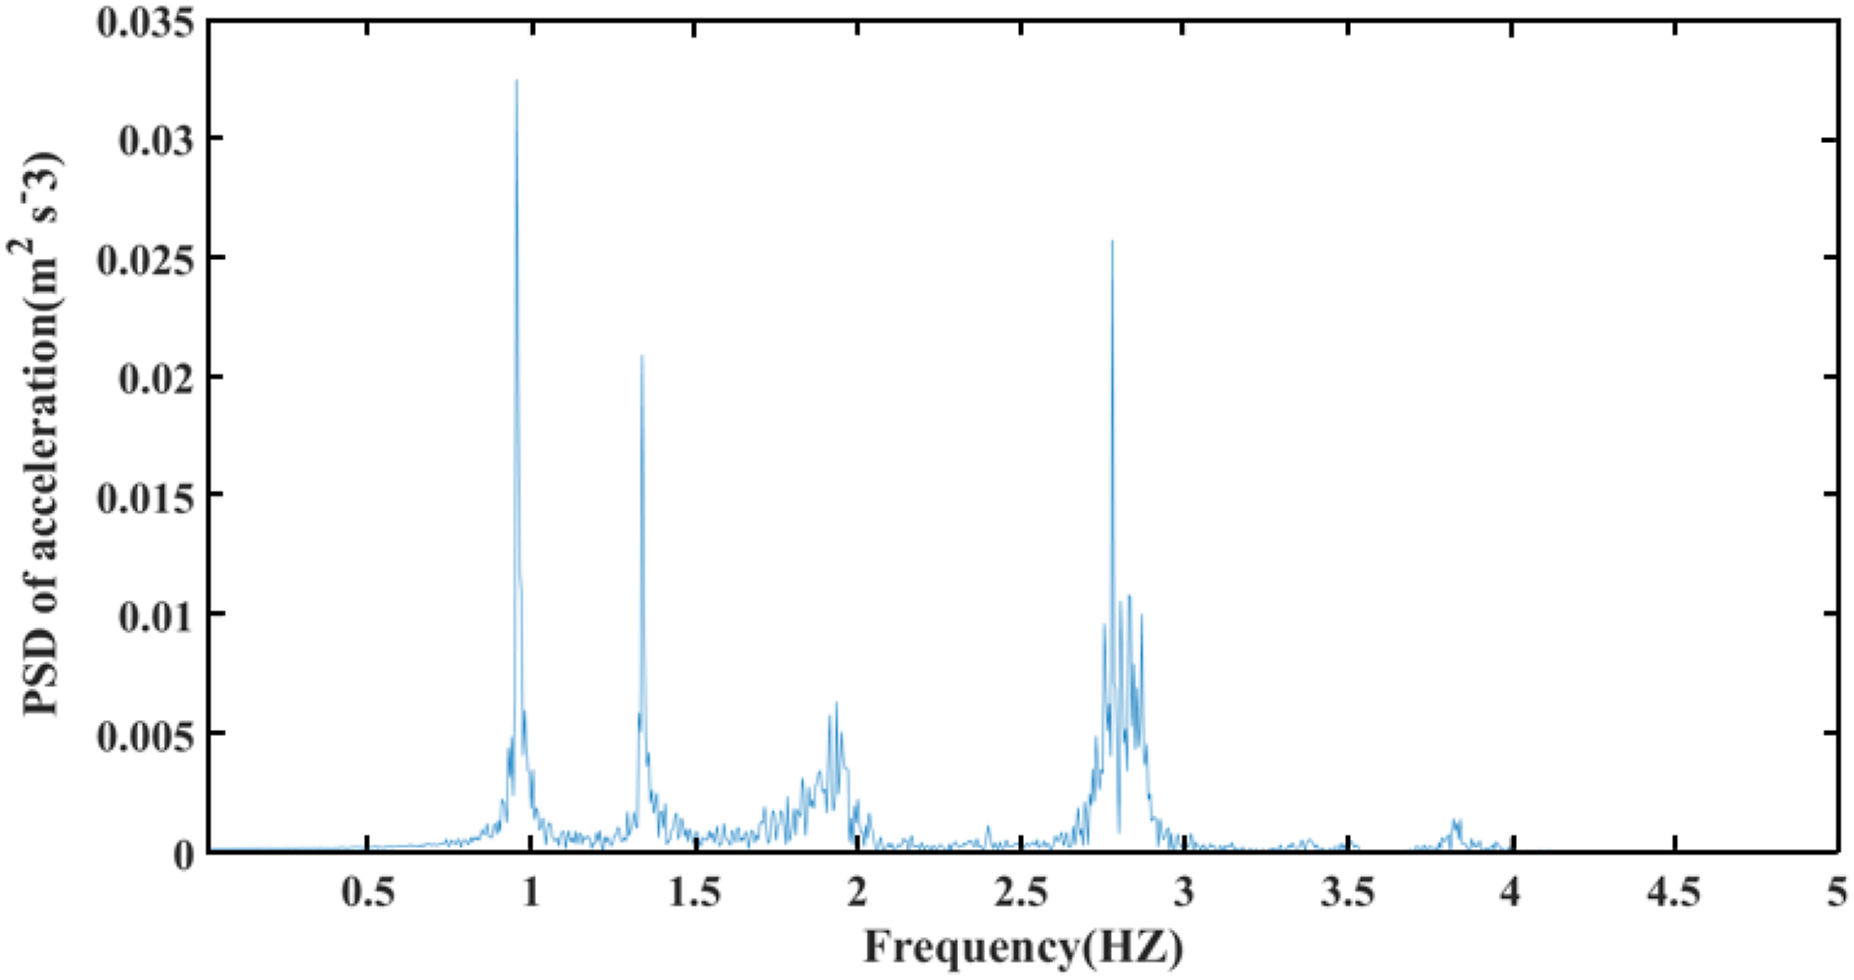
The maximum displacements of transmission tower are obtained by dynamic analysis. Figure 17 shows the maximum displacements at critical points of transmission tower considering different hill slopes. It can be observed from the figure that the displacement responses are steadily increased with the increase of height, and the maximum displacement appears on the top of the transmission tower. The maximum displacement of the transmission tower is the smallest when the slope is 15°. While, the maximum displacement is the largest when the slope is 25°. The reason can be attributed to the turbulence characteristics from the tests that the turbulence intensity is the largest when the slope is 25°, as shown in Figure 8(d). The finding is consistent with that of Bowen and Lindley (1997) and Okamura et al. (2003). Maximum displacement of transmission tower in wind flow direction.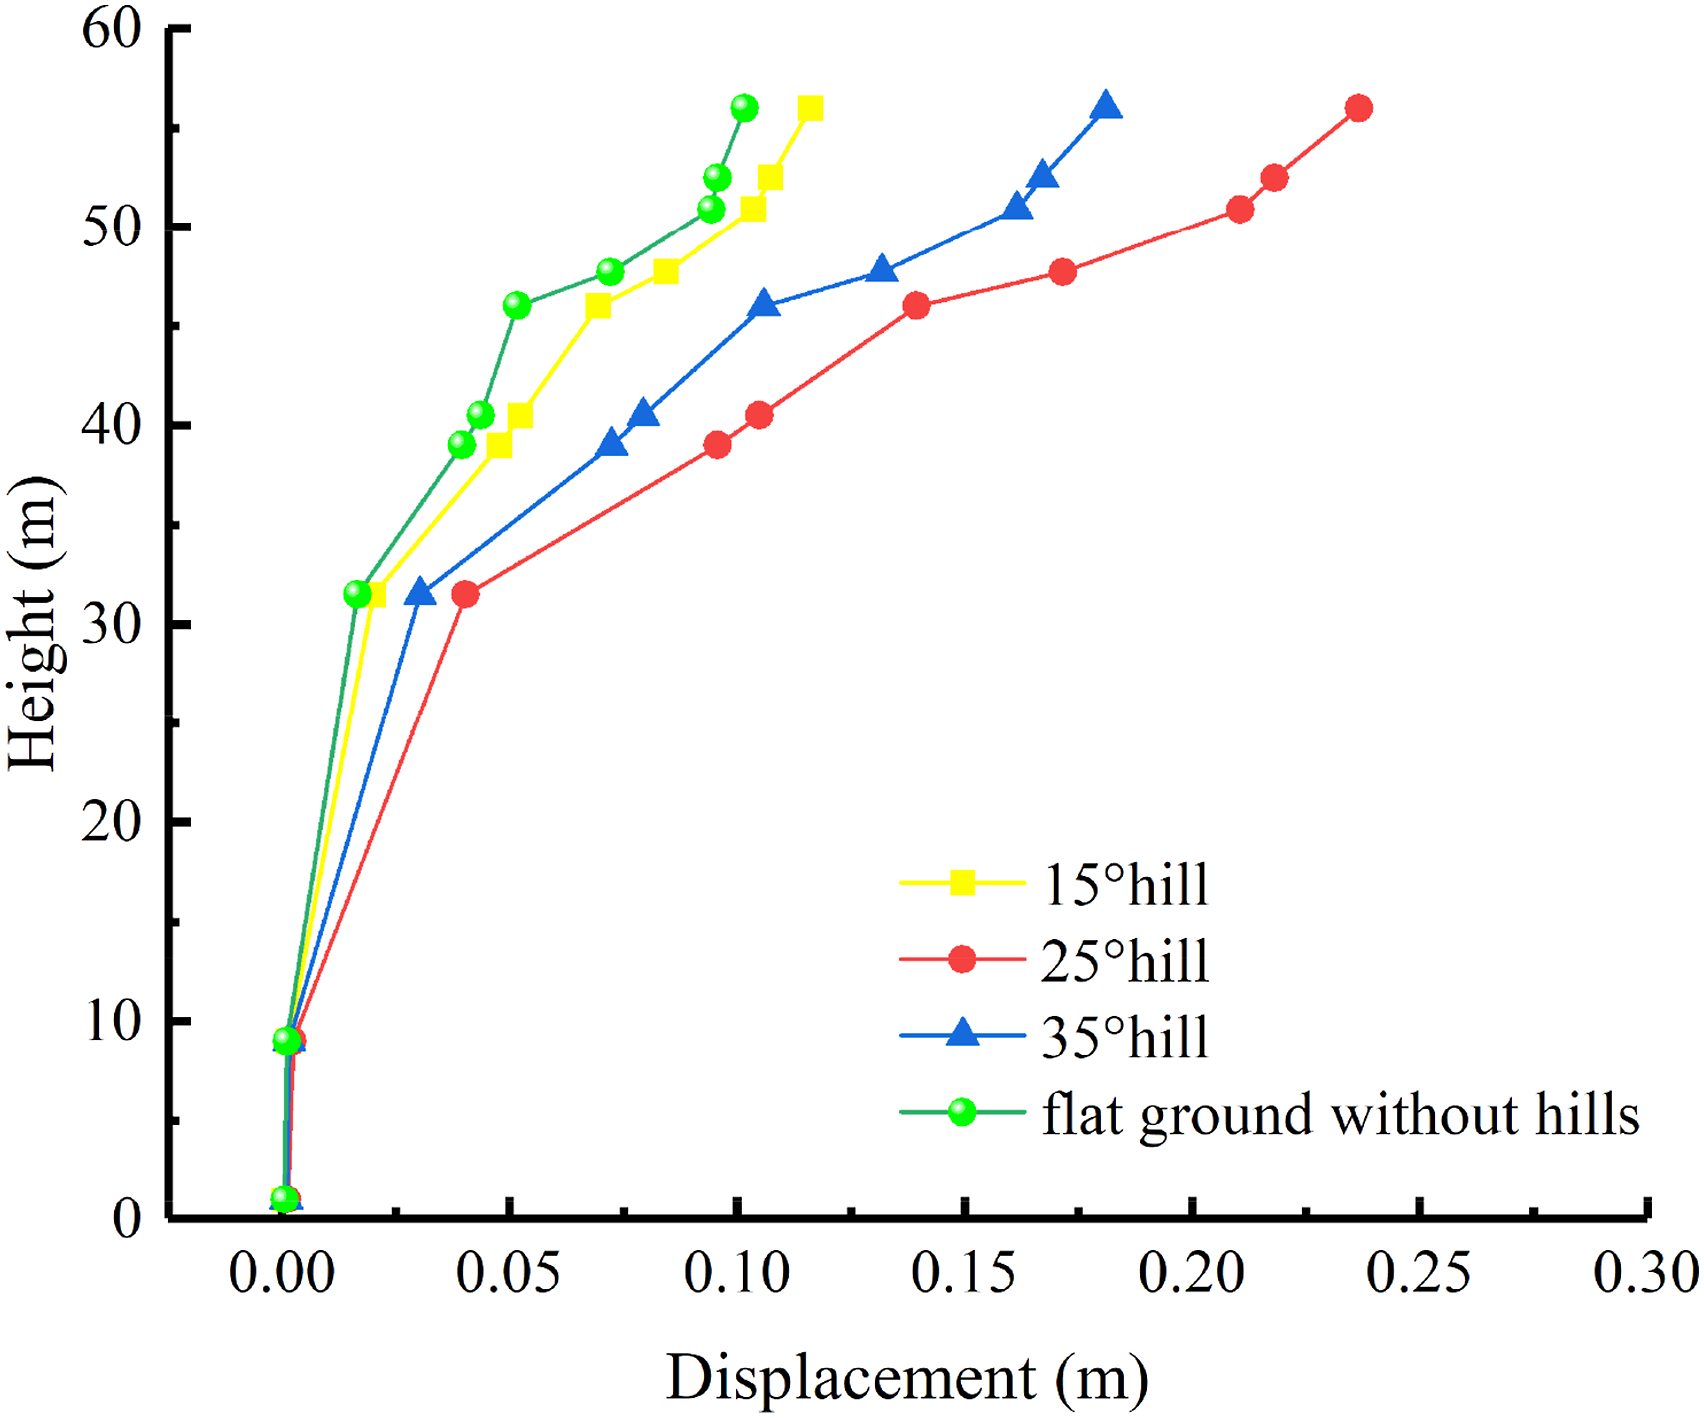
For comparison, the wind loads are calculated when the flat ground without hills is considered as presented in Chinese code. The maximum displacement is obtained to compare with the results considering the effect of hills, as shown in Figure 17. It is found that the displacement value of transmission tower based on Chinese code is generally smaller than the results when hills are considered.
Conclusion
The research focuses on the wind field characteristics of hills and the dynamic responses of transmission tower under different hill slopes using wind tunnel test and numerical simulation. The influence of hill slope and transmission tower on wind characteristics is studied by wind tunnel test. The turbulence intensity on the leeward side is smaller than that on the windward side, due to the flow separation on the leeward side. The existence of tower disturbs the turbulence intensity. Dynamic responses of transmission tower are analyzed based on wind tunnel tests and numerical simulations. The results show that the slope has influence on the maximum displacement of tower top, in which the maximum displacement of 15° hill slope is the smallest and that of 25° hill slope is the largest. Compared to the wind tunnel test data where the effects of hills are considered, the displacement values of transmission tower based on Chinese code are generally underestimated. Overall, the interactive effects between the hill terrain and existing transmission tower regarding to the wind field characteristics and structural dynamic responses are complex and significant. The analysis procedure in this study is an effective supplementary to the design and dynamic analysis of the transmission tower on a hill subjected to dominant wind loads.
Footnotes
Declaration of conflicting interests
The author(s) declared no potential conflicts of interest with respect to the research, authorship, and/or publication of this article.
Funding
The author(s) disclosed receipt of the following financial support for the research, authorship, and/or publication of this article: The research described in this study was financially supported by Key R&D Program Projects of Zhejiang Province (2019C03098) and the National Natural Science Foundation of China (U1709207, 52078461).