
Abstract
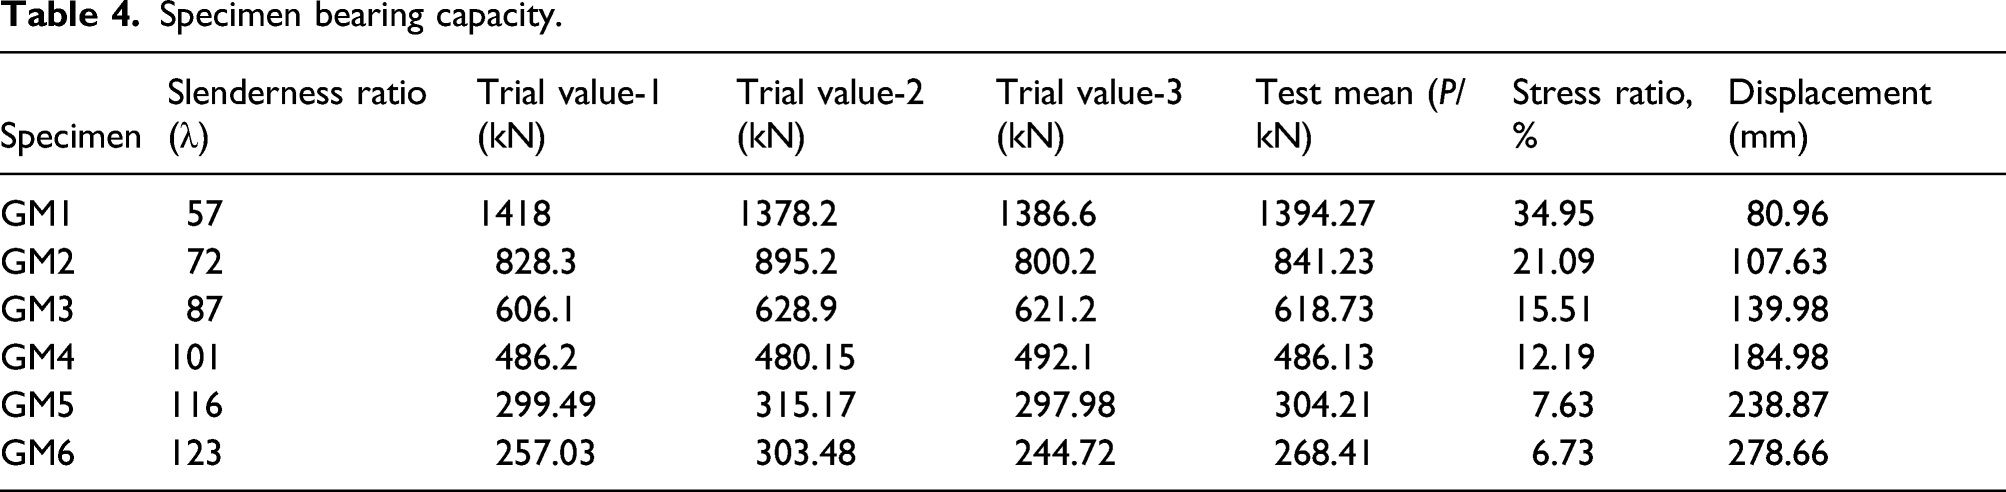
Glass fiber reinforced plastics are widely used in civil engineering because of their advantages such as light weight, high strength, good pollution resistance, and corrosion resistance. This study investigated the buckling bearing capacity, failure characteristics, and slenderness ratios of GFRP solid bars with circular cross-sections subjected to axial compression. A total of 18 specimens were categorized into six groups. The slenderness ratios ranged from 57 to 123. It was found from experiments that the instability mode of the specimens was extreme point instability, and a bearing capacity platform phenomenon was observed when overall lateral instability occurred. The failure mode was axial and transverse tearing failure of the material in the middle of the specimen. During buckling, the tensile side was transformed from the compression of the resin matrix to tension in the fibers. The elastic modulus of glass fiber was much lower than that of the resin matrix. After tension occurred, increased deformation led to a rapid increase in lateral bending, which resulted in the phenomenon of the bearing platform. At ultimate deformation, brittle failure of the specimen occurred. The buckling load of the specimen decreased sharply with an increase in the slenderness ratio, and stress ratios decreased from 34.95% to 6.73%. It is suggested that the slenderness ratio not exceed 80. Finally, based on experimental results, a practical method for calculating the stable bearing capacity of solid GFRP poles is proposed.
Keywords
Introduction
Fiber-reinforced plastic (FRP) is a new material that consists of short-cut or continuous fibers and fiber-based fabrics that are compounded with thermosetting or thermoplastic matrices by jetting, drawing, winding, etc. These two types of components complement each other to produce a synergistic effect. Due to their characteristics of light weight, high strength, good insulation, good designability, and corrosion resistance, FRPs have been widely used in aerospace, civil engineering, electrical engineering, and many other fields (Hollaway, 2010a, 2010b; Rajak et al., 2019; Ye and Peng, 2006).
Glass fiber reinforced plastic (GFRP) poles can be used to build transmission towers and bridge structures, replace traditional steel arms to support transmission lines, and serve as force-bearing structures of towers (Bakar et al., 2018). GFRP structures can endure extreme environmental conditions when used as horizontal arms or for transmission tower structures (Selvaraj et al., 2012). Due to their high specific strength, corrosion resistance, and good chemical stability, glass fiber reinforced plastics do not reduce the mechanical and structural strength of transmission towers due to corrosion, and may thus be a good replacement for steel. GFRPs are also good insulators and thus prevent damages due to lightning (Godat et al., 2013; Yang et al., 2014). Some investigators (Shikai et al., 2015) explored the overall mechanical properties of a GFRP transmission truss tower structure. A full-scale model of a transmission truss tower with a GFRP square tube as the tower body and as a cross arm was tested. The results showed that the overall mechanical performance of a GFRP transmission truss tower is good and meets design requirements. Another promising application of GFRP is in truss structures where it can replace steel as the force member. It can reduce the weight of the structure, improve structural span, solve maintenance problems associated with the use of steel, and improve structural durability (Zhang et al., 2019). Darius et al.(2017) conducted experimental research on the structural characteristics of a GFRP truss bridge model under static loads and found that the GFRP truss had adequate reserve structural stiffness. Thus, GFRP bars have been demonstrated to have a substantial potential for application in transmission towers and bridges (Mao et al., 2019).
Although FRP poles have been widely applied in structures, there is a lack of comprehensive research on their mechanical properties. Globally, several researchers have investigated the mechanical properties of FRP poles under different conditions. Ding et al. (2018) tested the compressive and tensile strength of a BFRP tube. The tensile strength of a BFRP short tube can be greater than 1000 MPa, and the compressive strength is 40% of the tensile strength. The strength was found to be high, and the stability equation of compressive strength was derived. Robert and Benmokrane (2010) studied the mechanical properties of GFRP bars at low and high temperatures and found that temperature change had little effect on the mechanical properties of GFRP bars. Wang et al. (2015) studied the effects of several parameters on the axial compression performance of a porous GFRP tube and found that the properties of perforated GFRP tubes were significantly reduced. He et al. (2020) studied the mechanical properties of wound GFRP columns after a transverse impact and found that the vertical bearing capacity and initial stiffness of GFRP columns decreased with an increase in the height of transverse impact. Zhan and Wu (2018) proposed an improved formula for calculating the buckling load of a PFRP I section, which is more accurate than the current formulation. Najafabadi et al. (2018) studied the effect of high temperature on the mechanical properties of different embedded GFRP profiles and obtained a model for predicting the mechanical properties of FRP profiles at high temperatures based on test results. Guades and Aravinthan (2013) studied the residual performance of a square FRP tube under axial impact and found that the maximum decrease of residual compressive strength, tensile strength, and flexural strength of the tube due to the impact was small. Wang et al. (2016) conducted axial compression tests on a GFRP hollow circular tube, observed and analyzed the failure characteristics and instability modes of the specimen, and determined a formula based on experimental data to calculate the load-bearing capacity before instability. Xue et al. (2013) conducted axial compression tests on a GFRP tube, discussed the stable bearing capacity and failure characteristics, and proposed an improved formula for calculating bearing capacity before instability. Some scholars used FRP to strengthen the buckling of circular sections. Batikha et al. (2018) used FRP composites to increase the strength of an isotropic metallic cylindrical shell against elephant’s foot buckling. A study was conducted at Edinburgh University on the strengthening of thin metal shell structures using FRP composites. The buckling strength of the shell under axial loading can be significantly increased by using only a small amount of FRP in the critical area of the imperfection (Batikha et al., 2007). The buckling strength of thin shell structures is very sensitive to geometric imperfections. Fiber-reinforced polymer composites can improve the buckling strength of imperfect cylindrical shells (Batikha et al., 2008). The above studies have analyzed the mechanical properties and buckling capacity of FRPs using experimental data, using several sectional forms, but are concentrated on hollow tube specimens, with very few studies being focused on the study of solid poles. However, for some heavy and ultra-heavy load structures, hollow members do not meet structural requirements, for which solid members are necessary.
With the development and application of FRP, the production process has become more mature and diversified, and the production cost has gradually decreased. FRP material has light weight and strong corrosion resistance. Compared with steel and reinforced concrete, the maintenance cost in later period is very low. Comprehensive economic benefits are worthy of attention. The Chongqing Jiaoyuan Bridge, built in 1986, uses GFRP box girder, which reduces the construction cost by 50% compared to steel bridges (Ye and Peng, 2006). Solid poles have a higher carrying capacity, stronger lateral impact resistance, less environmental impact, and the production process is simpler than hollow tubes. However, few studies have been conducted on the mechanical properties and buckling capacity of FRP solid members. When an FRP pole is subjected to axial pressure, any initial curvature due to manufacturing, material defects, and slight eccentricity in the application of the load may lead to a decrease in the bearing capacity of the FRP rod; hence, the stiffness ratio of the compression rod is a more significant parameter to consider. The bearing capacities of members with different slenderness ratios also differ. To solve this problem, six types of GFRP round-section solid poles with different slenderness ratios were designed for axial compression tests, in this study. The axial compression failure mode, failure characteristics, and the relationship between the buckling bearing capacity and the slenderness ratio of the poles were studied. According to the results of the tests, a formula for calculating the buckling bearing capacity of GFRP round-section solid poles was determined, which provides a reference for the design of such specimens.
Test overview
Specimen design
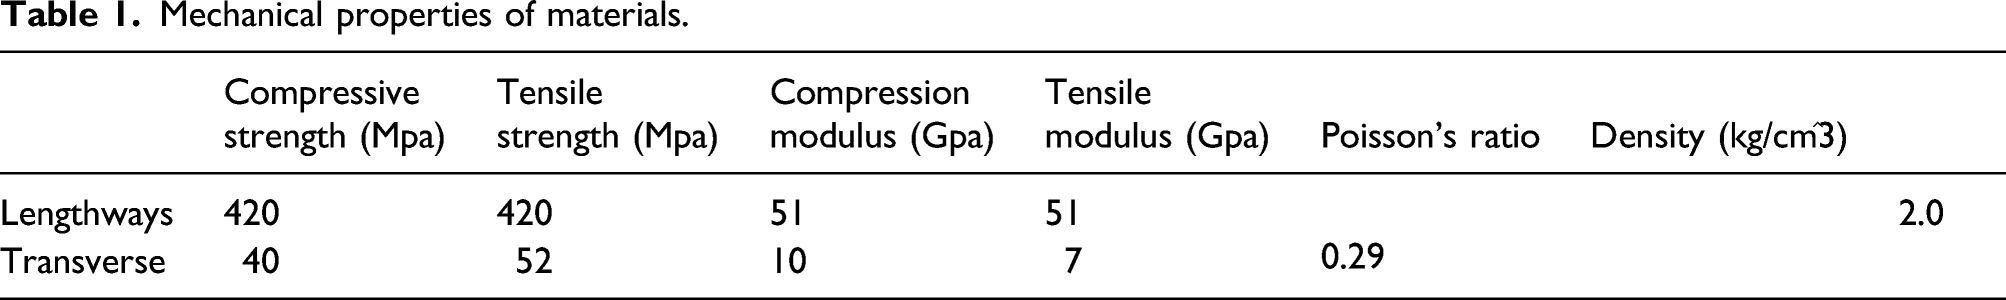
Mechanical properties of materials.
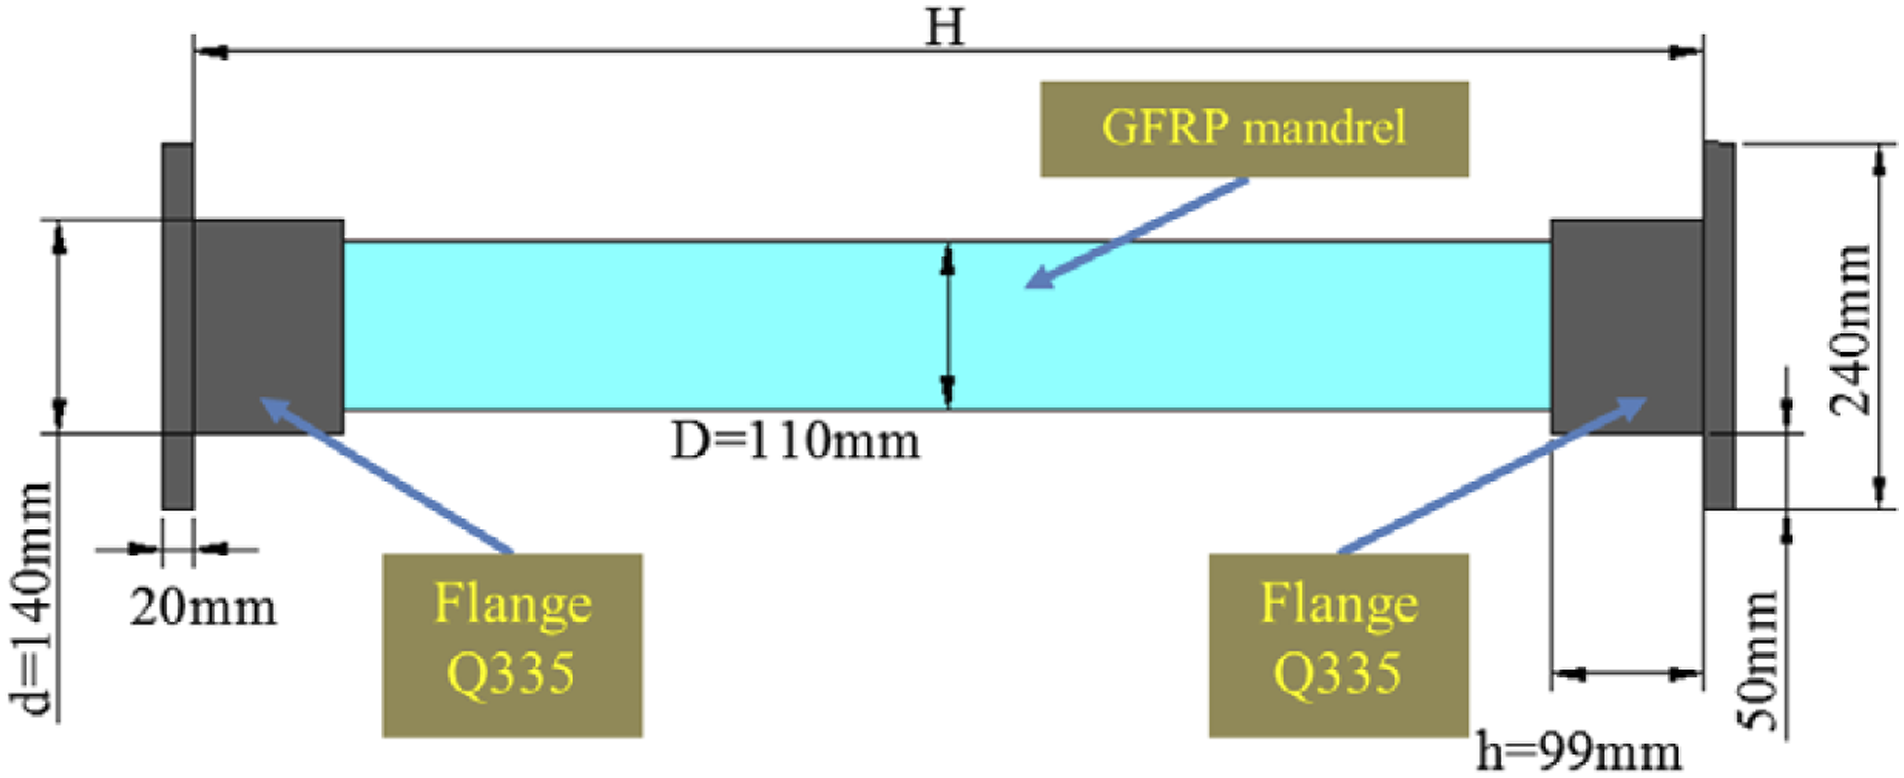
Drawing of the GFRP specimen.
Specimen grouping.
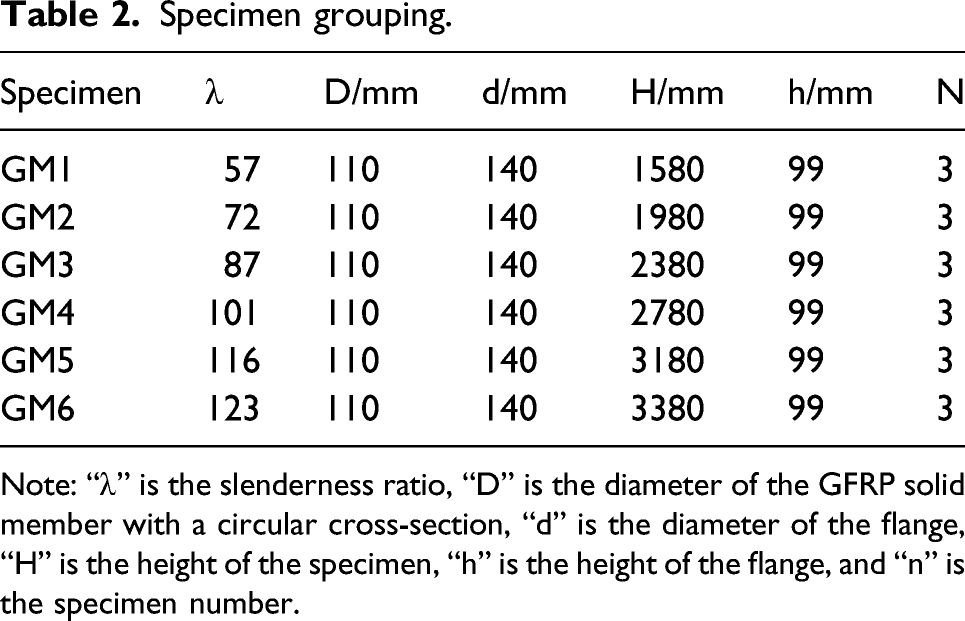
Note: “λ” is the slenderness ratio, “D” is the diameter of the GFRP solid member with a circular cross-section, “d” is the diameter of the flange, “H” is the height of the specimen, “h” is the height of the flange, and “n” is the specimen number.
Loading equipment
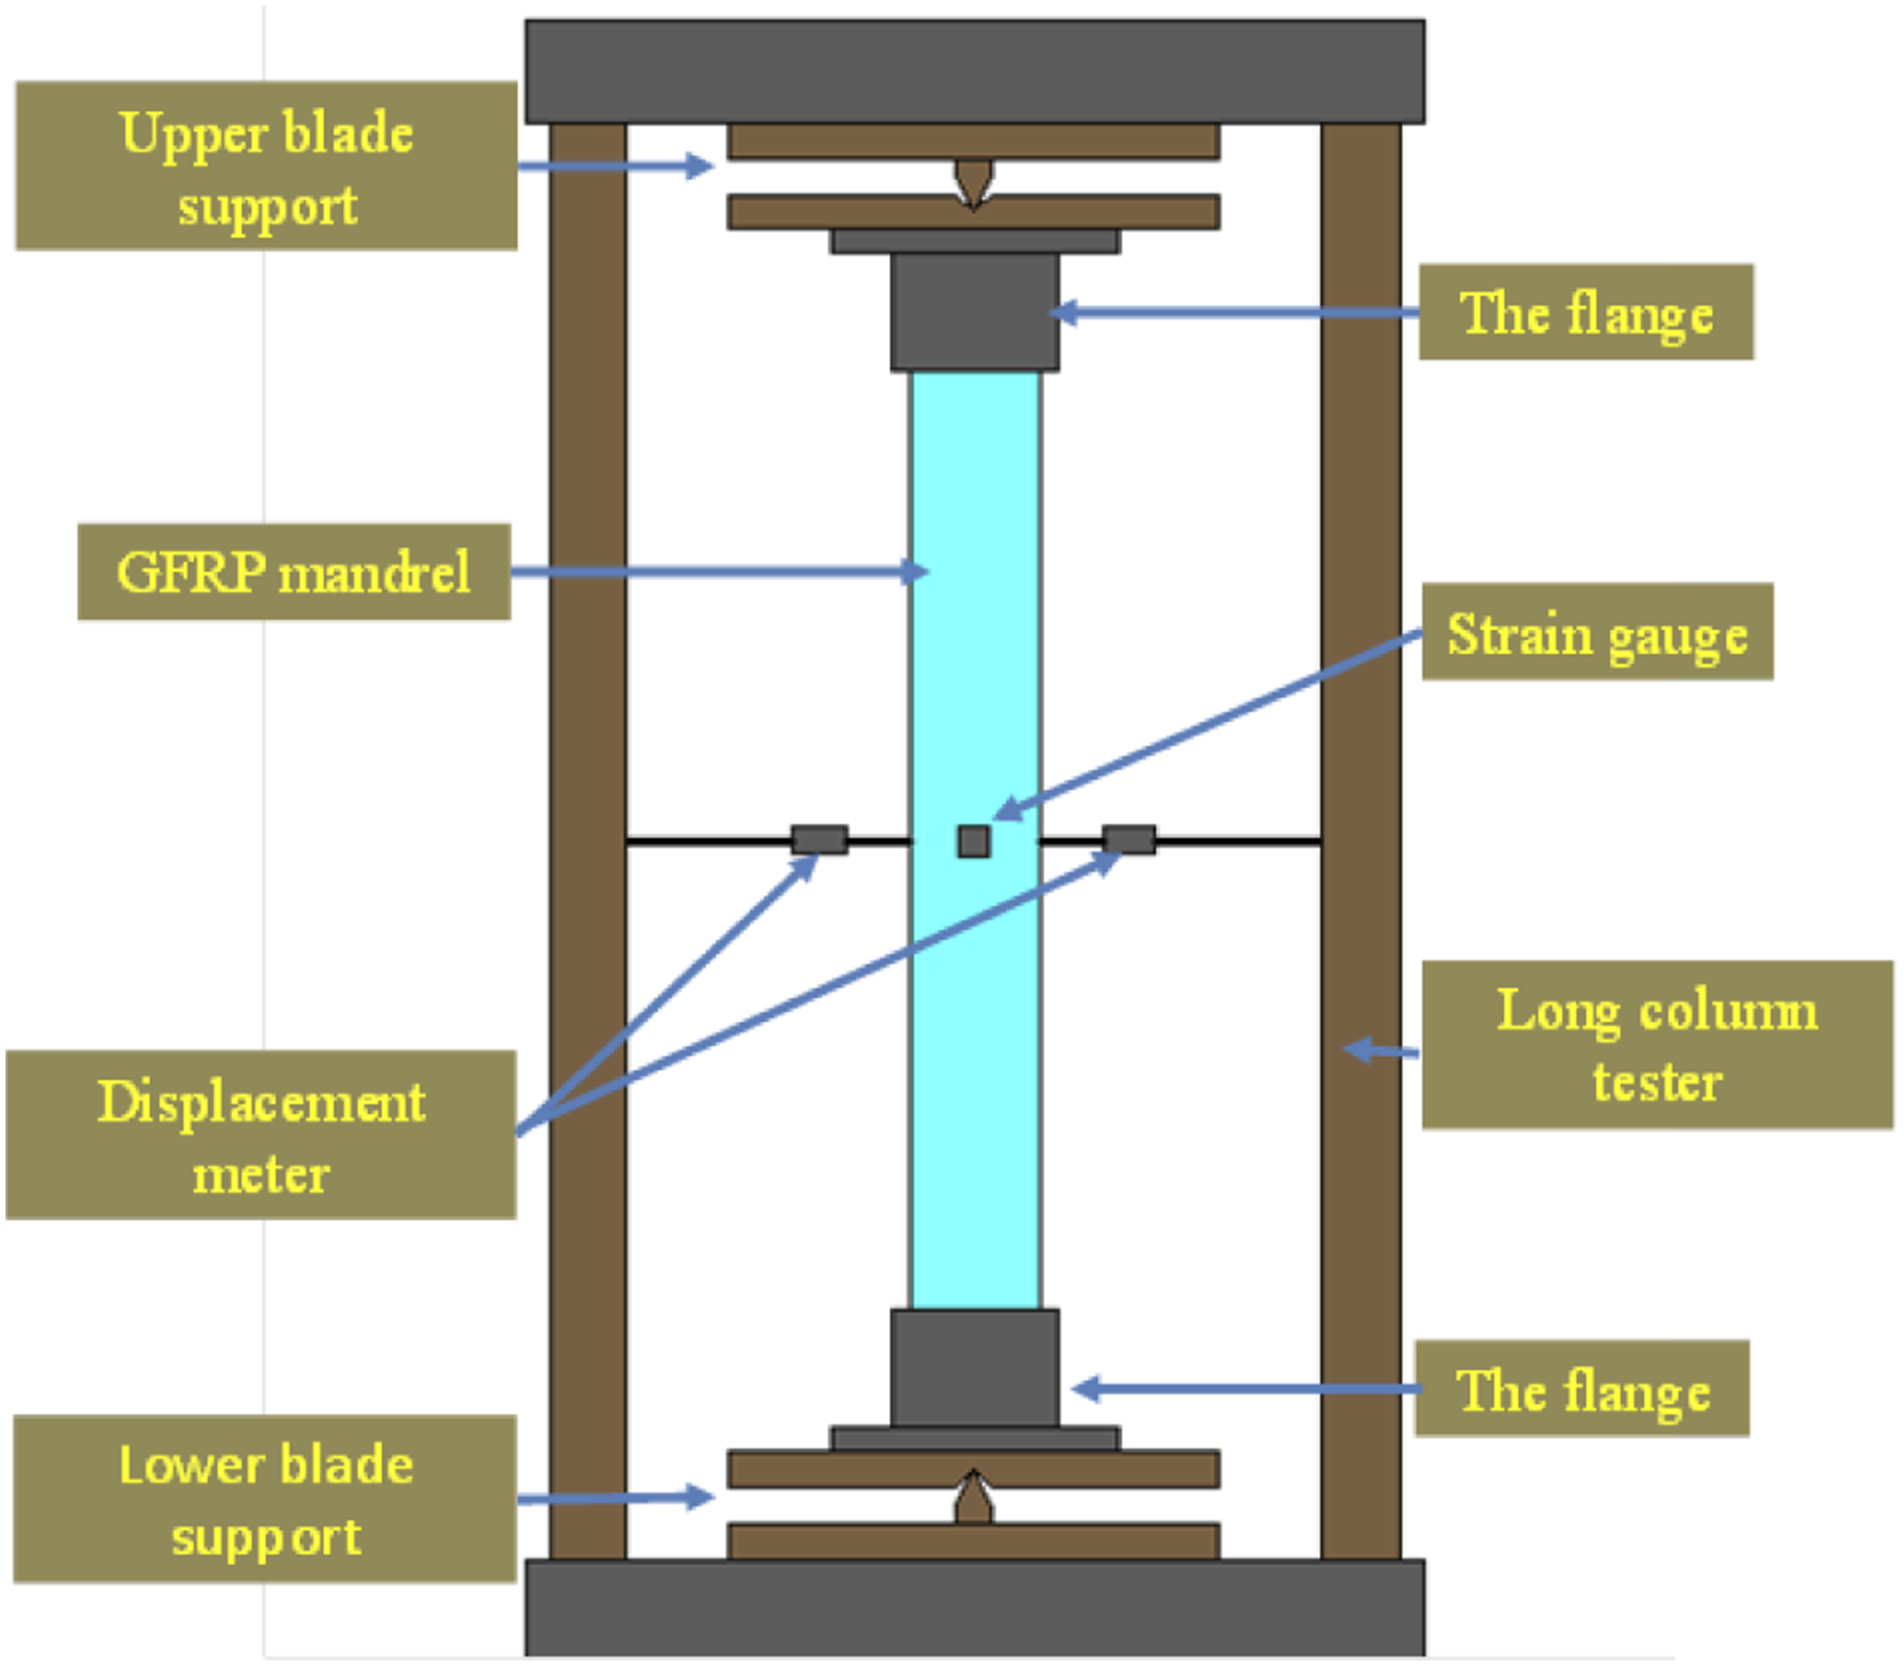
A hydraulic servo column test machine was used for loading in the experiment. Knife-edged supports were used to simulate hinged boundaries at both ends of the specimen. A laser alignment process was used for the axial compression experiments. The experimental setup is shown in Figure 2, and the schematic of the experimental device is shown in Figure 3. The experimental setup. Schematic of the experimental device.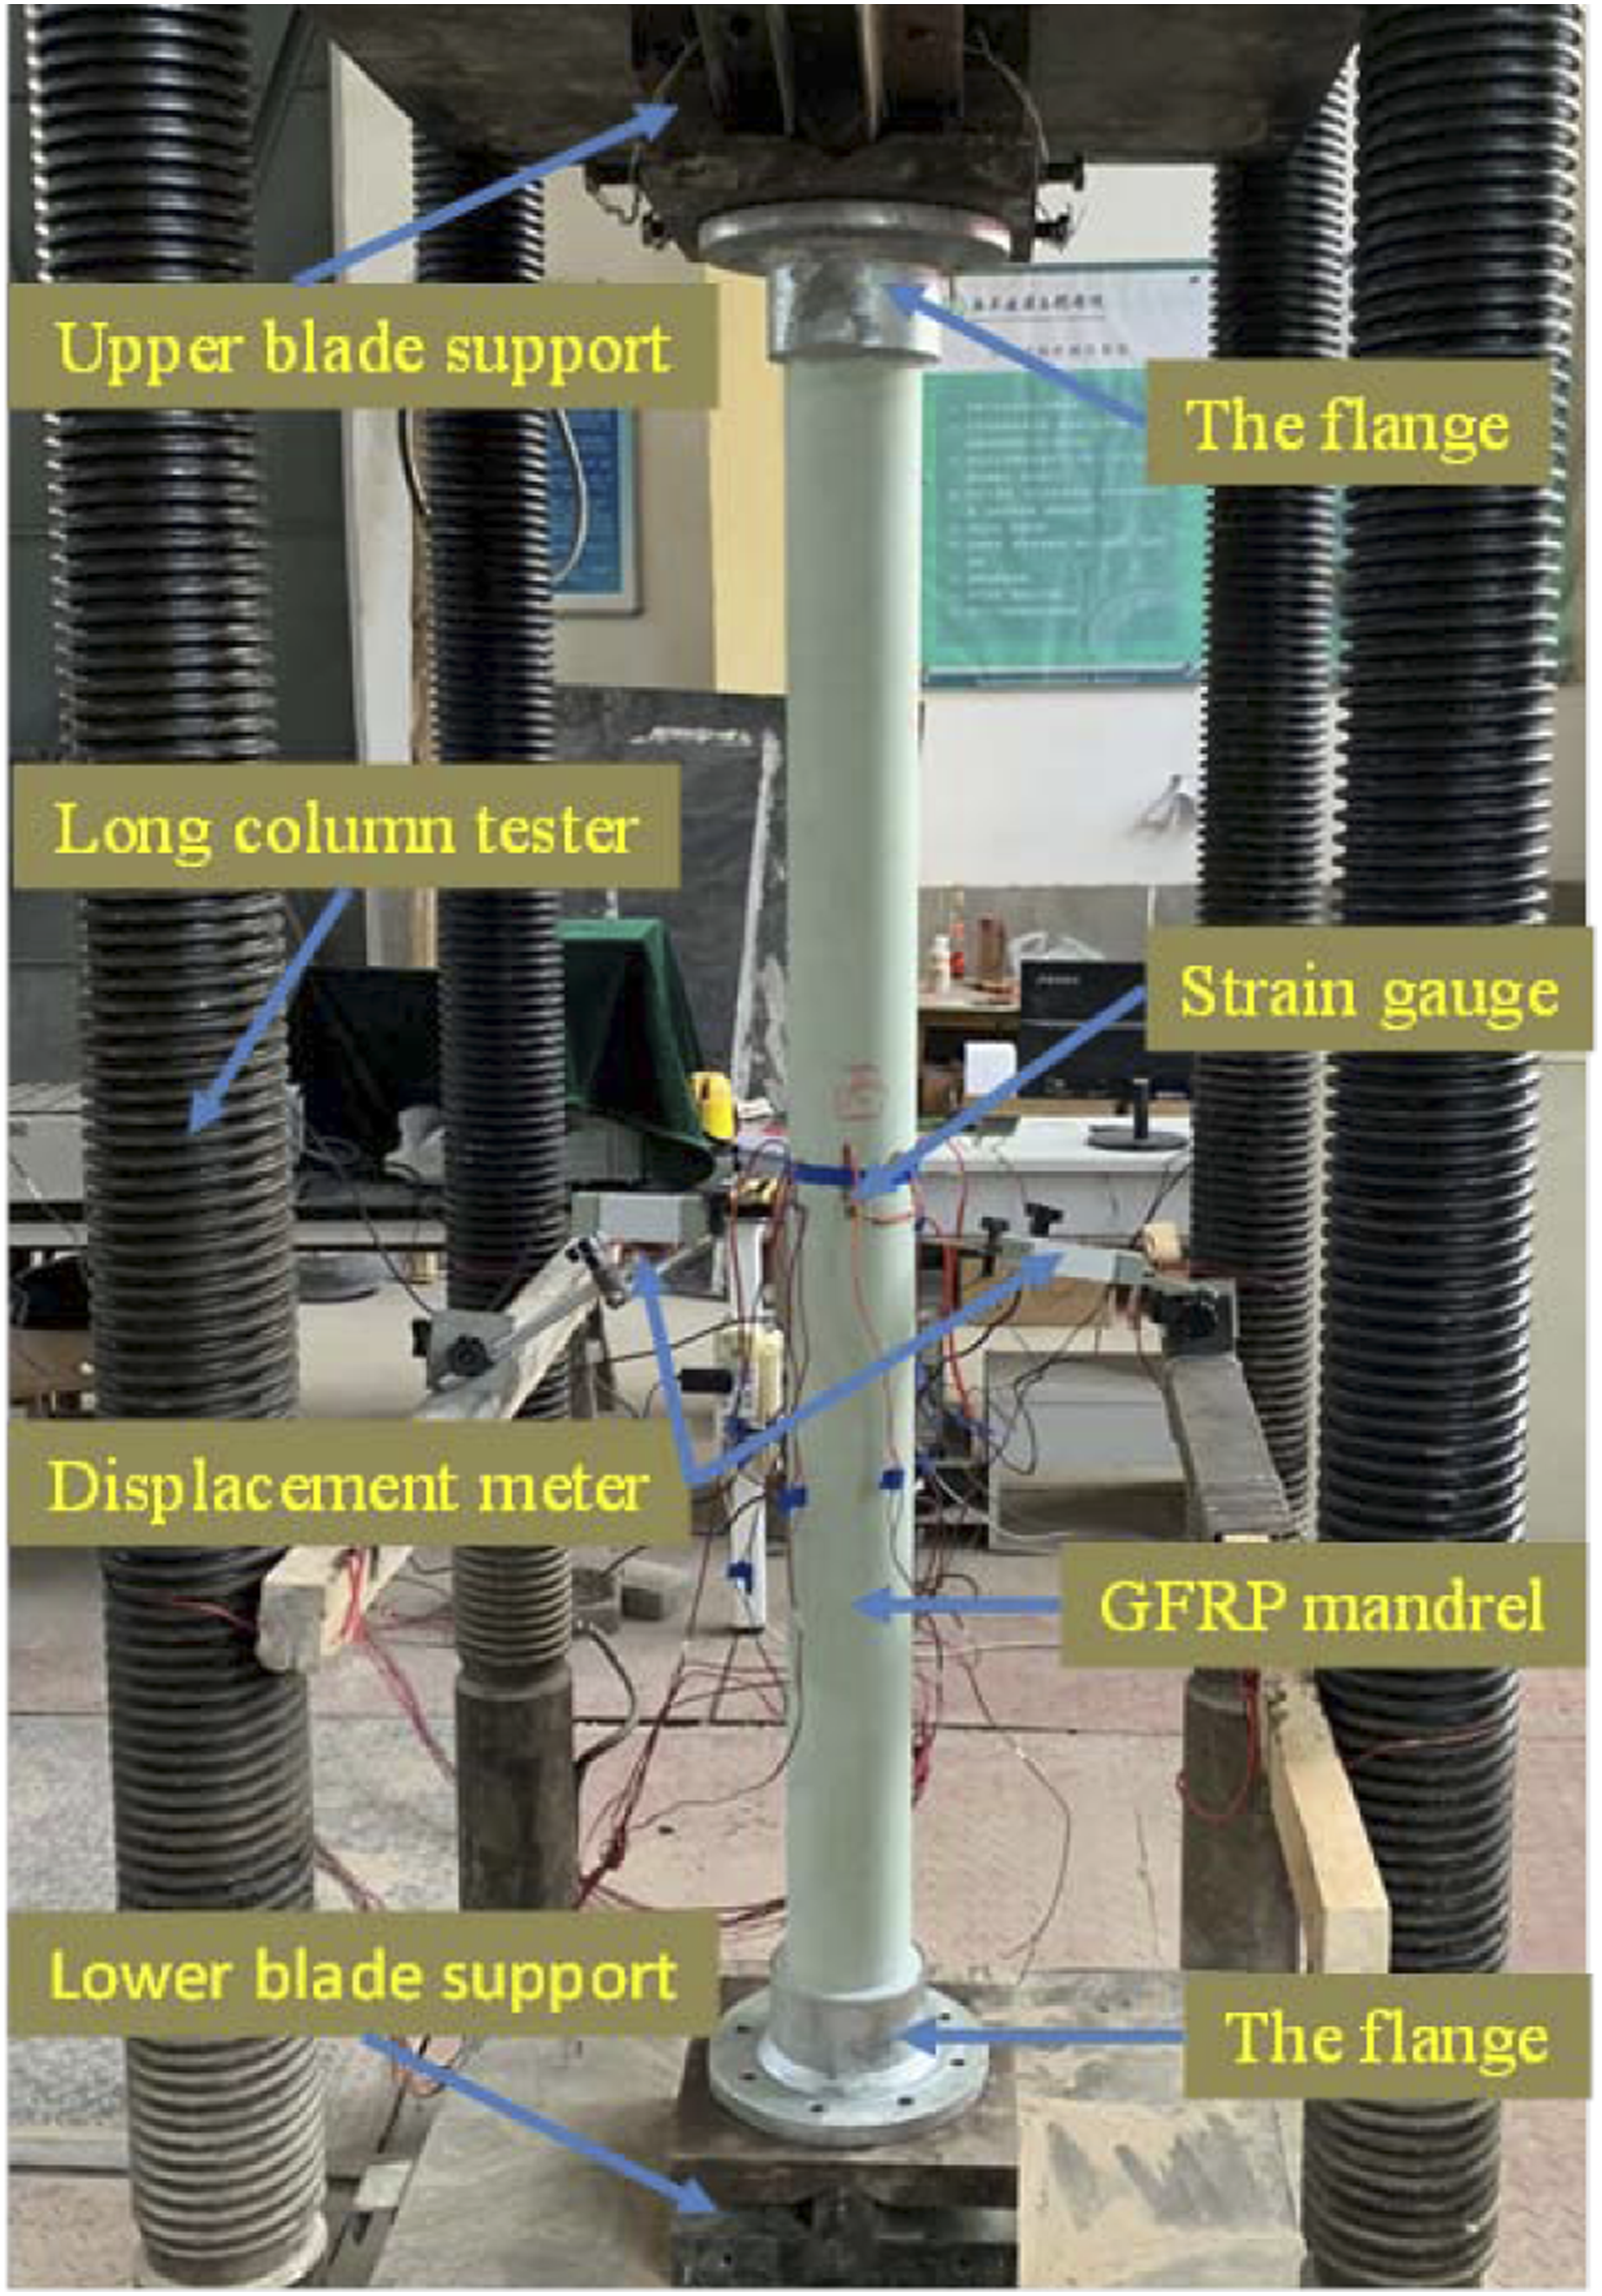
Layout of measuring points
To measure the bending of the specimen, two displacement gauges along the bending direction and four strain gauges were placed at the mid-height of the specimen. Each strain gauge measured strain along three directions: the axial strain measured by a, the circumferential strain measured by b, and the strain along the 45-degree direction measured by c (Figue 4). The strain measurement point on the compressive side after buckling was designated as point 1, and the strain measurement point on the tensile side as point 2. The arrangement of the measurement points is shown in Figure 4. Arrangement of measurement points.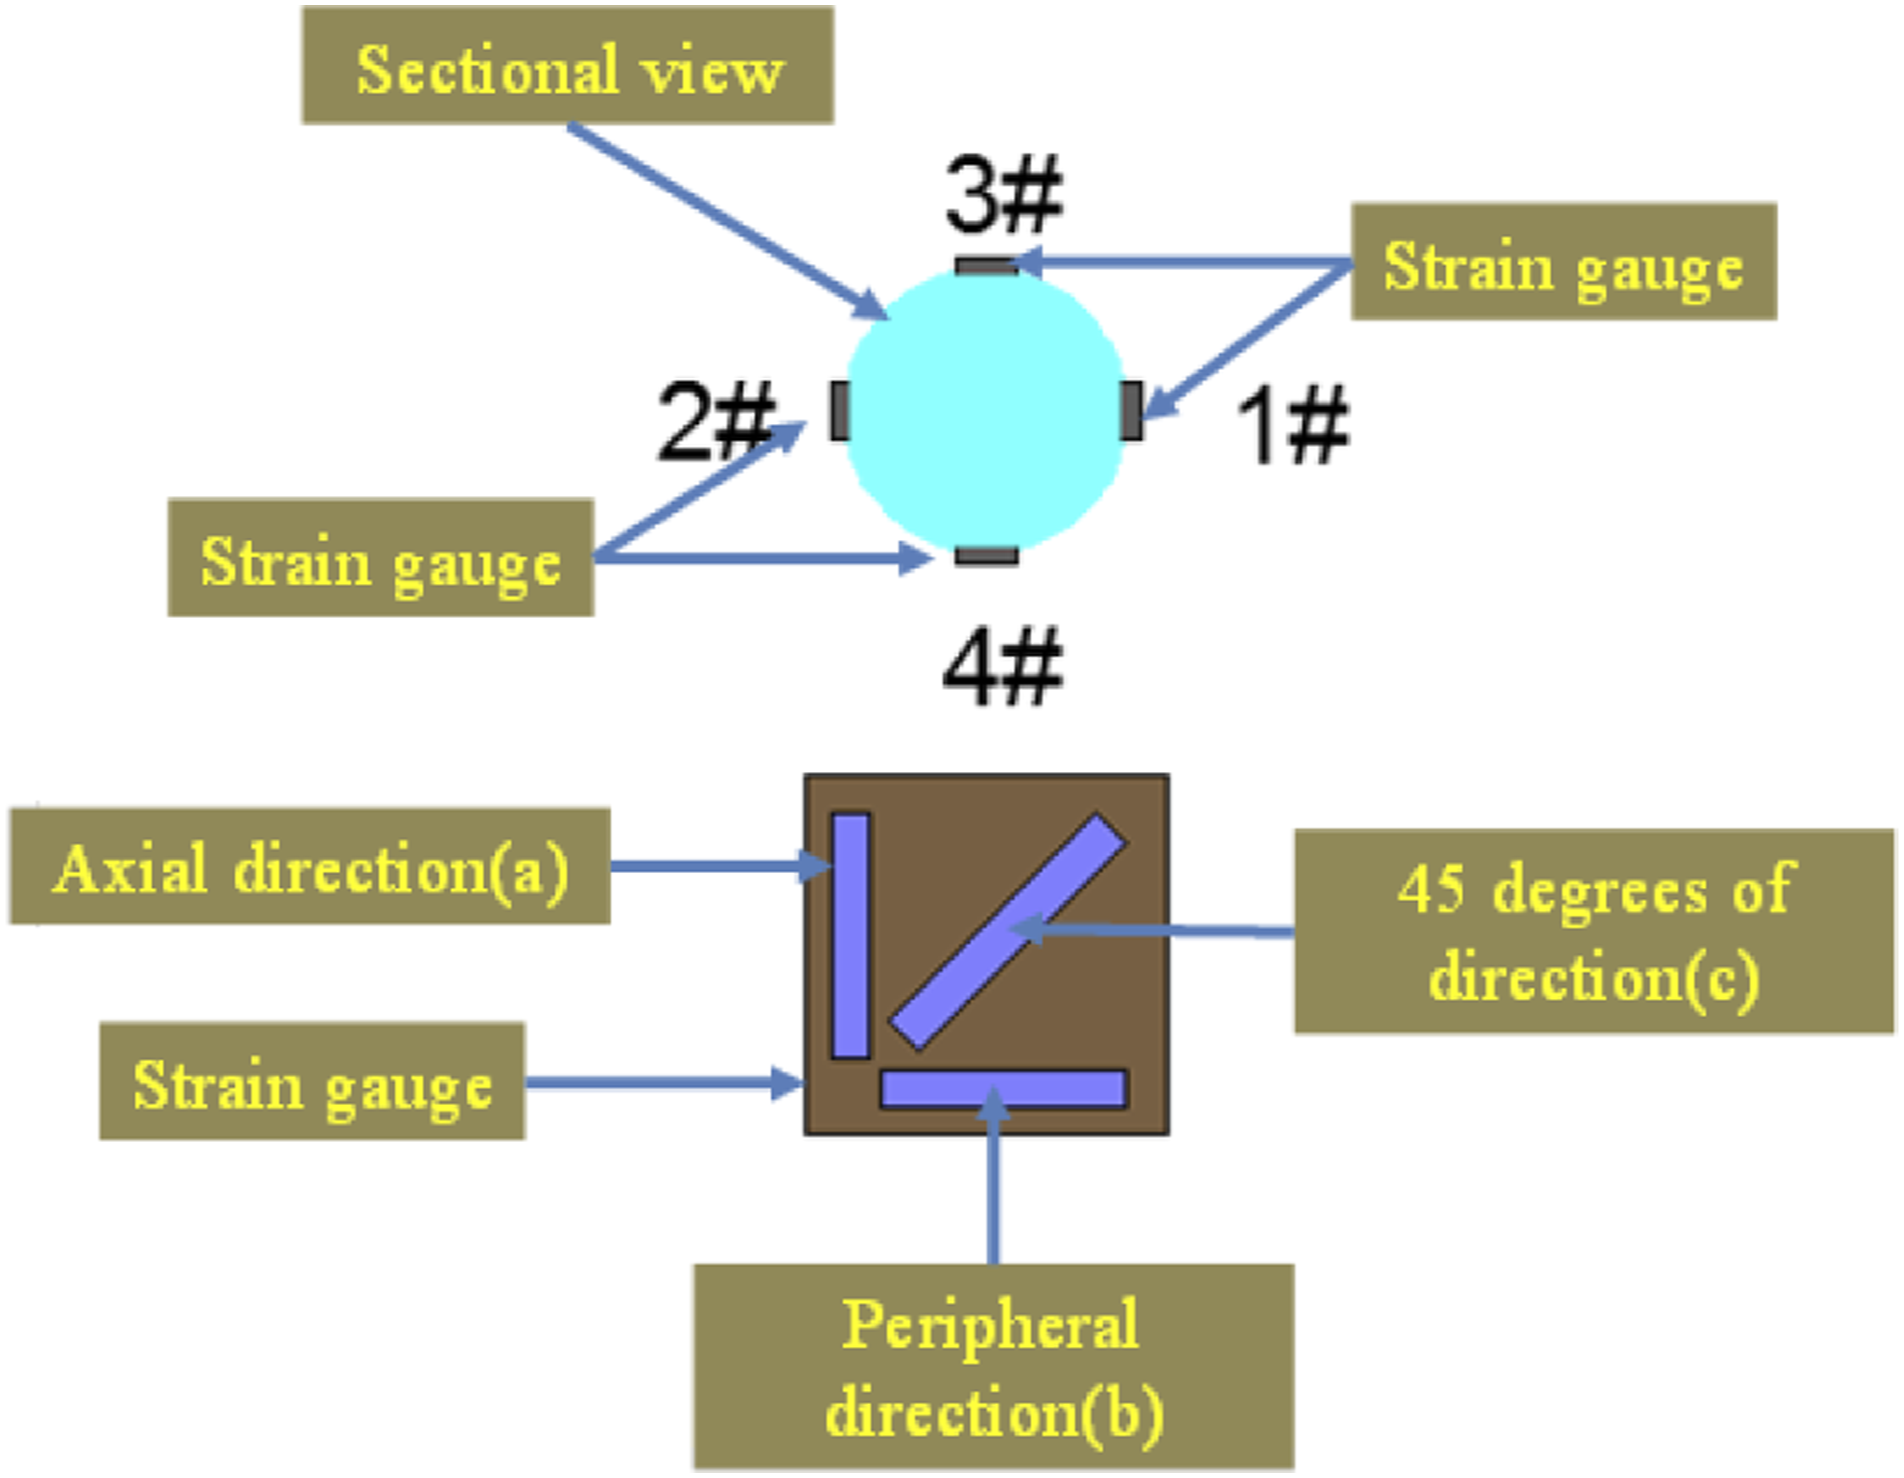
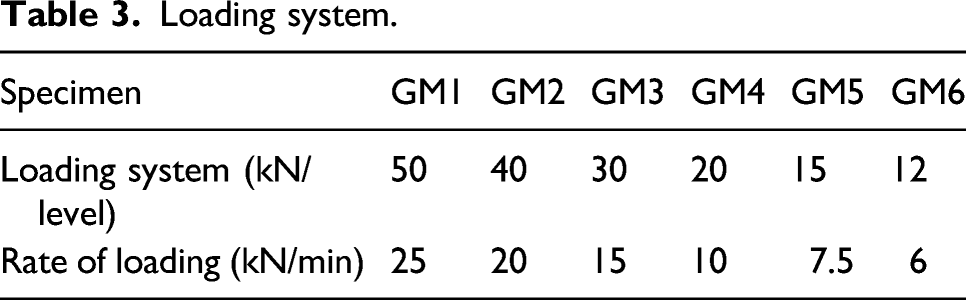
Loading system
Loading system.
Experimental phenomena and data analysis
Experimental phenomena
The failure processes of all specimens were found to be similar, based on the axial compression tests. The process consisted of the following stages: An initial stage at the beginning of the loading process during which the specimen emitted a crackling sound. As the load increases, slight lateral deformation can be observed, and the degree of deformation increased slowly as the load was increased. When the ultimate load was reached, the specimen buckled but continued to retain bearing capacity. The lateral deformation increased rapidly when buckling occurred. When the ultimate deformation was reached, brittle failure of the specimen occurred suddenly. A loud sound was heard upon failure, accompanied by vertical and lateral cracks at the middle of the specimen which resulted in loss of bearing capacity, and signaled the end of the test. After the loading was stopped, the specimen showed a “bow” shape. Use a laser rangefinder to measure the maximum lateral displacement in the middle of the test piece. The final damage phenomenon is shown in Figure 5. (a) Damages of GM1; (b) damages of GM2; (c) damages of GM3; (d) damages of GM4; (e) damages of GM5; (f) damages of GM6.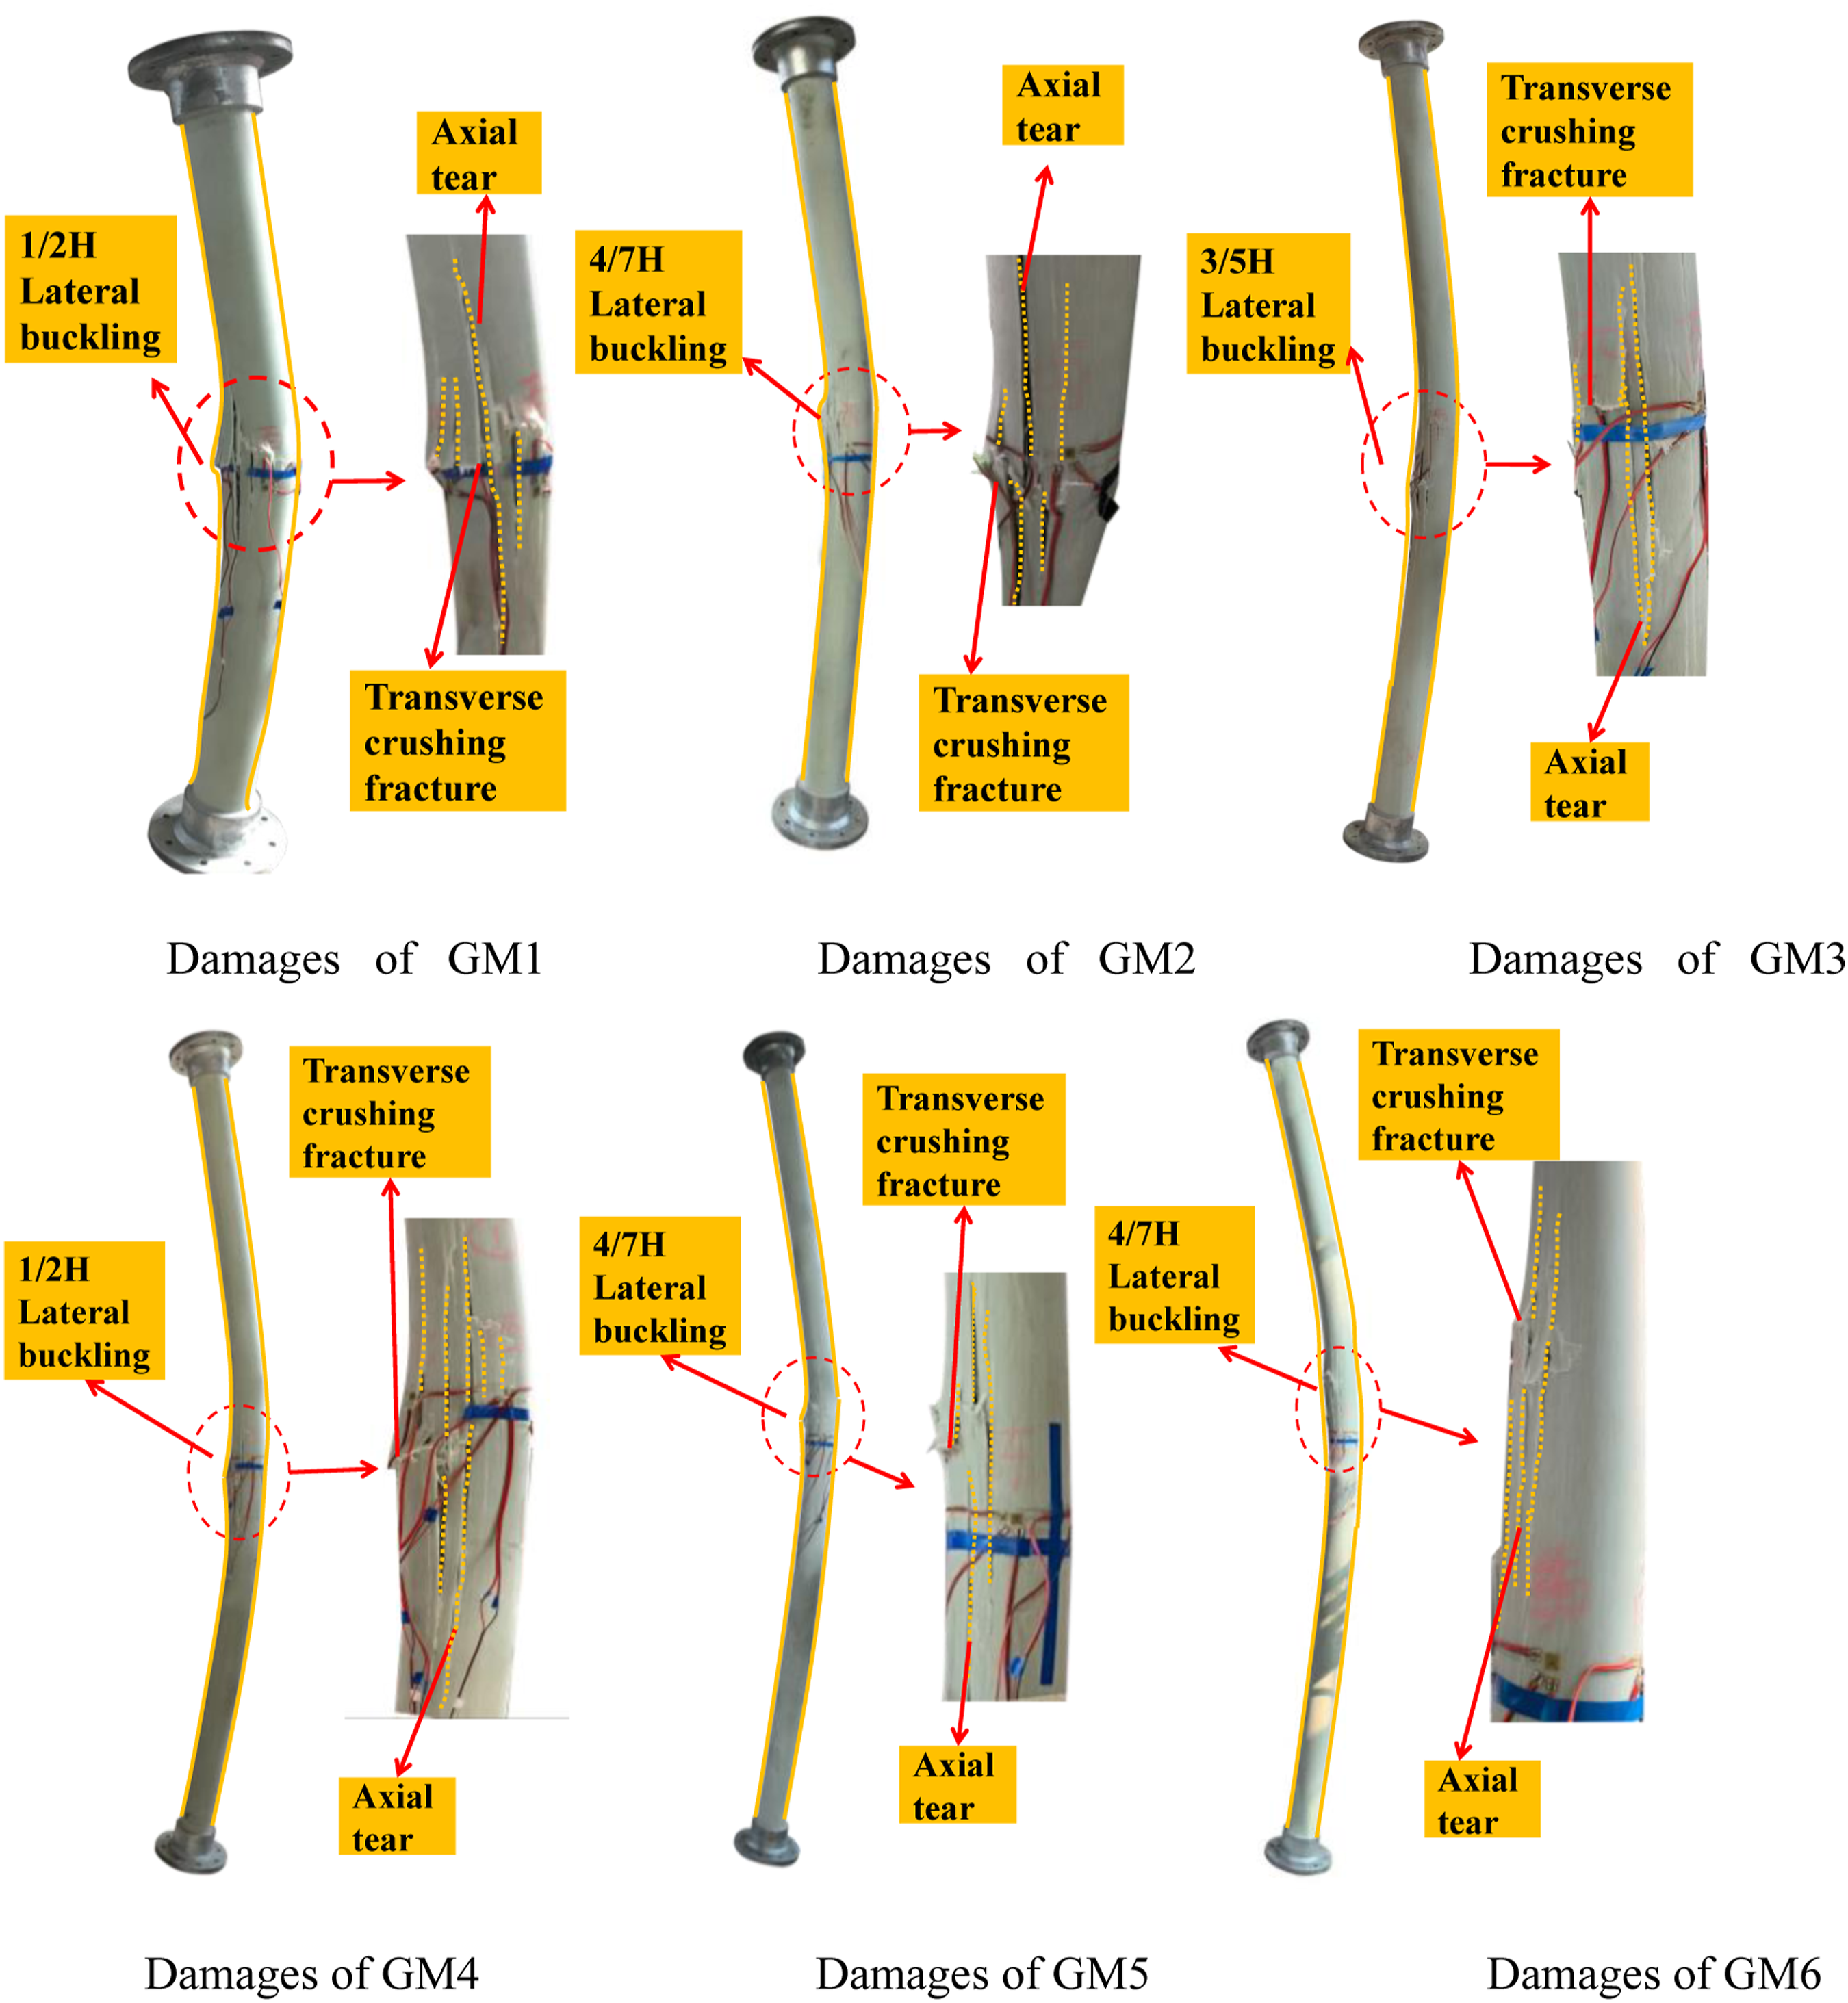
It could be seen from the test that the GFRP members with a slenderness ratio of 57–123 all have bending failure, and the failure occurred on the compression side in the middle of the specimen, and no damage was seen at both ends. Axial tearing and transverse crushing fracture occurred at the failure position, and the penetration of the two cracks caused the surface material of the specimen to bulge. From the perspective of damage phenomenon, the degree of damage has a certain relationship with the slenderness ratio. The greater the slenderness ratio, the shallower the crack depth. It is considered that the reason for this phenomenon is the larger the slenderness of the specimen is, the greater the degree of bending; the compressive stress on the section will concentrate on the surface of the specimen, resulting in a shallower crack depth after the resin is crushed.
Analysis of load-axial displacement curves and lateral displacement curves
The load-axial displacement curves and lateral displacement curves are shown in Figure 6. Load-Axial displacement curves and lateral displacement curves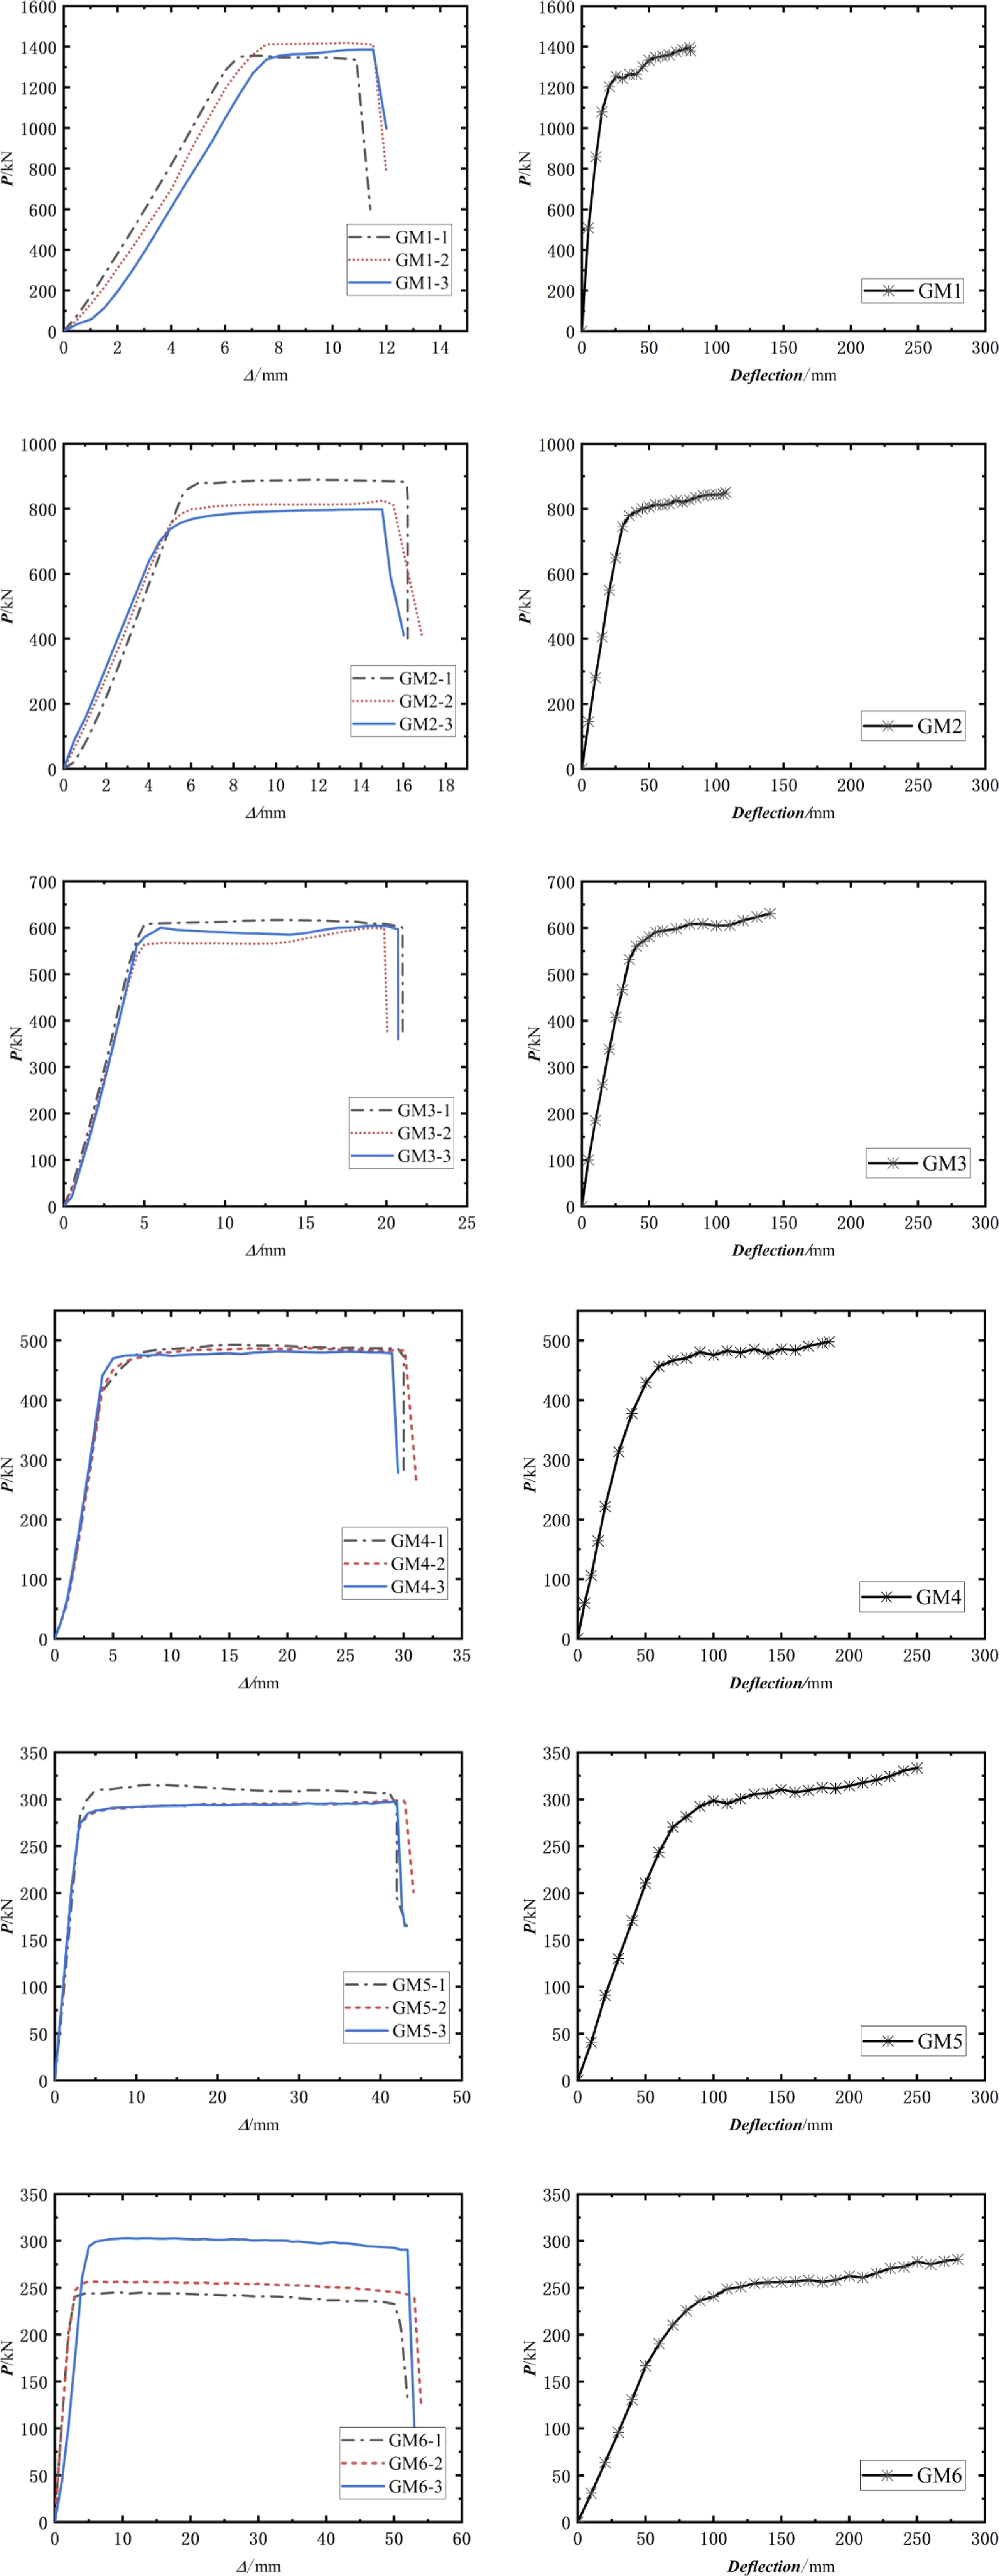
In the Load-Axial displacement curves part, the failure process of each specimen was divided into three stages. The first stage was linear, in which an increase in load caused a linear increase in the Axial displacement of the specimen. The second stage was the unstable buckling stage, in which the displacement continued to increase although there was no further increase in load and resulted in the phenomenon of a “bearing capacity platform.” The third stage was the destruction stage, in which no further displacement occurred, the bearing capacity dropped sharply, and there was a loss of load-bearing capacity. After unloading, the specimens showed no residual strain, the deformation properties of the specimens did not change before and after the instability, and there was an extreme point in the load-axial displacement curve. It is the same as the traditional extreme point instability, the load-bearing capacity of the specimen did not decrease or increase after buckling and showed a certain amount of deformation capacity. The larger the slenderness ratio, the longer the buckling stage, the stronger the deformation capacity, and the larger the displacement.
In the lateral displacement curves part, the curves can be divided into two stage: linear growth stage and horizontal stage. In the linear growth stage, as the slenderness ratio increases, the slope of the curve decreases. In the horizontal stage, the greater the slenderness ratio, the longer the horizontal stage. This law shows that when the buckling capacity is not reached, the larger the slenderness ratio, the more obvious the lateral displacement. When reaching the buckling capacity, the greater the slenderness ratio, the greater the lateral displacement and the stronger the deformation capacity.
Analysis of bearing capacity
Specimen bearing capacity.
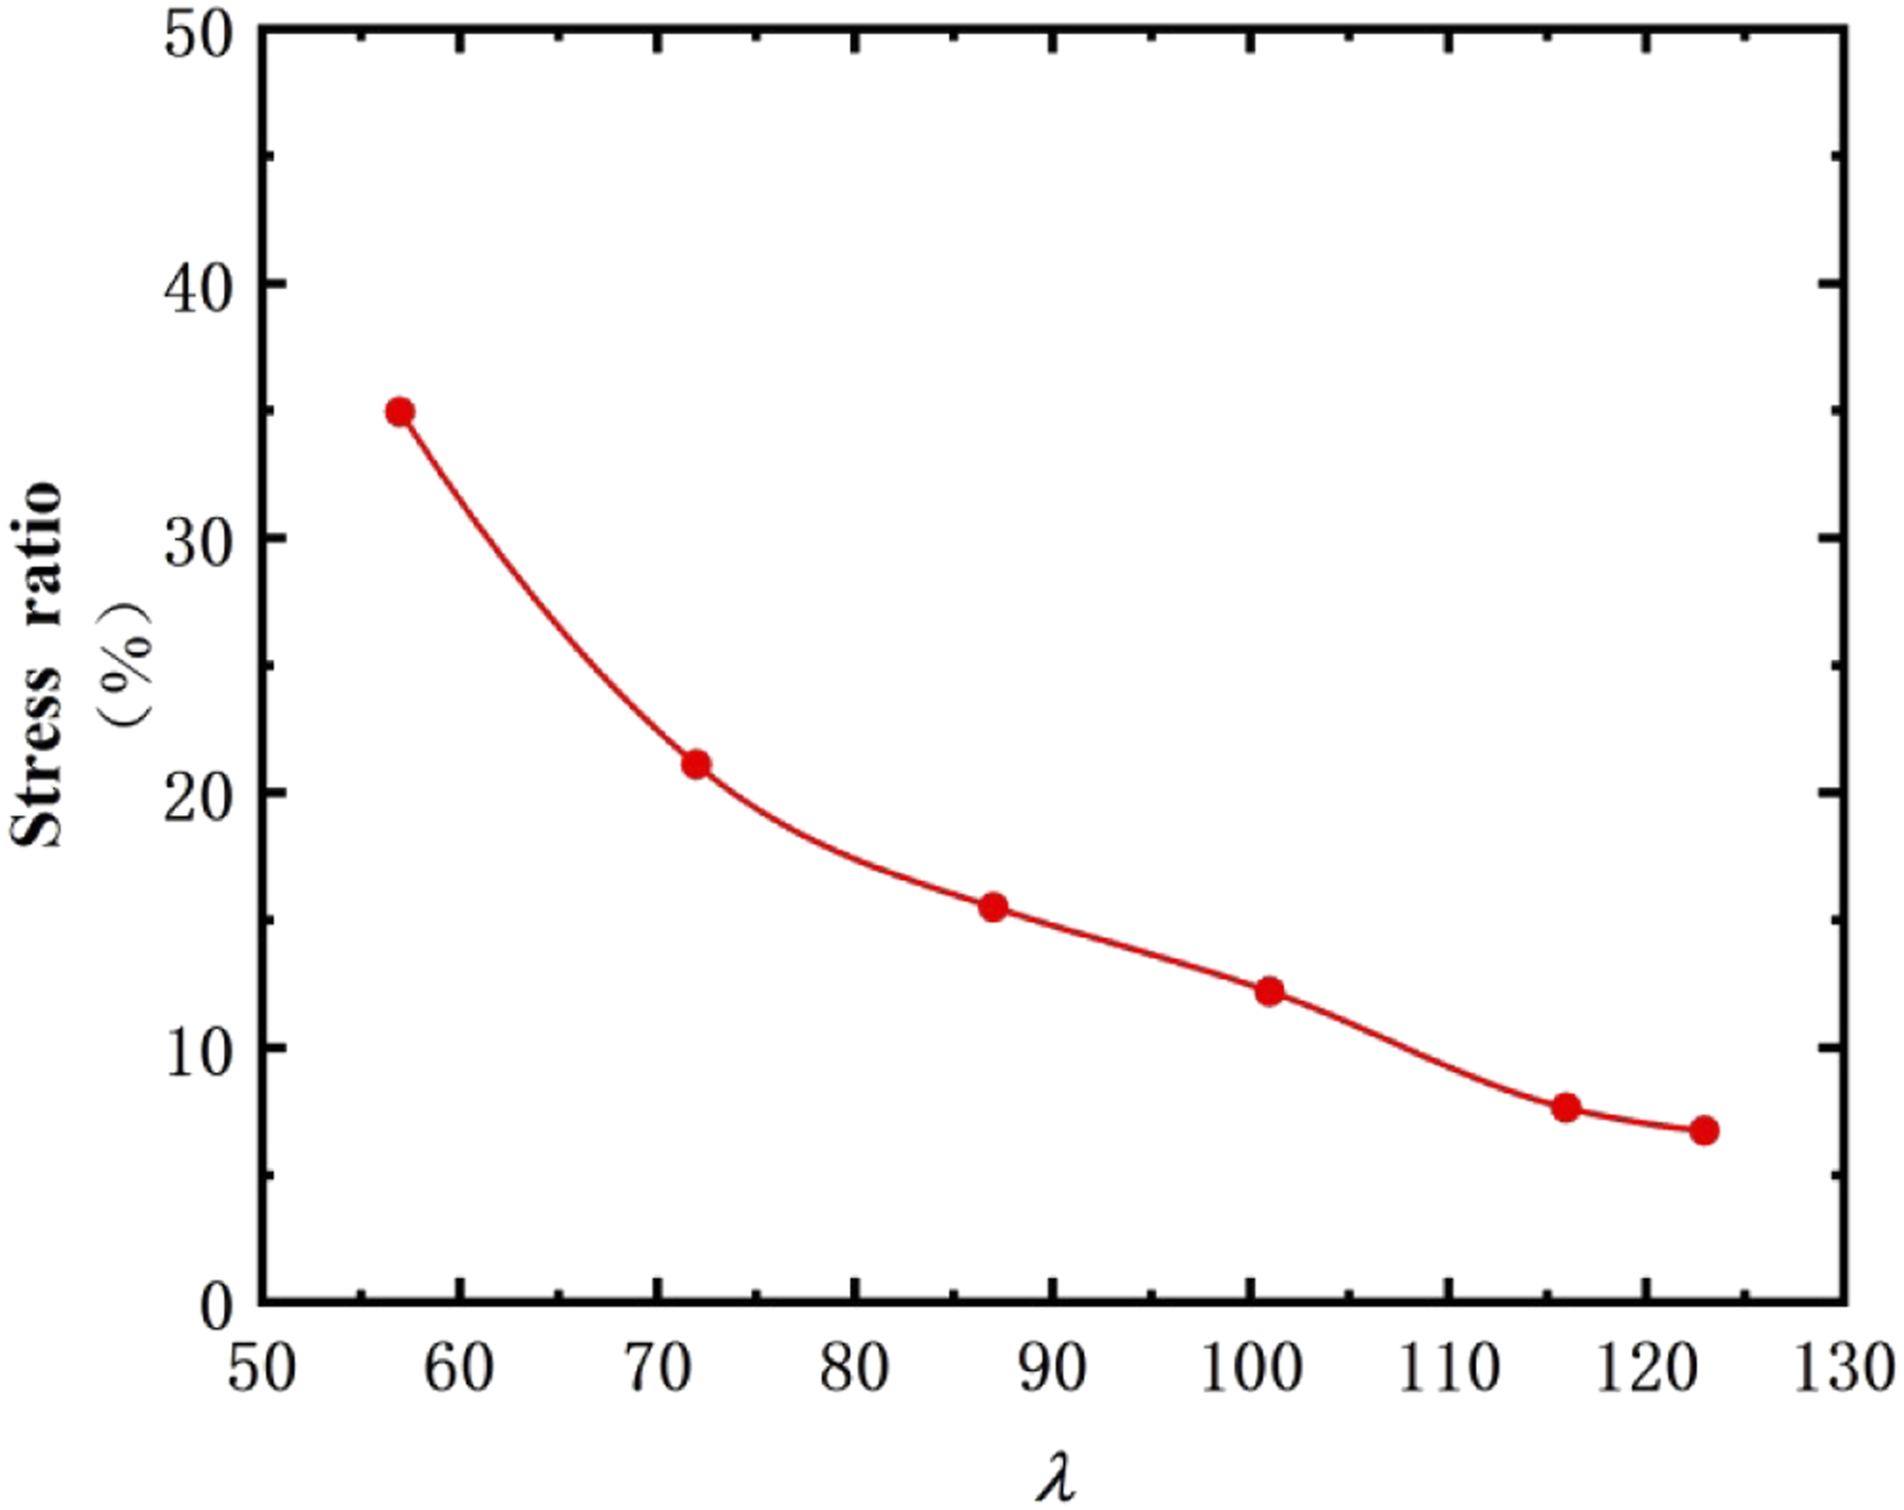
Relationship between slenderness ratio and stress ratio.
Strain analysis
The load-strain curves of all specimens essentially show the same trend. The load-strain curve of GM1 is shown in Figure 8. The figure shows the axial strain A and circumferential strain B of the measuring points 1#-4#. With an increase in load, the strain increased. Before the load reached 70% of the ultimate load, the measuring point 1-A (axial strain on the compression side) and the measuring point 2-A (axial strain on the tensile side) showed a linear increase, and the entire section of the specimen was under compression. When the load reached 70%–90% of the ultimate load, the slope of the curve at measuring point 1-A (axial strain on the compression side) increased, and the rate of increase in strain due to pressure increased. The slope of the curve at the measuring point 2-A (axial strain on the tensile side) decreased, and the rate of increase in compressive strain slowed and reversed direction; the specimen lost stability when the strain was about to become tensile. At 90% of the ultimate load, the growth rate at the measurement point 1-A (axial strain on the compressive side) increased significantly, and the compressive strain at the measurement point 2-A (axial strain on the tensile side) reduced to zero and turned into tensile strain with a very rapid growth rate. It indicated that the cross-section of the specimen enters a state of tension on one side and compression on the other side. At ultimate load, the measurement point 1-A reached ultimate strain and the specimen was destroyed. When the strain at measuring point 2-A (axial strain on the tensile side) changed from negative to positive, the strain at measuring point 2-B (circumferential strain on the tensile side) also changed from positive to negative. Similarly, measuring point 1 showed a Poisson effect. The axial strain of the measurement points 3 and 4 increased linearly with circular strain, while the signs of the strains at A and B were opposite. The change in strain was also consistent with the failure of the specimen, that is, the center of the compression side was the location with severe failure. Load-strain diagram.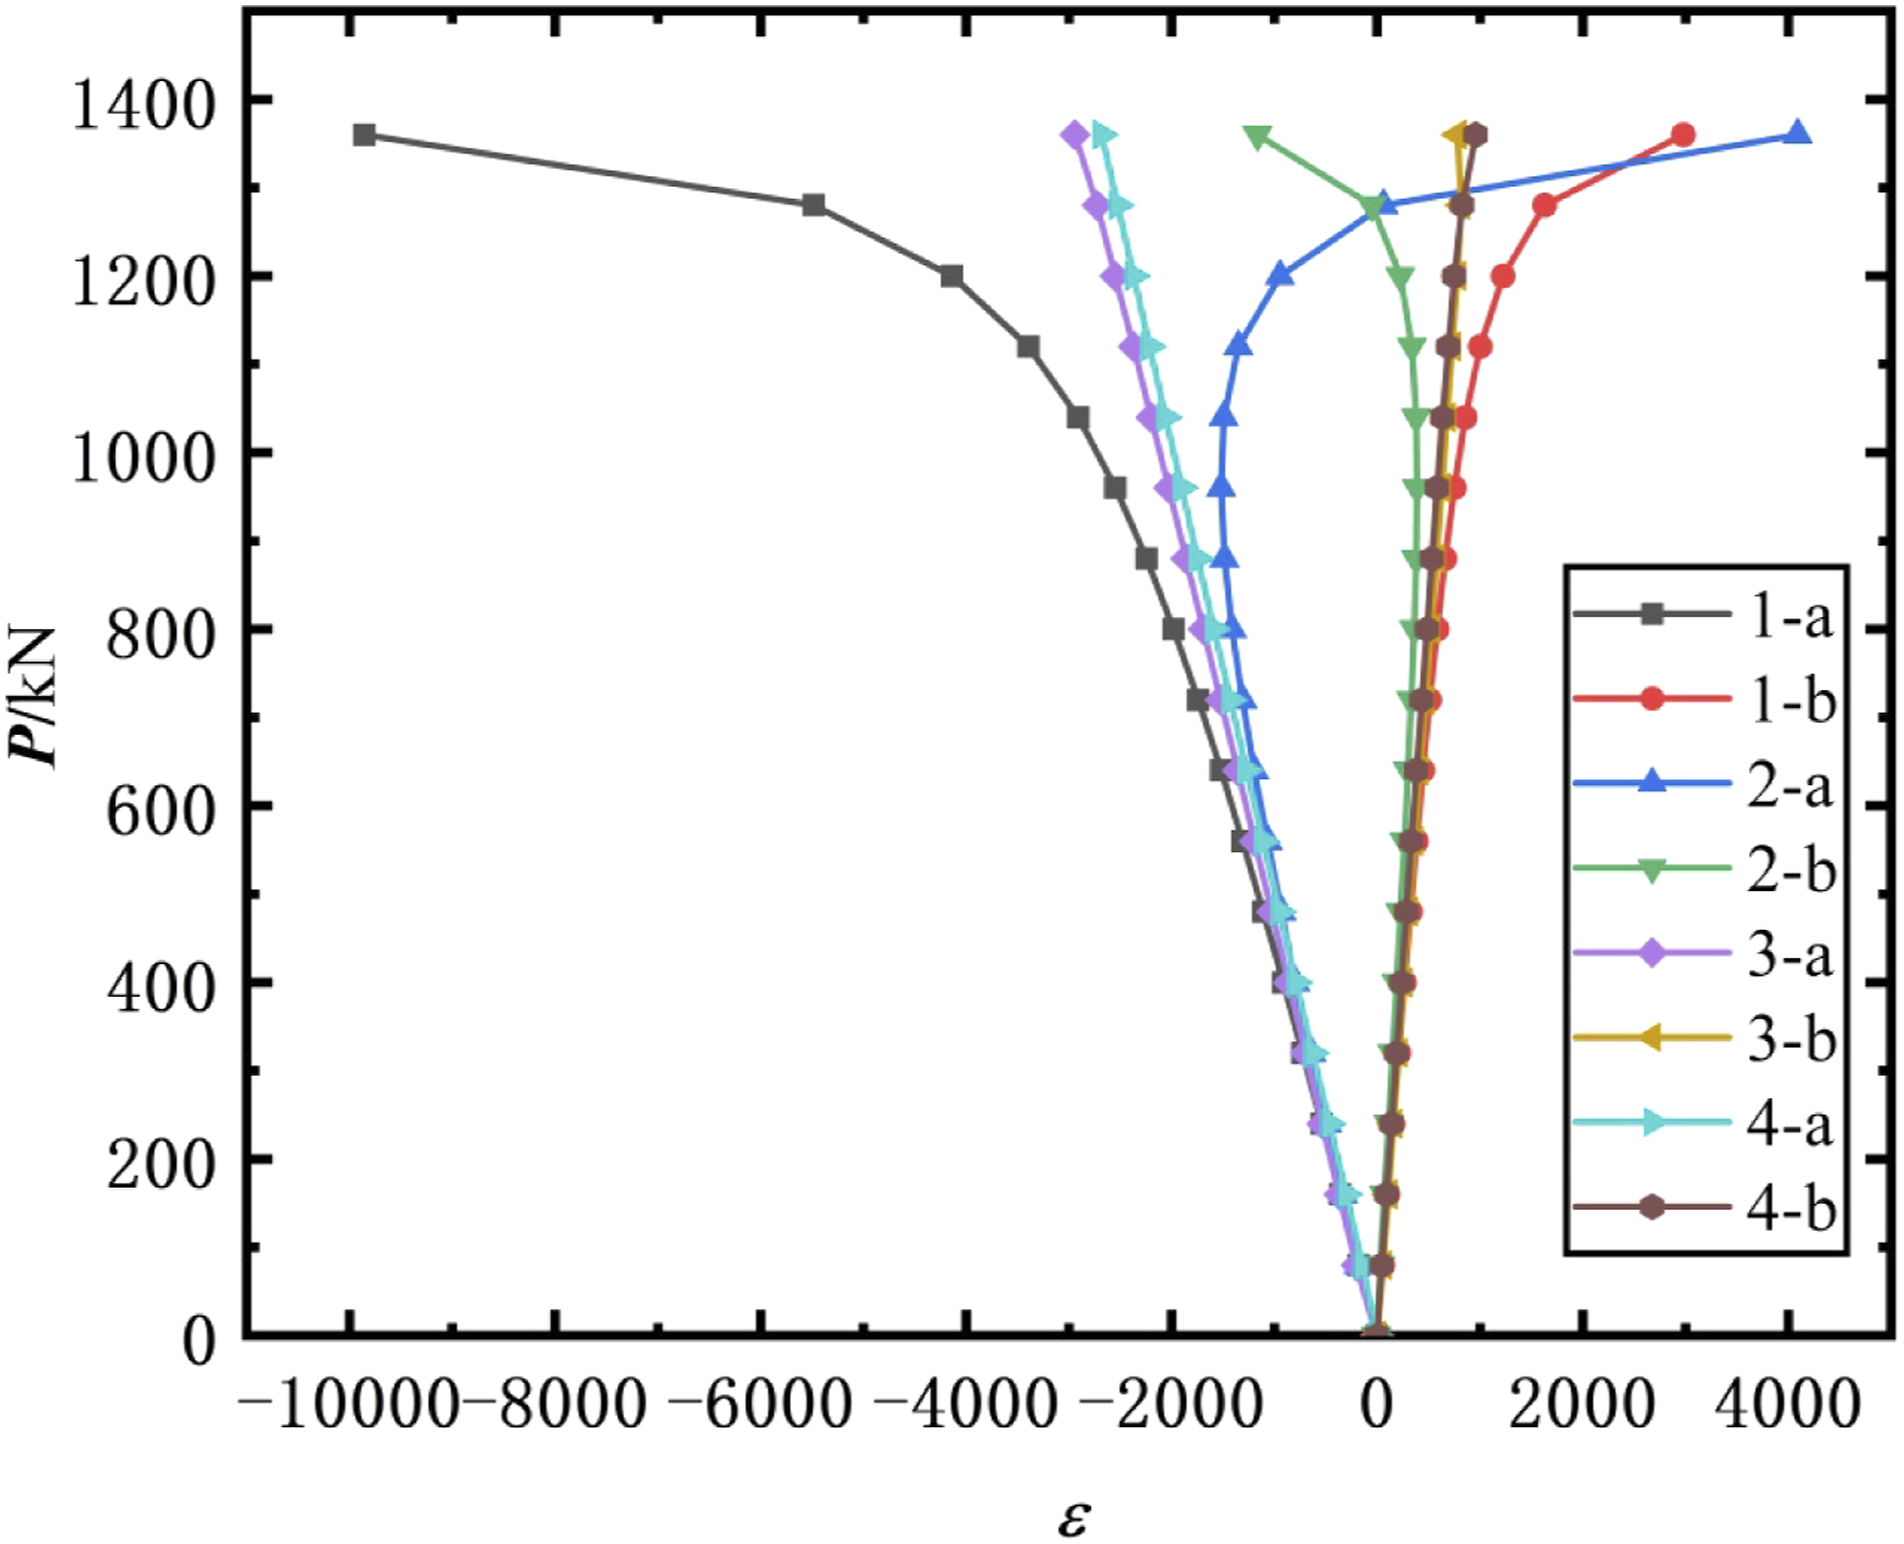
In summary, when the axial compression of a GFRP solid pole with a circular section reached ultimate load, it showed a buckling form at the instability of the extreme value point. At the initial stage of loading, the specimen was compressed in an axial direction and showed a tendency for transverse expansion. The entire section of the specimen was subjected to compressive stress by the resin matrix. With an increase in load, initial defects and eccentricities of the specimen manifested further, the compressive stress on the compression side of the section continued to increase, the rate of increase on the tensile side slowed, and then the compressive stress started decreasing. At this stage, the full section continued to be the resin matrix under pressure, and the specimen was unstable. As the load was increased, the compressive stress of the section on the tensile side decreased to zero and then increased in the reverse direction, and the compressive stress on the compressive side increased rapidly. At this point, the resin matrix on the tensile side was no longer subjected to compressive stress, and the glass fiber was subjected to increasing tensile stress. The tensile side changed from resin matrix compression to fiber tension, and the elastic modulus of the glass fiber was lower than that of the resin matrix. The larger deformation of the tensile side led to an increasing lateral bending of the pole, which in turn, led to the appearance of a bearing capacity platform after specimen buckling. When loading continued until failure, the compressive stress of the compression side and tensile stress of the tensile side increased significantly, and the ultimate strength of the resin matrix was far lower than that of glass fiber. The resin matrix first reached its ultimate strength, after which the specimen lacked sufficient stiffness and thus suffered from buckling failure (Qian et al., 2007).
The fibers of the material are arranged in an axial direction making them orthotropic, and thus the strength of material in the axial and transverse directions are very different. When the specimen was under axial compression, transverse tensile deformation also occurred due to the Poisson effect. During the buckling of the specimen, the resin matrix at the compression side reached the ultimate strength of compression, resulting in crushing failure and transverse cracking. Also, when in the transverse tensile state, due to the transverse tensile strength being very low, the resin matrix reached its ultimate tensile strength, longitudinal cleavage failure, and axial fracture. The transverse and axial fractures were penetrating, and the failure was flaky and detached from the surface. The tensile strength of the fiber on the tensile side was much higher than that of the resin matrix, and when lateral compression occurred on the tensile side, the resin matrix was subjected to this part of the pressure; hence, there was no evident damage on the tensile side of the specimen. Finally, due to the failure of the resin matrix at the compression side, the entire specimen lost adequate stiffness and buckling failure of the specimen occurred. It is the buckling phenomenon of an Euler struct where the specimen will be controlled by flexural behavior due to the massive lateral displacement after it was under axial load control before buckling (Alhawamdeh et al., 2021).
Research on the calculation of buckling bearing capacity
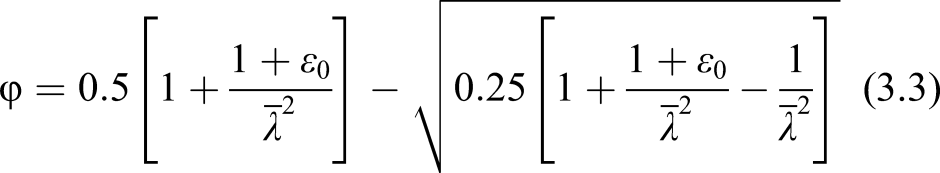
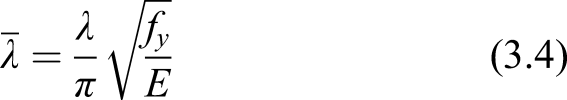
Euler’s formula (3.1) can be used to study the stability of an ideal linear elastic compression pole. It is a commonly used formula for calculating the critical force of a compression pole and fundamental for studying the stable bearing capacity of axial compression members. The Perry–Robertson formula (3.2) is mainly applicable to material components with minimal plasticity at the onset of instability. The formula determines a stability coefficient from the material failure criterion at the edge of the section, using relevant geometric defects and basing the calculations on elastic theory. Formula (3.2) is used for calculating the critical force of the pressure pole. In several studies of GFRP members, researchers have used these two formulas to calculate the buckling bearing capacity of GFRP members (Wang et al., 2016; Xue et al., 2013). However, these two formulas are applicable only for homogeneous materials. To calculate the buckling bearing capacity of these types of anisotropic solid specimens, based on the Perry–Robertson formula and the test data obtained in this study, MATLAB software was used to apply the least squares method, a nonlinear data fitting regression was conducted, and formula (3.5) to calculate the stability coefficient was proposed. Since it is not easy to determine the relative initial bending Stability coefficient fitting curve. A comparison of the calculated values from the three equations.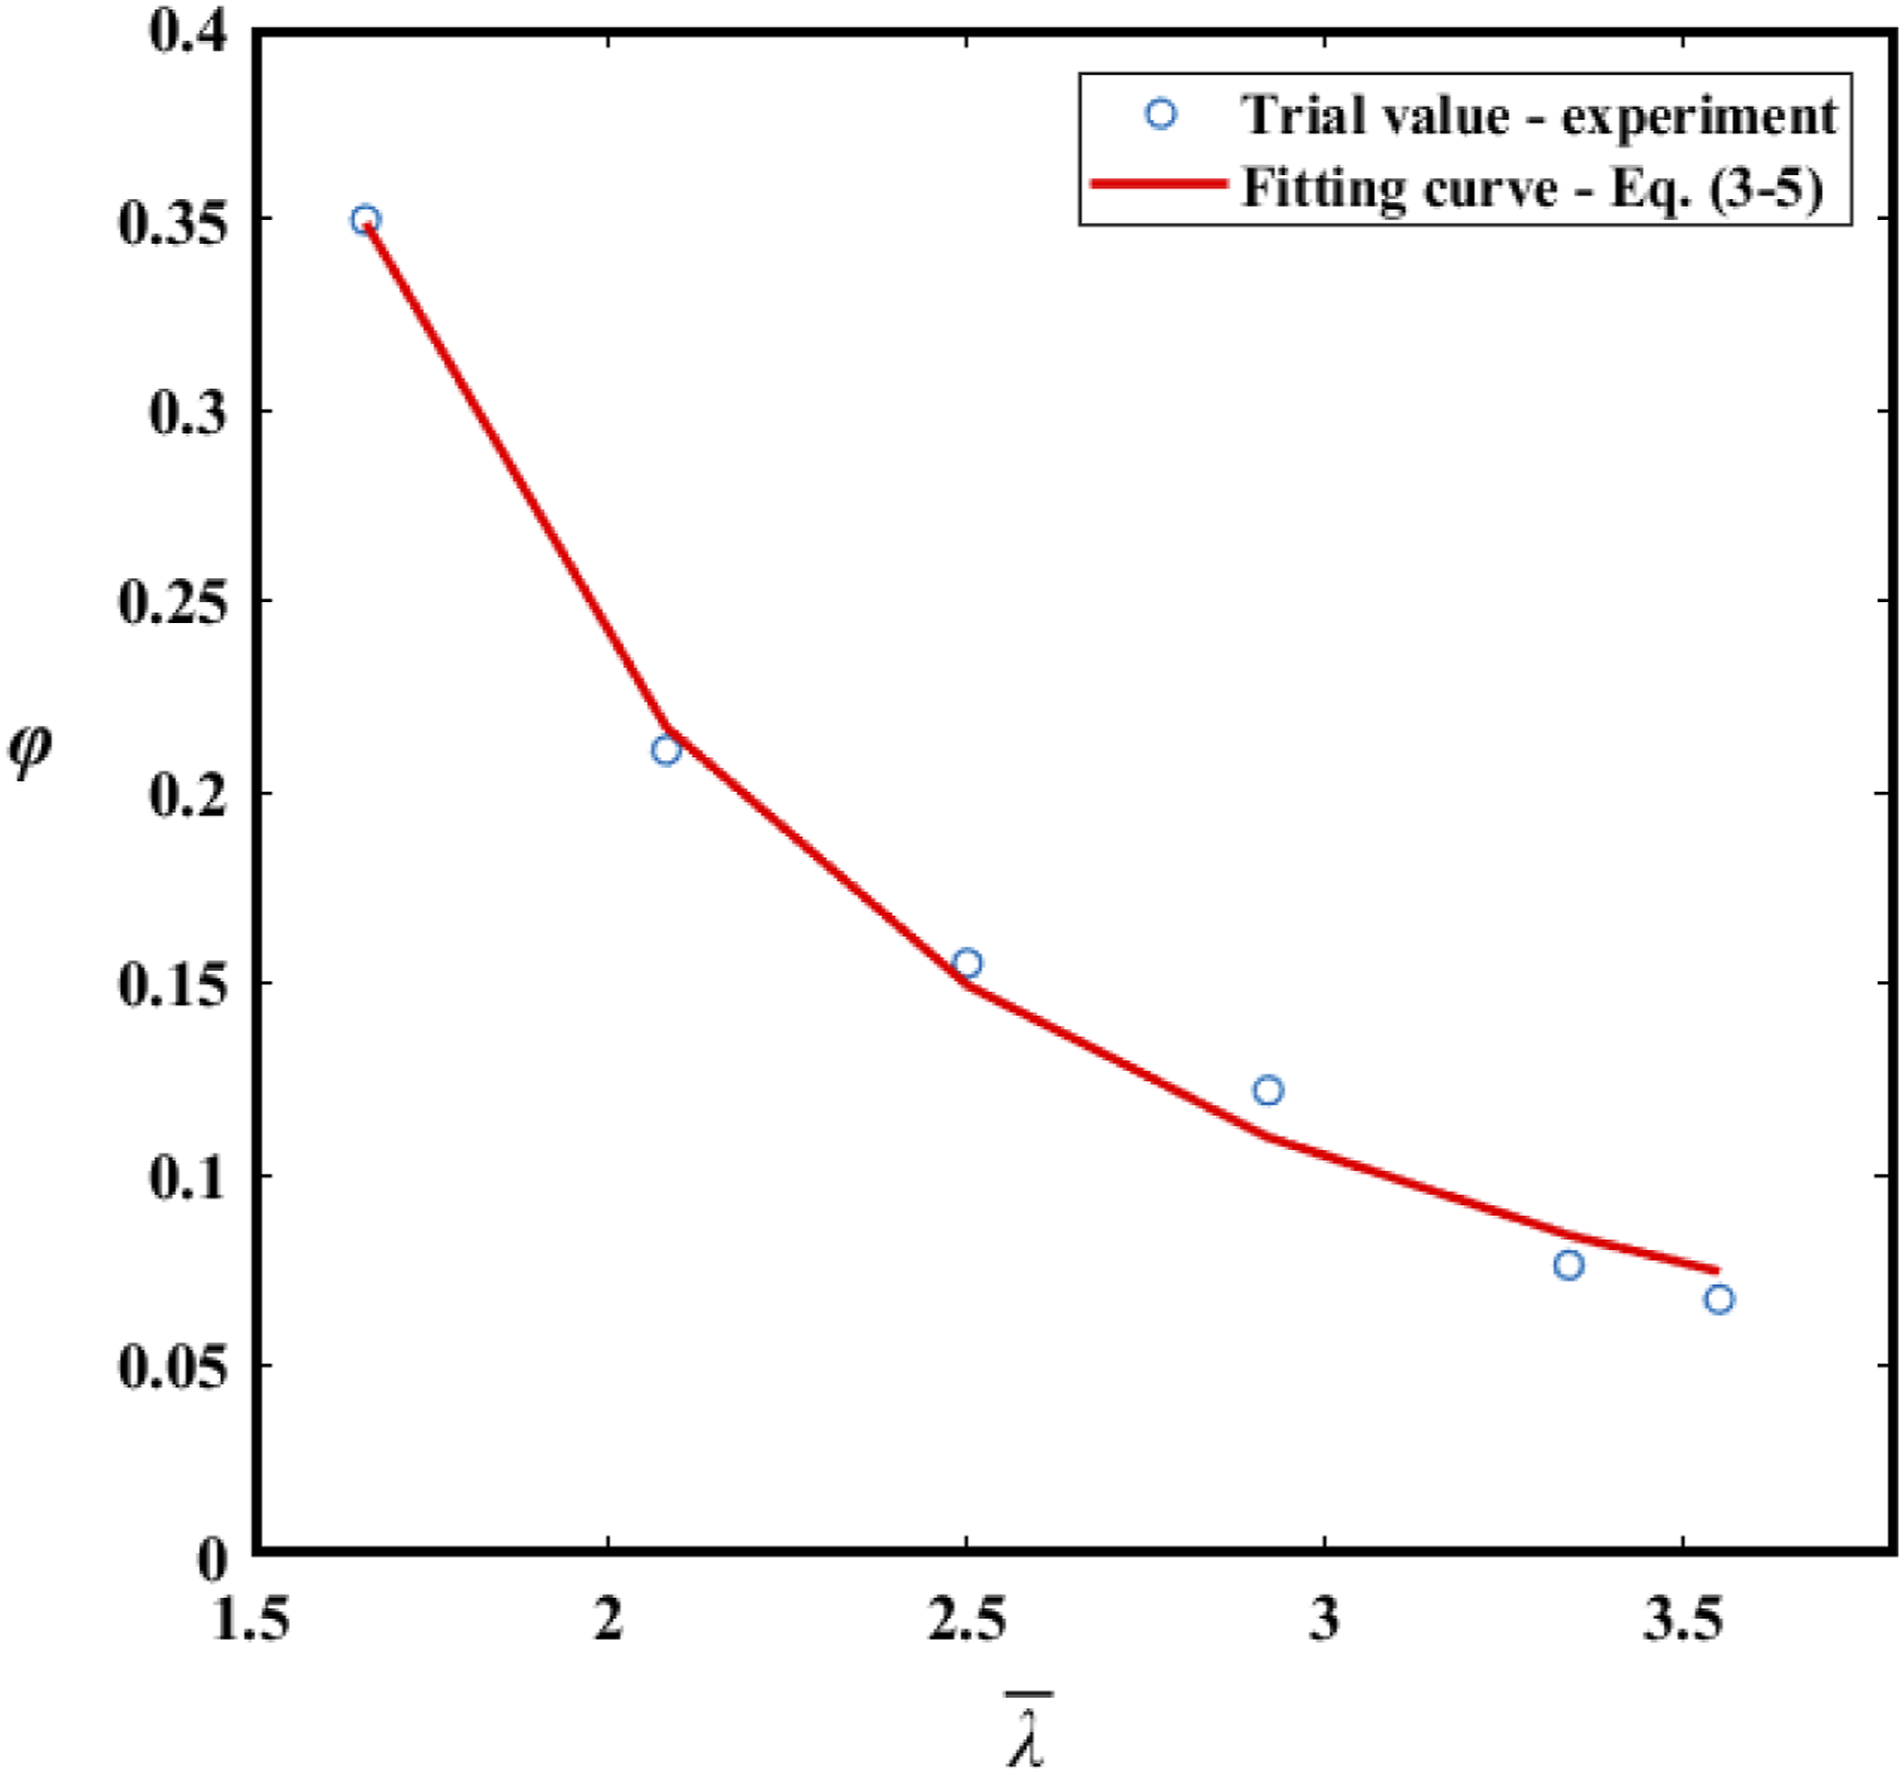
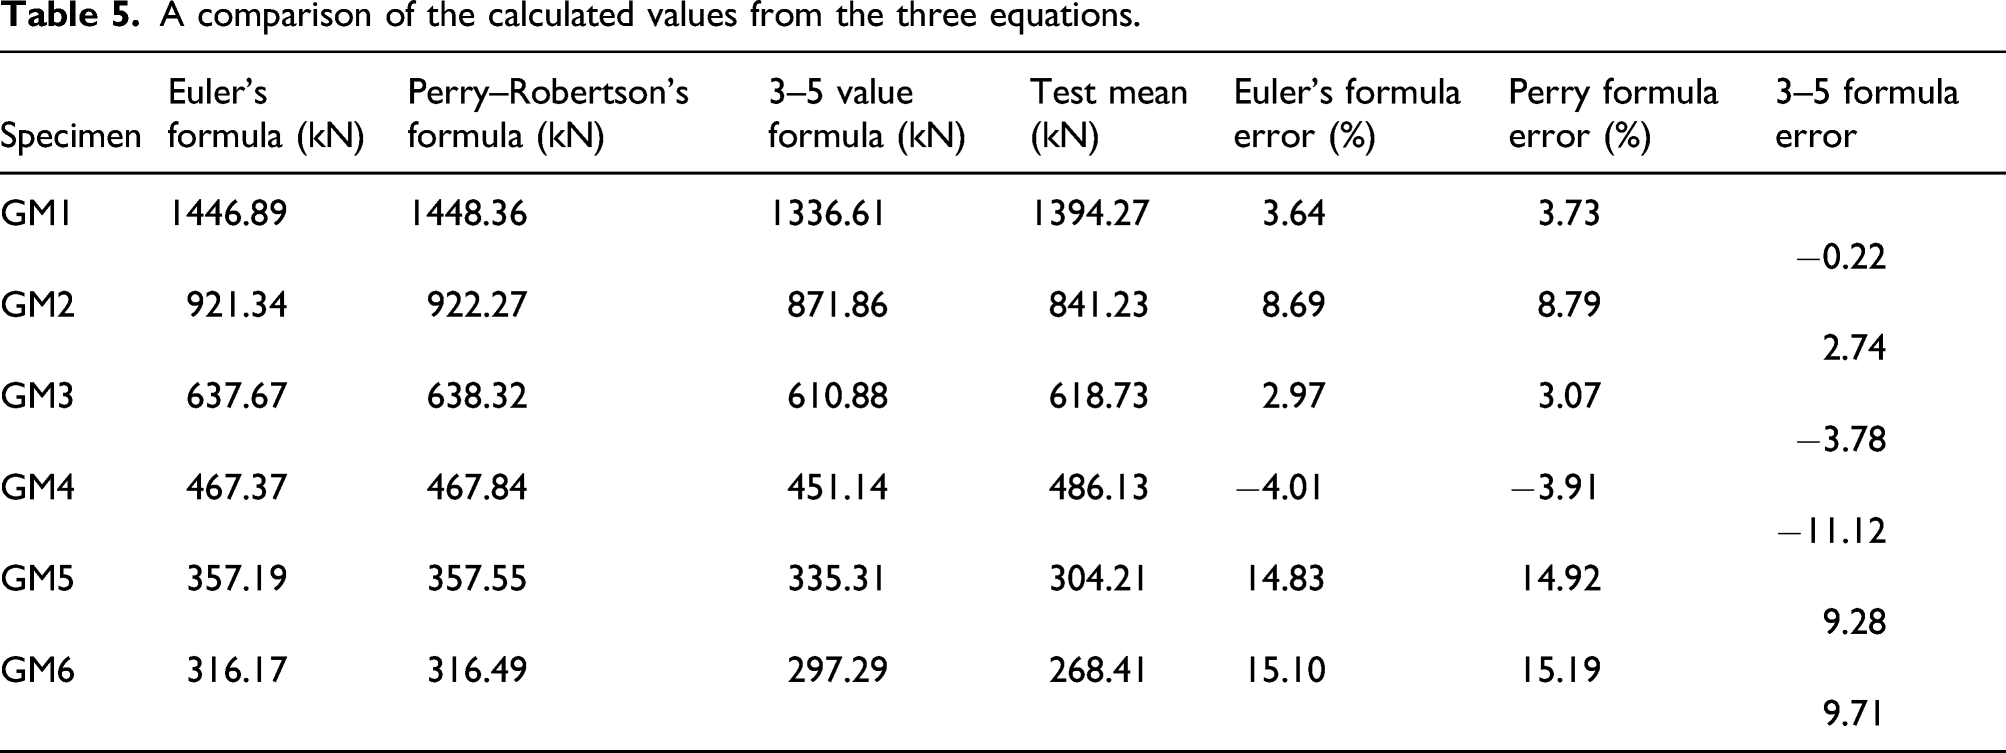
It can be seen from Figure 10 that when formula (3.5) was used to calculate the stable bearing capacity of test specimens with slenderness ratio not exceeding 87, the calculation error was small, the maximum error was 3.78%, and the minimum error was 0.22%. When the slenderness ratio reaches 101, the calculation error increased significantly, with a minimum error of 9.28% and a maximum error of 11.12%. When the slenderness ratio increased to 101, the initial eccentricity of the pole and its inherent defects had a greater impact on the stable bearing capacity, resulting in a significant increase in error. Equation (3.5) is a fitting formula, which is significantly affected by the results of the test and does not consider the specific initial defect Comparison of errors from the three equations.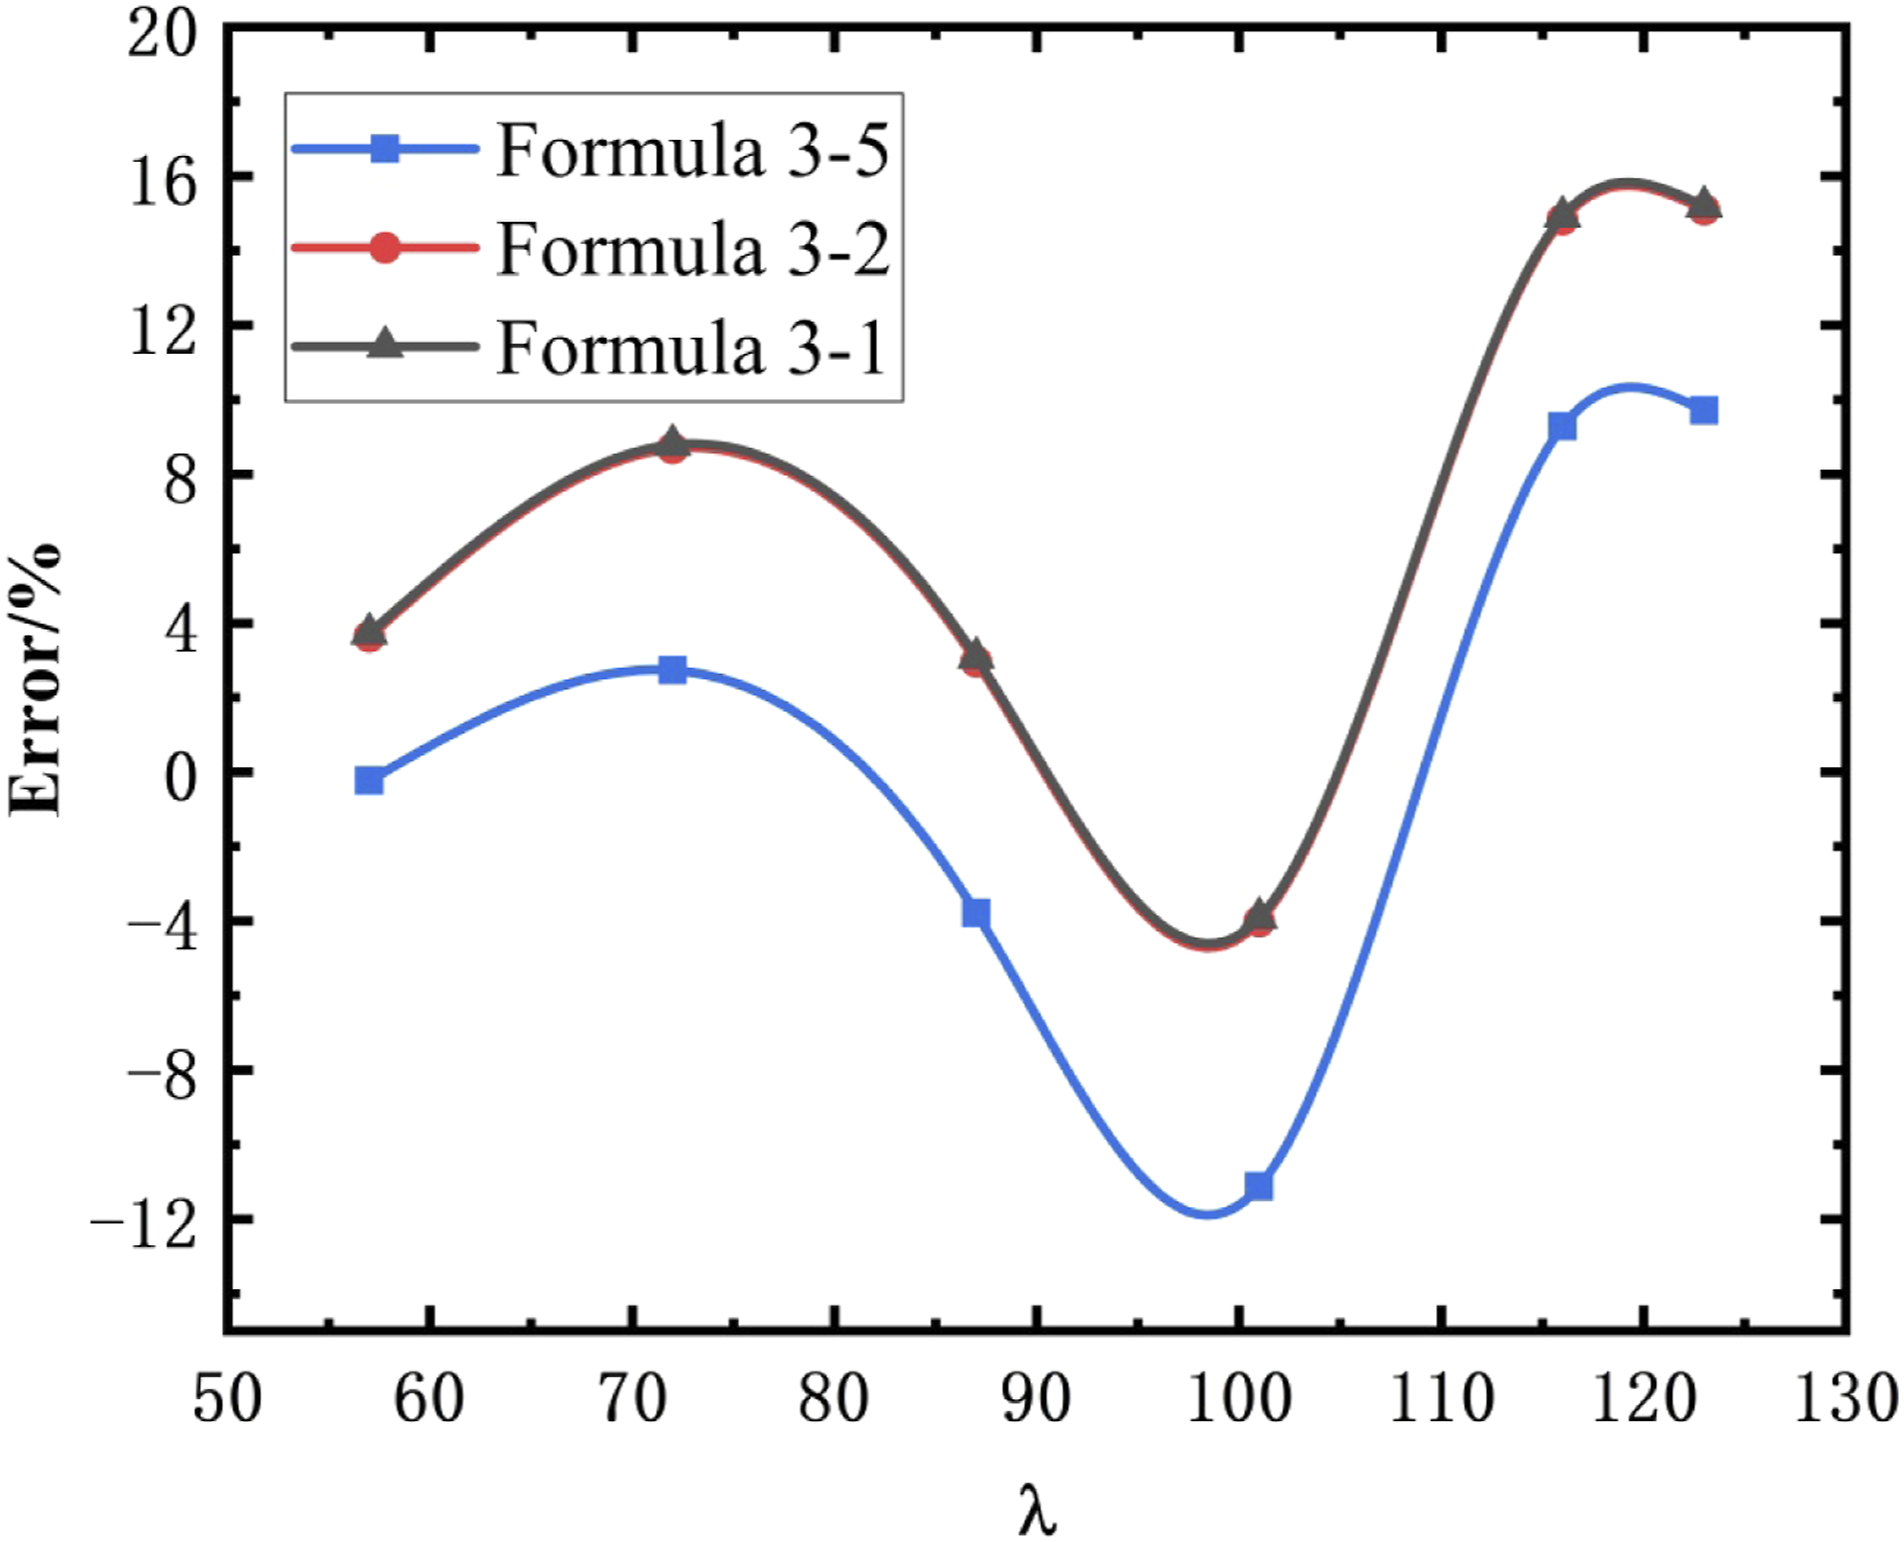
Combined with the analysis in Analysis of bearing capacity, when calculating GFRP compression poles with a slenderness ratio of less than 80, the calculation error of Euler’s formula is not much different from that of the formula proposed in this article. The formula proposed in this article is more complicated and the error is smaller. However, it is easier to use Euler’s formula, and it can also provide a good estimate of the buckling load.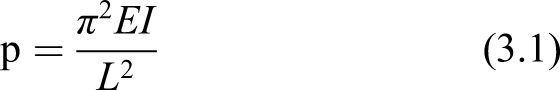
In the above equation, P is the buckling bearing capacity, E is the elastic modulus of the specimen, I is the moment of inertia of the section, and L is the calculated length of the specimen.
In the above equation, 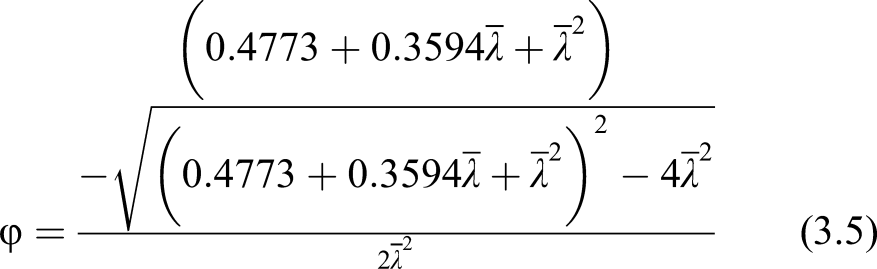
Conclusions
From the axial compression experiments with GFRP solid poles with circular cross-sections, the buckling bearing capacity, failure modes, and calculation methods for poles with different slenderness ratios were studied, and the main conclusions are as follows: 1. Under axial compression, the failure mode of a GFRP solid pole with a circular section is the loss of stability of the extreme point, and the material in the middle of the specimen suffers axial and transverse tearing failures; when overall lateral buckling of the specimen occurs, a bearing capacity platform phenomenon appears, and when the ultimate deformation is reached, the specimen undergoes brittle failure. 2. The buckling bearing capacity of GFRP members has a nonlinear relationship with the slenderness ratio. As the slenderness ratio increases, the rate of decrease of the buckling bearing capacity decrease. As the slenderness ratio increases from 87 to 123, the stress ratio decreases from 34.95% to 6.73%. According to the test results of this study, it is recommended that the slenderness ratio of the circular cross-section solid compression member not exceed 80. 3. It was found from the experiments that material in the middle of GFRP poles is seriously torn after buckling. During the destruction process, the resin matrix on the compression side reaches the ultimate compressive strength, and crushing failure occurs, leading to the generation of transverse cracks. Due to the Poisson effect, the compression side is in a transverse tensile state, and the resin matrix is stretched to its ultimate tensile strength, resulting in axial tearing failure. In the course of buckling, the tensile side is transformed from the compression of the resin matrix to a tensile state of the fiber, and the elastic modulus of glass fiber is much lower than that of the resin matrix. After tension occurs, an increase in deformation leads to a rapid increase in lateral bending which causes the phenomenon of the bearing platform. 4. According to the analysis, the Euler formula provides a good estimation for the failure load for slenderness ratio less than 80 as recommended in this article, and the calculation is easier.
Footnotes
Acknowledgments
The author(s) gratefully acknowledge the support for this work, which was funded by Natural Science Foundation of Shaanxi Province (Grant No. 2021JM-332).
Declaration of conflicting interests
The author(s) declared no potential conflicts of interest with respect to the research, authorship, and/or publication of this article.
Funding
The author(s) disclosed receipt of the following financial support for the research, authorship, and/or publication of this article: This work was funded by Natural Science Foundation of Shaanxi Province (Grant No. 2021JM-332).