
Abstract
Influence line (IL) has emerged as very promising damage indices for bridge damage detection. This study proposed a method to localize and quantify damage in beam structures by estimating section flexibility change from deflection IL (DIL) change. To this end, the relationship between second derivative of DIL change and flexibility change was established. To remove noise interference in measurement, piecewise quadratic functions were used to fit and replace noisy DIL change curves, wherein the coefficients of quadratic function were determined via a sparse regularization method, considering the sparsity nature of damage that typically takes place in only a limited number of elements. The feasibility and accuracy of the proposed method are verified through numerical examples and laboratory experiments. Through four hypothetical damage scenarios of a simply supported beam with one or two damaged locations, its ability to quantify minor damage and its anti-noise robustness were well verified. Finally, a laboratory experiment on a simply supported aluminum beam illustrated that the location and extent of damage could be successfully identified in the single-damage and double-damage cases. The numerical and experimental results indicate that the proposed method is promising for future damage localization and quantification of bridge structures.
Introduction
To meet the economic and social needs of communities, a large number of bridges have been constructed throughout the world in the past several decades. The number of highway bridges in China has exceeded 850,000 by the end of 2018, 90% of which are short- and medium-span bridges. After large-scale bridge construction, how to ensure safety of in-service bridges is a challenging problem. Though failure of local components is detrimental to the performance of whole bridges, the detection of local damage at an early stage is very difficult. Therefore, an efficient damage detection method that is sensitive to early damage is essential for the maintenance of bridge structures.
In recent years, identifying structural vibration characteristics from the dynamic responses and constructing corresponding damage indices have been studied extensively. Among a variety of vibration-based damage detection techniques, well-known methods include both frequency-domain and time-domain methods (Doebling et al., 1998; Fan and Qiao, 2011; Li and Hao, 2016; Zou et al., 2000). Frequency-domain methods are based on the change of frequencies (Khiem and Lien, 2004; Narkis, 1994), mode shapes and their derivatives (Stubbs and Kim, 1996; Wang and Qiao, 2008), modal strain energy (Shi and Law, 1998), dynamic flexibility (Pandey and Biswas, 1994; Zhu et al., 2015), frequency response functions (Liu et al., 2009; Maia et al., 2003), etc. Meanwhile, time-domain methods have attracted more and more interests recently, because of the significant advantage of only requiring relatively fewer sensors. Lu and Law (2007) proposed a damage detection method based on response sensitivity analysis. Zhu et al. (2015) proposed a dynamic response sensitivity-based model updating method to simultaneously identify the structural damage and moving force. Link and Weiland (2009) concluded that moving loads can excite bridge structures with large amplitudes when they are approaching sensor locations. He and Zhu (2015) found that moving load-induced dynamic response of a beam can be decomposed into moving- and natural-frequency components, and the former component was a superior index for damage localization. More moving-load based damage detection methods have been proposed and developed (He et al., 2017; Zhu and Law, 2015).
Although these vibration-based methods demonstrated varying degrees of success, several limitations were also recognized. One main shortcoming is that structural dynamic characteristics are either insensitive to local damage (such as frequencies) or too sensitive to changes of operational environment (such as temperatures). In addition, sufficient locations are required for measuring some dynamic characteristics (such as mode shapes) in order to obtain accurate spatial information, which is strictly limited in practical applications (He and Zhu, 2015).
Meanwhile, emerging influence line (IL)-based damage detection methods have been developed for bridge structures. An IL is a static property that describes the variation of deflection, stress, reaction, or internal loading at one location if a structure is subjected to a moving unit load (Zheng et al., 2019). Aktan and Catbas (2002) pointed out that strain or deflection influence lines could be a very promising index for bridge condition evaluation. Identified by integrating video images and sensor data, the IL was used to detect damage in a four-span steel bridge (Zaurin and Catbas, 2011) and a steel bascule bridge (Zaurin et al., 2016). A group of damage localization indices based on stress ILs (SILs) were verified through the case study of a long suspension bridge (Chen et al., 2015), and the accuracy of damage localization was further improved by fusing information of multiple stress ILs (Zhu et al., 2014). Rotational IL (RIL) was also used to develop new damage detection methods for condition assessment of bridge structures (Alamdari et al., 2019; Huseynov et al., 2020). Other IL-based damage detection studies were also included in literatures (Liu and Zhang, 2018; Wang et al., 2019). Accurate identification of bridge ILs is a fundamental step before application to damage identification. Fortunately, it has been a mature technology to identify ILs by using slowly moving pre-weighted truck-induced responses, and new methods directly using fast moving vehicle-induced dynamic responses were proposed (Zheng et al., 2019).
More recently, damage quantification methods have been proposed by using deflection influence lines (DILs). For example, Chen et al. (2018) revealed the relationship between change in DIL and structural damage in an explicit form, and then developed a novel damage detection and quantification method. One disadvantage of this method is its dependence on an accurate finite element model (FEM), which brings extra difficulties and errors to practical applications. Zeinali and Story (2017) proposed a theoretical framework for estimating the flexural rigidity based on the second derivative of DIL and identifying both the location and severity of damage. This damage quantification method can be performed without establishing FEMs, and its damage index has a clear physical meaning. Furthermore, a curve fitting method integrating with Iterative Multi-parameter Tikhonov Regularization (IMTR) was applied to process noisy DIL (Zeinali and Story, 2018), so as to reduce adverse impact of noisy DIL on estimating flexural rigidity. The curve fitting processing makes the method insensitive to noise interference. However, given that the change of IL caused by early damage is far less than the IL itself, the curve fitting process may also remove the IL change components containing damage information, making it insensitivity to minor damage.
Inspired by the relationship between DIL change and damage extent that is revealed by Chen et al. (2018), a new method is proposed to identify damage extent based on flexural rigidity change that can be estimated from DIL change. Identifying the actual location and severity of structural damage from many possibilities is an inverse problem, and the identification equation of inverse problem to be solved is normally ill conditioned. In order to ensure that the identification results have a good robustness, the regularization methods, such as Tikhonov Regularization and Sparse Regularization, are often utilized to improve the solution of the ill-conditioned inverse problem (Pan and Yu, 2019).
Through the regularization methods, an optimal objective function can be established to obtain the optimal coefficient vector, which can minimize the difference between the measurement and estimated response and stabilize the solution with physical meaning. Sparse Regularization is a newly developed technique that can be applied to solve inverse problems, such as damage detection (Fan et al., 2020; Hou et al., 2018; Wang and Hao, 2013; Zhang and Xu, 2016; Zhou et al., 2015), load identification (Pan et al., 2018; Qiao et al., 2016), and IL identification (Chen et al., 2019). Sparse Regularization techniques require solutions to satisfy the sparsity constraint, that is to say, most elements in the solution should be approximately equal to zero or have a sparse representation of orthogonal basis in spatial domain (Eldar and Kutyniok, 2012).
In this paper, the relationship between the second derivative of DIL change and the flexibility change in an explicit form is established. By using the piecewise quadratic functions to fit the curve of DIL changes, the identification problem can be transformed into solving the change of quadratic term coefficients. In order to identify sparse solution accurately, a sparse regularization method is introduced to determine the coefficients that are used for fitting the curve of DIL changes. Furthermore, the step-by-step procedure of damage localization and quantification of beam structures using DIL changes is proposed. Finally, the feasibility and accuracy of the proposed method are verified through numerical studies and laboratory experiment.
Theoretical formula
Damage quantification using DIL changes
Zeinali and Story (2017) presented a theoretical framework for estimating flexural rigidity of Euler-Bernoulli beams using static DIL. In this study, the relationship between the second derivative of DIL and the flexural rigidity for beam structures is presented as:
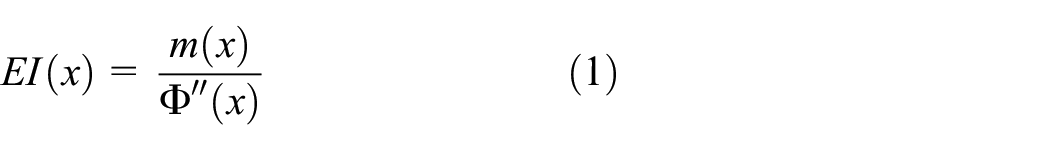
where
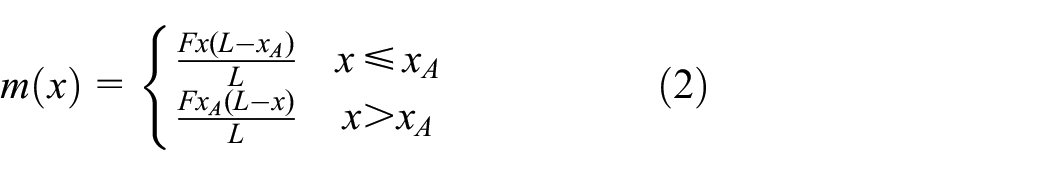
Bending moment diagram of simply supported beam under unit load.
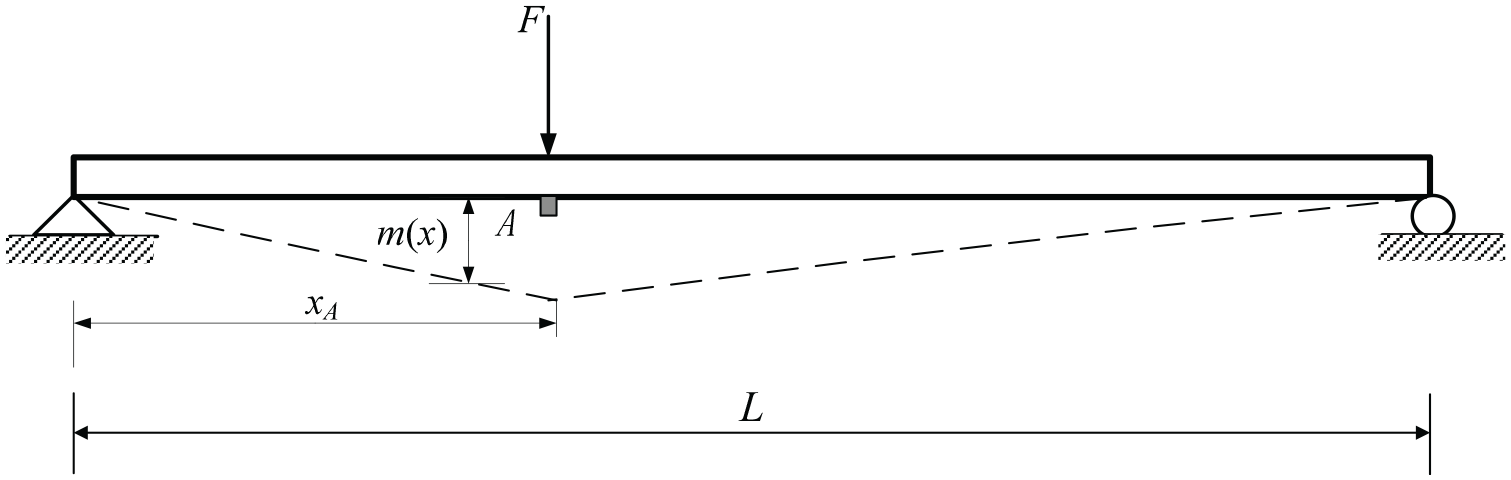
A local damage of beam can result in a change of flexural rigidity
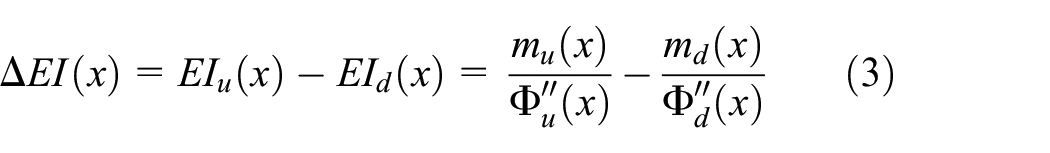
where the subscripts u and d stand for undamaged and damaged states, respectively. The above equation can be transformed into an incremental form as follows:
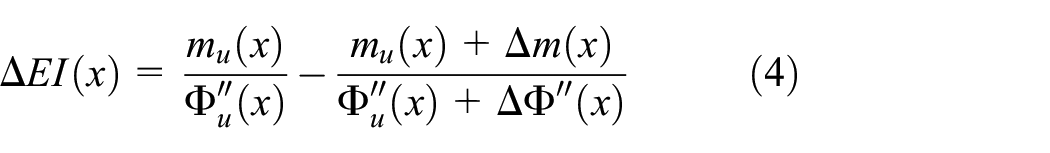
with


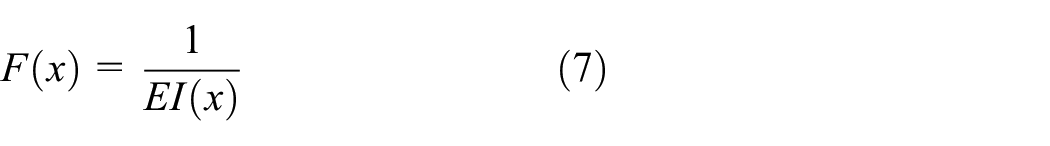
Sectional flexibility is specially defined as the reciprocal of sectional flexural rigidity.
Thus, the damage-induced flexibility change
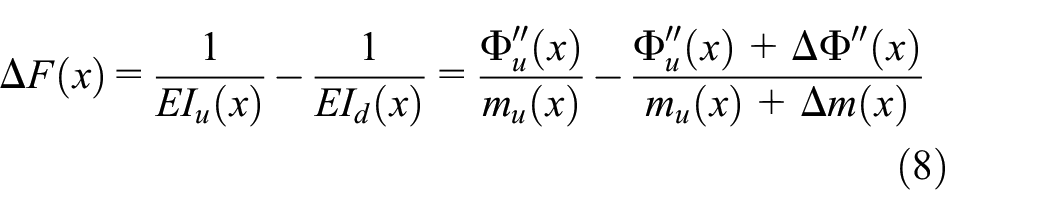
For a simply supported beam, damage-induced flexural rigidity reduction could result in DIL change, but the bending moment remains unchanged. Substituting
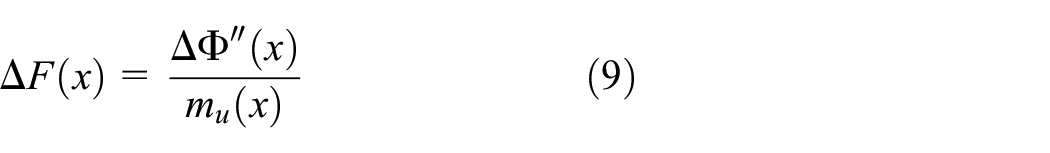
Based on the relationship between the second derivative of DIL and the flexibility change, the flexibility change of beam structures can be determined by equation (9). If the initial rigidity without damage
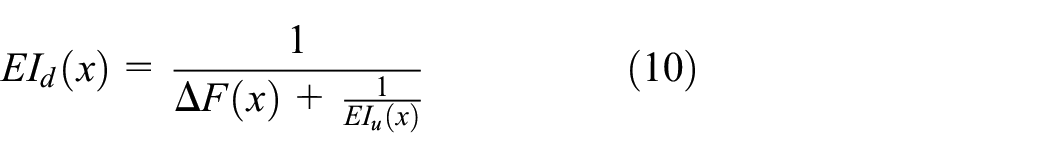
The Normalized Flexural Rigidity (NFR) index can be defined as:
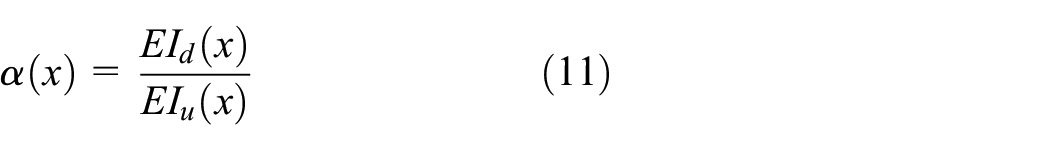
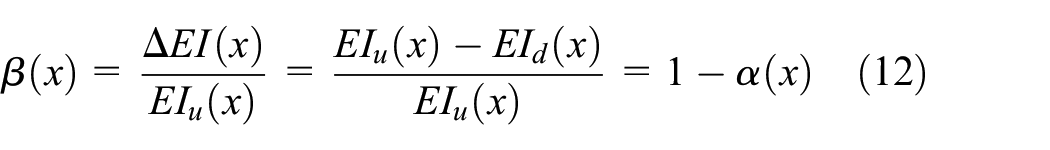
To exactly describe damage extent of the section at x location, the damage index is defined as:
For indeterminate systems, additional information regarding system internal load (e.g. an internal moment calculated by measuring the strain and flexural rigidity at one location) is required per each system’s degree of redundancy. Once this additional information is measured, the statically indeterminate system may be converted to multiple statically determinate systems and equation (1) can be implemented for the flexural rigidity estimation. Concisely, equation (1) is applicable for flexural rigidity estimation of all types of Euler-Bernoulli beam systems (Zeinali and Story, 2018). It should be noted that, the above method is also applicable for a continuous beam except for introducing some modifications. Different from a simply supported beam, the DIL change of a continuous beam is composed of those caused by flexural rigidity reduction and caused by support reaction change. For this reason, the component in DIL change caused by the changes of support reaction force is quantified by measuring the support reaction ILs by force or pressure sensors pre-installed at the support bottom, and then it is eliminated for accurate estimation of flexibility change in a continuous beam.
Representation of DIL change using piecewise quadratic function
For damage quantification using the above method, the most critical task is how to determine the second derivative of DIL change accurately. Because directly obtaining real DIL change is almost impossible, an alternative approach is to measure DILs before and after damage and then estimate DIL change. However, the measured DIL is inevitably polluted by noise (such as measurement error and dynamic effect), and taking second derivative of DIL further enlarges noise interference, which makes it difficult or even impossible to detect damage. Therefore, curve fitting technology is introduced to determine DIL change curve from noisy data, and the measured DIL change is replaced by the fitting curve used in damage quantification.
For the goal of optimal curve fitting, an appropriate fitting function of DIL should be first determined. Given that both DILs before and after damage can basically keep smooth and continuous, the fitting function of DIL should also conform to the characteristics of continuous and smooth. If the beam is evenly divided into finite number of segment (Ns), and a large value for Ns is taken to consider a finer segmentation, then variation of
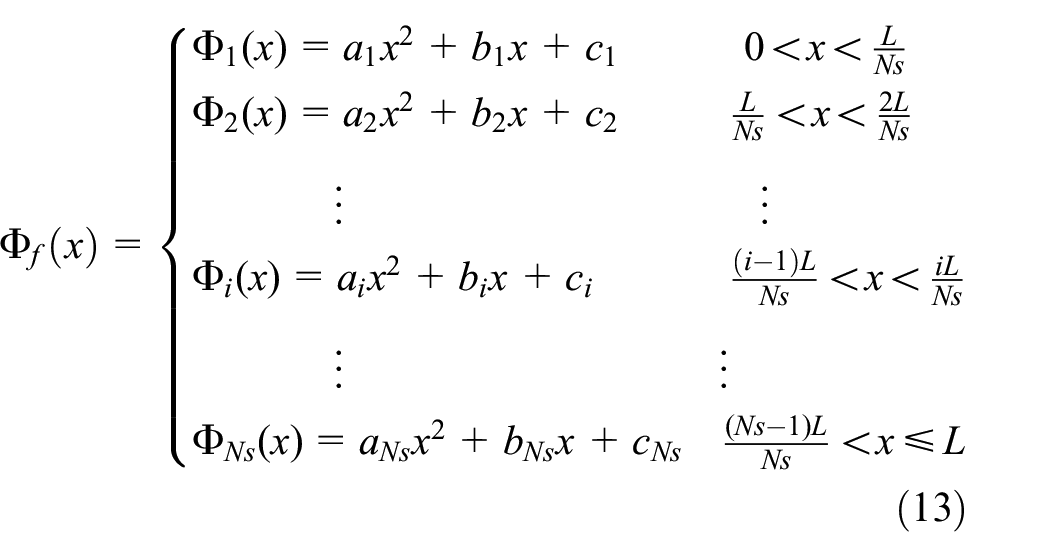
where
Given to the boundary conditions of beam structures and continuity properties among segments, the coefficient vector of primary term

In this study, the matrix


where
Inspired by the above equations, the DIL change

Curve fitting of DIL change based on sparse regularization
The measured DIL change polluted by noise and its corresponding fitting curve has a relationship as follows:

where

The beam for identification is evenly divided into a finite number of segments, and the quadratic term coefficient for each segment is regarded as the variable to identify. The second derivative of DIL change is linearly related to flexibility change, and has a tight correspondence to quadratic term coefficient change of each segment. Therefore, the coefficients of quadratic term will change together with the flexibility change, and vice versa. Considering that the early damage of the beam structure occurs locally, only the flexibility of individual segments is changed. Correspondingly, the quadratic term coefficient changes are not zero only in a few segments with damage, and most of them are zero (or close to zero), and thus the quadratic term coefficient change in the solution have an obvious sparsity property.
Sparse regularization which can produce a sparse coefficient vector is used for local damage detection. Based on the sparse regularization, the objective function for curve fitting of DIL change is established as follows:
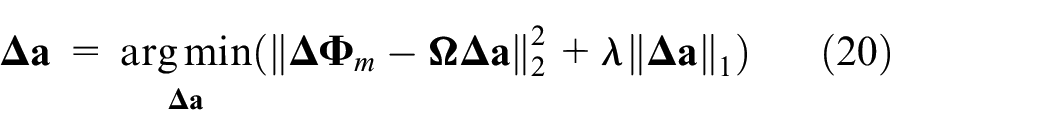
where
The optimal regularization coefficient
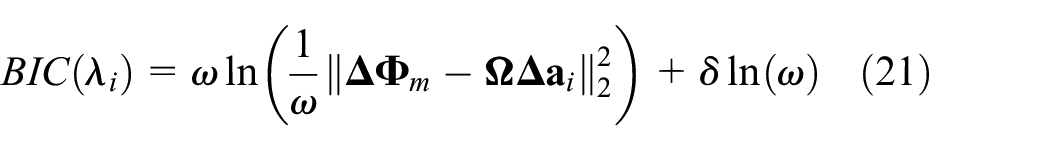
in which
Damage quantification procedure
A main procedure to localize and quantify damage of beam structures using DIL changes can be summarized as follows:
Step 1: Calculating DIL change from measured DILs
The first step is to obtain DILs at the measured points of a beam structure before and after damage, and then calculate DIL change.
Step 2: Fitting DIL change curve by parameter optimization
Determine the fitting matrix
Step 3: Damage quantification
Calculate the damage-induced change of flexibility
In the above procedures, fitting DIL change by piecewise quadratic functions is introduced to remove noise interference in measurement, and parameter optimization by sparse regularization algorithm is introduced to improve identification accuracy of damage that typically takes place in only a limited number of elements. In the following section, the accuracy and robustness of this method will be verified by numerical studies and a laboratory experiments.
Numerical verification
In a recently completed high-speed rail line in China, 90% of bridges were constructed with simply supported beams (Hu et al., 2014). For this reason, different hypothetical damage scenarios are simulated both in a simply supported beam with one or two damaged regions.
Introduction of beam model and damage scenarios
A simply supported beam as shown in Figure 2 is adopted for numerical study. The beam structure with a span of L = 10 m is divided into 100 elements. Node number and element number of the beam, and the output location measured at the 3/4 span are also displayed in the figure.
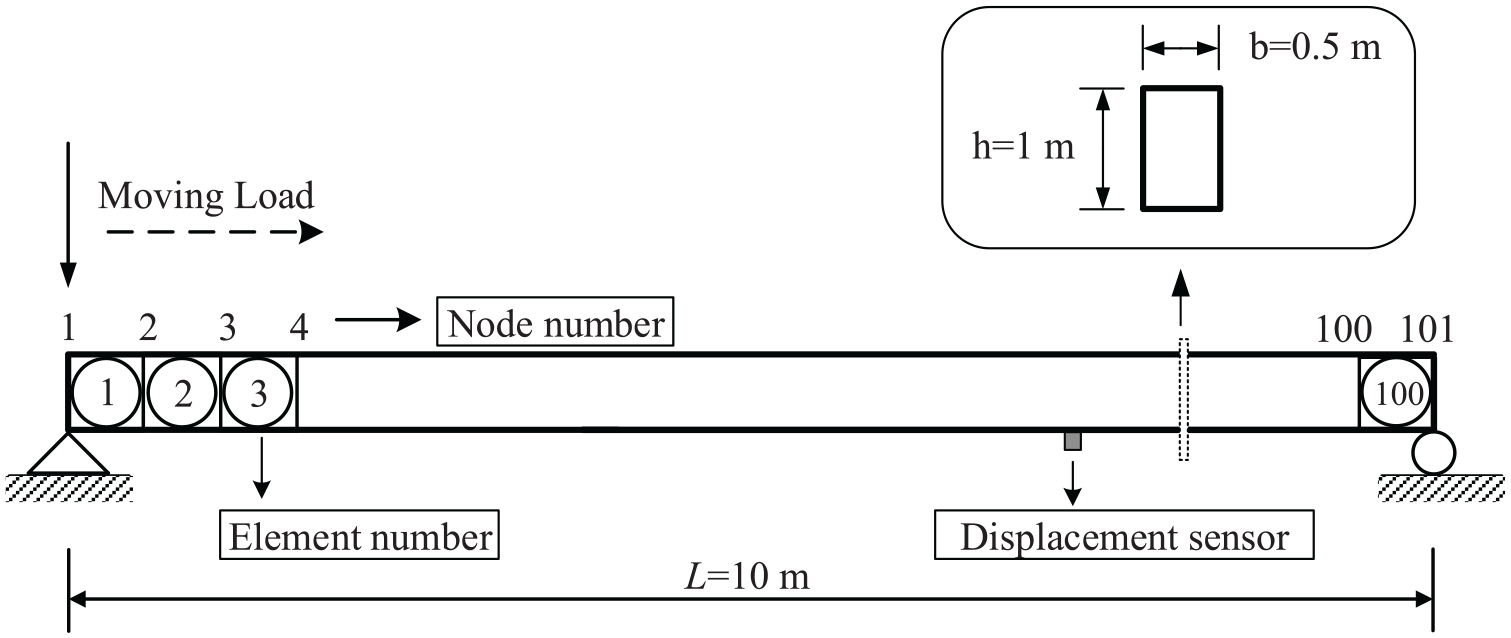
Schematic of simply supported beam.
To facilitate the comparison between the existing method and the newly-proposed method, the first two damage scenarios (Case S1 and Case S2) are chosen to be the same as those reported by Zeinali and Story (2018). About 50% reduction of flexural rigidity in a local damaged region is simulated in Cases S1 and S2, which is regarded as the medium damage level. To represent a minor damage level, 20% reduction of flexural rigidity in the damaged region is simulated in Case S3. The Case S4 is a multiple damage case, in which a minor level and a medium level of damage are simulated in two local regions. More detailed information on the four damage case scenarios can be found in Figure 3 and Table 1.
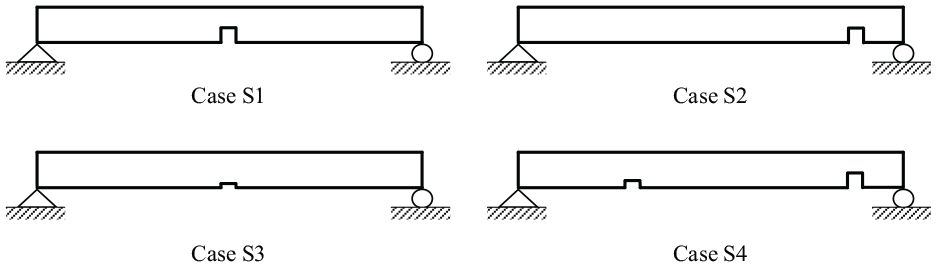
Damage case scenarios.
Damage cases considered in the simply supported beam.
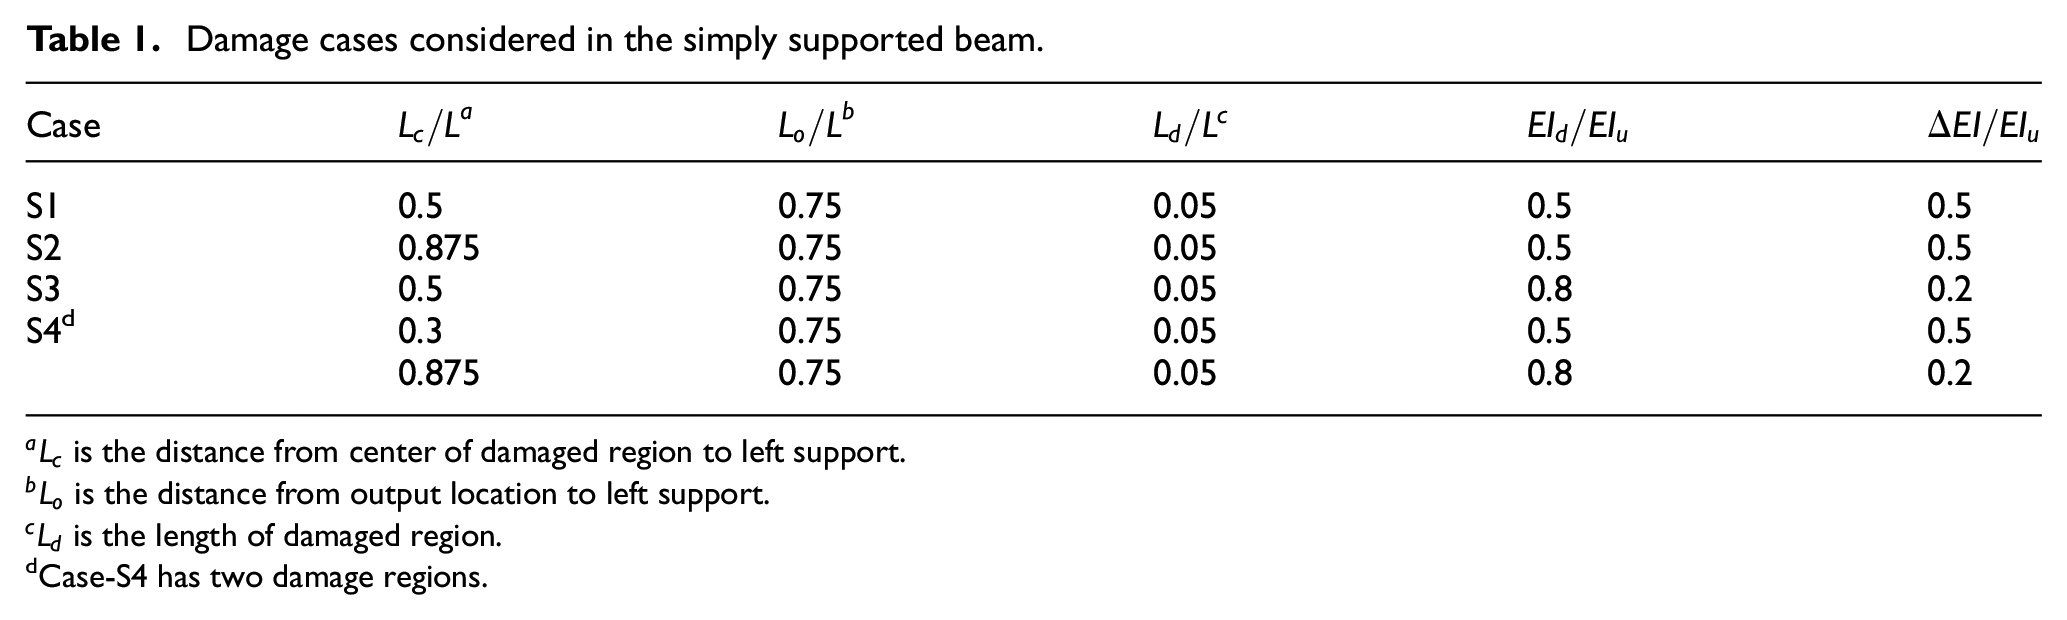
Case-S4 has two damage regions.
Accuracy test
To validate the accuracy of the proposed damage quantification method, a minor damage simulated in the damage case S3 is first taken as an example. The representative DILs measured at the 3/4 span of the beam before and after damage are shown in Figure 4. It can be found from Figure 3 that DIL curves before and after damage are very close to each other, and thus it is almost impossible to detect damage by direct observation of two curves.
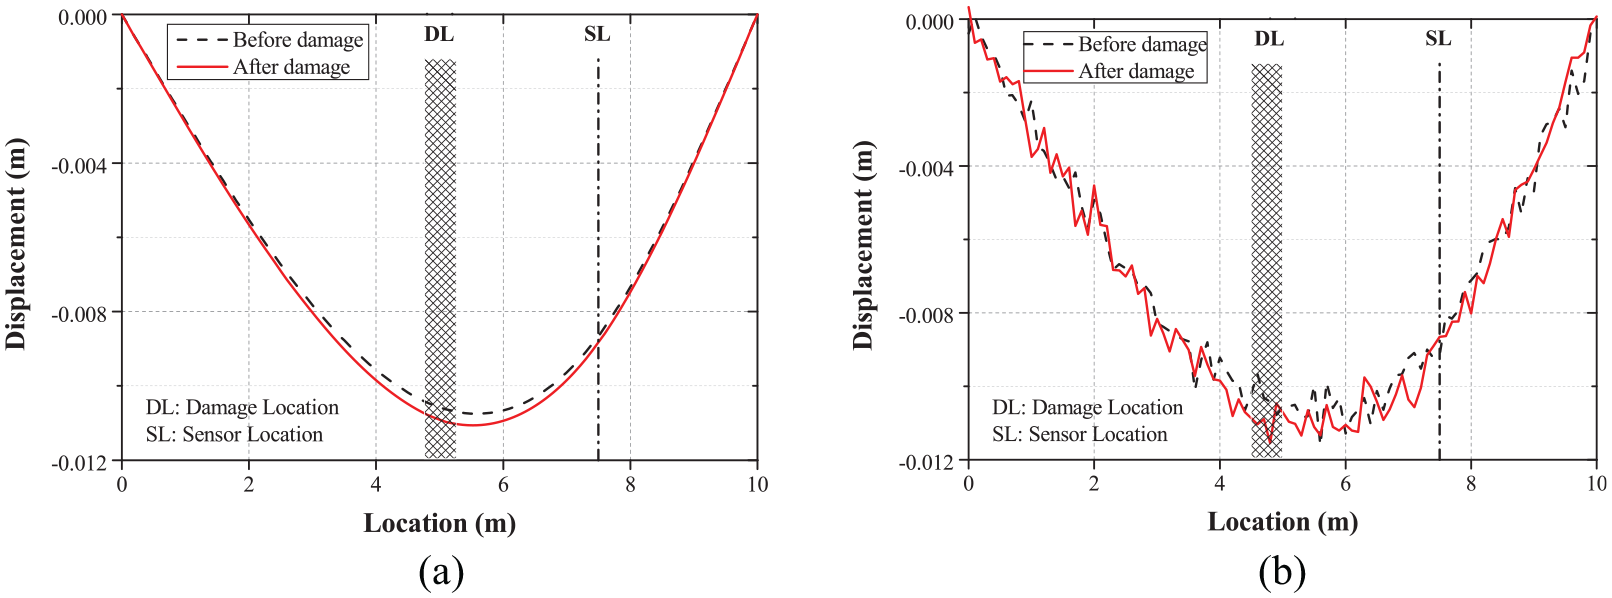
DILs before and after damage for damage case S3: (a) without noise and (b) with noise.
Using the DIL curves before and after damage, the actual DIL change in Case S3 can be calculated and shown in Figure 5. It can be observed that the location of peak value in the actual DIL change can well coincide with the damage location in the case without noise interference.
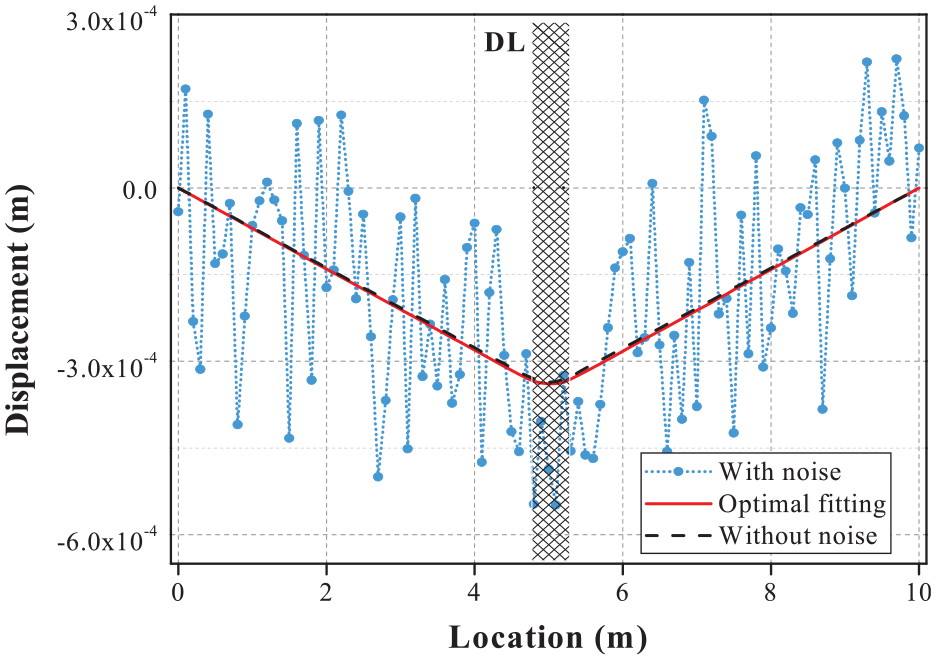
DIL change for damage case S3.
Subsequently, random noises are generated and added to the theoretical DIL change using the formula as follows:

where
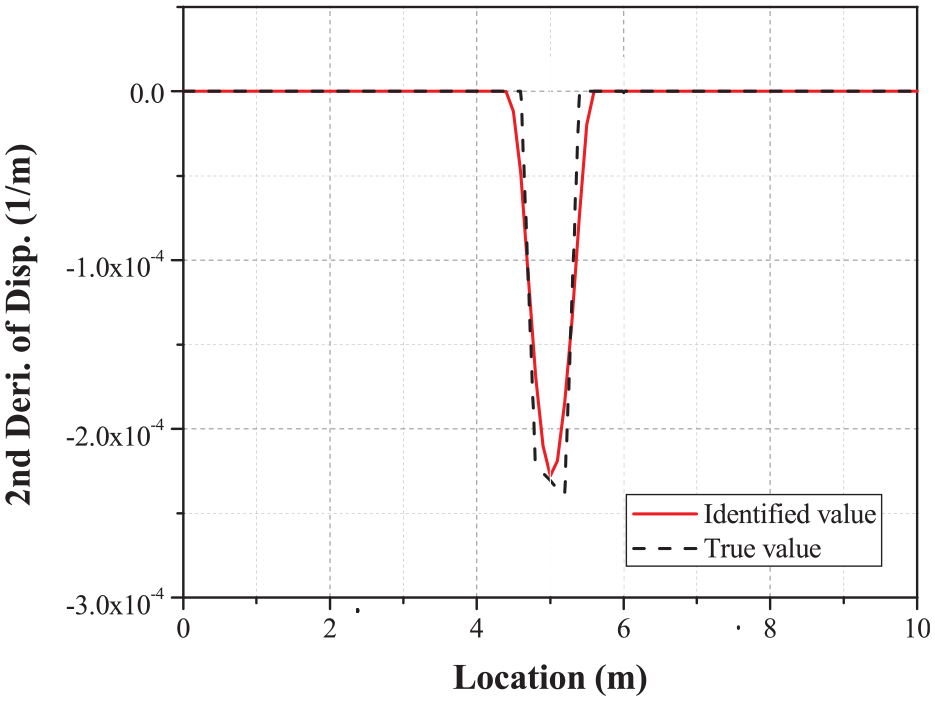
Second derivative of DIL change for damage case S3.
Based on the fitted curve of DIL change, the result of flexibility change is solved by equation (8) and shown in Figure 8. It can be found that a sudden change of flexibility occurs at the damage region around mid-span, and the estimated flexibility change is quite close to its actual value.
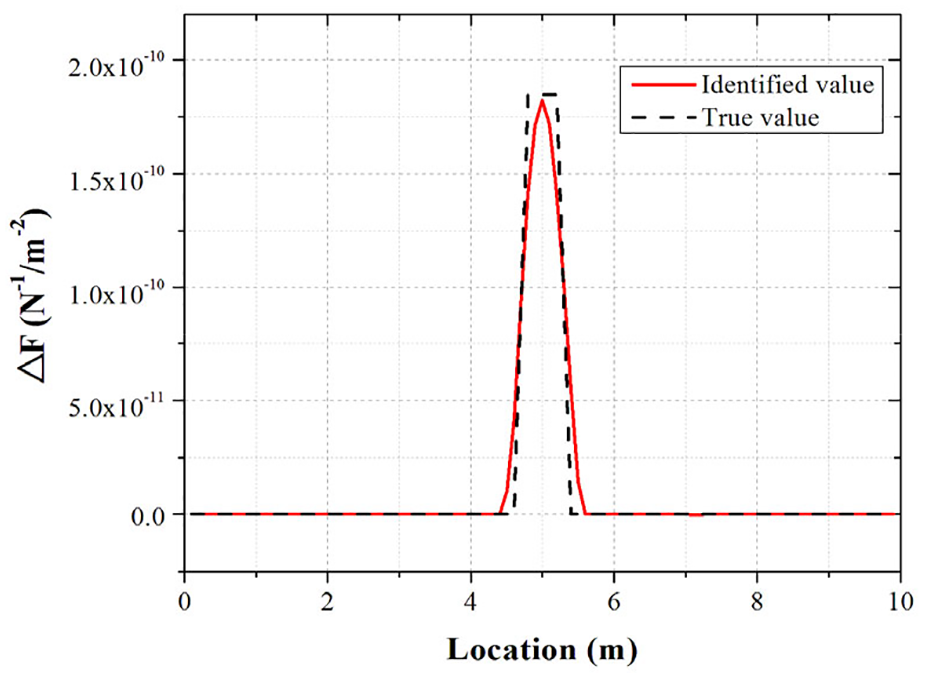
Change of flexibility in damage case S3.
To represent damage extent, the damage-induced rigidity change ratio is calculated by equation (12). The results shown in Figure 9 demonstrate that the estimated value in the damaged region equals to 0.19 that is very close to the actual value 0.2, and the estimated value in all of non-damaged regions are equal to 0.
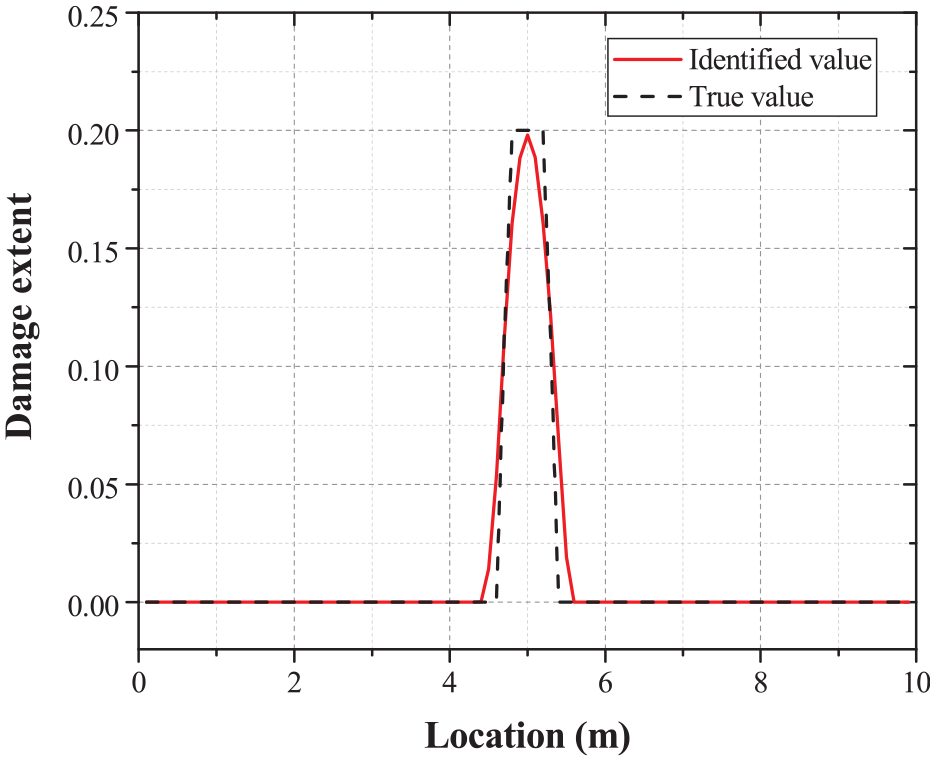
Changing ratio of rigidity for damage case S3.
Robustness test
In this section, four damage cases (Cases S1, S2, S3, and S4) and four noise levels (noise-free, 1%, 2%, and 5% noise levels) are used to investigate the robustness of the proposed method. To enable the direct comparison with the previous method, the first two damage scenarios (Damage Cases S1 and S2) are taken to be same with those defined in Zeinali and Story (2018). Furthermore, a more challenging testing is carried out to detect single minor damage (Damage Case S3) and double damage (Damage Case S4). For the damage case S1 after considering different noise levels, the changing ratio of flexural rigidity are respectively estimated and displayed in Figure 10. It can be found that, the identified damage extent is almost the same as the true value under the noise-free and 1% noise level, and the identified result is excellent even under the 2% and 5% noise levels. The damage extent results identified from damage case S4 with different noise levels considered are shown in Figure 11. For this complicated damage case, two damage locations can be exactly and clearly identified, but more identification errors are introduced along with increasing noise level. The maximum error is 11%, which is located around the minor damage region on the left.
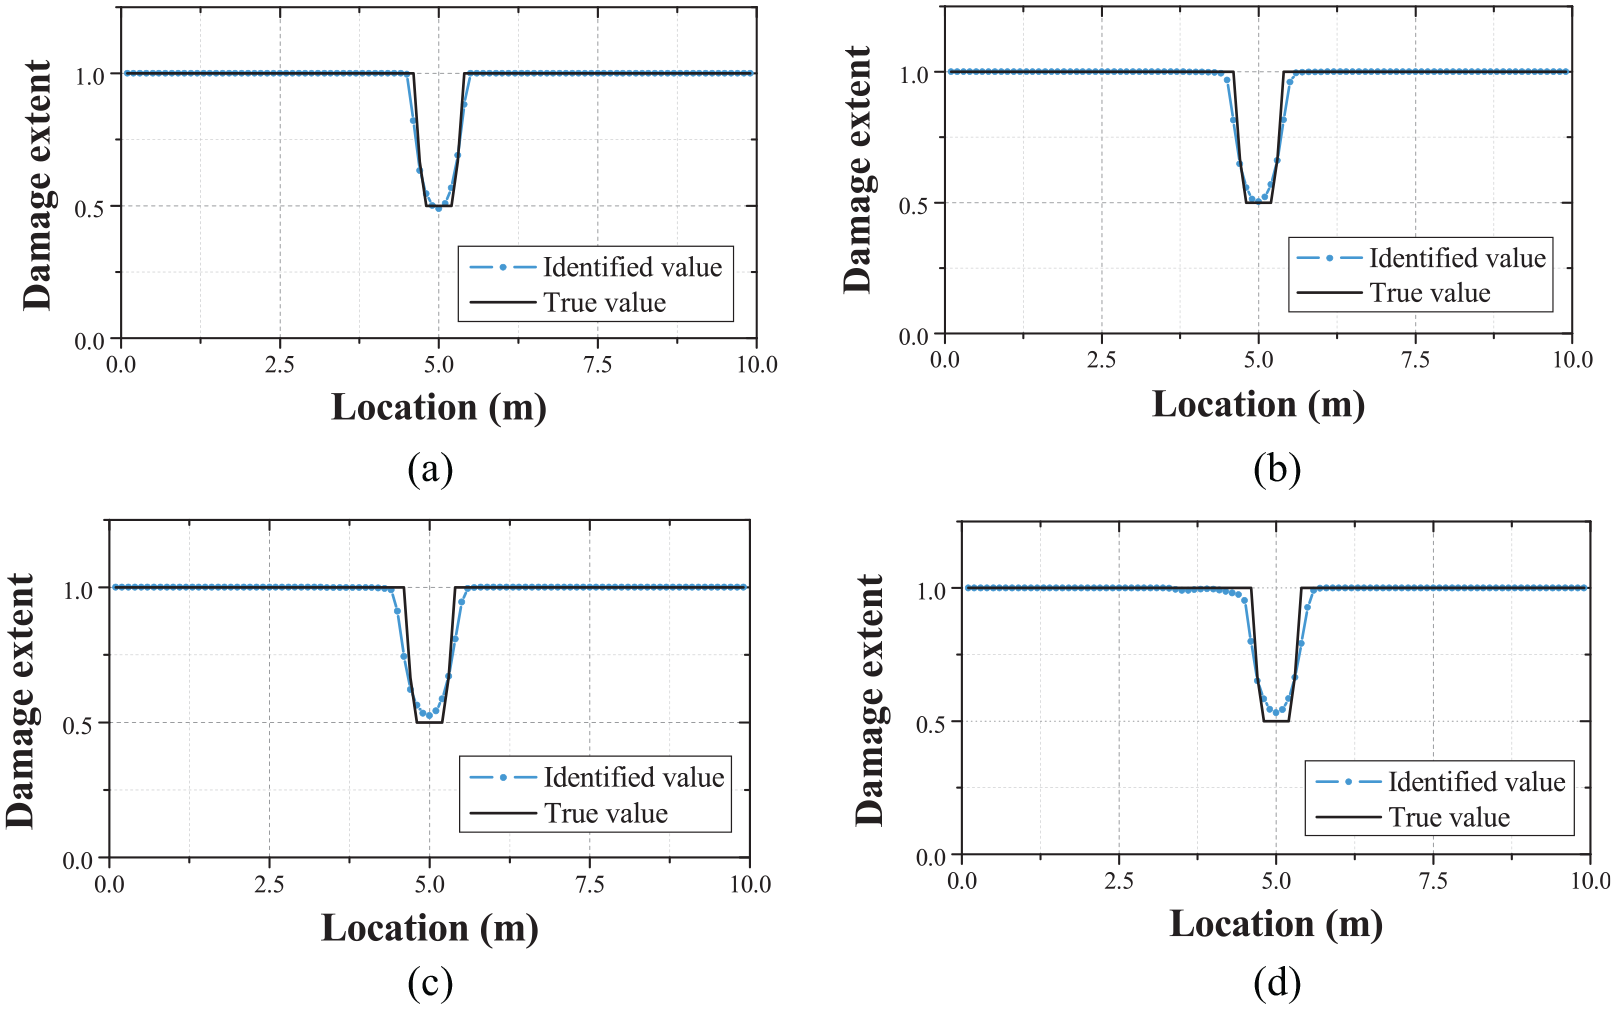
Changing ratio of rigidity estimated with and without noise for damage case S1: (a) noise-free, (b) 1% noise level,(c) 2% noise level and (d) 5% noise level.
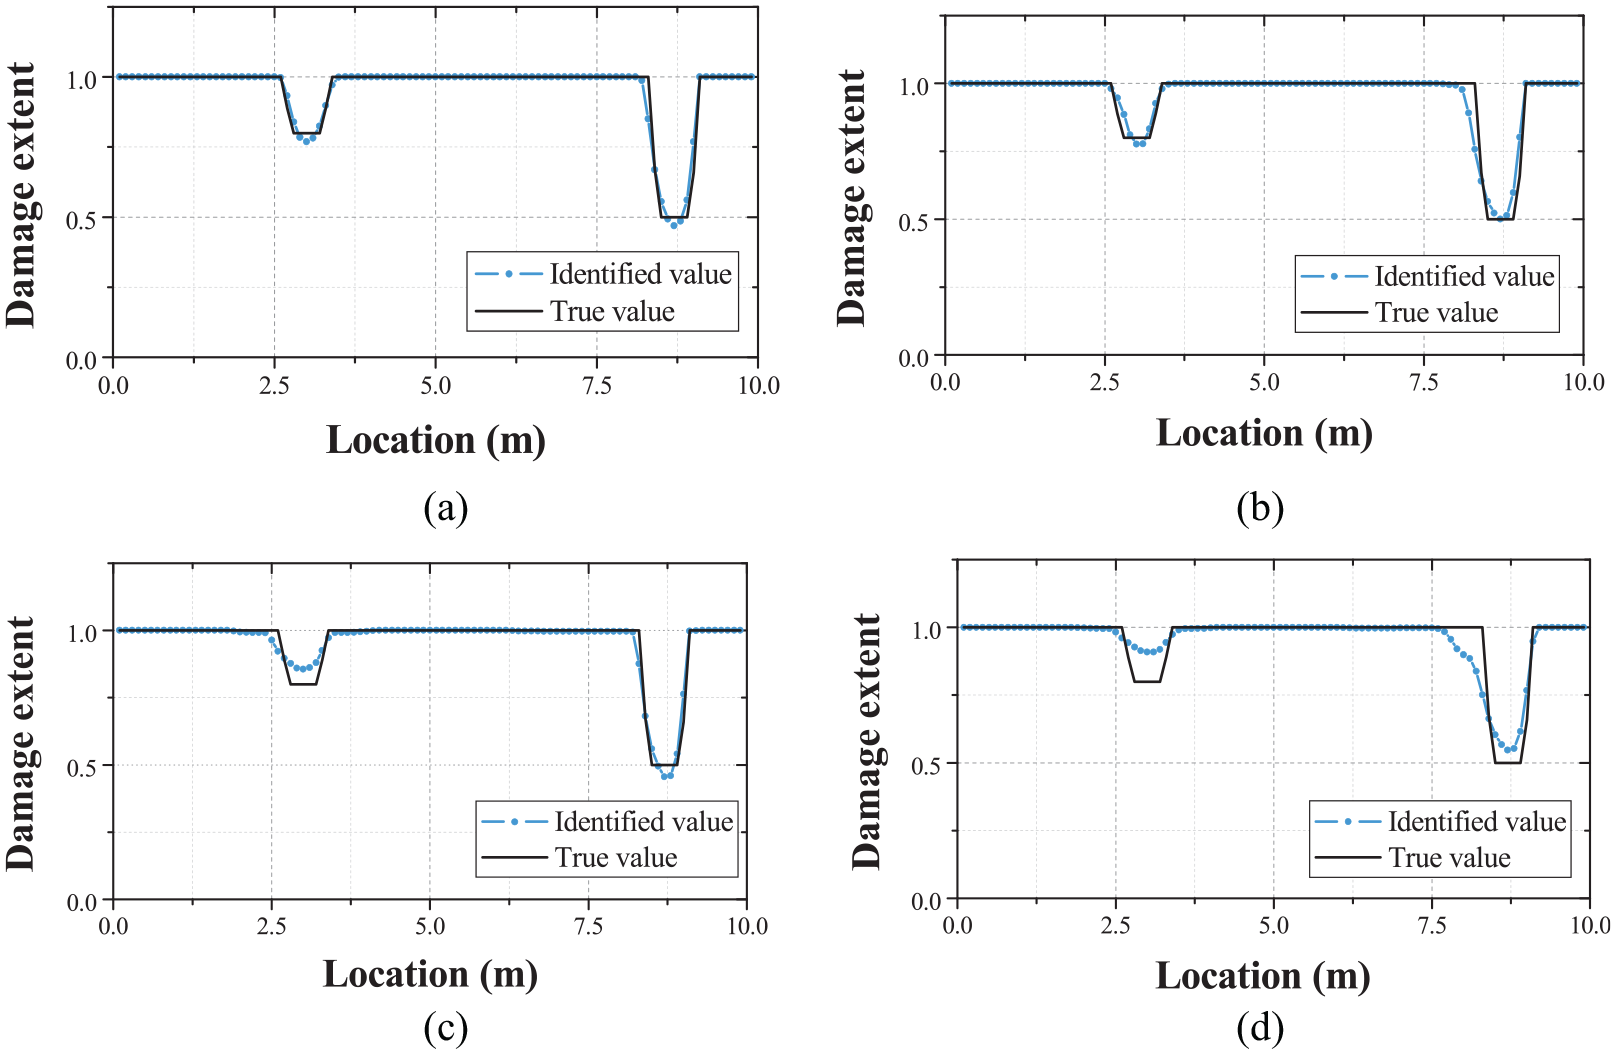
Changing ratio of rigidity estimated with and without noise for damage case S4: (a) noise-free, (b) 1% noise level,(c) 2% noise level and (d) 5% noise level.
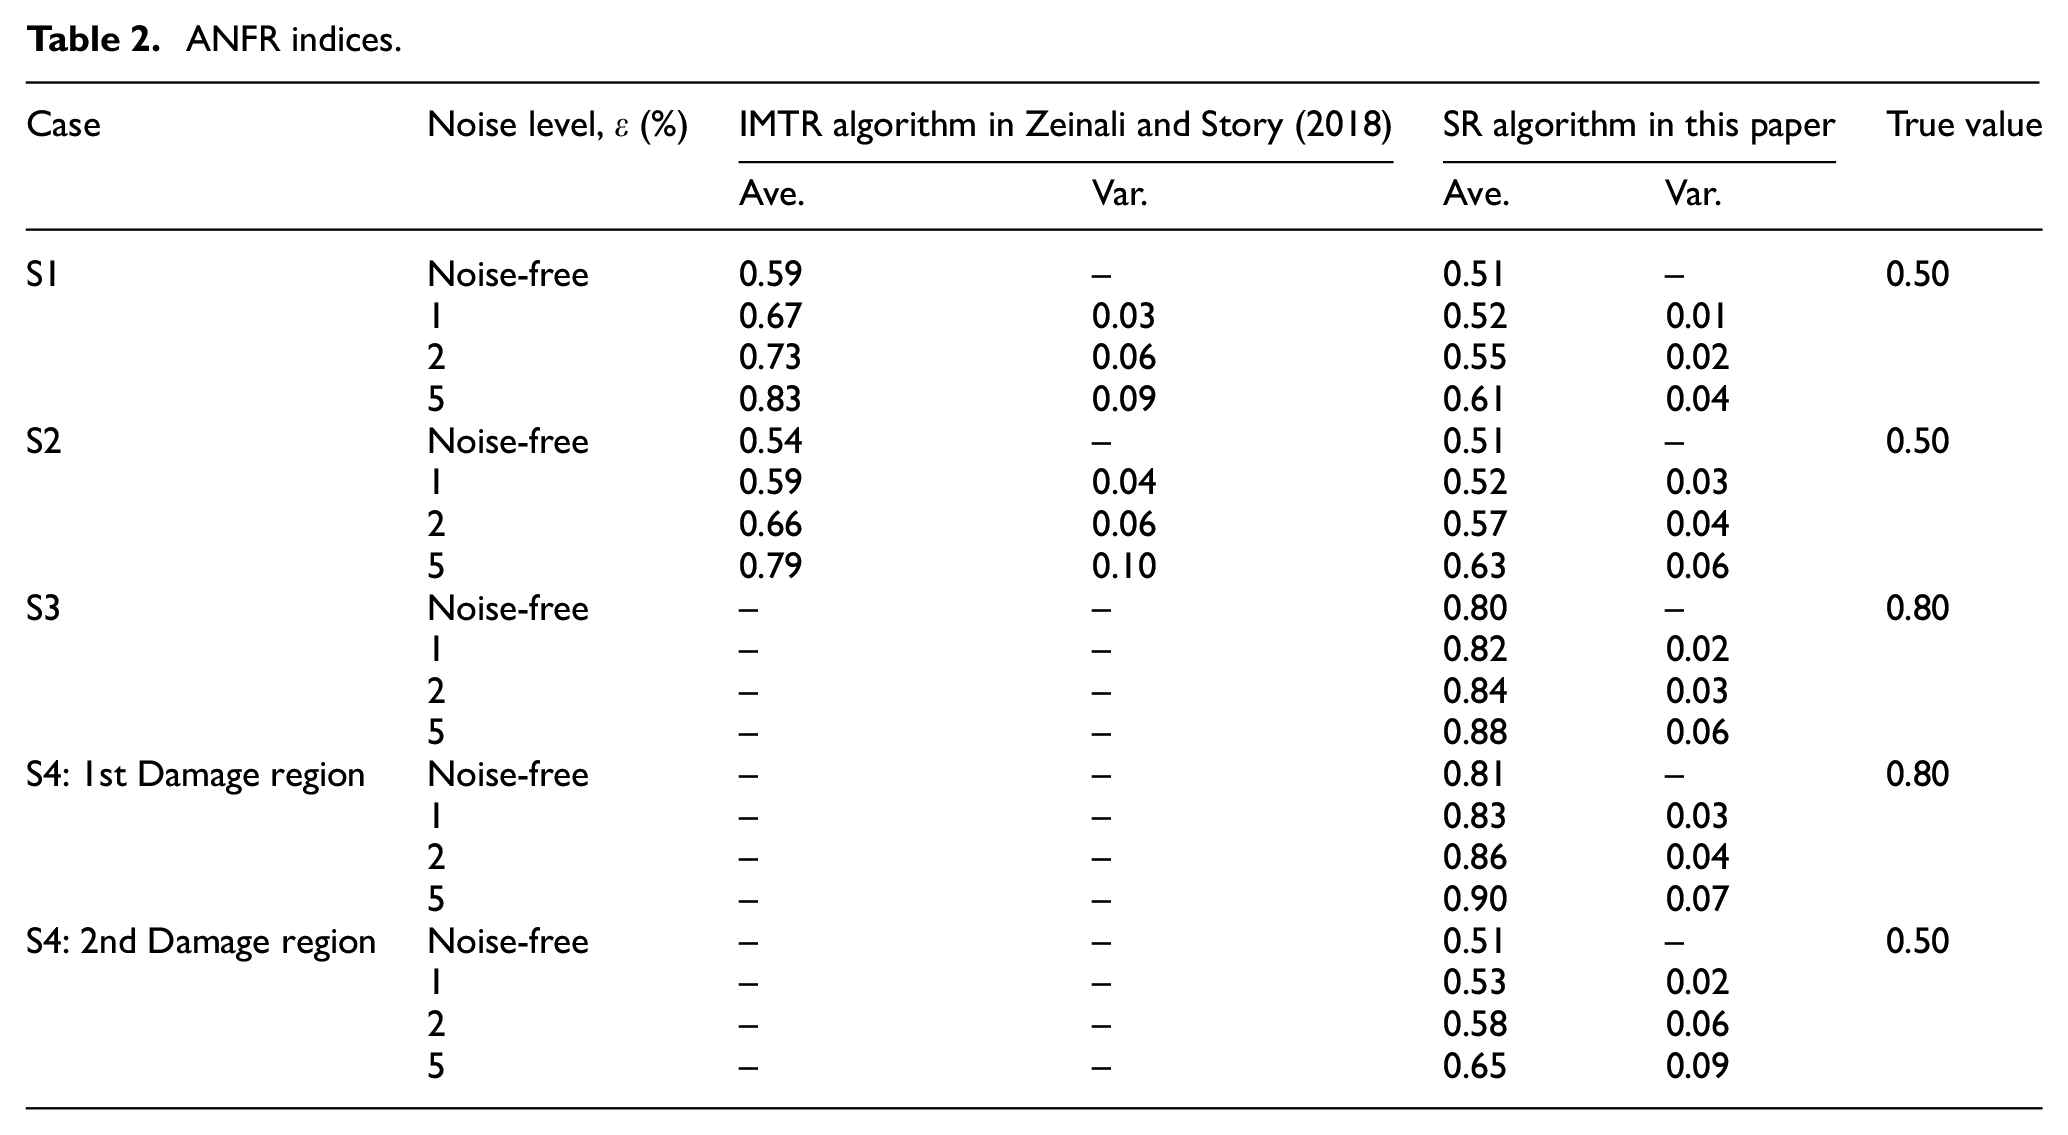
An index called the Average of Normalized Flexural Rigidity (ANFR) is defined to present the average of the multiple identified values of
ANFR indices.
Laboratory experiment
Experiment introduction
The results of a laboratory experiment on a simply supported aluminum beam reported by Chen et al. (2018) was employed to verify the feasibility and accuracy of the proposed damage quantification method. The experimental beam had a length of 3.16 m, and the box section had a width of 0.15 m and a height of 0.025 m. Three laser displacement sensors were installed under the beam at the locations of 1/4 span, 1/2 span and 3/4 span. The displacement responses were collected at a sampling rate of 50 Hz by using the KYOWA data acquisition system. In order to determine the location and extent of damage more accurately, the beam is separated into 32 segments. The length of the first and last segment was 8 cm, and the other segments were 10 cm long. The moving mass is placed on each node of segment, and the DILs of 1/4 span, 1/2 span and 3/4 span are recorded. The bending moment
A single-damage case and a double-damage case were introduced in this experiment. In the single damage case, a single damage (Damage One) with a rigidity reduction of 55% by making a hole as shown in Figure 12 was introduced in the 23rd segment (2.205–2.255 m from the left end). In the double-damage case, the second damage (Damage Two) with a rigidity reduction of 30% was introduced in the 10th segment (0.93–0.98 m from the left end) as shown in Figure 13 in a similar manner.
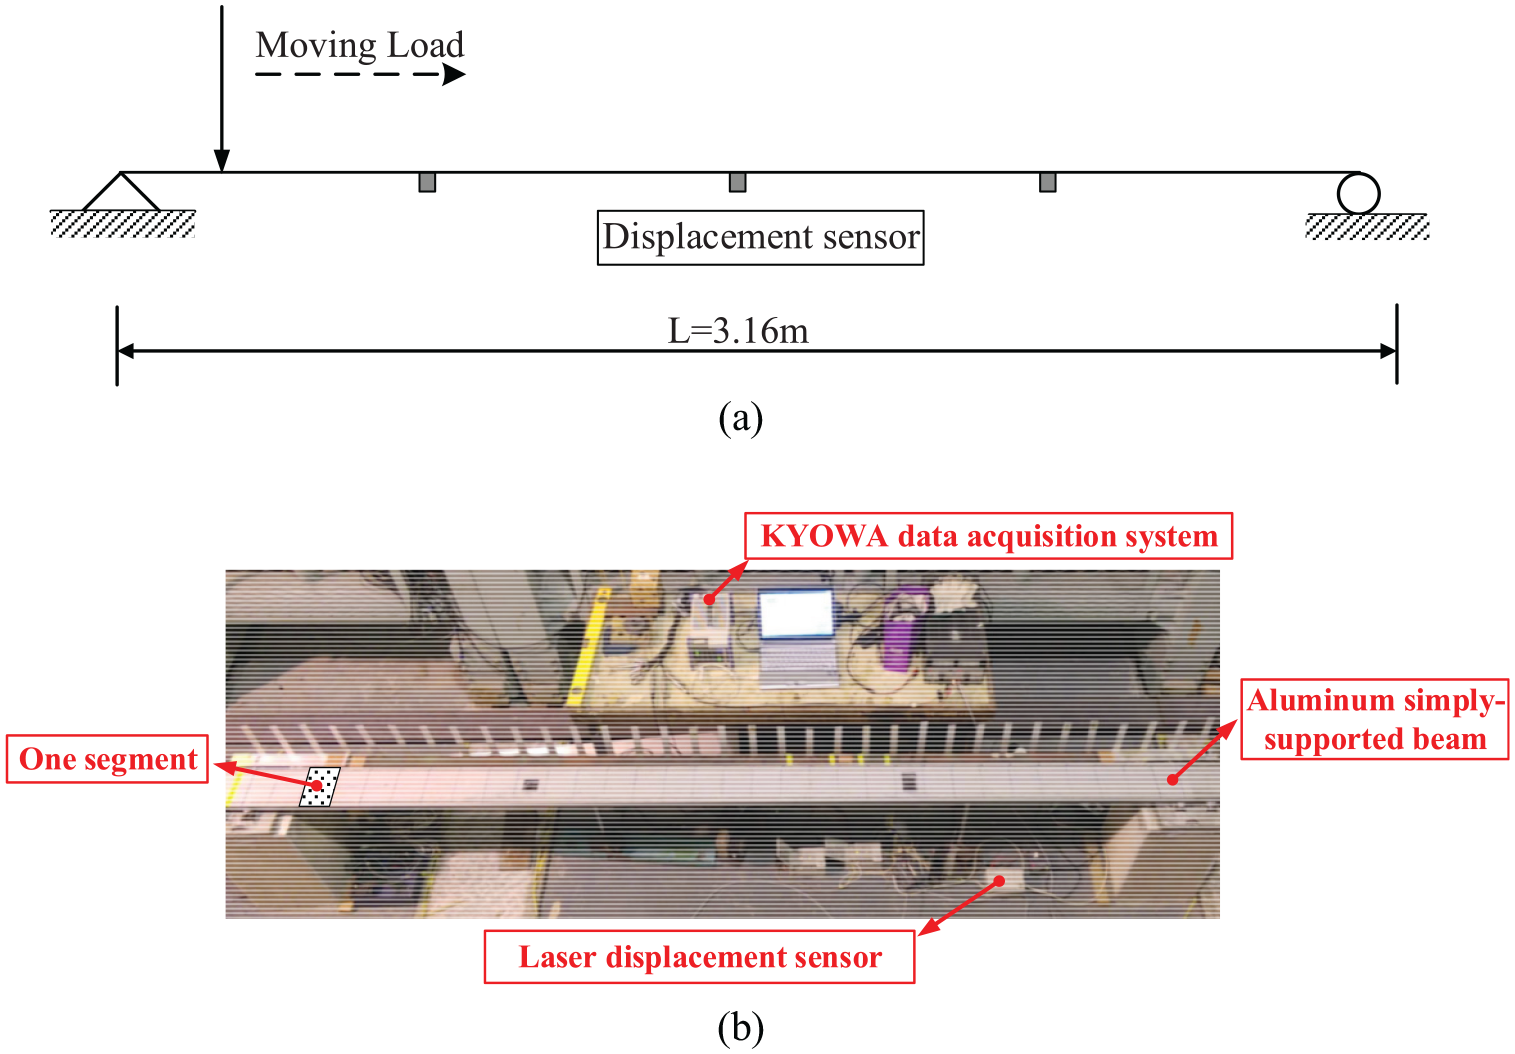
Experimental beam: (a) schematic drawing and (b) laboratory photo.
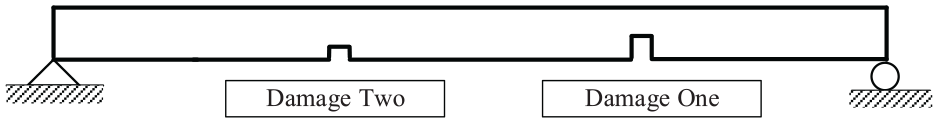
Sketch map of experimental beam in damage state.
Damage detection
With the moving mass travelling on the intact beam, the corresponding DILs are obtained from the aforementioned sensor locations (1/4 span, 1/2 span and 3/4 span). The moving mass is approximately 2.47 kg. Similarly, the procedure is also applied to the damaged beam in the single-damage case. Three pairs of DIL respectively measured at the initial status and the damaged status are shown in Figure 14. Due to the small damage, the DIL curves before and after damage are close, especially when sensor location is far from damage location.
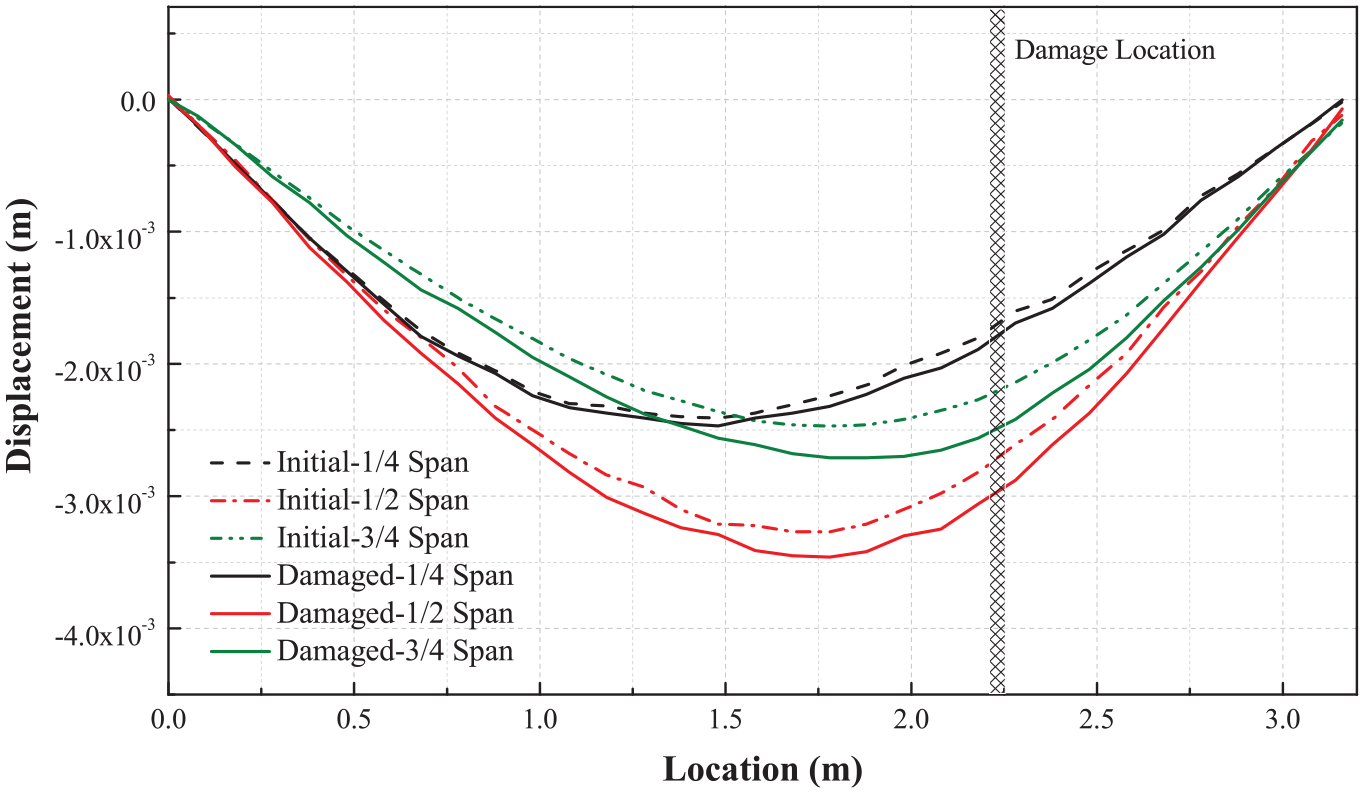
DILs measured before and after single damage.
In the single-damage experimental case, the DIL changes are shown in Figure 15. It can be found that the change of DILs can indicate the damage location directly, although the noise effect is noticeable. The largest DIL change was measured by the displacement sensor installed at the location of 3/4 span, that is closest to the damage location. The DIL change was approximately 13% of the peak amplitude of the DIL. The smallest DIL change was measured at the location of 1/4 span.
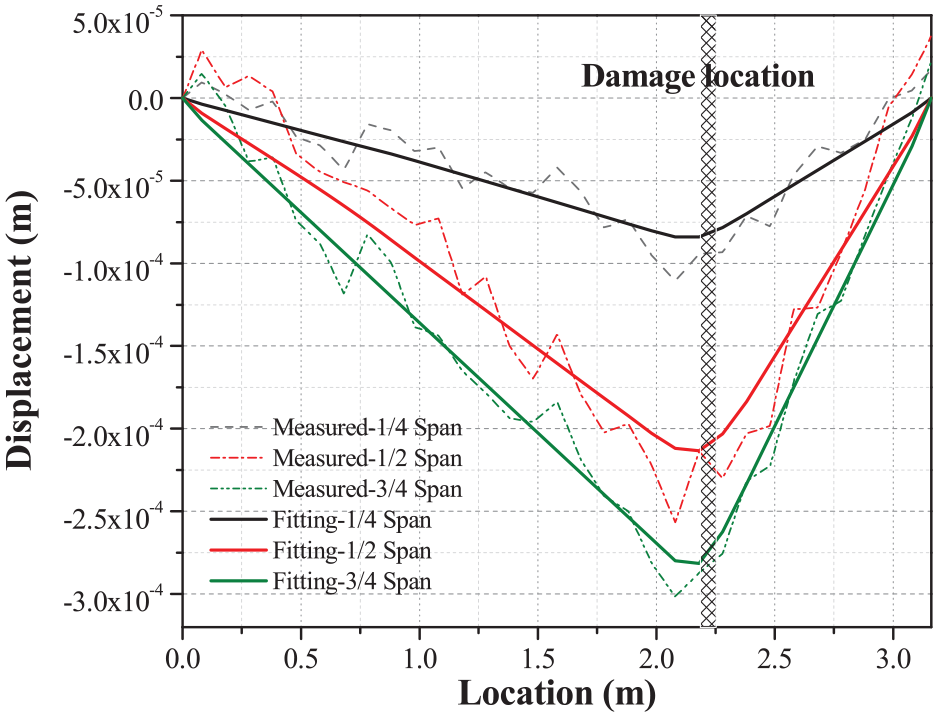
DIL changes in experimental beam for single-damage case.
Based on the measured DIL changes, the damage detection procedure proposed in this paper is used to identify the DAMAGE indices. The identification results obtained respectively based on the DIL changes measured at the locations of 1/4 span, 1/2 span and 3/4 span are shown in Figure 16. The actual location and exact extent of the man-made damage is also plotted as “true value” in the figure for better comparisons with identified values. It can be found from Figure 16 that the damage location can be exactly determined by the peaks of damage indices from any of three locations. Although the damage indices of elements in the neighborhood of the damage element also have certain values, which are much smaller than the peak and rapidly decreases with the element away from the damage location, thus it will not affect accurate judgment of damage location. Along with the measurement location which is far away from the damage location, the signal-to-noise ratio decreases, and a false alarm occasionally appears in the undamaged region, such as the sensor location at the 1/4 span. However, the small value only appears in the result of 1/4 span, it is not enough to cause misjudgment on damage location. The maximum errors identified from the damage locations of 3/4 span, 1/2 span and 1/4 span are respectively around 6.1%, 8.3%, and 11.2%. The experimental results indicate that the damage location and severity could be identified satisfactorily, and a better identification result could be obtained if the sensor is placed close to the damage location.
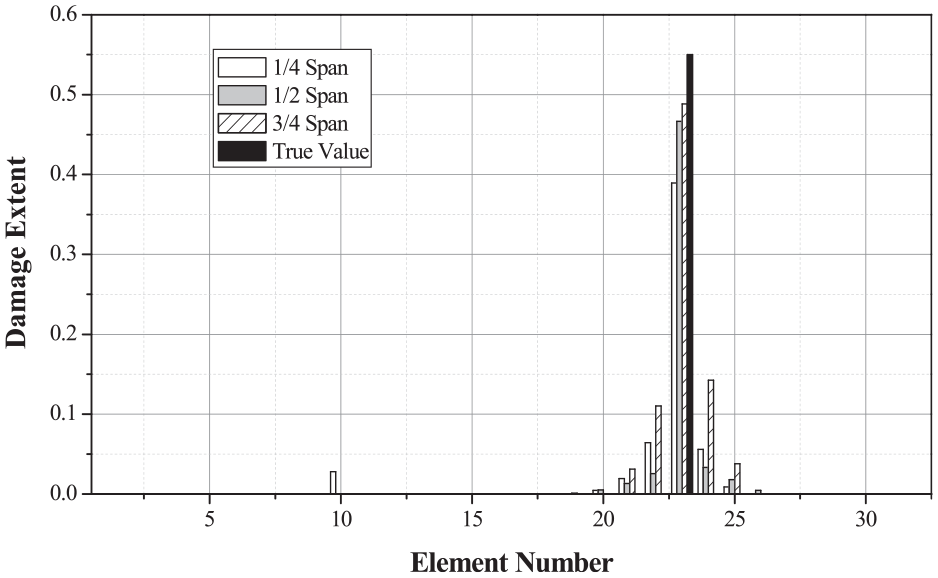
Damage quantification of experimental beam for single damage case.
Furthermore, Figure 17 shows the damage identification results when the second damage was introduced near the 1/4 span. Again, the proposed method successfully detects the Elements 10 and 23 as possible damage locations. The identified damage severities are also close to true values. Therefore, the experimental results in both cases successfully validate the effectiveness and accuracy of using the proposed method for the damage localization and quantification in beam structures.
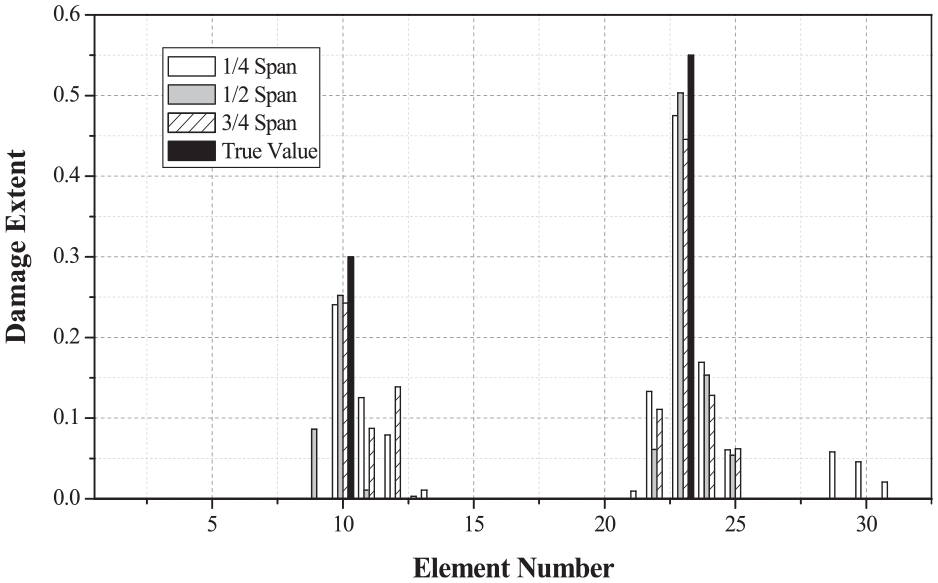
Damage quantification of experimental beam for double damage case.
Conclusions
This paper proposes a novel method for damage localization and quantification of beam structures by estimating section flexibility change from DIL change. The relationship between the second derivative of DIL change and flexibility change is established for beam structures. Piecewise quadratic functions for fitting DIL change curve is used to replace noisy DIL and mitigate serious noise interference. A sparse regularization method is introduced to accurately identify sparse coefficient solution. Numerical and experimental results of the simply supported beam with single and double damages demonstrate that the proposed approach can accurately localize and quantify minor damage and has a strong anti-noise robustness. It is promising to further develop and apply the proposed approach to real bridge damage detection in future. It is noteworthy that only beam structures are studied in this paper, and further studies are required to extending the method to more complicated bridge types.
Footnotes
Declaration of conflicting interests
The author(s) declared no potential conflicts of interest with respect to the research, authorship, and/or publication of this article.
Funding
The author(s) disclosed receipt of the following financial support for the research, authorship, and/or publication of this article: the National Natural Science Foundation of China (NSFC-51778550), the Principal Fund of Xiamen University (No. 20720180060), the Research Funding from Science and Technology Administrative Bureau of Xiamen City of China (No. 3502Z20193002).