
Abstract
The most commonly cited obstacles to the uptake of alternative masonry units on a meaningful scale, despite significant research investment, are a lack of standards and understanding of their structural behaviour. This paper contributes to the body of knowledge on finite element analysis of alternative masonry structures, towards improved understanding of their structural behaviour. Two critical masonry wall configurations, in the context of South African low-income, government-subsidised housing, are analysed using the simplified micro-modelling approach, under ultimate limit state wind and seismic actions. Three alternative masonry materials are characterised and employed in the numerical analyses, geopolymer, compressed-stabilised earth and adobe blocks, as well as conventional concrete blocks as benchmark. Despite the wide spectrum in masonry materials analysed, the chosen modelling approach captured the major failure mechanisms well. The four materials performed as expected relative to one another, but most wall/material configurations failed to resist the required design load, including the conventional concrete masonry material.
Keywords
Introduction
Building with masonry units is the oldest construction form still in popular use today, especially in low-income housing (LIH). However, the use of concrete and burnt clay in these large volumes has a significant negative impact on the environment in the form of carbon dioxide emissions (Benhelal et al., 2013; Olivier et al., 2012; Reddy and Jagadish, 2003), and the use of non-renewable natural resources (NPC, 2011). In addition, the thermal performance of conventional masonry walls is often poor, contributing to occupant discomfort. These factors, and others, have led to the development of alternative masonry units (AMU’s) in South Africa, and internationally, with a lesser environmental impact and improved thermal performance. For the purpose of this study, AMU’s are defined as any masonry unit other than what is currently used conventionally in South Africa, in a standardised or regulated manner. Conventionally used masonry units are predominantly concrete and burnt clay masonry units, as well as autoclaved aerated concrete and calcium silicate masonry units to a lesser degree. Specifically AMU’s are considered the most realistic and viable option, given the deep entrenchment of block-and-mortar housing in South African society. However, common obstacles to the uptake of AMU’s are a lack of standards and understanding of their structural behaviour.
The general assumption regarding the structural behaviour of alternative masonry is that it is comparable to conventional masonry behaviour (Tennant et al., 2013). Especially soil-based blocks with a high cement or binder content are assumed to behave similarly to commercial concrete blocks and can be structurally designed as such (Heath et al., 2012). However, understanding and knowledge of the structural behaviour of alternative masonry is sparse, especially regarding the out-of-plane response (Tennant et al., 2013).
Over time, certain structural behavioural aspects have solidified themselves as fact. For example, the seismic response of soil-based masonry structures is considered particularly poor due to the low tensile strengths of the material (Silva et al., 2012), but these observations do not constitute a thorough understanding of the structural behaviour of alternative masonry. Symptomatic of this lack of understanding is the exclusion of AMU’s from the scope definition of internationally accepted masonry design standards (Illampas et al., 2011), such as EN 1996 (2005). In-depth investigation into the structural behaviour of AMU’s is necessary for their advancement. This paper focusses on the finite element (FE) analysis of alternative masonry walls in the context of LIH in South Africa, to gain better insight into the structural behaviour and feasibility of using AMU’s on a meaningful scale.
South African government subsidised housing units are typically a stand-alone dwelling of 40 m2 (Laubscher, 2014), containing a kitchen, living area, two bedrooms and a bathroom (see Figure 1), conforming to the definition of ‘adequate housing’ in the National Housing Code (NHC, 2009). The structural design of housing in South Africa is regulated by the National Building Regulations (NBR), first published in 1985 by the South African Bureau of Standards (SABS), but since updated a number of times to the current edition SANS 10400 (2010). The NBR are based on the National Building Regulations and Standards Act of 1977 (Act No. 103, 1977), and are performance-based in nature. However, the NBR contain extensive deemed-to-satisfy solutions, the typical mixed approach taken in transitioning from prescriptive to performance-based regulation.
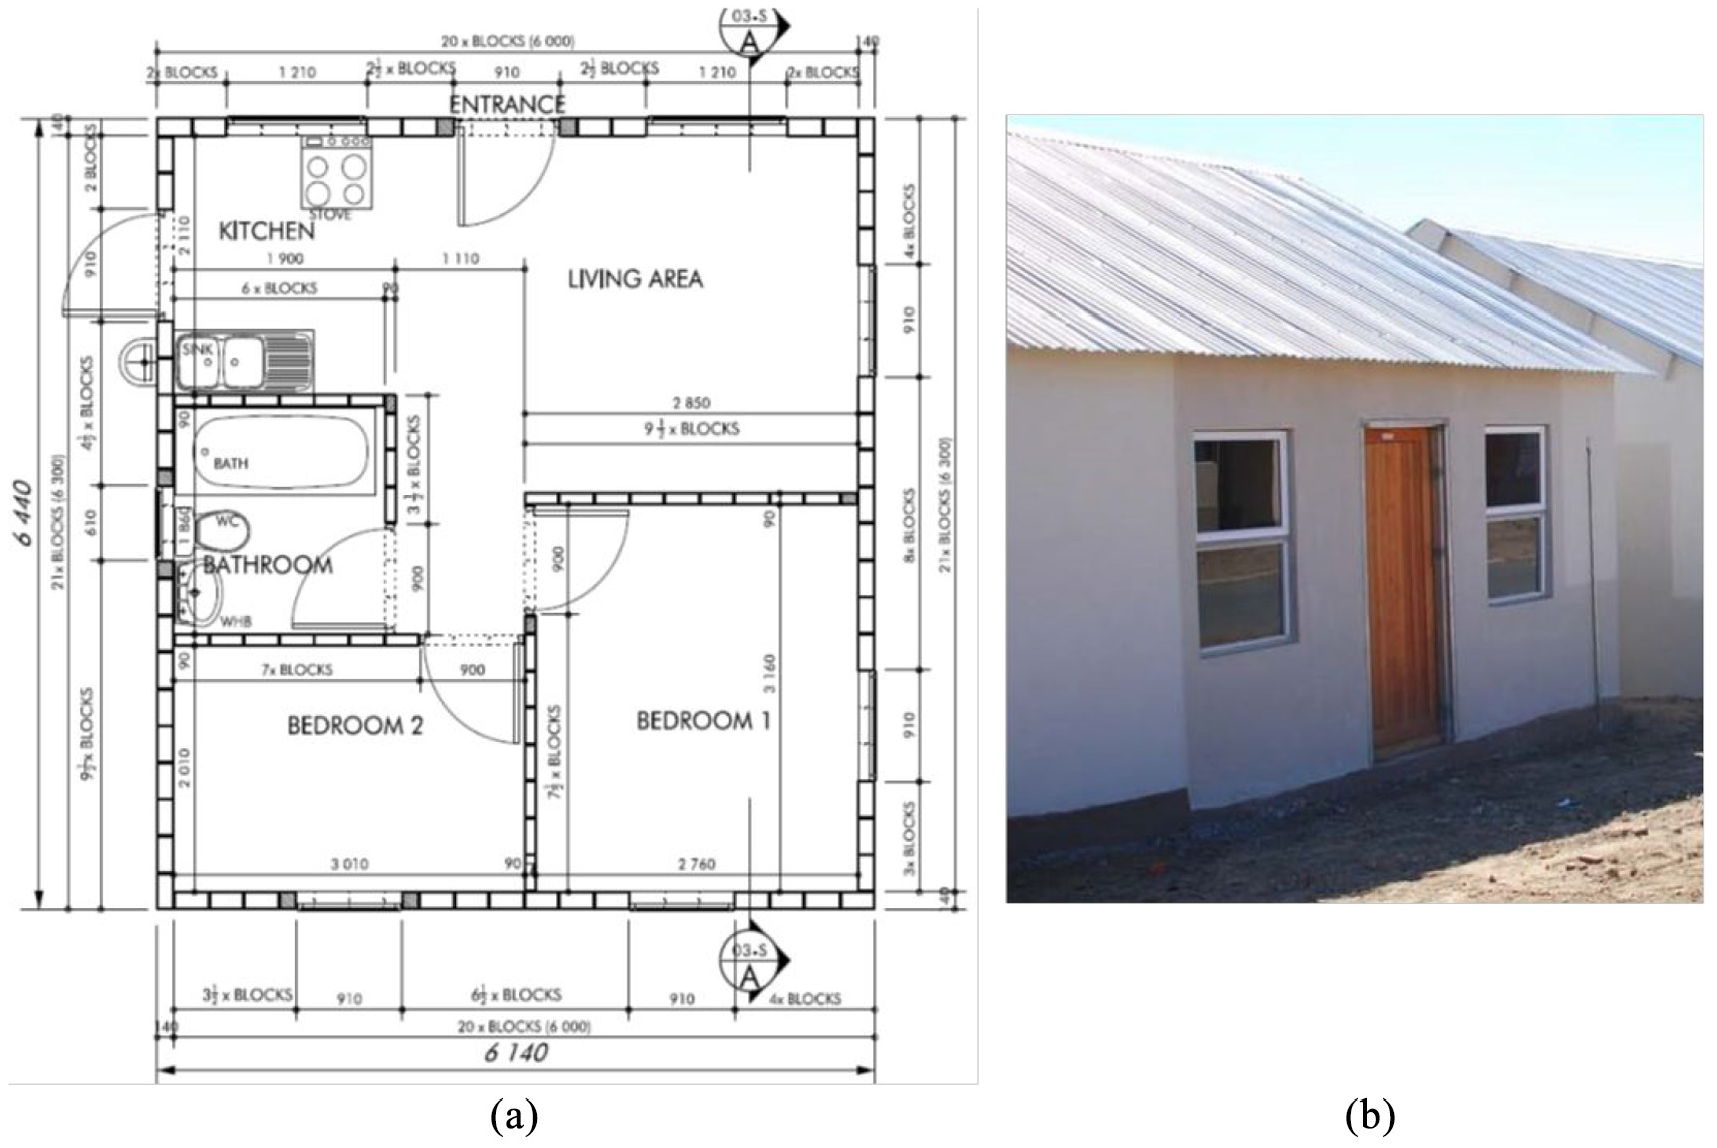
Typical 40 m2 government subsidised concrete masonry house: (a) plan (CMA, 2011) and (b) under construction.
The FE analyses of this study are performed on single-storey unreinforced, single-leaf, external masonry walls, typical of LIH construction, which conform to the deemed-to-satisfy solutions of the NBR. Three alternative masonry units (AMU’s) are included in this study, namely geopolymer (GEO), compressed-stabilised earth (CSE) and adobe (ADB) blocks (see Figure 2). The main selection criteria for the AMU materials for this study were diversity in mechanical properties, representing a wide spectrum of strength and stiffness. Conventional concrete masonry units (CON) are also included to serve as a benchmark since these are the most commonly used masonry units in LIH construction in South Africa. All blocks are solid and have a length of 290 mm, a width of 140 mm and a height of 116 mm.
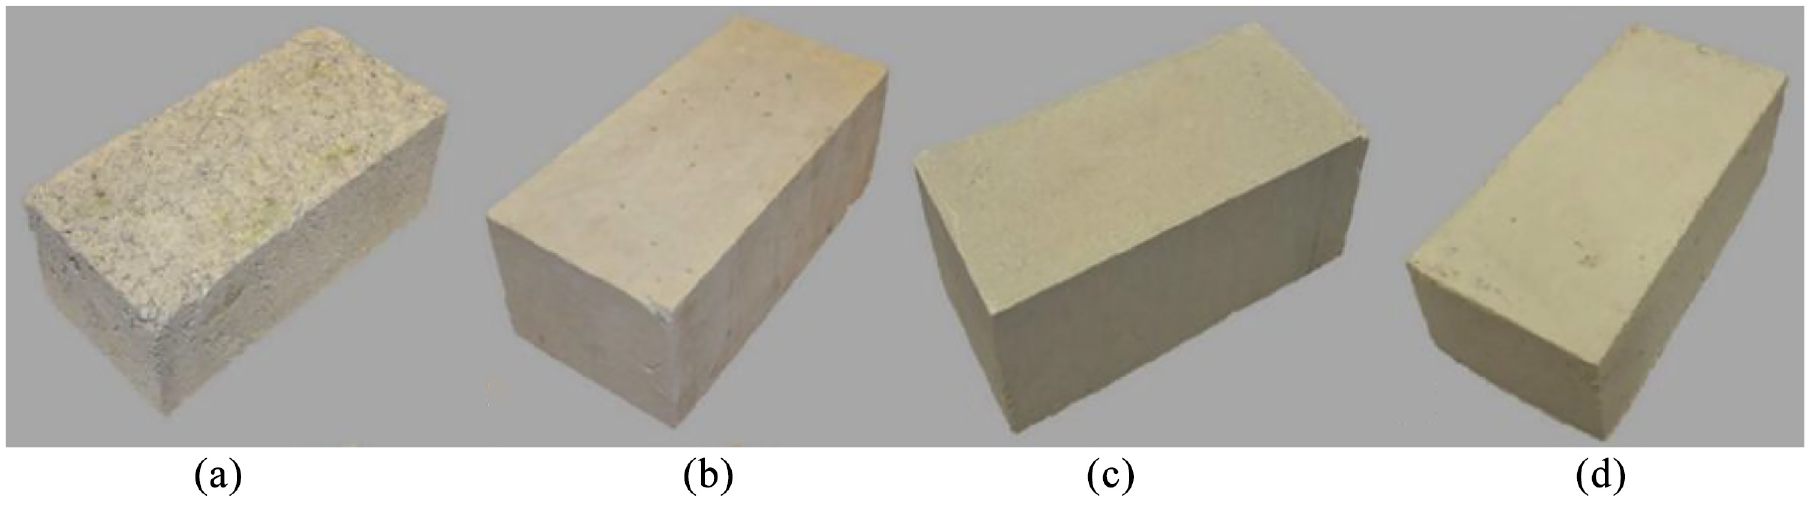
Four masonry unit types used in study: (a) CON, (b) GEO, (c) CSE, and (d) ADB (Fourie, 2017).
A total of 16 analyses are performed for the four materials (CON, GEO, CSE, ADB), two critical wall layouts (W1 and W2), and two load cases: the ultimate limit state for wind (ULS-W) and for seismic (ULS-S) actions. The results of the analyses provide insight into the in-plane and out-of-plane structural behaviour of AMU walls especially relative to the conventional concrete masonry walls of LIH housing and relative to the expected loading.
Finite element model
Modelling approach
In order to capture the different possible failure mechanisms of masonry, the popular (Chisari et al., 2018; Giambanco et al., 2001; Lourenço, 1996; Lourenço and Rots, 1997; Macorini and Izzuddin, 2011; Van Zijl, 2000) simplified micro-modelling (SMM) approach is selected in 3D. Linear solid block elements are used for the masonry units, whilst concentrating the nonlinear behaviour in zero-thickness interface elements for the joints and potential cracks in the mid-plane of the units, as described in Figure 3. The unit elements are expanded to account for the zero-thickness of the interface elements and maintain the overall geometry of the structure. This approach is appropriate for the scale of walls to be modelled and reasonable in terms of computing requirements.
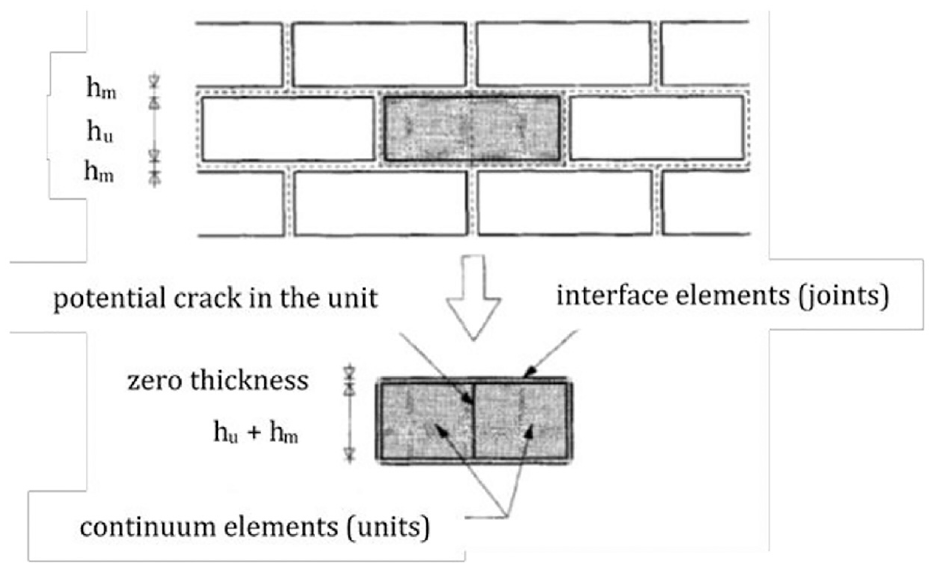
Simplified micro-modelling strategy with 3D solid brick element and 2D interface elements (Lourenço and Rots, 1997).
Constituent material model
The plasticity-based Combined Cracking-Shearing-Crushing (CCSC) model, implemented in DIANA (2017), is chosen as the constitutive material model. A tension cut-off, Coulomb friction criterion and an elliptical cap in compression define the multi-surface yield function, described in Figure 4 for 2D and 3D.
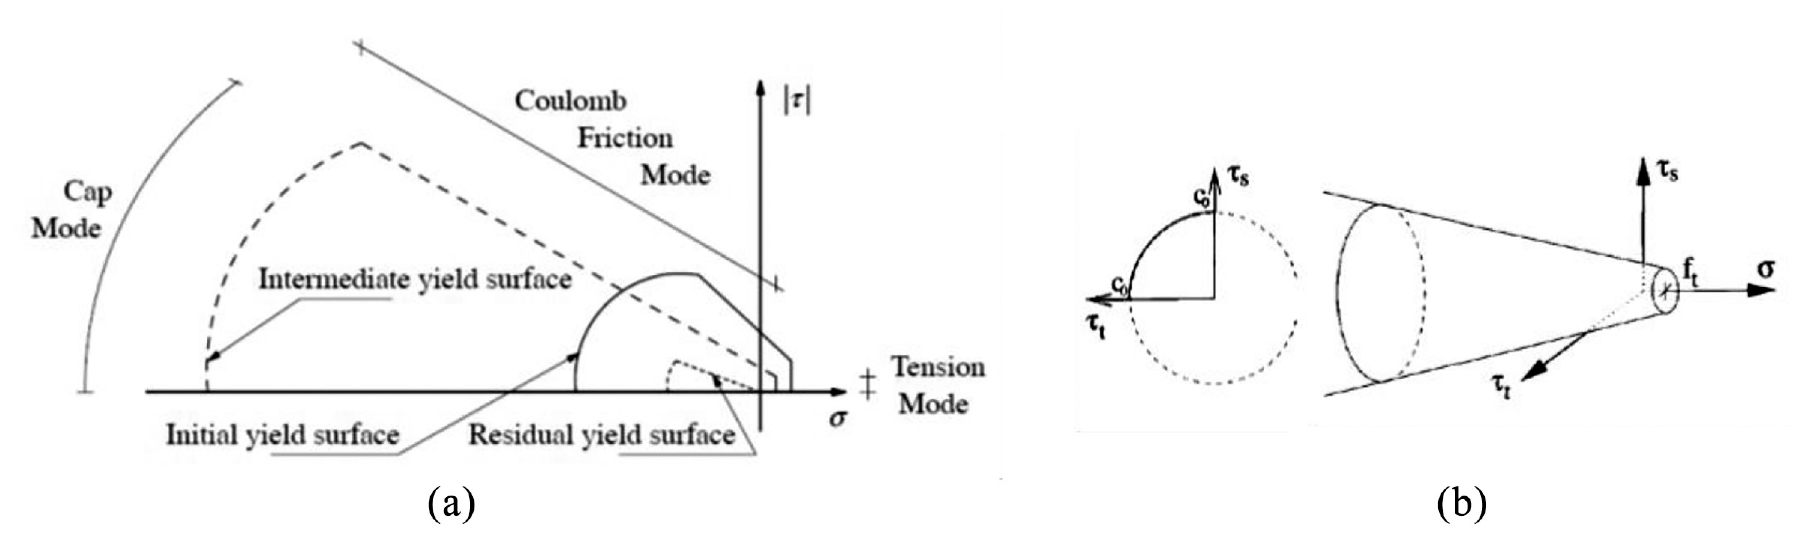
Combined cracking-shearing-crushing yield criterion: (a) in 2D (Lourenço, 1996) and (b) in 3D (Van Zijl, 2000).
Softening, the moderate reduction in load carrying capacity under an increased enforced deformation of a material, is a principal characteristic of quasi-brittle materials. It is well observed in both tensile and compressive failure and in the loss of cohesion in shear failure (Lourenço, 1996). Softening is thus implemented in all three modes and in compression it is preceded by hardening. It is also assumed in all three modes that the inelastic behaviour can be described by their respective fracture energies, which are taken to be material properties.
Elements
The masonry half-units are each modelled using a single 20-noded 3D solid brick elastic continuum element, named CHX60 in DIANA. Quadratic interpolation and 3 × 3 × 3 Gauss integration are used. The mortar joint and unit-mortar interaction, as well as the unit tensile crack, are modelled using a single 16-noded 2D nonlinear plane quadrilateral isoparametric interface element, named CQ48I in DIANA, which allows for discontinuities. Quadratic interpolation and 3 × 3 × 3 Newton-Cotes integration are set as the default.
Lourenço (1996) tested mesh sensitivity executing analyses with each linear continuum unit modelled using 4 × 2 and 8 × 4 quadratic plane stress elements (a four-fold increase in the number of elements) and together with the required number of interface elements. The model was found to be mesh insensitive and a 20-noded brick element thus provides sufficient accuracy. The post-peak softening of the interface elements is also not mesh-dependent (Macorini and Izzuddin, 2011) since the model is automatically regularised by using constitutive relations that are defined in terms of relative displacement instead of strains, whereby the fracture energy is dissipated over the crack area as opposed to the crack volume. Aspects regarding mesh dependency are therefore not pursued further.
Solution method
No attempt was made to compare different solution techniques, the only objective being a stable solution procedure. The incremental procedures used in this study are force controlled, with manual adjustment of the increments, as this allows for closer observation of the structural behaviour. A purely incremental procedure is seldom accurate, and several incremental-iterative procedures are available to significantly reduce the error and enable larger increment sizes. For this study, the Regular Newton-Raphson method was employed in most instances, with a line search algorithm improving the method’s robustness. This iterative algorithm obtains an increment displacement and scales it in order to minimise the energy potential, which can increase the convergence rate. The maximum number of line searches per increment was set to 5 with an energy convergence tolerance of 0.8. The internal change in strain energy was generally selected as the increment convergence criterion and is set to ≤10−4 times the energy variation at the start of the load increment (Lourenço, 1996). On occasion, the Modified Newton-Raphson or Constant Stiffness methods were employed for improved stability, as well as a force convergence criterion, set to 0.01.
When cracks develop in the modelled structure, elastic energy that is stored in the bulk of the material must be redistributed from the units connected to the damaged interface to the rest of the structure. This can lead to sharp snap backs and jumps in the global solution (Macorini and Izzuddin, 2011). Employing an arc length method can assist in overcoming these numerical difficulties. The Updated Normal Plane arc length method, with regular indirect displacement control, was used, constraining the norm of the displacement increment to a predefined value by adjusting the increment size at the same time. This choice is appropriate for brittle materials in which local failure is typical (Palacio, 2013). The choice between loading and unloading (increments or decrements) was set to the appearance of negative pivots, which can only be used in conjunction with the Regular Newton-Raphson method.
Model input
Wall configurations
The deemed-to-satisfy solutions entrenched in the South African NBR for masonry walls (SANS 10400-K, 2011) implicitly represent society’s expectation regarding the wall’s performance. These solutions were therefore used as the basis to identify suitable LIH wall configurations, applied as representative masonry walls in the numerical analyses. Additional limitations and recommendations set out in SANS 10400-A (2010), SANS 10400-L (2011), SANS 10160-4 (2017) and SANS 10400-XA (2011) for geometry, seismic loading and energy use were also taken into consideration. Further details of these criteria can be found in De Villiers (2019). The most critical and extreme combinations of wall height, distance between lateral supports and openings were selected to arrive at two different wall configurations: a panel wall, W1, and a gable wall, W2, detailed in Figure 5. Hatched areas indicate lines of lateral support in the form of return walls.
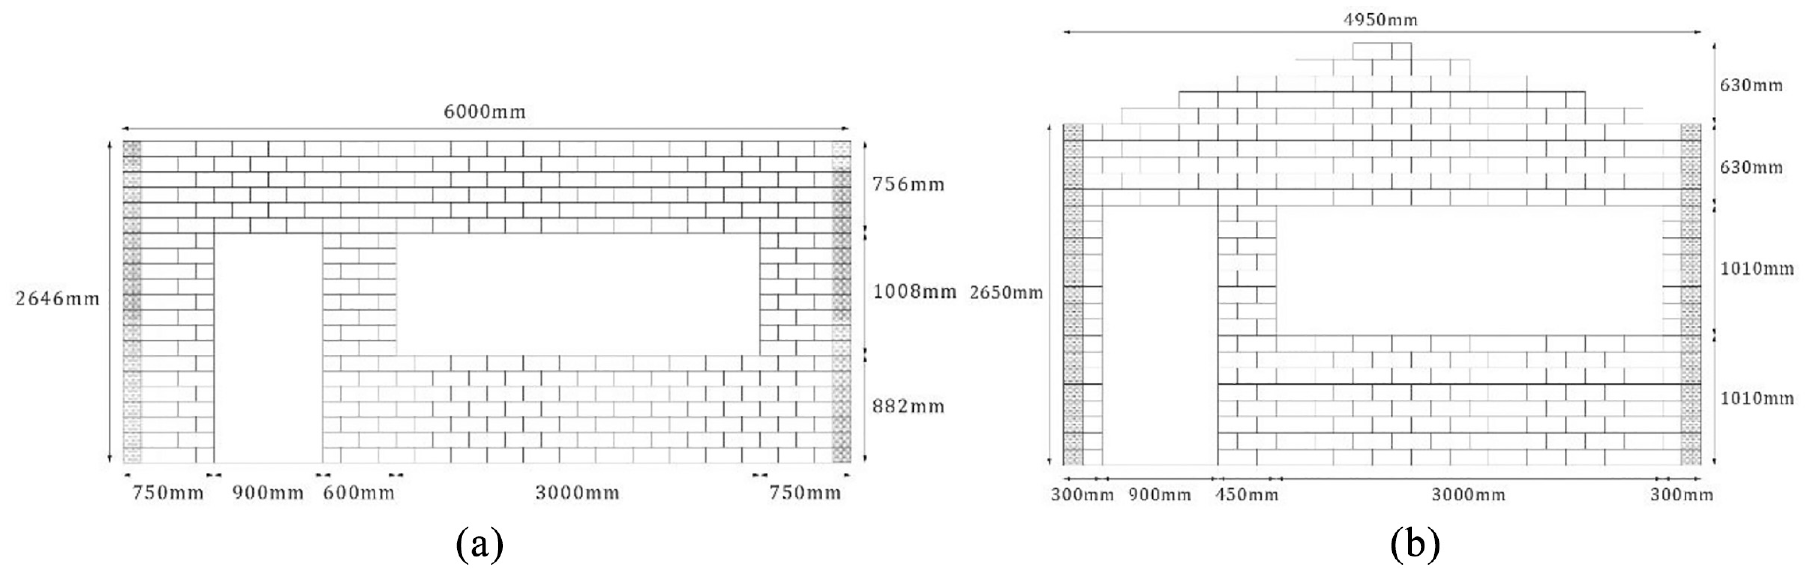
Wall W1 (left) and W2 (right) layout and dimensions.
The roof construction was assumed to be timber, with metal sheet covering and the following assumptions were made regarding the support conditions for the wall models. The foundations were fully supported and fixed, with no differential settlement potential, see Figure 6. For the lateral supports, short return walls were modelled with pin supports in the lateral direction to allow for some rotation at these joints. The top support along the roof line was modelled as free for both walls, on the assumption that the roof truss system provides negligible lateral load transfer. This assumption is based on the type of, and typically poor quality, connection provided between the roof and walling systems in LIH.
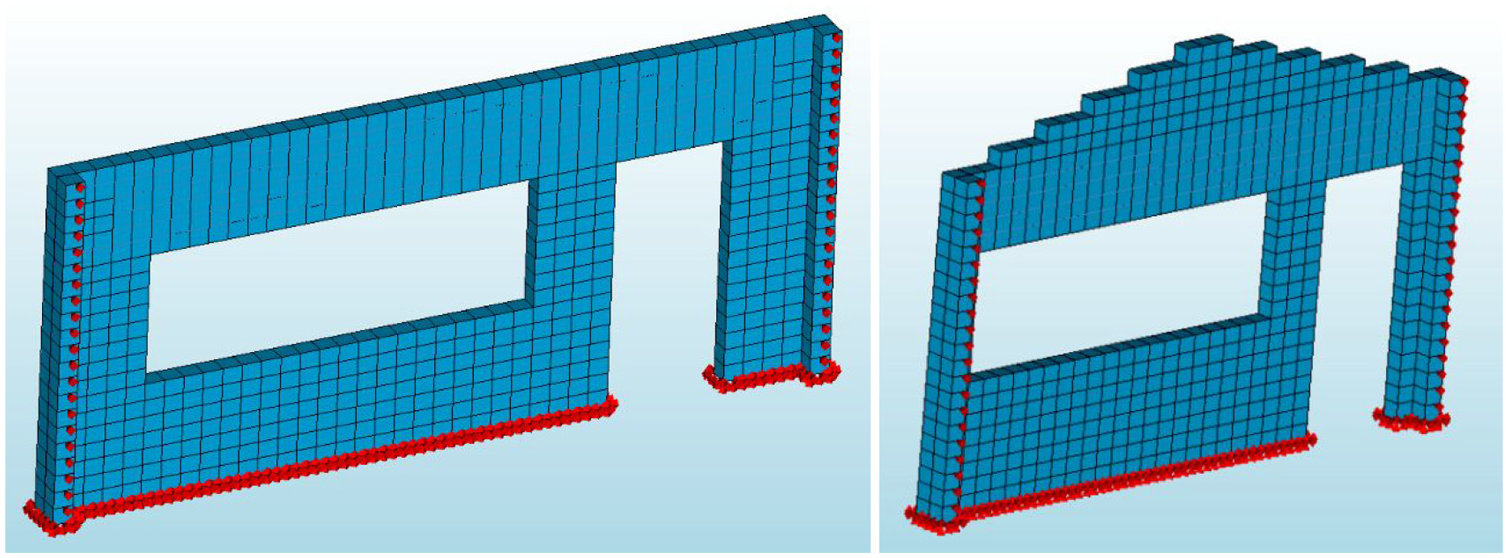
Boundary conditions for wall W1 (left) and W2 (right), inner perspective.
Material input parameters
In the realm of FE modelling of alternative masonry, scant data is available for both material input parameters and FE results validated experimentally. The most commonly referenced obstacle to FE modelling of AM, apart from the complex behaviour of masonry in general, is the lack of parametric input data for the materials. Individual examples of comprehensive finite element modelling (FEM) of AMU’s, with validation using experimental data, can be cited, such as (Tarque et al., 2014), but they are sparse.
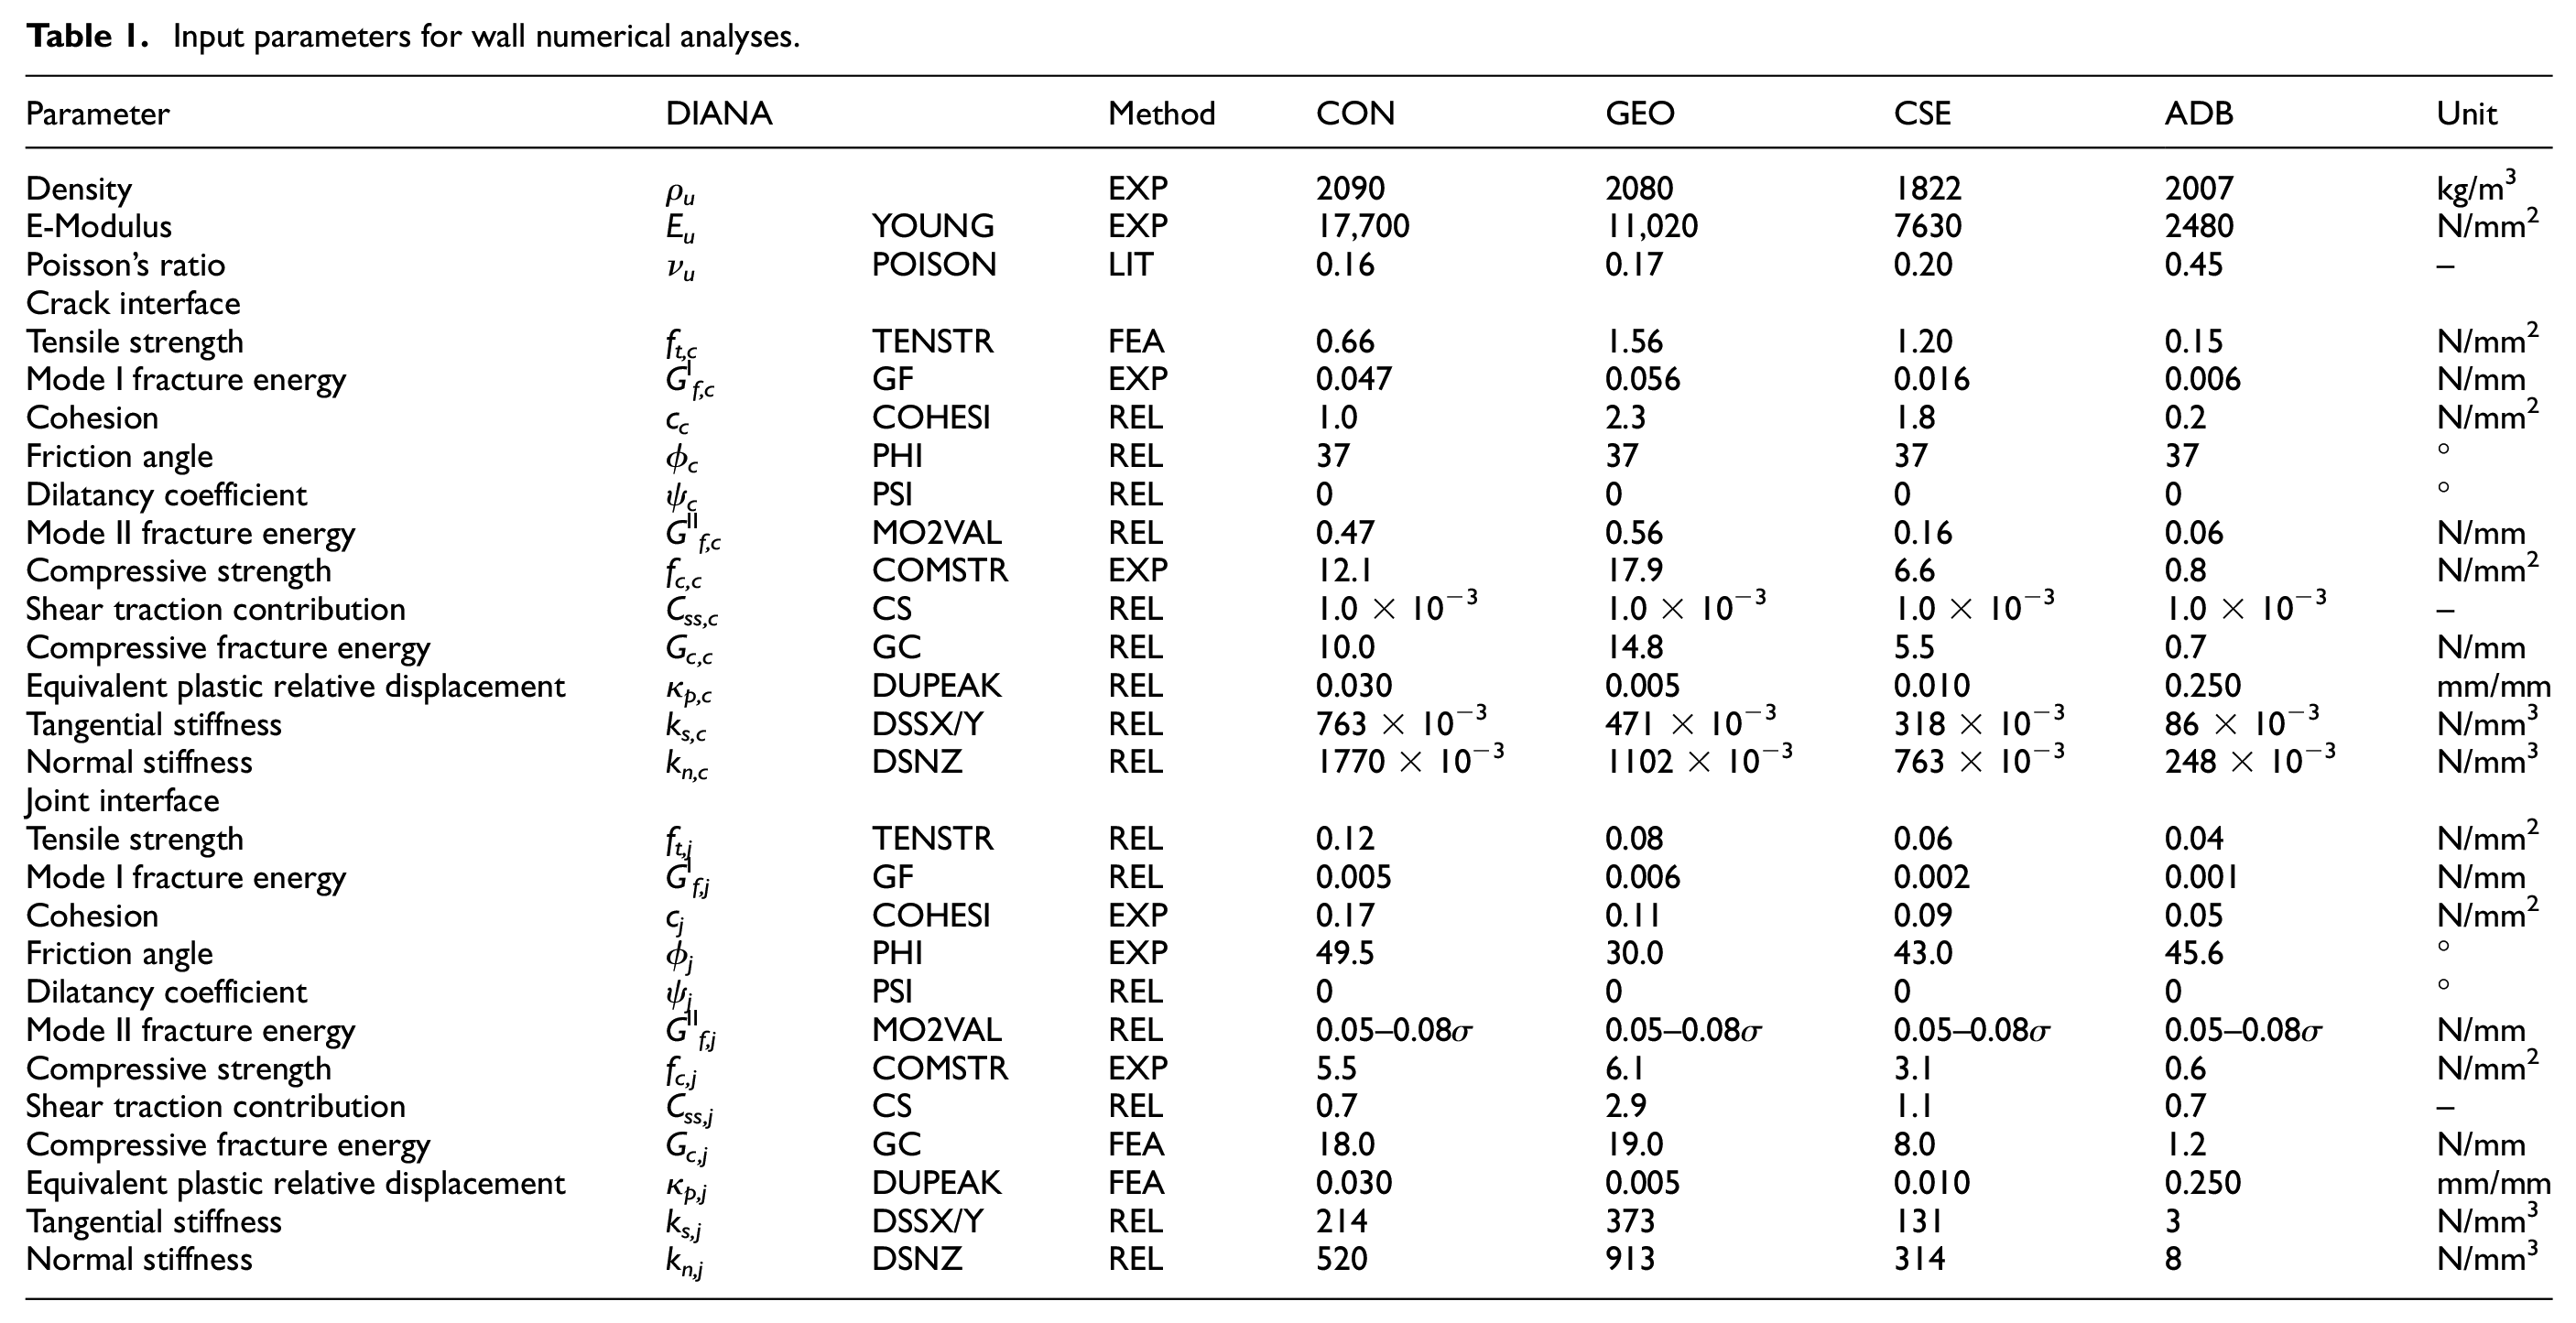
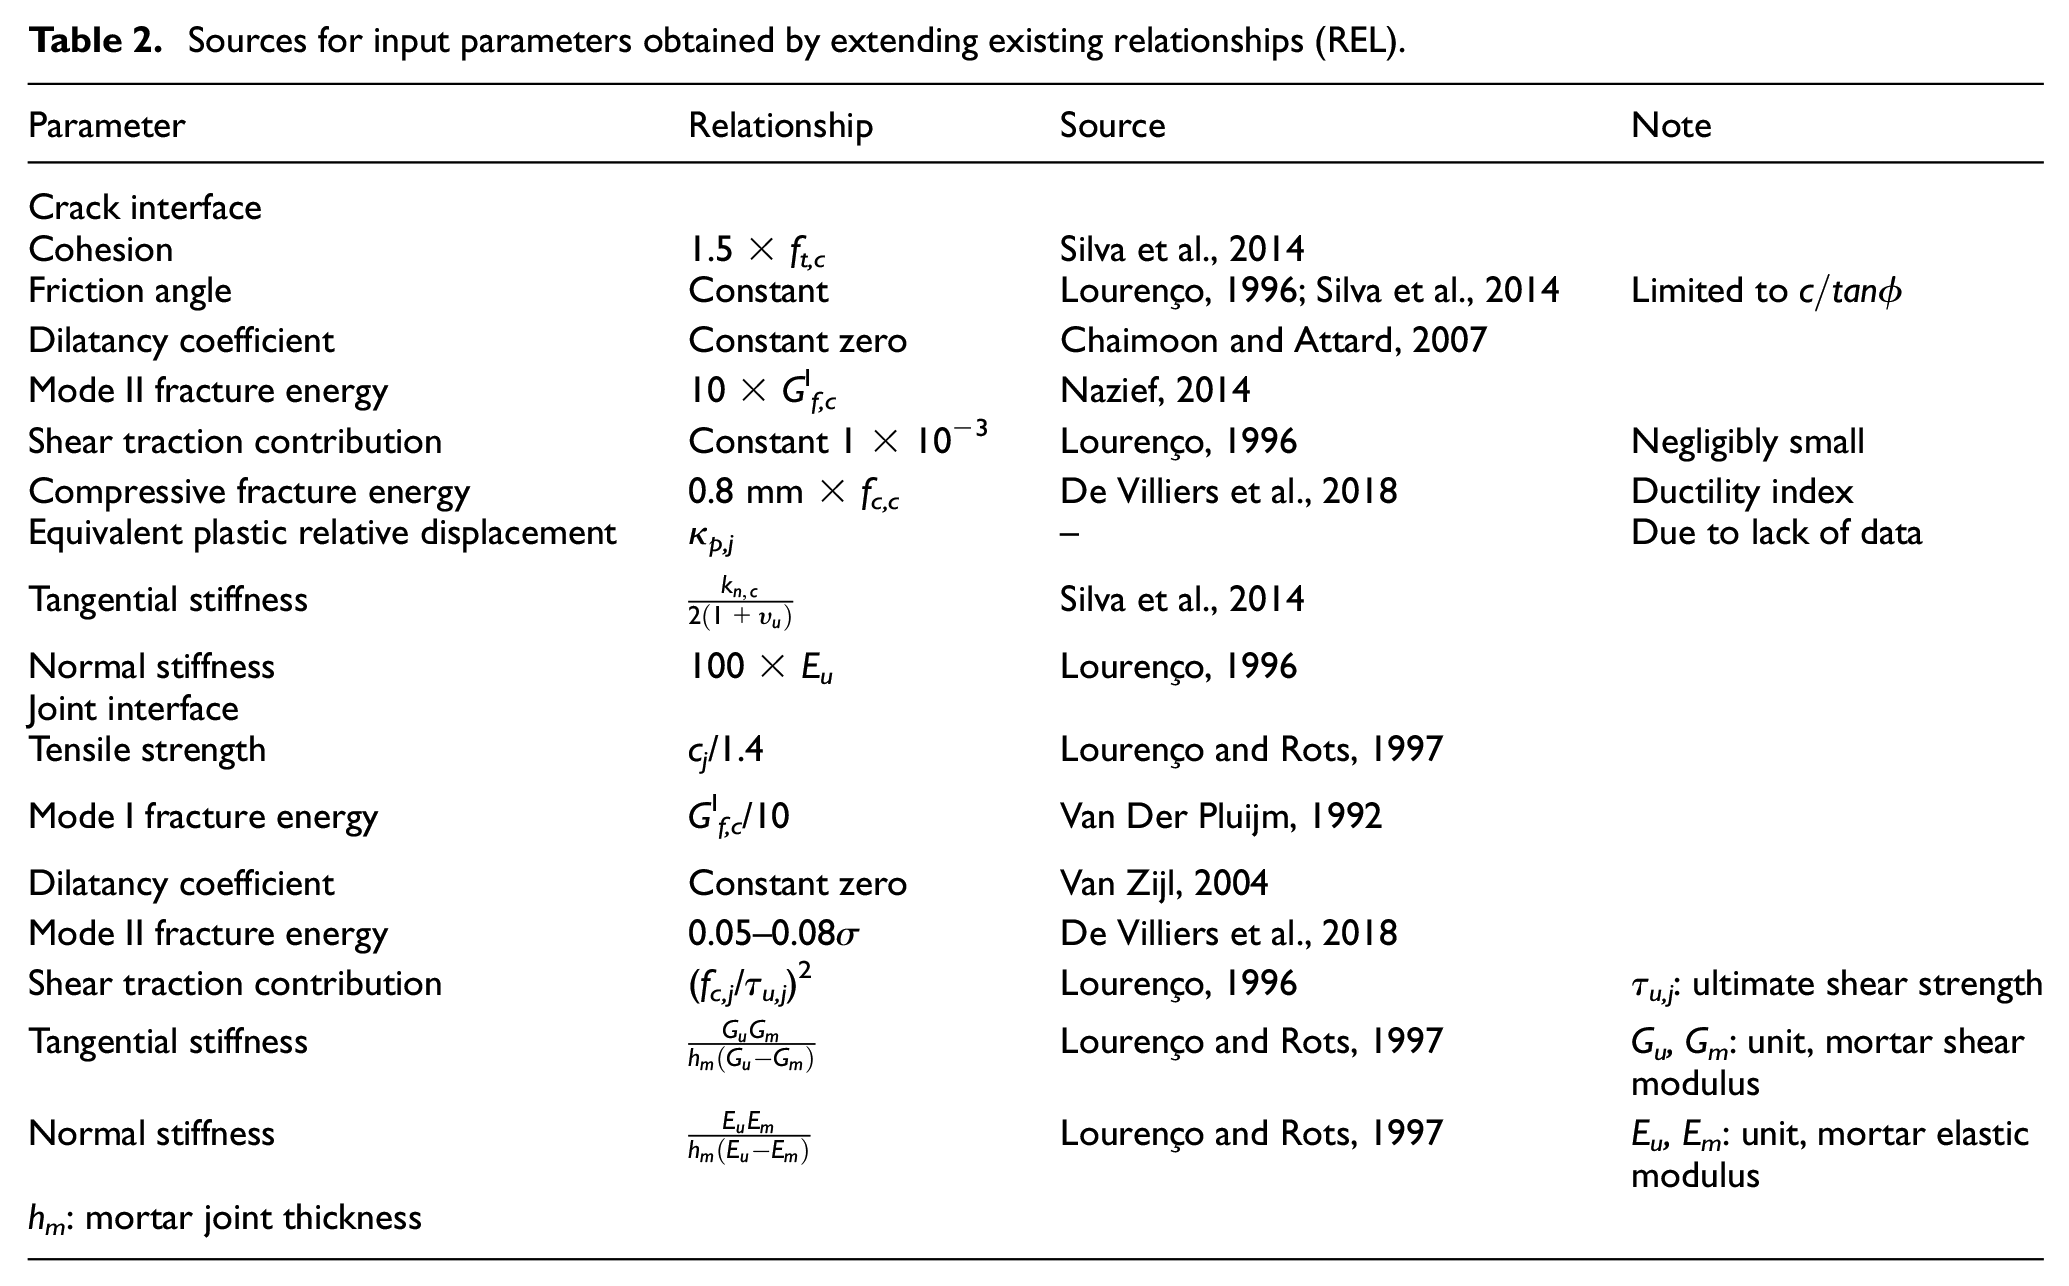
The selected DIANA material model, CCSC, requires a comprehensive material description. The input parameters required for the four materials, the method by which they were determined, and their values are detailed in Table 1. The unit density and E-modulus, the crack interface mode I fracture energy and compressive strength and the joint interface cohesion, friction angle and compressive strength were all determined experimentally (EXP) by Fourie (2017). The crack interface tensile strength and joint interface compressive fracture energy and equivalent plastic relative displacement were all determined by means of numerical fitting by finite element analysis of the experimental data (FEA). The Poisson ratios were determined through literary sources (LIT) for the four materials, CON (Williams et al., 2007), GEO (Hardjito et al., 2005; Joseph and Mathew, 2012; Pan et al., 2011), CSE (Reddy et al., 2007) and ADB (Miccoli et al, 2014). The remaining parameters were determined by extending existing relationships (REL) between parameters for conventional materials to the alternative materials, as set out in Table 2. For details on the determination of the input parameters, the reader is referred to De Villiers et al. (2018).
Input parameters for wall numerical analyses.
Sources for input parameters obtained by extending existing relationships (REL).
In lieu of modelling concrete lintels above the openings, typical reinforcement (SANS 10400-K, 2011) in the form of 5.6 mm diameter steel rods and 2.8 mm brickforce was included in the bed joints above the openings, as detailed in Figure 7. The yield strength for both reinforcement types was taken as 485 N/mm2 (SANS 10400-K, 2011; Talocchino, 2005).
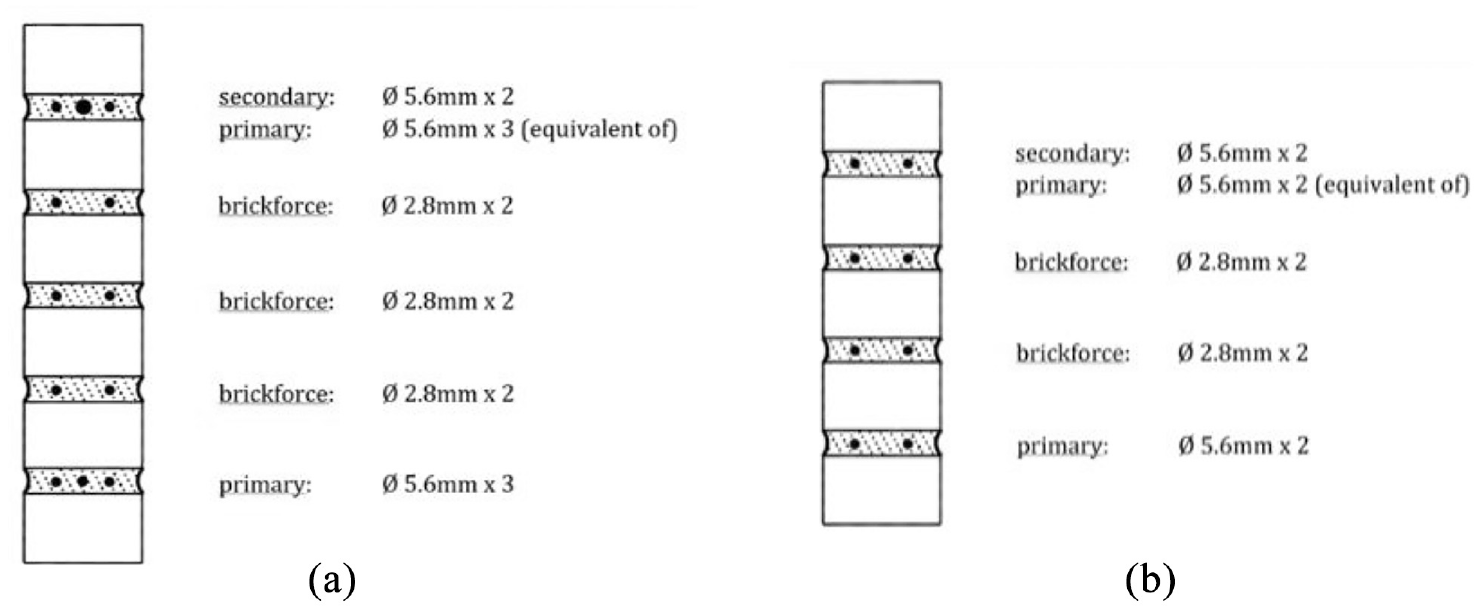
Bed joint reinforcement above openings for wall W1 (left) and W2 (right).
The current input data is statistically insufficient to establish characteristic values. SANS 10160-1 (2018) makes allowance for the use of nominal values in such instances and requires the use of mean values for the structural stiffness parameters.
In limit states design, partial factors for materials contribute significantly to the design process. However, for the purposes of this study, the material partial factors were omitted. This admittedly renders an evaluation of the AMU walls against design loads, which are adjusted with partial factors, less conclusive. However, the application of material partial factors obfuscates the FE output, impacting especially the fracture behaviour and the investigation of the relative importance of parameters.
Experimental validation
A separate experimental/numerical process was followed to validate the choice of modelling approach and material input parameters, for both the in-plane (IP) and out-of-plane (OP) masonry responses (De Villiers, 2019). For the IP validation, large-scale wall specimens (1512 mm high × 1790 mm long with 10 mm mortar joints) were constructed and tested under shear loading by Shiso (2019) for all three alternative masonry materials (GEO, CSE and ADB). The wall specimens were fixed at the base and free at the top. A vertical precompression load (equivalent to 15% of the wall’s compressive strength) was applied and maintained for the duration of the test. Subsequently a horizontal IP load was applied to the top corner of the specimens. In Figure 8, the experimental responses of these masonry walls are compared to numerical analyses of these tests, using the modelling approach described. Satisfactory correlation was found, with all numerical peak loads within 11% of the experimental values, considering loads within the first 5 mm of displacement.
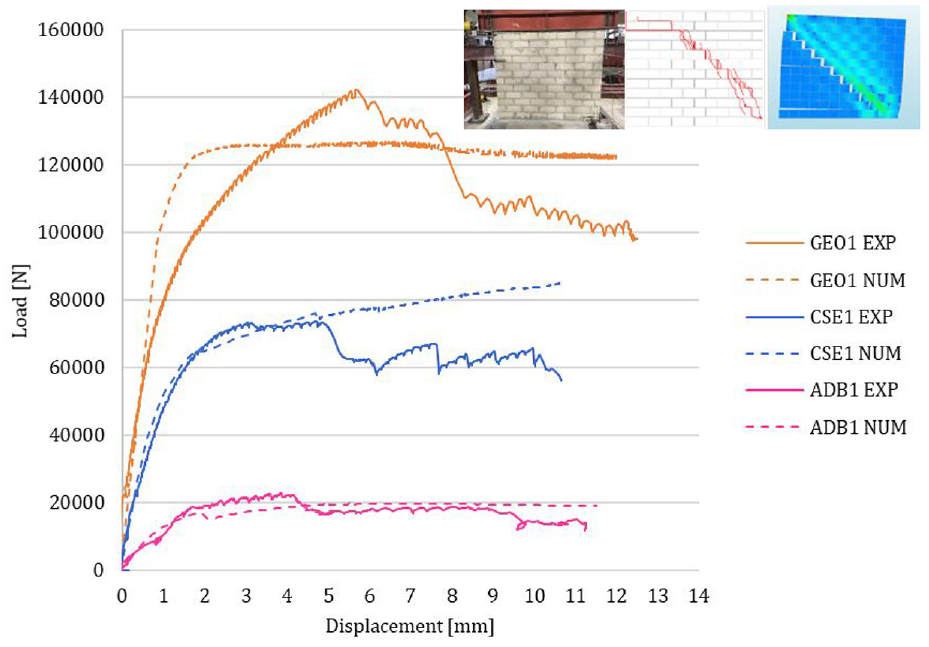
IP experimental and numerical horizontal force-displacement showing CSE crack patterns as example.
For the OP validation, medium-scale walls specimens were constructed and tested under OP loading by Jooste (2020), according to EN 1052-2 (1999) for failure planes both parallel and perpendicular to the bed joints, for all four masonry materials under consideration. In Figure 9, the experimental responses of these masonry walls, demonstrating failure parallel to the bed joints, are compared to numerical analyses of these tests, using the modelling approach described. Due to the brittle nature of the failure mechanism and the inherent variability of masonry, experimental results exhibit varied results. Nevertheless, the experimental and numerical results are considered to agree adequately to serve as validation of the FE approach for the OP behaviour of this spectrum of AMU’s. Further results of the validation process can be found in De Villiers (2019).
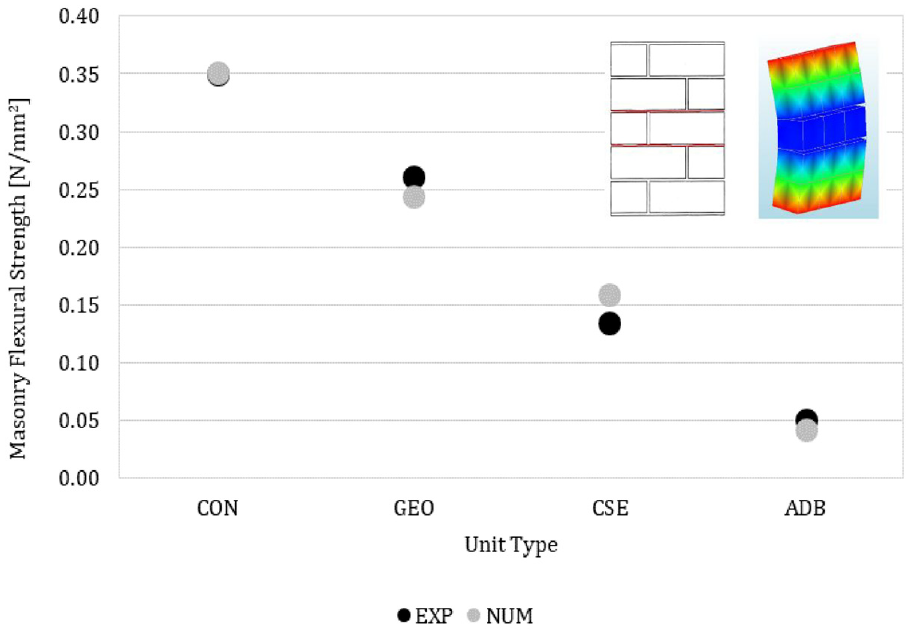
OP experimental and numerical flexural resistance, showing typical crack patterns.
Design loads
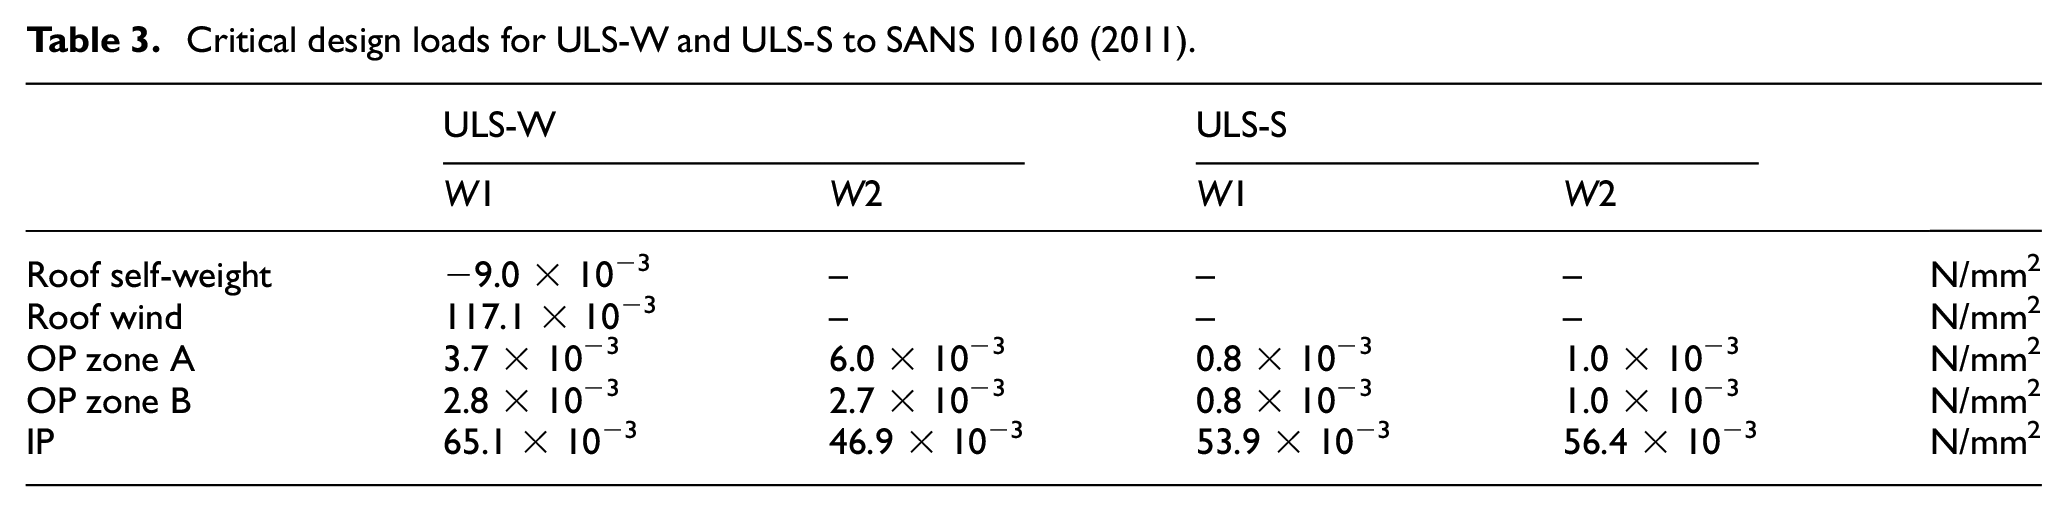
To assess structural strength and stability, the NBR (SANS 10400-B, 2012) requires the loading on the structure and structural elements to be determined according to the relevant part of the South African loading code (SANS 10160, 2011), including permanent, imposed and seismic action. All relevant design situations were considered and the most critical situations identified. The load cases considered are the two ultimate limit states for wind (ULS-W) and seismic (ULS-S) actions, regarding the safety of persons and the structure. The equivalent lateral static force method was employed for the seismic actions. The factored loads applied in the FE analyses are summarised in Table 3 and in Figure 10 for the ULS-W and in Figure 11 for the ULS-S. The design values of the load cases were determined using the partial factors according to SANS 10160-1 (SANS 10160-1, 2018). The assumptions made in determining these critical load cases are detailed in De Villiers (2019).
Critical design loads for ULS-W and ULS-S to SANS 10160 (2011).
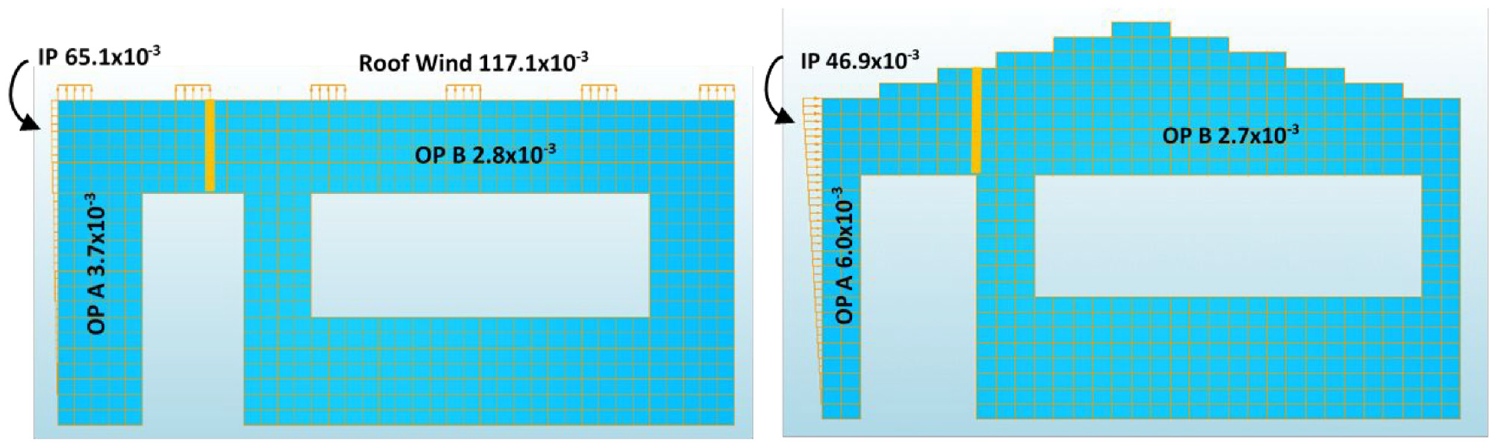
Critical design load pressures (N/mm2) for wall W1 (left) and W2 (right) for ULS-W.
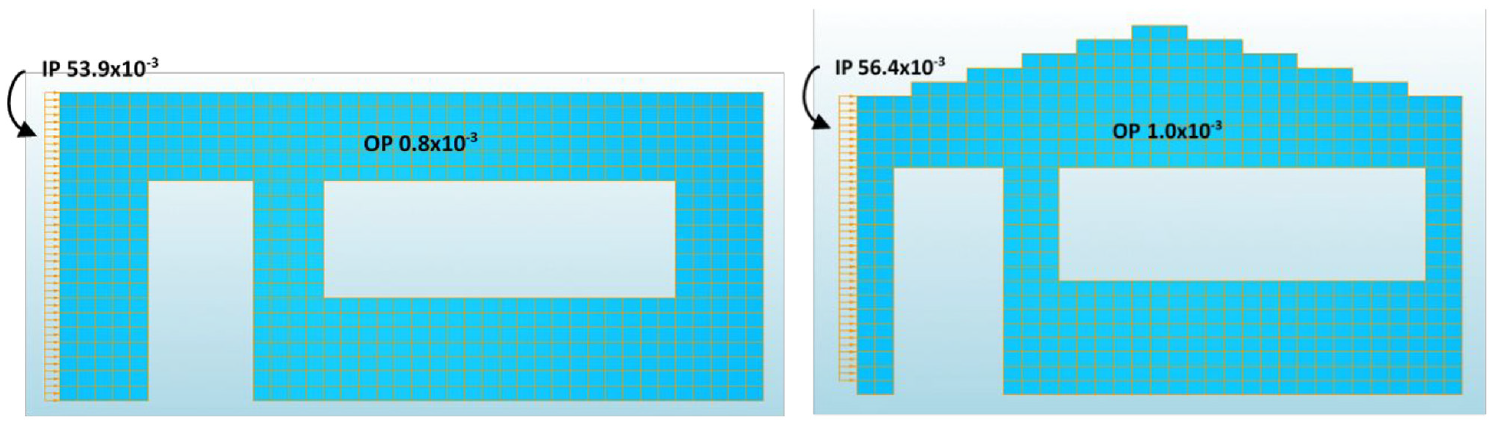
Critical design load pressures (N/mm2) for wall W1 (left) and W2 (right) for ULS-S.
The out-of-plane (OP) load is a uniform distributed load, applied over the entire wall. This load includes the wind or seismic load, as applicable. The load is segmented into A and B for the wind loads according to Figure 12 of SANS 10160-3 (2018), since the wall under consideration being situated as the side wall was found to be the most critical load case in all wind loading configurations. The total OP force (N) determined, is distributed uniformly over the masonry portions of the wall, to compensate for the lack of surface area over the model openings to which OP load cannot be applied.
Crack position and deflection/displacement measurement legend (W1 left, W2 right).
The in-plane (IP) load is a horizontal load over the full height of the wall, distributed over the thickness of the wall. This load includes the wind or seismic load, as applicable, and originates from the lateral loads on the adjacent walls. For the wind load cases, the load varies linearly with the maximum value, applied at the top of the wall, presented in Table 3. For the seismic load case, the load is distributed uniformly over the height of the wall, following the principle that lateral loads are applied at the location of the mass (EN 1998-1, 2004).
The roof load is the load applied by the roof at each truss support point, distributed over one masonry block to avoid stress concentration. This load includes the roof self-weight and wind load, if applicable. A positive value indicates uplift, whereas a negative value indicates a compressive force. A roof load was only applied to wall configuration W1, since W2 is a gable wall and does not support trusses.
Previously, experimental and numerical studies have concentrated on the effect of either IP or OP loading. IP loading of unreinforced masonry walls results in shear, sliding or flexural failure mechanisms, with shear being the dominant form. For OP loading, the failure mechanism depends on the support conditions, whether one-way or two-way spanning slabs, and thus uniaxial or biaxial bending. More recently, the importance of the interaction of these loading conditions has come to the fore, but with a focus on infill masonry walls. Only a few numerical studies have considered the combined effects on load-bearing URM and even less experimental campaigns, (Agnihotri et al., 2013; Dolatshahi et al., 2015; Milani, 2008; Najafgholipour et al., 2013). Typical findings include that the IP load may significantly affect the OP capacity and the interaction level is dependent on the wall aspect ratio and slenderness ratio. Hence, the relevant IP and OP loads are applied simultaneously in this study.
Results
The results are presented in the following subsections, starting with an overview of the typical failure mechanisms and crack patterns found, followed by the OP load-deflection and IP load-displacement responses and crack damage classification.
Results overview
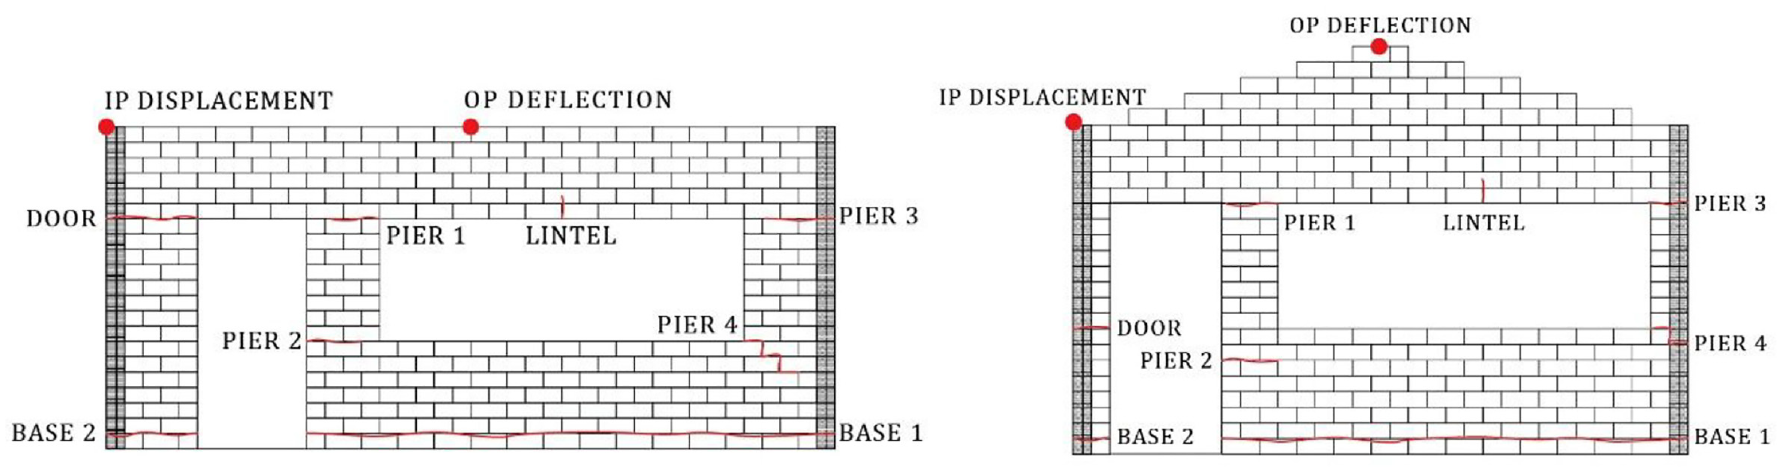
The IP displacement was measured at the top left corner of each wall, shown in Figure 12, and the OP deflection was measured at the top midspan position. The typical crack positions are also indicated and named in this figure, as reference for the later discussion on crack width and damage classification.
The following two figures illustrate the typical failure modes for the two load cases. In neither the OP nor the IP failures is crushing or compressive failure noted in either of the wall configurations. Given the small structure size and relatively low vertical imposed loads, this is not extraordinary. For the ULS-W (Figure 13), OP failure dominates, since the larger proportion of the total load applied is lateral. The contours in these two figures are thus of the OP deflection. However, no scale is provided since the deflections vary for each material type and the figures are only intended to illustrate typical failure patterns. OP deflection magnitudes are provided in Figure 15 for W1 and Figure 16 for W2.
Typical failure for ULS-W for walls W1 (left) and W2 (right).
Crack onset is the tensile failure in the lowest joint in the longest wall section (‘Base 1’) and shear failure in the column to the left of the door (‘Door’) for both wall configurations W1 and W2 for the SLS and ULS-W load cases. Tensile cracks also form at the top (‘Pier 1’) and bottom (‘Pier 2’) of the pier to the left of the window. For the ADB case, considerable cracks also occur in the ‘Lintel’ above the window due to the own weight of the wall above and negligible tensile capacity of ADB.
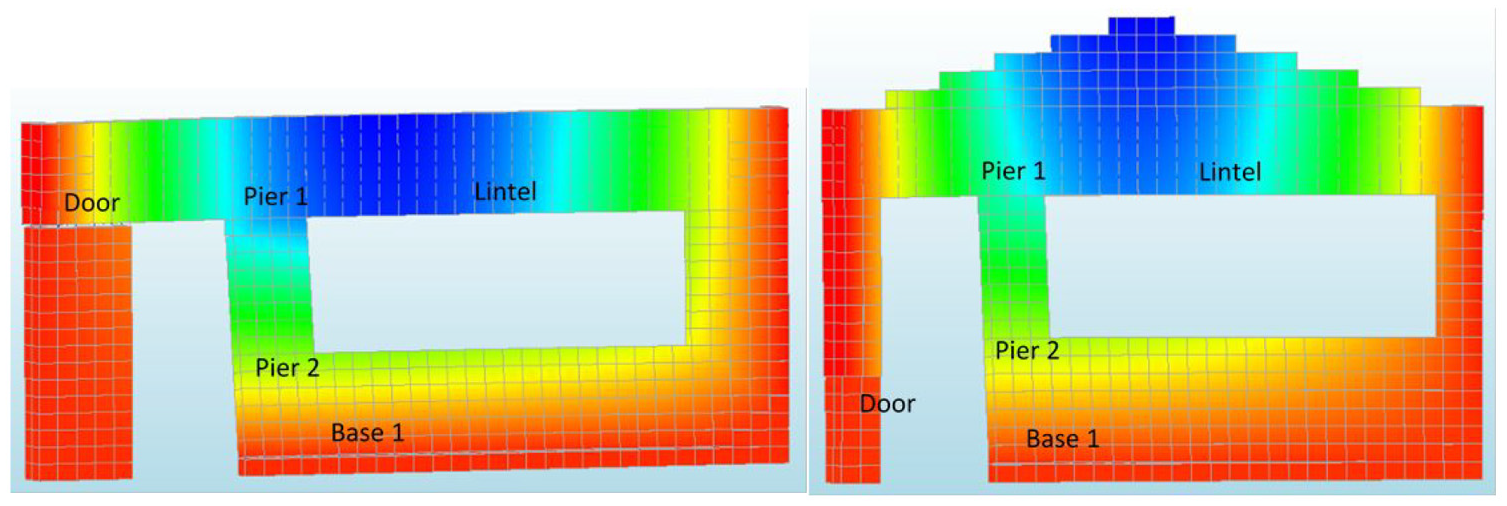
For the ULS-S (Figure 14), IP failure dominates, since the majority of the seismic load is expected to be carried as shear action in the walls. Thus the contours in this figure are the IP displacement, the magnitudes of which are provided in Figure 17 for W1 and Figure 18 for W2.
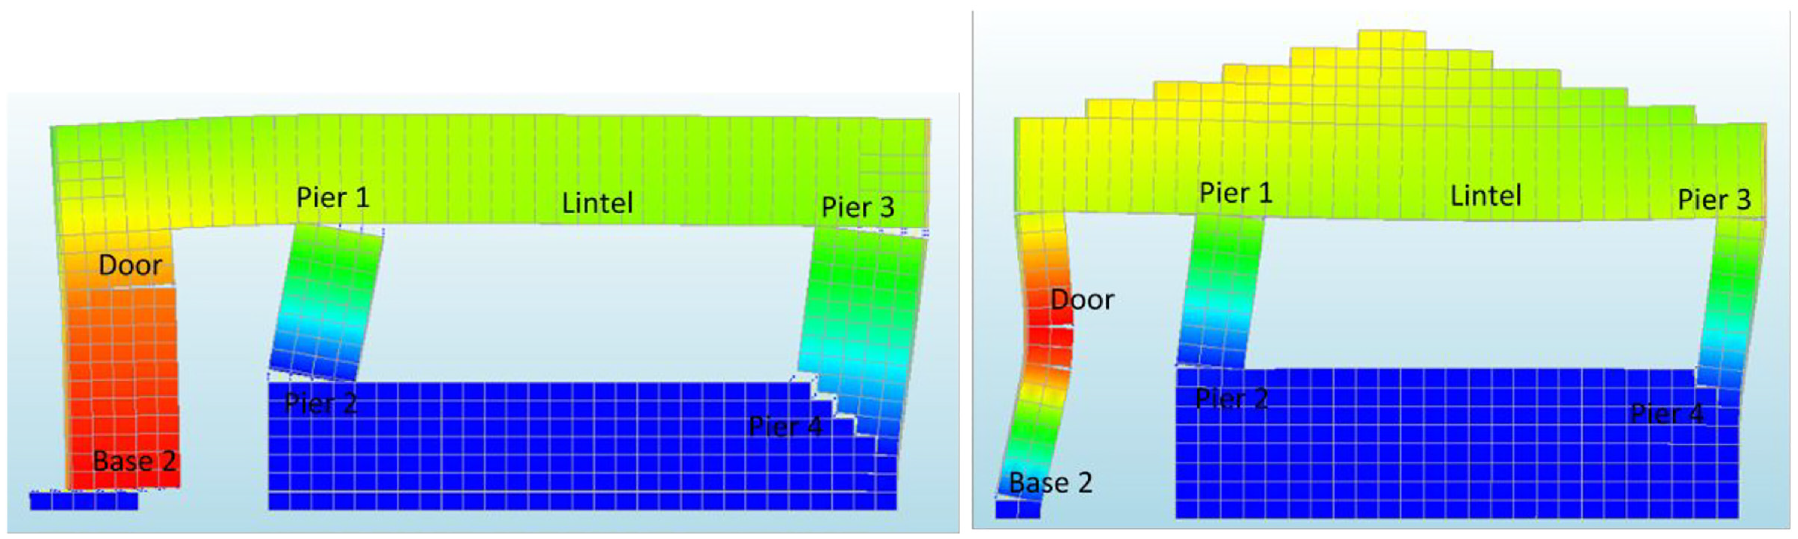
Typical failure for ULS-S for walls W1 (left) and W2 (right).
The majority of the cracks in the ULS-S are tensile/flexural, at the base of the column to the left of the door (‘Base 2’), at the top and bottom of the pier to the left of the window (‘Pier 1’ and ‘Pier 2’ respectively) and likewise to the right of the window (‘Pier 3’ and ‘Pier 4’). ‘Pier 4’ is a combined tensile/shear failure of stepped cracks and ‘Base 2’ starts as a tensile failure in most cases and progresses to sliding shear for some of the material types. Again, considerable tensile cracks occur in the ‘Lintel’ above the window in the ADB case. In the case of W2, the slender column to the left of the door, as well as the significant own weight of the wall above the large window opening due to the gable, make this wall configuration particularly vulnerable.
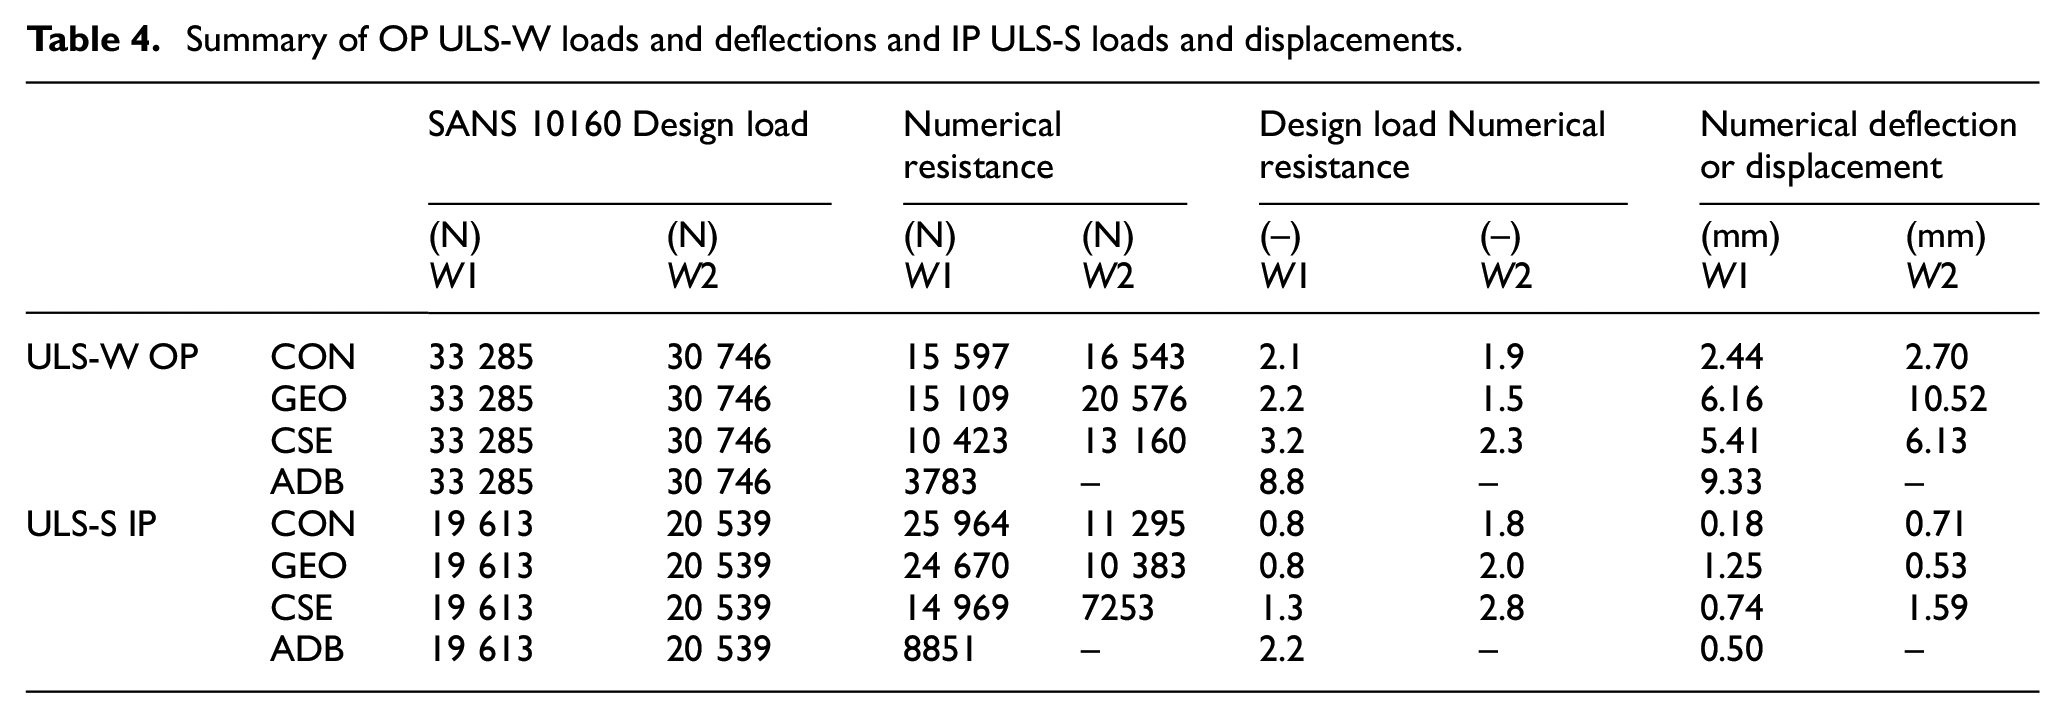
The OP design loads, resistance and deflections determined through the numerical analyses, for the different material types are summarised in Table 4 as an overview for ULS-W. Likewise, the summary is presented in Table 4 for the IP case for ULS-S. The ratio of the design load to the numerical wall resistance for the critical load direction for each instance is included. A ratio of >1.0 therefore indicates a failure to resist the design load and, for more convenient visual interpretation, these ratios are graded further by colour. The W2 ADB results for the ULS-W and ULS-S are omitted, since failure occurred prior to the application of any horizontal loading. The self-weight above the window opening caused excessive tensile cracking in the lintel. The results are discussed in more detail in the following sub-sections.
Summary of OP ULS-W loads and deflections and IP ULS-S loads and displacements.
Out-of-plane response
The following two figures depict the OP load/deflection for W1 (Figure 15) and W2 (Figure 16) for the four block types and two load cases. The OP design load, determined according to the South African loading code (SANS 10160, 2011) is also included for each of the two load cases to provide context for the results. The design loads were provided in the form of pressures (N/mm2) in Table 3 but to enable effective comparison, these design loads and the walls’ resistance capacities are converted to forces (N), according to the relevant surface area. Additionally, the maximum allowable OP deflection, determined according to the NBR (SANS 10400, 2010) for such buildings, is included for deflection contextualisation. Again, the W2 ADB results in Figure 16 for the ULS-W and ULS-S are omitted due to tensile failure in the window lintel under the self-weight of the gable wall.
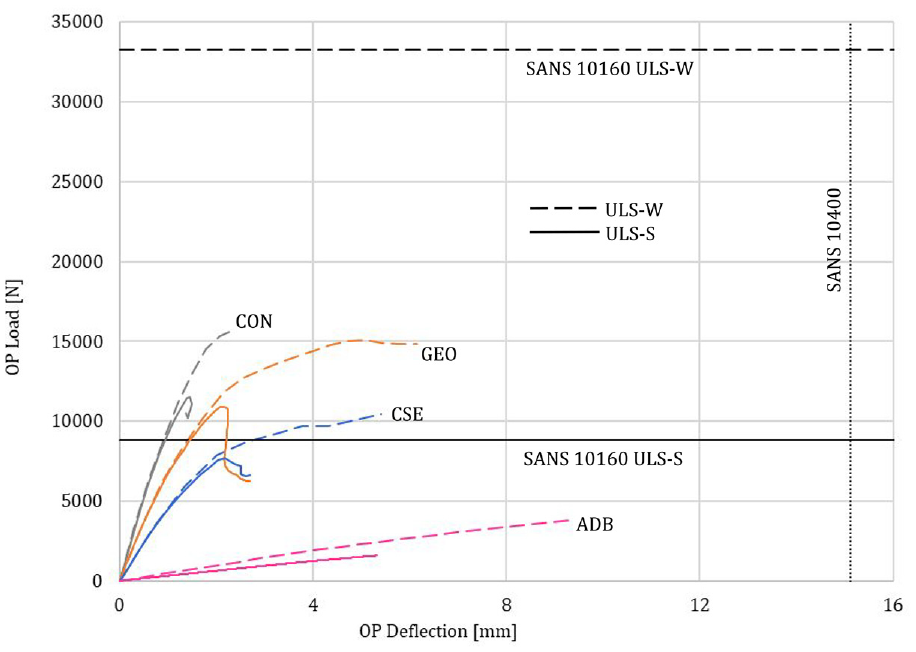
Wall W1 CON, GEO, CSE, and ADB out-of-plane response.
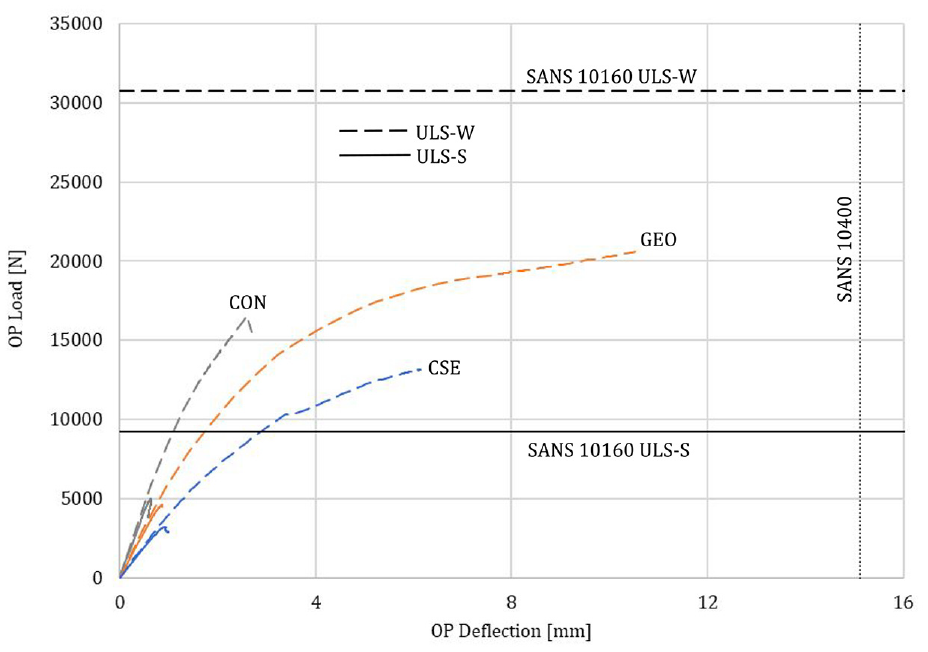
Wall W2 CON, GEO, and CSE out-of-plane response.
To address the most conspicuous inference first: of the 16 analyses, in only two instances does the OP load carrying capacity exceed the OP design load, namely for CON ULS-S (W1) and GEO ULS-S (W1). In all other cases, the OP design load far exceeds the load carrying capacity. It is notable that the OP response for this load case is inadequate, in accordance with more recent assertions in literature (Derakhshan et al., 2018; Vaculik, 2012) that OP unreinforced masonry behaviour cannot be overlooked in seismic loading.
The OP deflection is naturally of a greater magnitude than the IP displacement measured in the previous two figures. Most OP deflections range between 2.5 and 10 mm, still well below the 1:175 deflection limit imposed in the NBR [33] for such buildings. The gable of the W2 configuration was presumed to be an issue, since it is not buttressed, contrary to the specifications of SANS 10160-4 (2017). However this element proved to be noncritical in all of the OP loading conditions considered. In all likelihood this is due to the more vulnerable, slender elements elsewhere in the wall. A better proportioned wall opening geometry may well render the gable critical, requiring buttressing.
In-plane response
The following two figures depict the IP load/displacement response for W1 (Figure 17) and W2 (Figure 18), for the four material types and two load cases. The IP design load, determined according to the South African loading code (SANS 10160, 2011) is also included for each of the two load cases to provide context for the results. As was found for the OP response, only in two of the analyses did the OP load carrying capacity exceed the OP design load, namely CON ULS-S (W1) and GEO ULS-S (W1). In all other instances, the IP design load exceeds the IP load carrying capacity of the walls and significantly so for W2. For both walls, the responses of the different material types achieve an intentionally wide spectrum and the responses in relation to each are as anticipated, the CON walls exhibiting the largest load capacity and stiffness, followed by GEO, CSE and ADB performing particularly poorly.
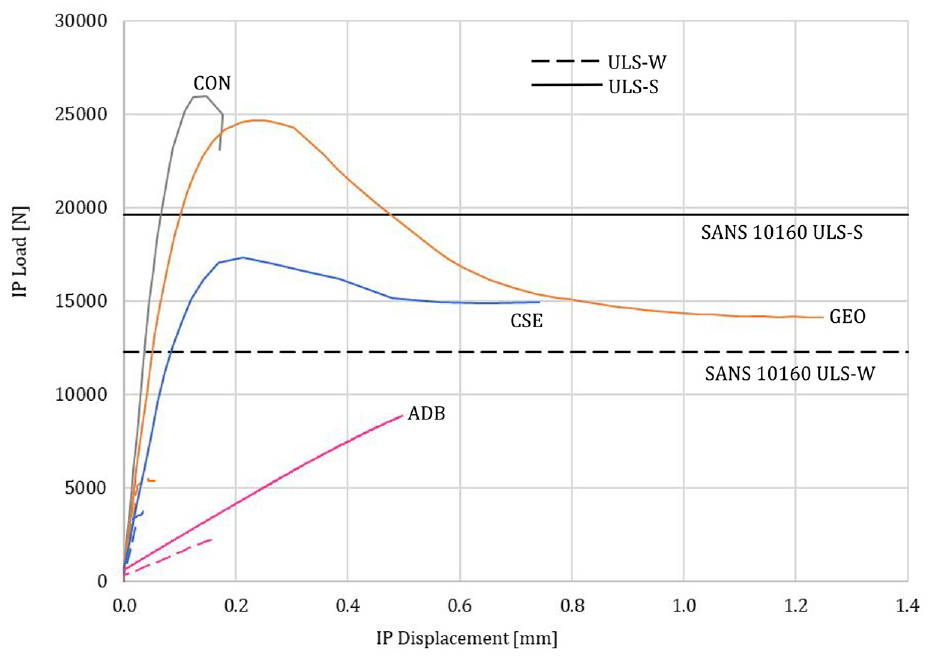
Wall W1 CON, GEO, CSE, and ADB in-plane response.
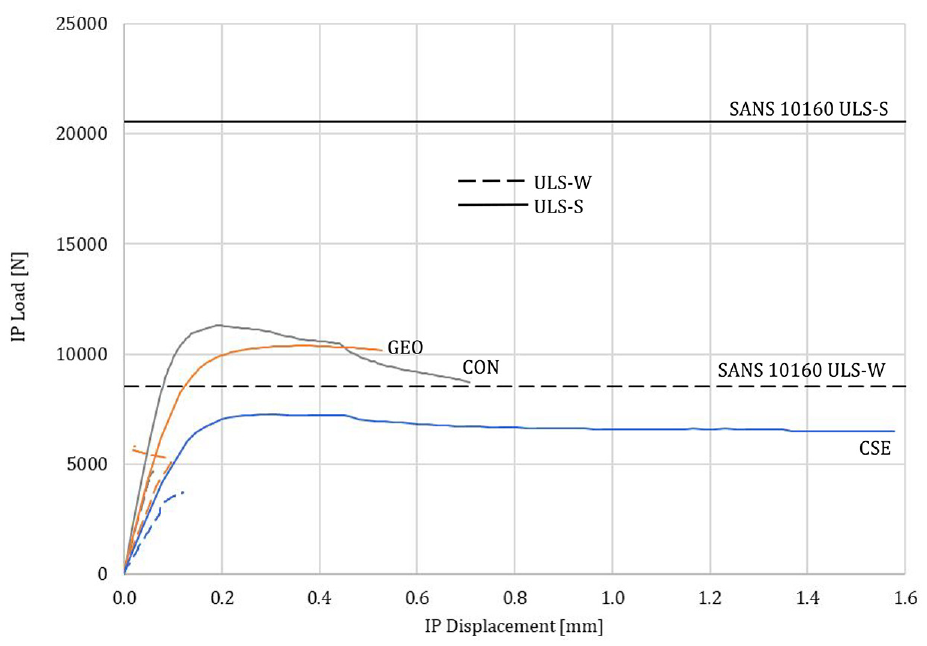
Wall W2 CON, GEO, and CSE in-plane response.
The IP displacement is not significant (<1 mm) for either of the walls, and arguably would be larger if the load path is continued, but this is not pursued due to the laborious nature of overcoming post-peak divergence. No limiting specifications exist for IP displacements as they do for OP deflections in the South African NBR. Marked reduction in load-carrying capacity, coupled with negligible IP displacement, attest to the severely brittle nature of masonry for both the conventional and alternative material types.
The ADB IP load/displacement paths for both wall configurations distinctly lack any post-peak response. The difficulty in attaining convergence in these cases is symptomatic of the exceptionally weak material parameters. The geometry selected for W2 makes it particularly vulnerable to high IP, that is, seismic, loading, which rationalises in part the significant difference in peak IP loads between W1 and W2. W1 maximum seismic IP capacities are on average 2.2 times higher than for W2.
Crack damage classification
The crack damage classification is presented in Figure 19 (W1) and Figure 20 (W2). For clarity, only the dominant crack for each material type/load case combination is included. The crack width frame of reference is provided by the maximum crack width and damage categories specified in the NBR (SANS 10400-B, 2012) and South African Home Building Manual (NHBRC, 2015). The damage categories range from <0.25 mm (negligible) to >25 mm (very severe).
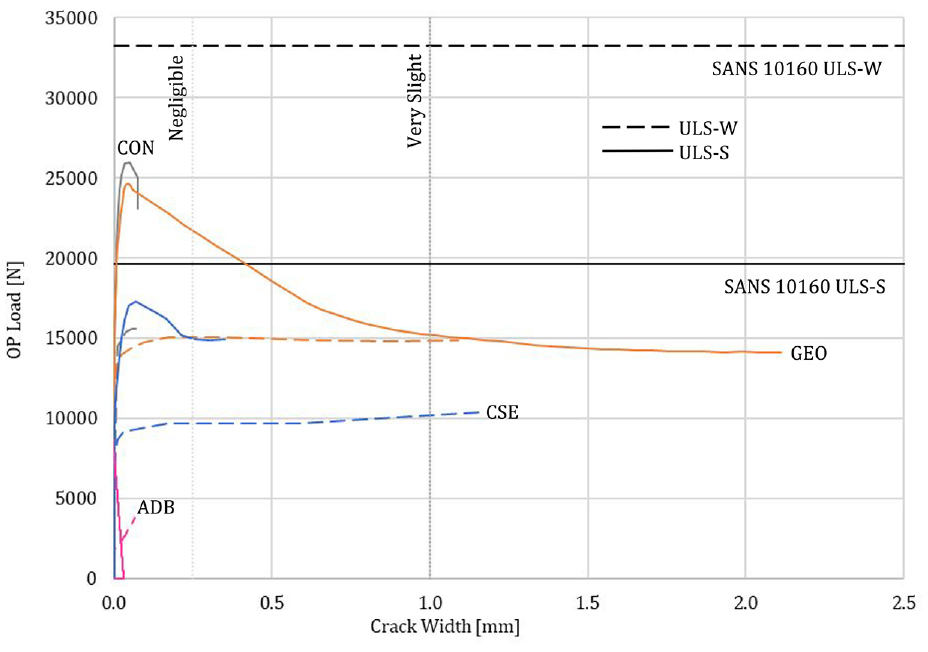
Wall W1 CON, GEO, CSE, and ADB crack damage classification.
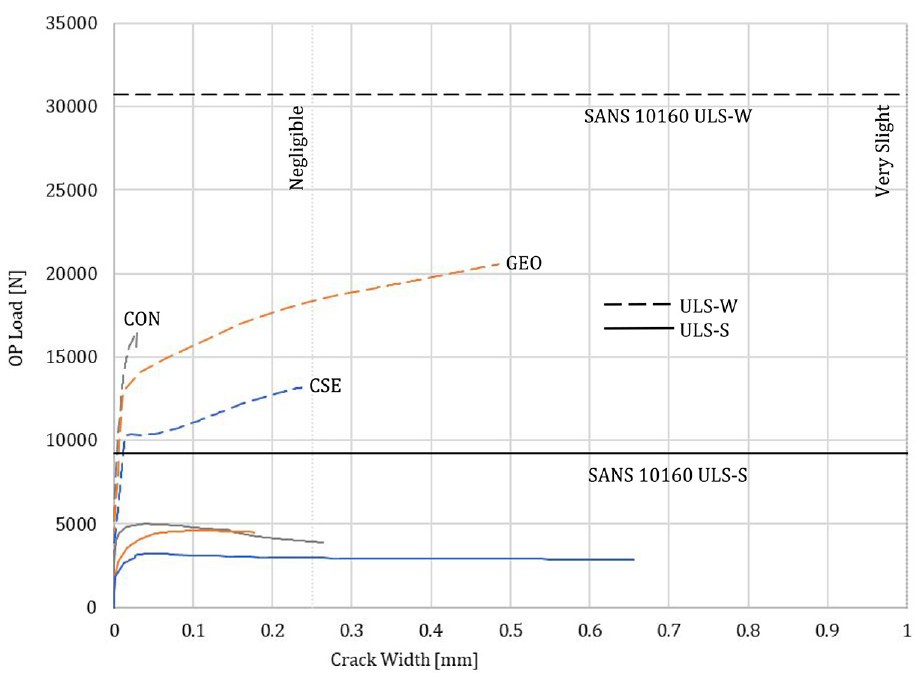
Wall W2 CON, GEO, and CSE crack damage classification.
Cracks occurred in a number of typical positions for the IP and OP dominant loading conditions, as illustrated in Figure 12, as well as in Figure 13 for the ULS-W and in Figure 14 for the ULS-S. For each analysis performed, the most dominant crack is identified and plotted against the OP load for W1 in Figure 19 and for W2 in Figure 20. For the case where the OP load is critical (ULS-W), the most prolific maximum crack width is the tensile ‘Base 1’ crack, followed by the shear ‘Door’ crack, and in one instance of ADB W1 a tensile crack in the ‘Lintel’ dominates. In the IP load dominant cases, the widest cracks are located in ‘Base 2’, ‘Pier 2’, ‘Pier 4’ or one instance of the ‘Door’.
The crack damage classification used to provide context to the crack width results in these figures was developed by Watermeyer and Tromp (1992), as serviceability performance criteria for masonry walls, which were then incorporated in the NBR. In brief, the damage is broadly classified as either minor (crack widths up to 5 mm), or significant (over 5 mm, requiring significant repair). All cracks measured in the FE analyses fall below the 5 mm threshold, with the majority falling in the ‘negligible’ (<0.25 mm) and ‘very slight’ (<1.0 mm) damage bands. With further post-peak tracing of the walls’ responses, these crack widths would most certainly increase, however in most instances these initial cracks are sufficient to result in a marked reduction in load carrying capacity, typical of brittle masonry behaviour and demonstrating crack development.
Discussion
In most instances, divergence was the limiting factor in the analyses, which reduces the practicability of the proposed model. A number of measures were taken to overcome these points of divergence, including step size adjustment, more tolerant convergence criteria, alternate iterative procedures, etc., and the arc length method was consistently employed, but convergence could seldom be achieved. However, in most analyses it is clear from the load-displacement progression that the post linear-elastic region has been reached and that any stiffening of the global response beyond that point is unlikely. One exception is the results of the ADB analyses in which it is not always clear whether the linear-elastic region has been passed. However, considering the combination of deflection limits and required load resistance levels, it is clear that although failure as such is not achieved in most analyses, the required resistance level cannot be achieved within the deflection limits.
Prior to the analyses of this study, the expectation was that the resistance of the CON, and most likely the GEO, walls would exceed the design loads in both load cases, given the conventional range of strength and stiffness of these materials, and the deemed-to-satisfy wall configurations of the South African NBR. However, in most cases, the walls failed to resist the design loads, and by a large margin in the out-of-plane loading case due to wind (ULS-W). Possible sources for this failure can be categorised as the applied design load, the material parameters, the geometry of the walls and the boundary conditions.
Conclusion
Little to no validated FE modelling results are available for most AMU’s and the results presented in this paper contribute to this body of knowledge. Three specific AMU’s were selected and modelled in the context of South African low-income, government subsidised housing, under ULS wind and seismic actions. The following conclusions can be drawn from the reported results:
– The chosen simplified micro-modelling approach is suitable for the intended application of single-storey masonry wall analysis and sufficient constitutive material models exist for the description of the AMU materials.
– The input for the material parameters for the four selected materials (CON, GEO, CSE, ADB) can be determined reasonably well for the unit, unit crack interface and joint interface by way of experimental data, literature and best-fit to FEA results.
– Masonry walls consisting of AMU’s, representing a wide spectrum of strengths and stiffnesses, can be modelled using this FE approach with reasonable accuracy and the major failure mechanisms are well captured.
– The low-income housing walls modelled in this study, including the walls modelled with conventionally used concrete blocks, failed to resist the loads required by the South African loading code. These failures were observed without the inclusion of material partial safety factors.
– In accordance with recent assertions in literature that the OP unreinforced masonry behaviour cannot be overlooked in seismic design, the OP resistance of the modelled masonry walls was found to be inadequate, for the conventional CON masonry walls, as well as the three AMU walls.
– Bearing in mind the limited scope of wall configurations studied, these failures may point to underlying issues regarding the compatibility of the South African National Building Regulation’s deemed-to-satisfy wall layout provisions and the revised loading code. A review of these deemed-to-satisfy wall layout provisions is recommended.
– The computational cost experienced during the FE analyses justifies the chosen modelling simplification of isolated walls instead of entire houses.
Footnotes
Declaration of conflicting interests
The author(s) declared no potential conflicts of interest with respect to the research, authorship, and/or publication of this article.
Funding
The author(s) disclosed receipt of the following financial support for the research, authorship, and/or publication of this article: This work was supported by the National Research Foundation of South Africa (grant numbers 87,961, 106,965).