
Abstract
Although the wind barrier was set near the bridge tower, more than 10 traffic accidents under crosswinds happen in the bridge tower area within 1 month of the opening operation of a cross-sea bridge. To investigate the wind shielding effect of the bridge tower, a field measurement scheme of wind-vehicle-bridge system, which is a step-by-step test method, was presented and performed on a long span cable-stayed bridge. Firstly, the horizontal profile of wind speed of bridge deck near bridge tower was obtained through the anemometers. Then, the dynamic response of the bridge was measured under the action of normal operating vehicle when the natural wind speed is low. Finally, the response of the moving car was measured when passing through bridge tower, and the wind speed was recorded simultaneously. The results show that the wind-vehicle-bridge system can be tested by step-by-step test method to understand the wind shielding effect of bridge tower. The displacement response of the bridge is still very small when two large trucks meet, and the coupling effect between the vehicle and the bridge is insignificant when a single car passes through the bridge tower. Due to a large porosity of the anti-collision guardrail, the wind speed at the height of 1 m from the bridge deck has changed dramatically when the car leaves the bridge tower on the windward and entering or leaving the bridge tower on the leeward. Among them, the leeward side change is more obvious, and the response of the leeward side vehicle is also greater. The suitable decrease of the anti-collision guardrail porosity in the bridge tower region will improve the running safety of vehicles.
Introductions
With the development of economy, more and more long-span bridges have been built in wind-prone areas, and the driving safety of vehicles running on bridge under strong crosswind has attracted more and more attention. To meet the needs of navigation, the main girder of long-span bridges is usually higher than the ground and the wind speed of the bridge deck is always large. In addition, the bridge tower of the long-span bridge is relatively wide, and the wind filed near the bridge tower exhibits a significant variation due to the wind shielding effect of the bridge tower. As a result, the aerodynamic wind loads exerted on the vehicle when vehicles are passing through the bridge tower may be subjected to sudden changes (Zhang et al., 2015). This phenomenon may cause the deviation of the vehicle route or the occurrence of roll and sideslip, which may lead to the occurrence of traffic accidents in serious cases. There are many reports of such accidents (Chen and Cai, 2004; Sigbjoernsson and Snaebjoernsson, 1998; Snaebjoernsson et al., 2007). For example, in August 2004, seven normal trucks on the Humen Bridge in Guangdong Province of China were overturned by the gale, resulting in the emergency closure of the bridge, which not only caused economic losses but also had a huge social impact. Although the wind barrier was set near the bridge tower (see Figure 1), more than 10 traffic accidents under crosswinds happen in the bridge tower area within 1 month of the opening operation of a cross-sea bridge. Thus, it is of critical importance to study the wind shielding effect of bridge tower on the vehicle driving safety when running on the bridge. Bridge overview.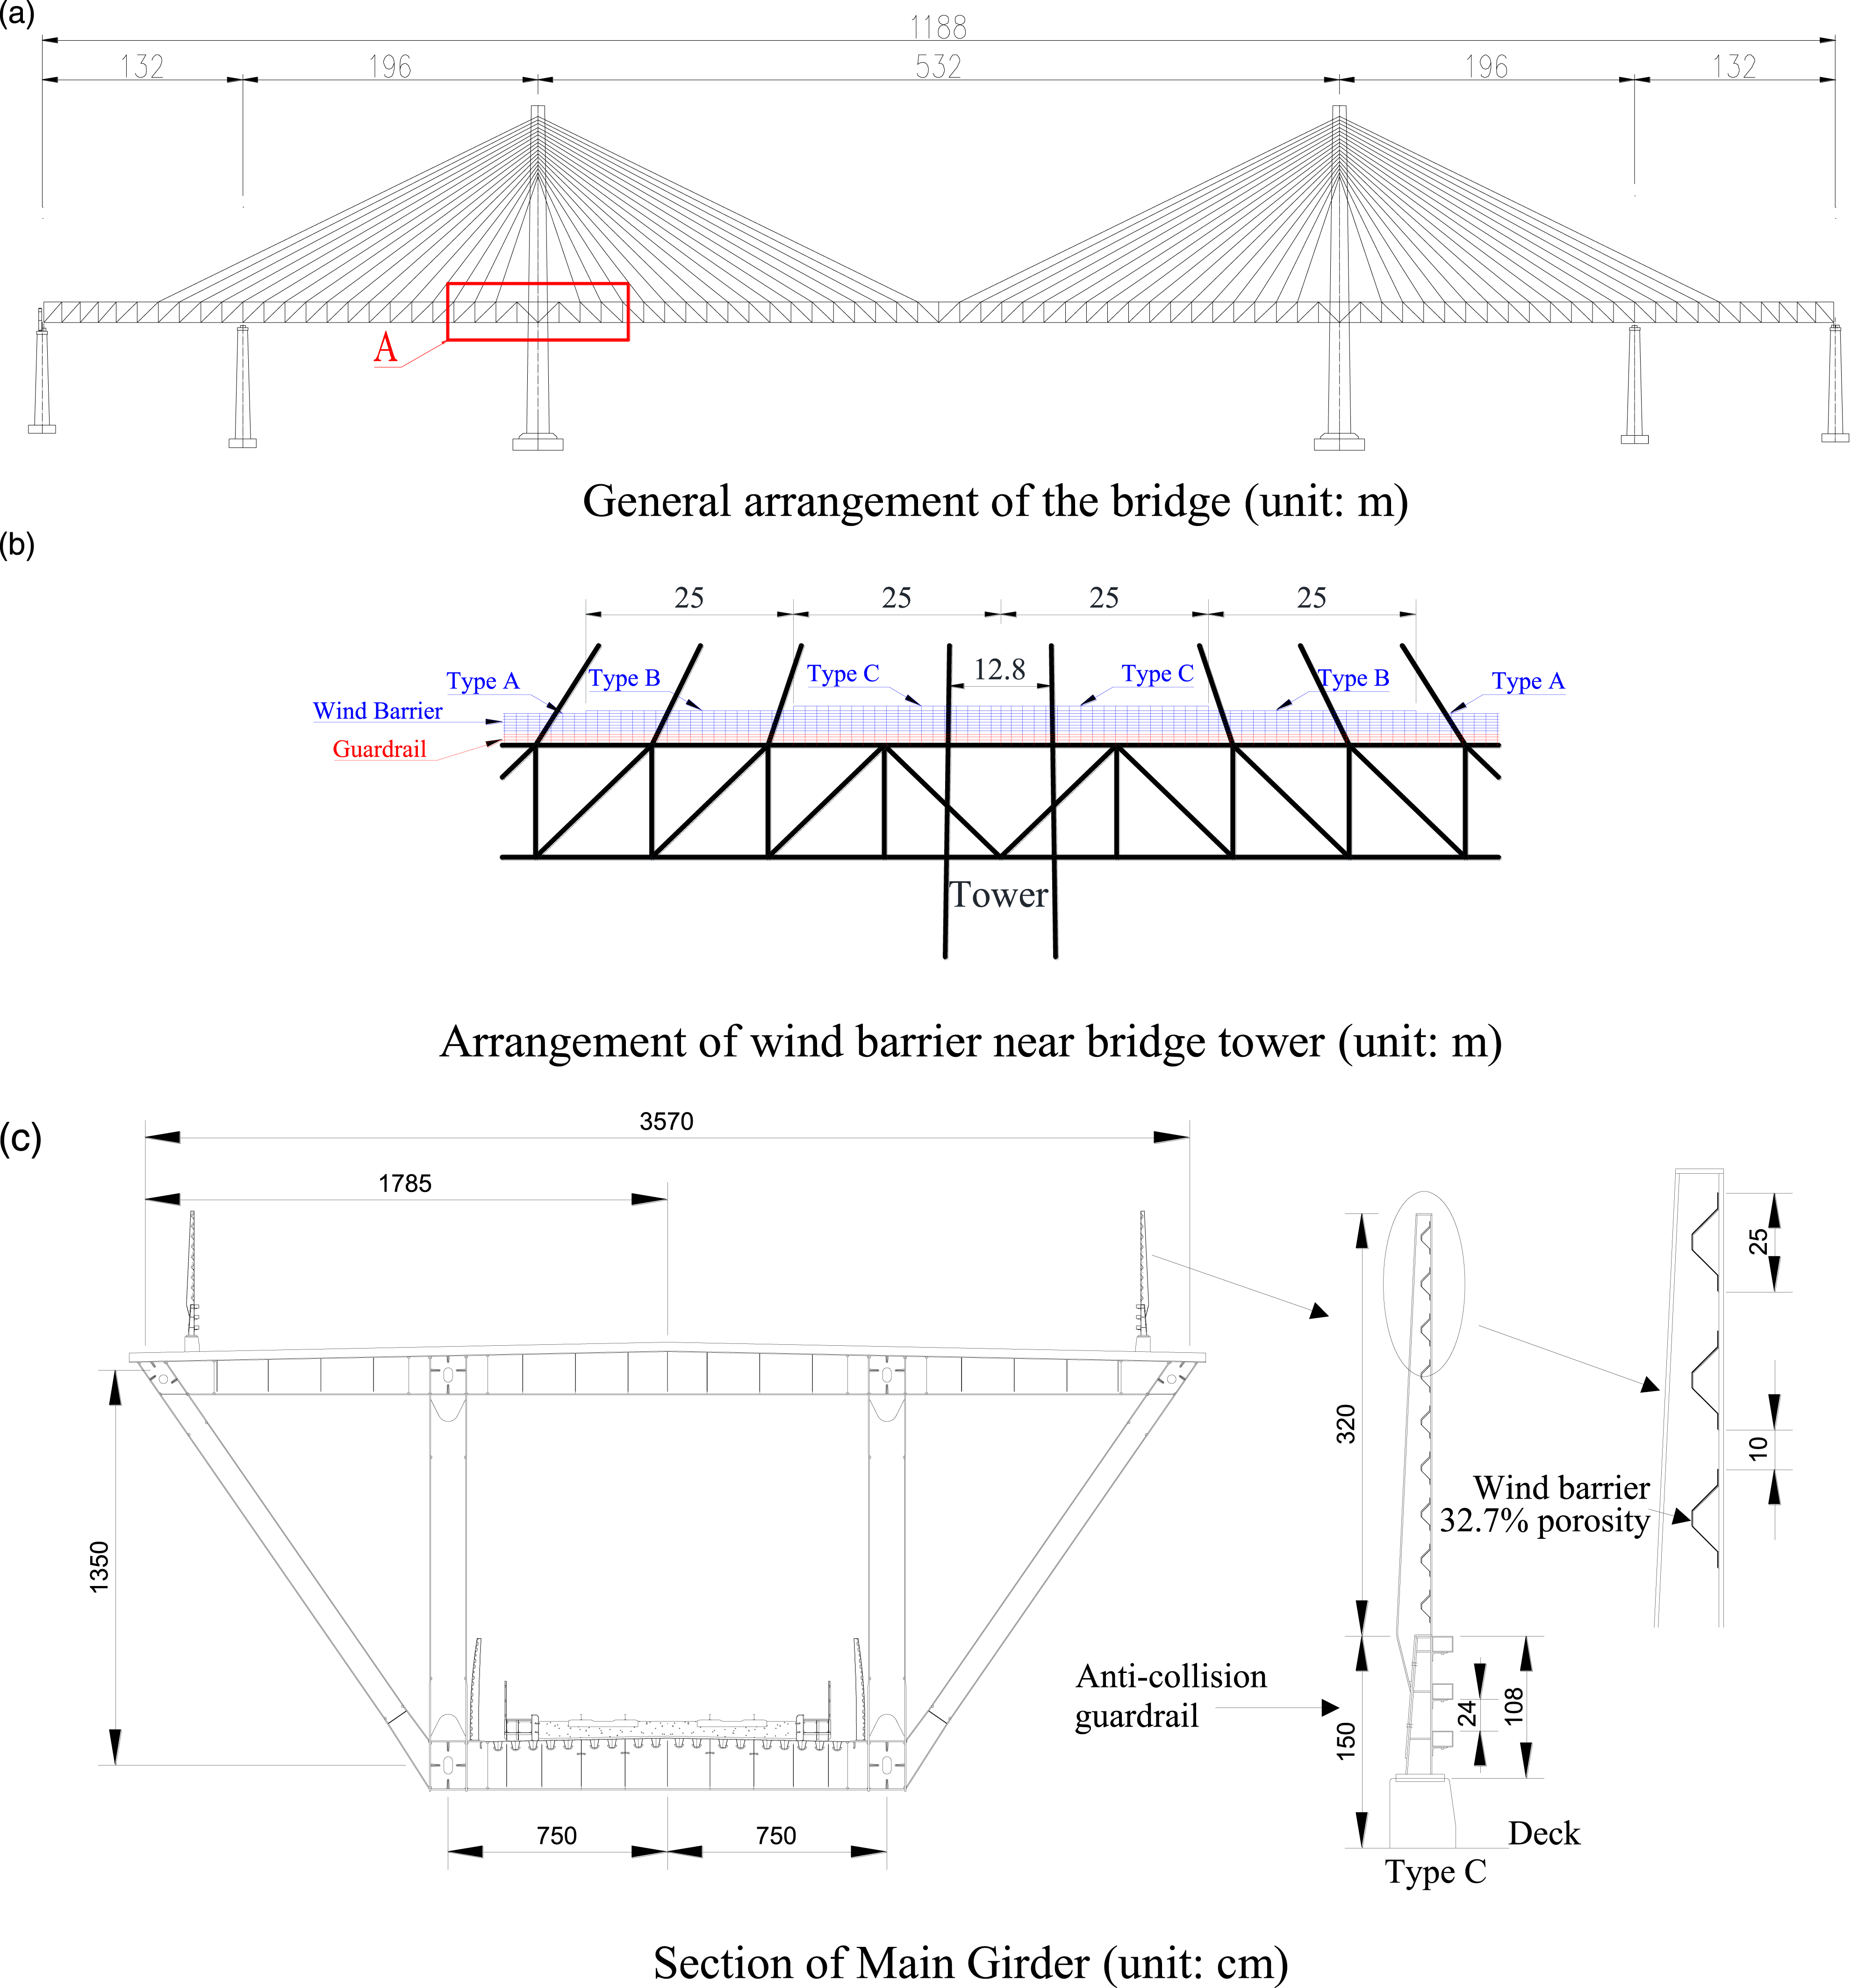
In general, several approaches can be adopted to study the wind shielding effects of bridge tower, namely, the CFD simulation (Liu et al., 2020), wind tunnel test (He et al., 2020) and coupling vibration methods of wind-vehicle-bridge system (Xiang et al., 2014). The studies are mainly focused on the wind field distribution near the bridge tower, the aerodynamic wind load acted on vehicles and the vehicle dynamic response.
For numerical simulation, Wu et al. (2017) simulated the aerodynamic loads of the train when passing through the bridge tower. Wang and Xu (2015) obtained the time-varying aerodynamic coefficients of road vehicles passing through the bridge tower by computational fluid dynamics (CFD), and analyzed them via the wind-vehicle-bridge coupling system. Salati et al. (2018) used CFD to study the aerodynamic changes of heavy trucks passing through the wake area of bridge tower under crosswind. Wang et al. (2014) used the moving grid method to simulate the aerodynamic force of the vehicle passing through the bridge tower area. Their results found that the aerodynamic load of the vehicle when passing through the bridge tower would experience sudden change duo the wind shielding effect of the bridge tower.
For wind tunnel test, Argentini et al. (2011) used wind tunnel test to study the aerodynamic characteristics of long vehicles passing through the bridge tower under crosswinds, and the effect of wind barriers on the aerodynamic characteristics was discussed as well. Sabbioni et al. (2012) studied the aerodynamic forces of a large truck in the wake of a bridge tower by wind tunnel test. The static model cannot simulate the relative movement between vehicle and bridge, some people (Charuvisit et al., 2004a; 2004b) studied the aerodynamic characteristics of moving vehicles with a maximum speed of 3 m/s passing through the bridge tower area under crosswind with different wind speeds and directions, vehicle types, bridge tower types and wind barriers. Li et al. (2013) used the moving vehicle model with a maximum speed of 10 m/s to measure the aerodynamic coefficients of road vehicle and rail vehicle passing through the bridge tower at different wind speeds, vehicle speeds and positions. Their results indicated that the aerodynamic coefficients of vehicles would change suddenly, and the influence of wind load change on the road vehicle was more obvious than that on the rail vehicle. In addition, the wind barrier near the bridge tower may change the direction of the lateral force on the vehicle.
In addition to the wind distribution and vehicle aerodynamic force and moment, many efforts have also been devoted to investigate the wind shielding effects on the vehicle dynamic responses. Zhang et al. (2015) conducted the coupled vibration analysis of wind-vehicle-bridge considering the wind shielding effect of bridge tower, and found that the pylon had a significant impact on the lateral response of vehicles. However, the dynamic response of the bridge has insignificant influence on the dynamic response of vehicles passing through the bridge tower. A result shows that although the lateral acceleration time history curve of the vehicle body would change significantly, the wind shielding effect of bridge tower is not a controlling factor for the wind-vehicle-bridge system (Li et al., 2010). The length of a train truck is usually greater than the width of the pylon, and the wind shielding effect of bridge tower on train’s response is smaller than that of track irregularities, but the size of car is usually close to or less than the width of pylon. Wang et al. (2021) studied the dynamic response of a car passing through the bridge tower under crosswind by using multi-body dynamics, but the driver’s behavior was neglected. Rocchi et al. (2012) studied the influence of the wake of bridge tower effect on the driving safety of high-wing vehicles, and the vehicle-driver response was simulated. Yu et al. (2019) established a closed-loop numerical model of driver-vehicle-crosswind (DVC), and the result shows that there is a possibility that the car could overturn or sideslip.
The aforementioned studies have revealed the shielding effect of bridge tower. However, the fluctuating wind on bridge deck has an obvious difference with incoming flow, and it is difficult to consider the effect of fluctuating wind on bridge deck in the coupling vibration method. The even incoming flow usually used in the methods of CFD and wind tunnel test, but the wind speed along the bridge may be uneven in practice. Meanwhile, the simulation of the porous wind barrier in scale model or numerical model needs to be simplified by equal porosity, and it is difficult to satisfy the similarity criterion of small hole of porous wind barrier. The field measurement method can avoid above problem. There are many researches (Mao et al., 2020) regarding the wind characteristic and dynamic response of bridges via field measurements, but the field measurement of wind characteristics and vehicle dynamic response near the bridge tower is rare.
When the vehicle passed the bridge tower with a high speed, the test of vehicle response required a higher sampling frequency because the vehicle has a high vibration frequency, but the ultrasonic anemometer has only 10 Hz. Meanwhile, the uneven wind field around bridge tower and the movement of vehicle will lead the difficult of the synchronize tests of wind-vehicle-bridge system. In this work, to comprehensive understand the wind shielding effect of bridge tower, and field measurement scheme, which is a step-by-step test method, is proposed to test the wind-vehicle-bridge system. The wind environment, bridge response and dynamic response of a vehicle passing through the bridge tower are measured. In the first section, the measurement methods of wind field, dynamic response of vehicle and bridge are presented. The next section introduces the data processing method. In the last section, the measurement results are discussed.
Measurement methods
The wind-vehicle-bridge system is a coupled dynamic system. As a result, it is difficult to measure the wind field, the vehicle dynamic response and the bridge response simultaneously because of the high speed of the vehicle and the short time during when vehicle passes through the bridge tower. Because the prototype bridge in the present study has been opened to public, the wind speed field, the vehicle response and the bridge response are measured separately.
Engineering overview
The prototype bridge is a long span cable-stayed bridge, which is a main navigable bridge of a sea-crossing bridge and has a span arrangement of (132 + 196 + 532 + 196 + 132) m, as shown in Figure 1(a). The longitudinal size of the tower column increases linearly from 9 m at the top to 14.4 m at the bottom, where the width of the highway bridge deck is 12.8 m, as shown in Figure 1(b). The main girder adopts N-shaped truss, which is 13.5 m high. The upper layer is 35.7 m wide of bidirectional six-lane highway, and the lower layer is a double-track railway.
The bridge is equipped with perforated strip wind barriers, which is composed of two parts. The lower part is the anti-collision guardrail with a porosity of 66.7% and a height of 1.5 m. The other part installed on the railing is the wind barrier, which is heightened in the bridge tower area. And it has a porosity of 32.7 % and an interval of 10 cm. As shown in Figures 1(b) and 2(b), the wind barrier is divided into three categories according to the height: type A is 2.5 m high, type B is 2.85 m high, and type C is 3.2 m high. Type B and type C are suitable for 50 m ranges on both sides of the main tower. The main tower is arranged in cascade from high to low, and type A is arranged in other ranges, as shown in Figure 1(b). Anemometer tower.
Wind field
The measurement equipment consists of two movable anemometer towers with a height of 5 m. One anemometer tower, equipped with a R. M. Young 81000 three-dimensional ultrasonic anemometer at a height of 5 m, was placed at a fixed position on the bridge deck as a reference tower for wind environment measurement (see Figure 2(a)). This tower was used to measure the wind speed time history at the fixed point. The other movable wind tower (see Figure 2(b)) was equipped with a R. M. Young 05103 propeller mechanical anemometers at every 1 m a height of 1∼5 m, and a total of 5 anemometers were arranged. A three-dimensional ultrasonic anemometer was also arranged at a height of 5 m. The tower was used to measure the wind speed time histories at different transverse positions, different longitudinal positions and different heights of the bridge deck. The anemometer was calibrated in advance. Meanwhile, the measured data of the three-dimensional ultrasonic anemometer and the propeller at the top of the movable tower were compared to verify the test results.
Since the bridge has been opened and operated, the field measurement is conducted without interrupting the traffic. The lane on one side cannot be completely closed, and all the lanes cannot be closed at night. The instrument must be removed after the measurement is completed on the same day. In order to reduce the influence caused by the installation position of the instrument and the position of the measuring point, the instrument and the bracket were glued together with a waterproof tape after the instrument was installed on the first day. When the instrument was disassembled, the tape was cut off at the position of the connection joint between the instrument and the bracket as the calibration position of the instrument. Similar treatment methods were used between the tower and the base. The test tower base was made of 1 m
In view of the fact that the strong wind season was being treated during the field measurement period, the daily wind duration was long and relatively stable. As such, the time duration of wind speed measurement at each measuring point lasted for 20 min. In total, 17 wind field measuring points were set in the windward side lane (see Figure 3(a)), 18 wind field measuring points were set in the leeward side lane (see Figure 3(b)), and each lane was tested one day. During the test, each anemometer was collected synchronously. The sampling frequency of propeller mechanical anemometer was 1 Hz, and that of ultrasonic anemometer was 10 Hz. Due to the limitation of conditions, the reference point on the windward side could not be used when testing the wind field distribution on the leeward side. Considering the influence of wind direction and bridge tower, the position of the reference anemometer tower was adjusted when testing the wind field distribution on the leeward side, as shown in Figure 3(b). Layout of measuring points of wind field (m).
Bridge dynamic response
To measure the response of the bridge under the action of normal operating vehicles, five measuring points were set along the longitudinal direction of the bridge, with the arrangement shown in Figure 4. As shown in Figure 4, assuming the x coordinate of the bridge mid-span is 0, the x coordinates of all five measuring points are x = 0 m, 28 m, 42 m, 84 m, 98 m, 140 m, respectively. A three-axis accelerometer was installed on each measuring point, and the test frequency was set to 200 Hz. These accelerometers are WILOW® AX-3D high-precision accelerometers manufactured by Beanair, Germany, with measurement ranges of ± 2g or ± 10g.And the frequency range of these accelerometers is 1∼2000 Hz. The passing of the vehicle was observed and recorded during the measurement. At the same time, the wind speed reference tower introduced in the previous section (see Figure 3(a)) was kept still, in order to record the incoming flow wind speed in real time. In addition, in order to keep focusing on the vibration of the bridge under the action of vehicles, the weather with relatively small wind speed was selected in the test of bridge response. The arrangement of acceleration sensors for measuring the bridge response (m).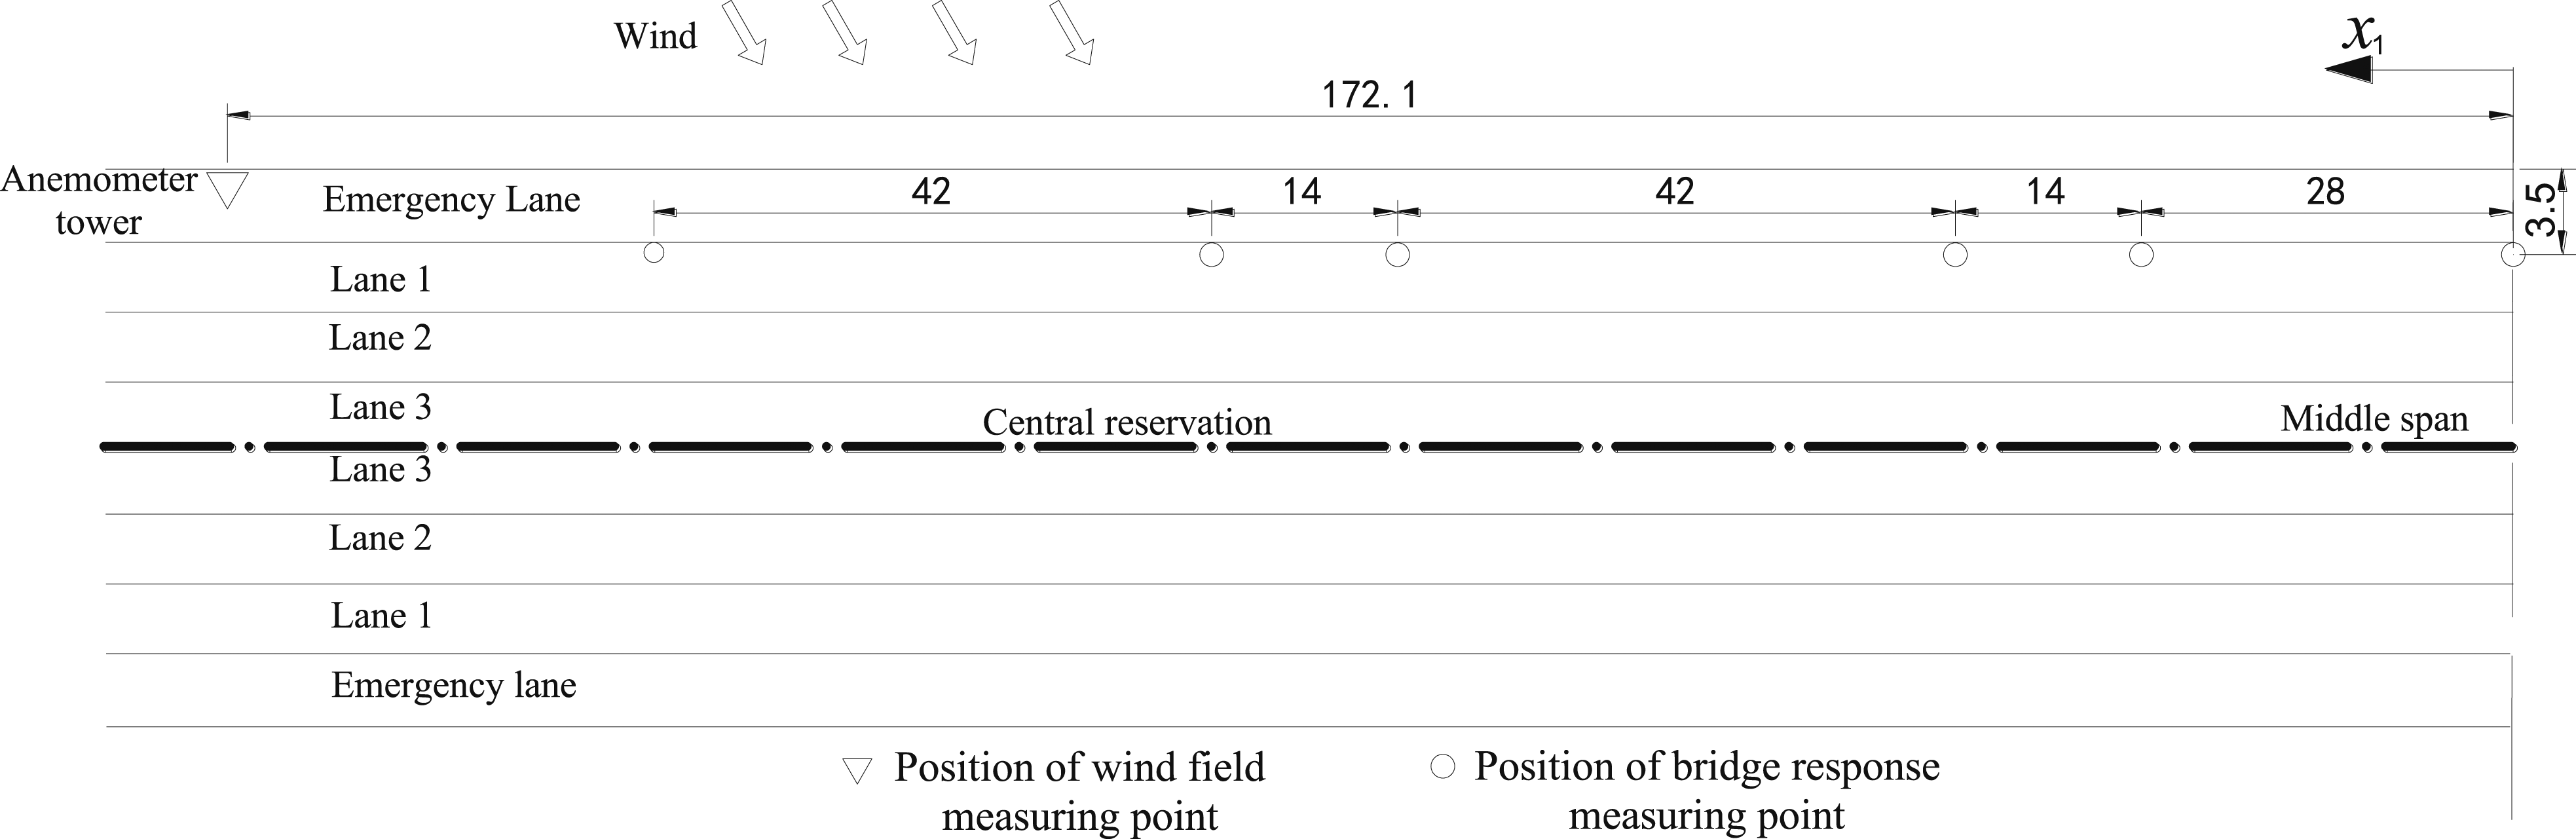
Vehicle dynamic response
It is impossible to record the dynamic response of all types of vehicles since there are various types of vehicles in the daily traffic crossing the bridge. According to the survey on the drivers, three types of vehicles, i.e., cars, Sport Utility Vehicles, pickup trucks, could experience a large-amplitude vibration when passing through the bridge towers. In view of this and considering that the air permeability of the bridge deck railing is large, the car with lower chassis was finally selected as the representative vehicle for the test. The test vehicle was Toyota Camry, and the model type was GTM7251GB produced in 2014. By the time of the test, the mileage of the car is 64,000 kilometers. In addition, the vehicle is 4.825 m long, 1.825 m wide and 1.48 m high.
To record the vehicle dynamic response, three accelerometers (WILOW® AX-3D) were installed on the vehicle as shown in Figure 5(a). The layout of the sensors is shown in Figure 5(b) and (c). Before the test, the instrument was zeroed and the sampling frequency was set to 2000 Hz. Before the vehicle moves, the vibration acceleration of the vehicle body in the extinguished state and the stop state after ignition start were tested. The purpose is to study the magnitude of the vibration of the vehicle itself and compare it with the response of the vehicle as it passes through the tower area. Schematic diagram of the acceleration sensors in Car (mm).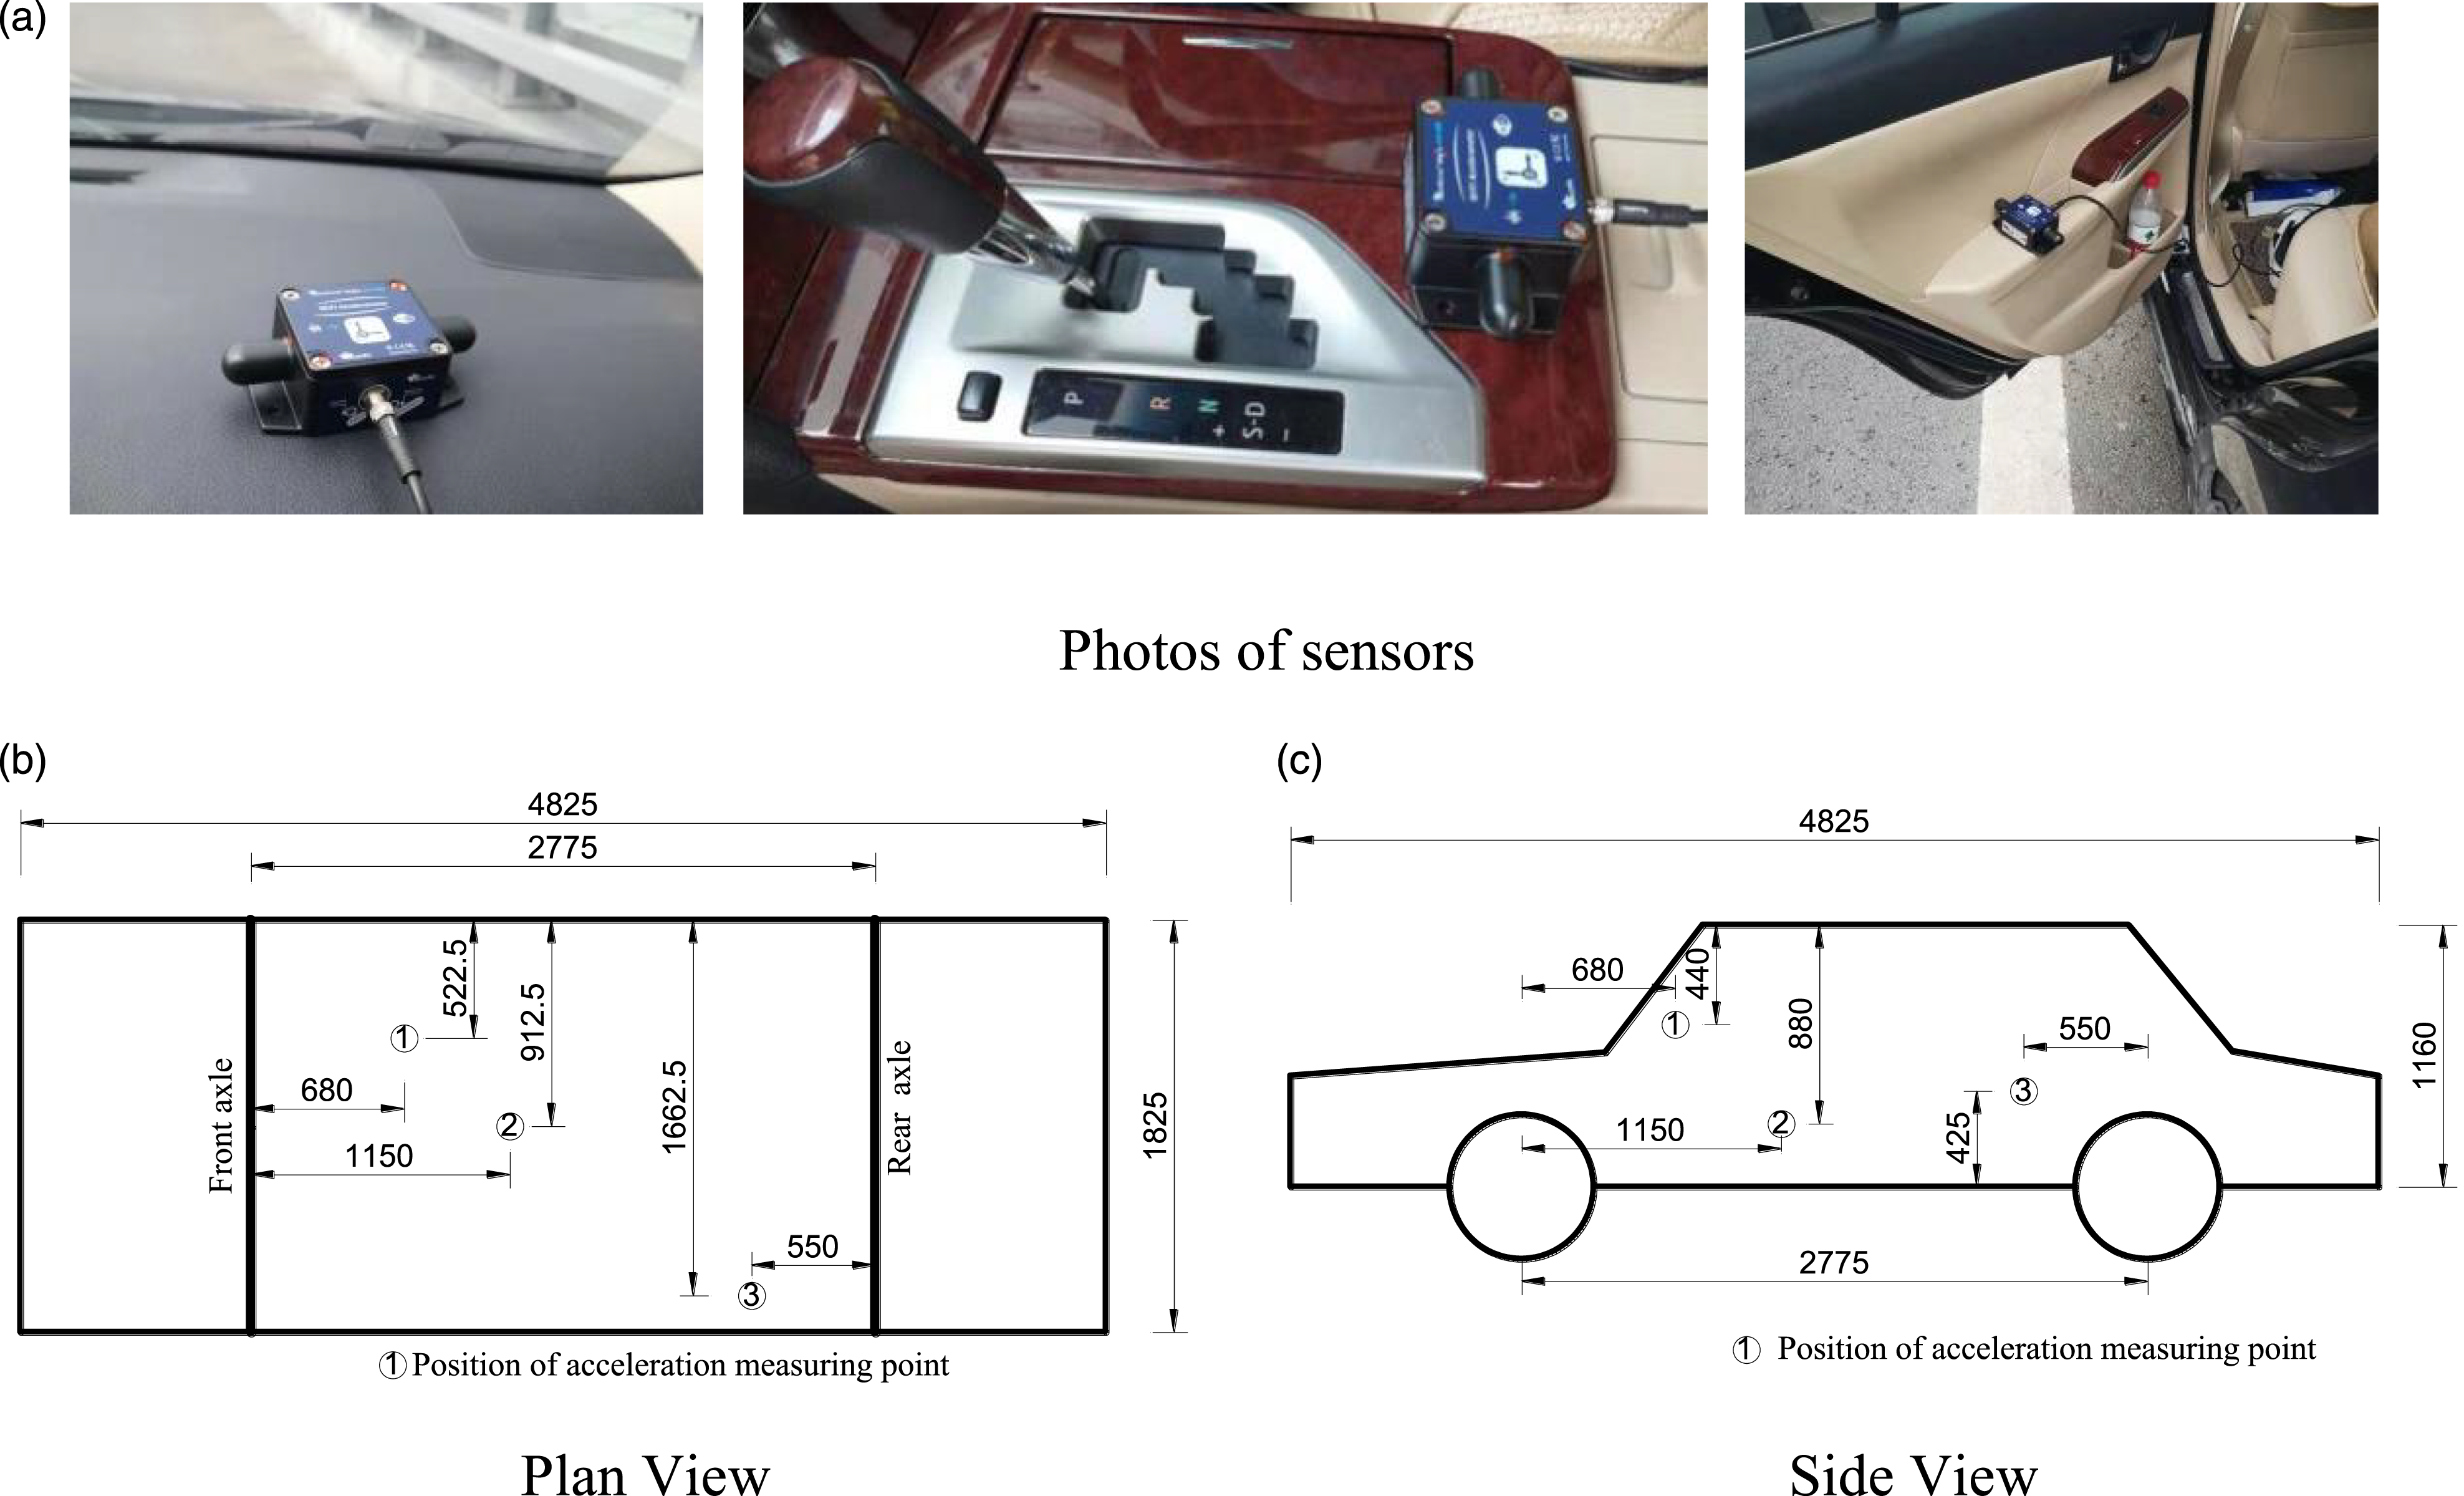
The dynamic response of the car when passing through bridge tower area during the test was recorded by the installed sensors. When the vehicle response on the windward side was tested, the vehicle started to accelerate at about 200 m from the bridge tower. It passed through the bridge tower when the vehicle speed was stable, and then slowed down immediately after passing through the bridge tower. After that, the car was reversed to the starting point. During the test on the leeward side, because the lane was not closed and a large number of vehicles passed, the test required driving from the toll station entrance into the bridge. While the vehicle will approach to the bridge tower, the vehicle speed was reduced to about 60 km/h, and accelerated to about 100 km/h when it was about 100 m away from the bridge tower, and passed the bridge tower at a relatively stable speed. After the vehicle passes through the bridge tower area, data acquisition is stop. The purpose is to judge the approximate time better when the vehicle enters and exits the bridge tower area for data processing. At the same time, the wind speed reference tower in windward (see Figure 3(a)) was recorded, and the times of arrival and departure from the pylon were recorded. The test was carried out two times on the windward side and the leeward side respectively.
Data processing
Data processing is divided into two parts: one is the bridge tower wind environment test results, the other is the bridge and vehicle acceleration response. The average wind speed and wind direction of natural wind are random. When the wind field test data are processed, the average and dimensionless processing are carried out respectively. The test data are averaged at a time interval of 1 min and divided by the reference tower test wind speed, and the wind speed coefficient is obtained, as shown in equation (1)
The 0° direction of wind direction measured by propeller anemometer is in the south direction, and the angle between the bridge direction and the south direction is 20°. According to the measured wind direction angle θ, the θa between the wind direction and the direction along the bridge is calculated, namely θa = θ-20°. The wind speed Ua (t), measured by propeller anemometer is projected to the transverse bridge direction, and the transverse bridge wind speed U0 of each measuring point can be obtained.

Three-dimensional ultrasonic anemometer measured three data: Uu (t), Uv (t), Uw (t), which represent the wind speed in the north, east and vertical direction respectively. Synthesis of horizontal Uu (t) and Uv (t) into U1 (Figure 6), Three - dimensional wind data processing diagram.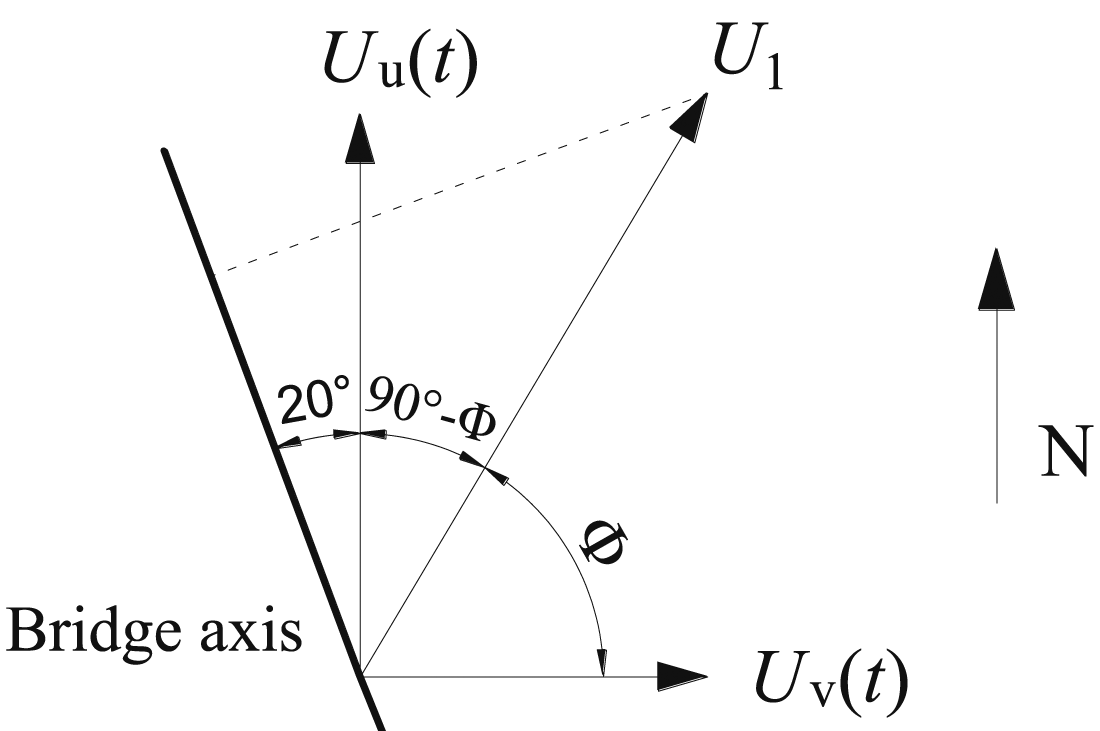
Define
By projecting U1 at the reference tower position to the cross-bridge direction according to the trigonometric function relationship through

When the bridge response test results were processed, the transverse and vertical acceleration of each measuring point were processed by Fast Fourier Transform (FFT) low-pass filtering, and the filtering frequency was 20 Hz. In addition, the acceleration of each measuring point was quadratically integrated, at the same time, the time-history response curves of transverse and vertical displacement at each measuring point were obtained. The integral method used in this paper is the frequency domain integral method verified by Pang et al. (2021). According to Jiang et al. (2009), the minimum cut-off frequency of integral is 2 Hz. And the maximum cut-off frequency is 20 Hz which is the same as the acceleration filter frequency.
The acceleration data measured in the non-moving state after starting the test vehicle engine were processed, the transverse and vertical acceleration response curves were drawn. Since there was an acceleration and a deceleration process before and after the vehicle passed the bridge tower, according to the acceleration response curve along the bridge direction, when the vehicle passed the bridge tower area, the approximate time interval when the vehicle passed the bridge tower can be obtained. After that, the lateral and vertical acceleration responses of the vehicle in this time interval and the wind speed at the reference tower of the wind field test can be obtained.
Results and discussions
Wind field distribution
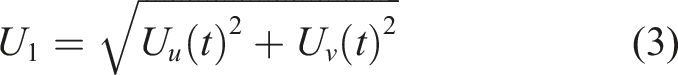
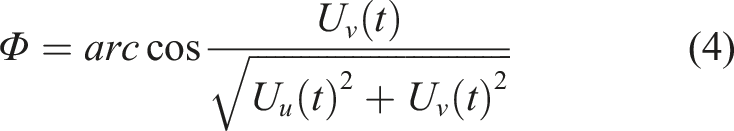
Figure 7(a) shows the average wind speed coefficient Wind speed coefficient.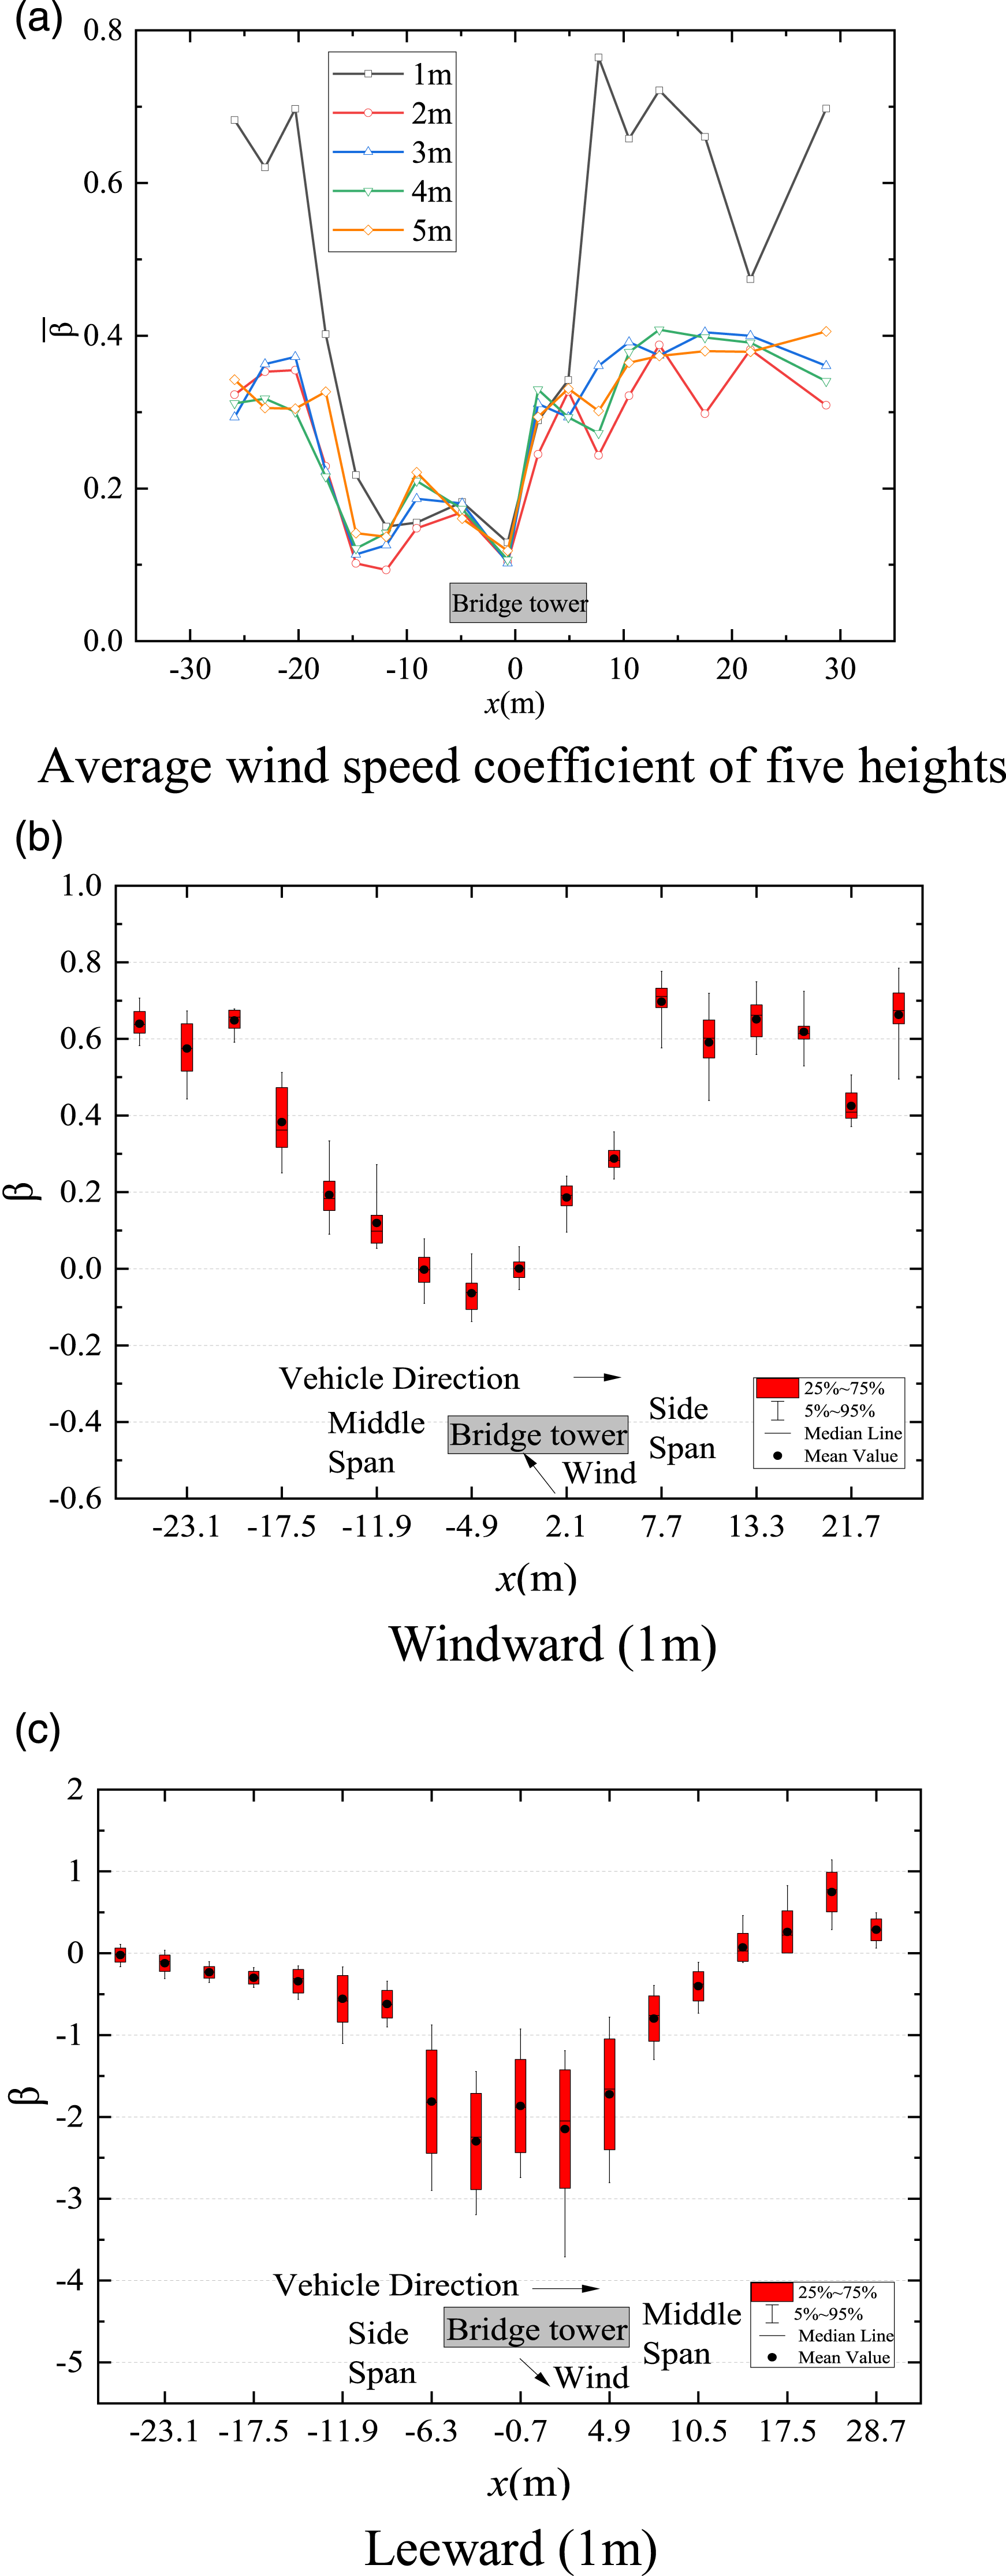
And combined with the measured vehicle height, the wind speed at the height of 1 m on the windward side and leeward side were analyzed, and the wind speed coefficient
From Figure 7(b), the wind speed distribution is asymmetric on both sides of the central line of the bridge tower, which indicated that the inflow wind has a certain bias angle. At that time, the wind deflection angle at the reference tower was 7.98°, which indicated that the wind direction along the axis of the bridge was different. Along the direction of bridge axis, the wind speed coefficient began to decrease at x = −17.5 m. At x = −4.9 m, the mean value of wind speed coefficient becomes negative. Until x = −0.7 m, the flow around disappears, and then the wind speed coefficient increases gradually and becomes stable at x = 7.7 m. This area is in the wake of the bridge tower. It can also be seen from the diagram that the median line is close to the mean value, and the variation of wind speed coefficient is relatively stable in the 25 % ∼75 % quantile range. And while entering the side span from the bridge tower, the wind speed suddenly increases. At this point, the mean wind speed coefficient changes from 0.34 to 0.76, which is unfavorable to traffic safety. In addition, the reason for the low wind speed at x = 21.7 m is that there is an anchor block of in front of this point.
From Figure 7(c), the wind speed coefficient of the leeward is negative from the first measuring point, which are in the flow around the bridge structure. At x = −9.1 m, the wind speed coefficient begins to decrease obviously, its average increases from −0.62 to −1.81. At x = 7.7 m, the average wind speed coefficient suddenly decreases from −1.72 to −0.79 In the range of x = −6.3 m ∼ 4.9 m, the average wind speed coefficient is −1.97, but the variation of wind speed coefficient is not stable in the 25 % ∼75 % quantile range. The fluctuation of wind speed coefficient in this region is large, but the fluctuation of wind speed coefficient in other locations is small. This indicates that a large wind speed mutation may occur when the vehicle enters and leaves this interval, which is unfavorable to traffic safety.
Bridge response
The bridge response in the context of vehicle-bridge vibration is discussed in this section. Figure 8 shows the acceleration and displacement time histories in transverse direction at the midspan of the bridge. The measuring point is located in lane 1, and is 3.5 m from the railing, as shown in Figure 4. Figure 9 displays the vertical acceleration and displacement responses of the bridge at the same position. During the test, the incoming wind speed was relatively stable, and the cross-wind speed ranges from 4.0 m/s to 6.5 m/s, with an average wind speed of 5.43 m/s. In addition, there was no high-speed rail passing on the lower deck during the test. Lateral responses of bridge: (a) Accl. (x1 = 0 m); (b) Disp. (x1 = 0 m). Vertical responses of bridge: (a) Accl. ( x1 = 0 m); (b) Accl. ( x1 = 84 m); (c) Accl. ( x1 = 98 m); (d) Disp. ( x1 = 0 m).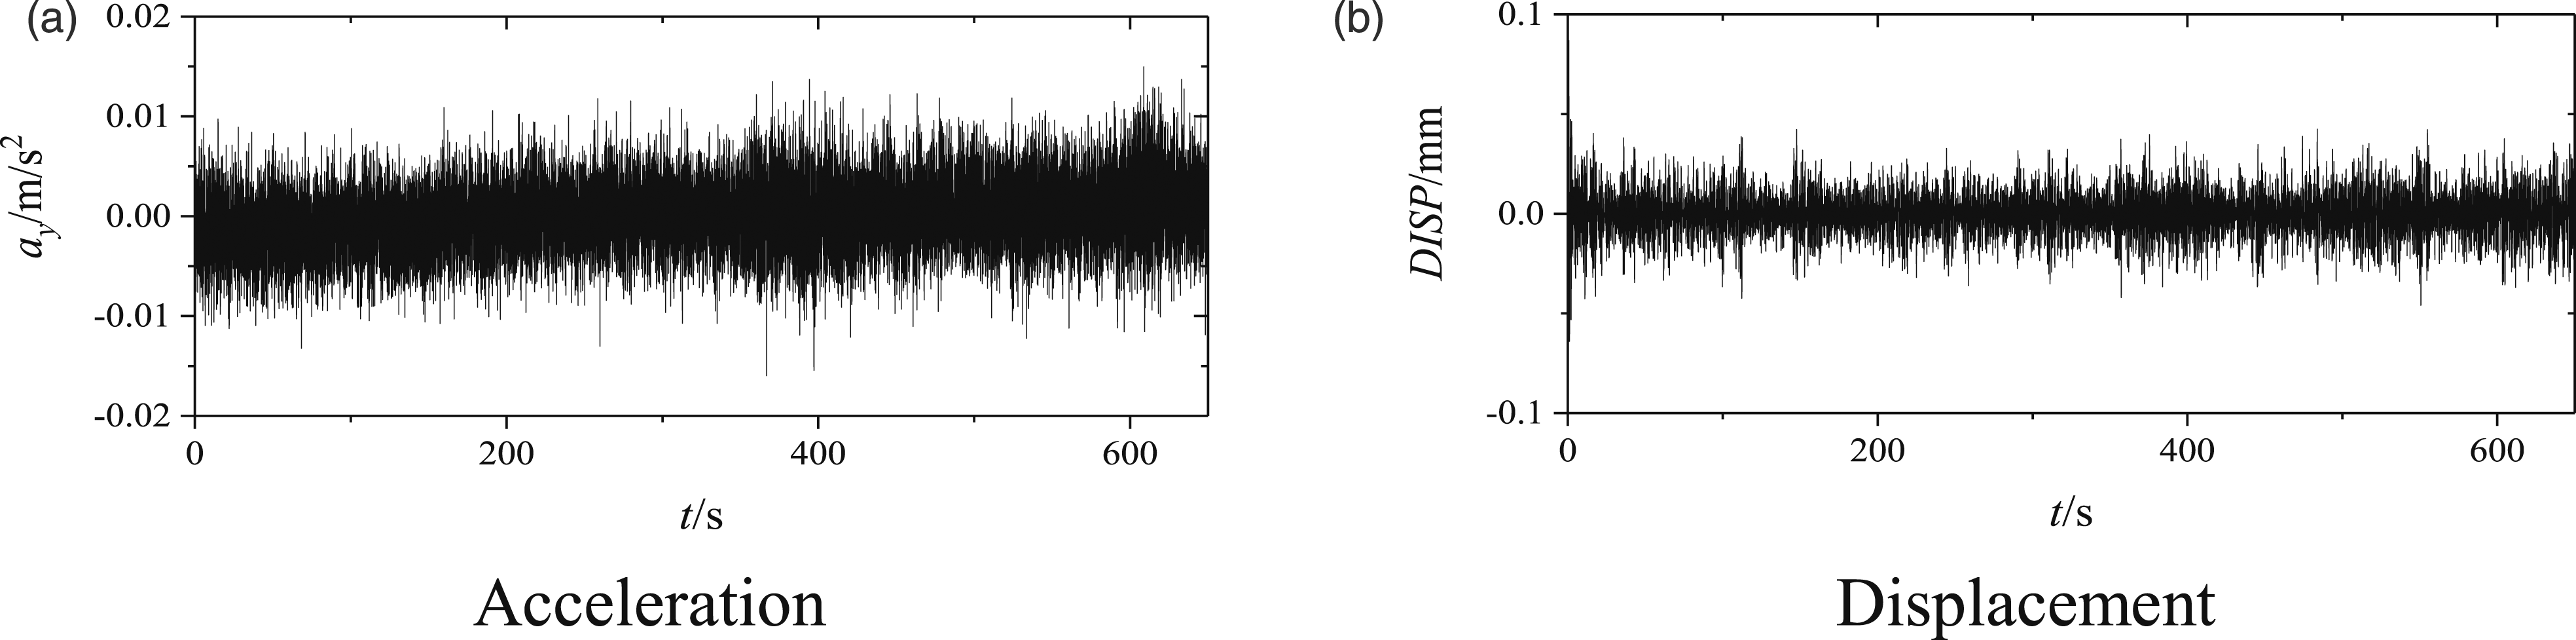
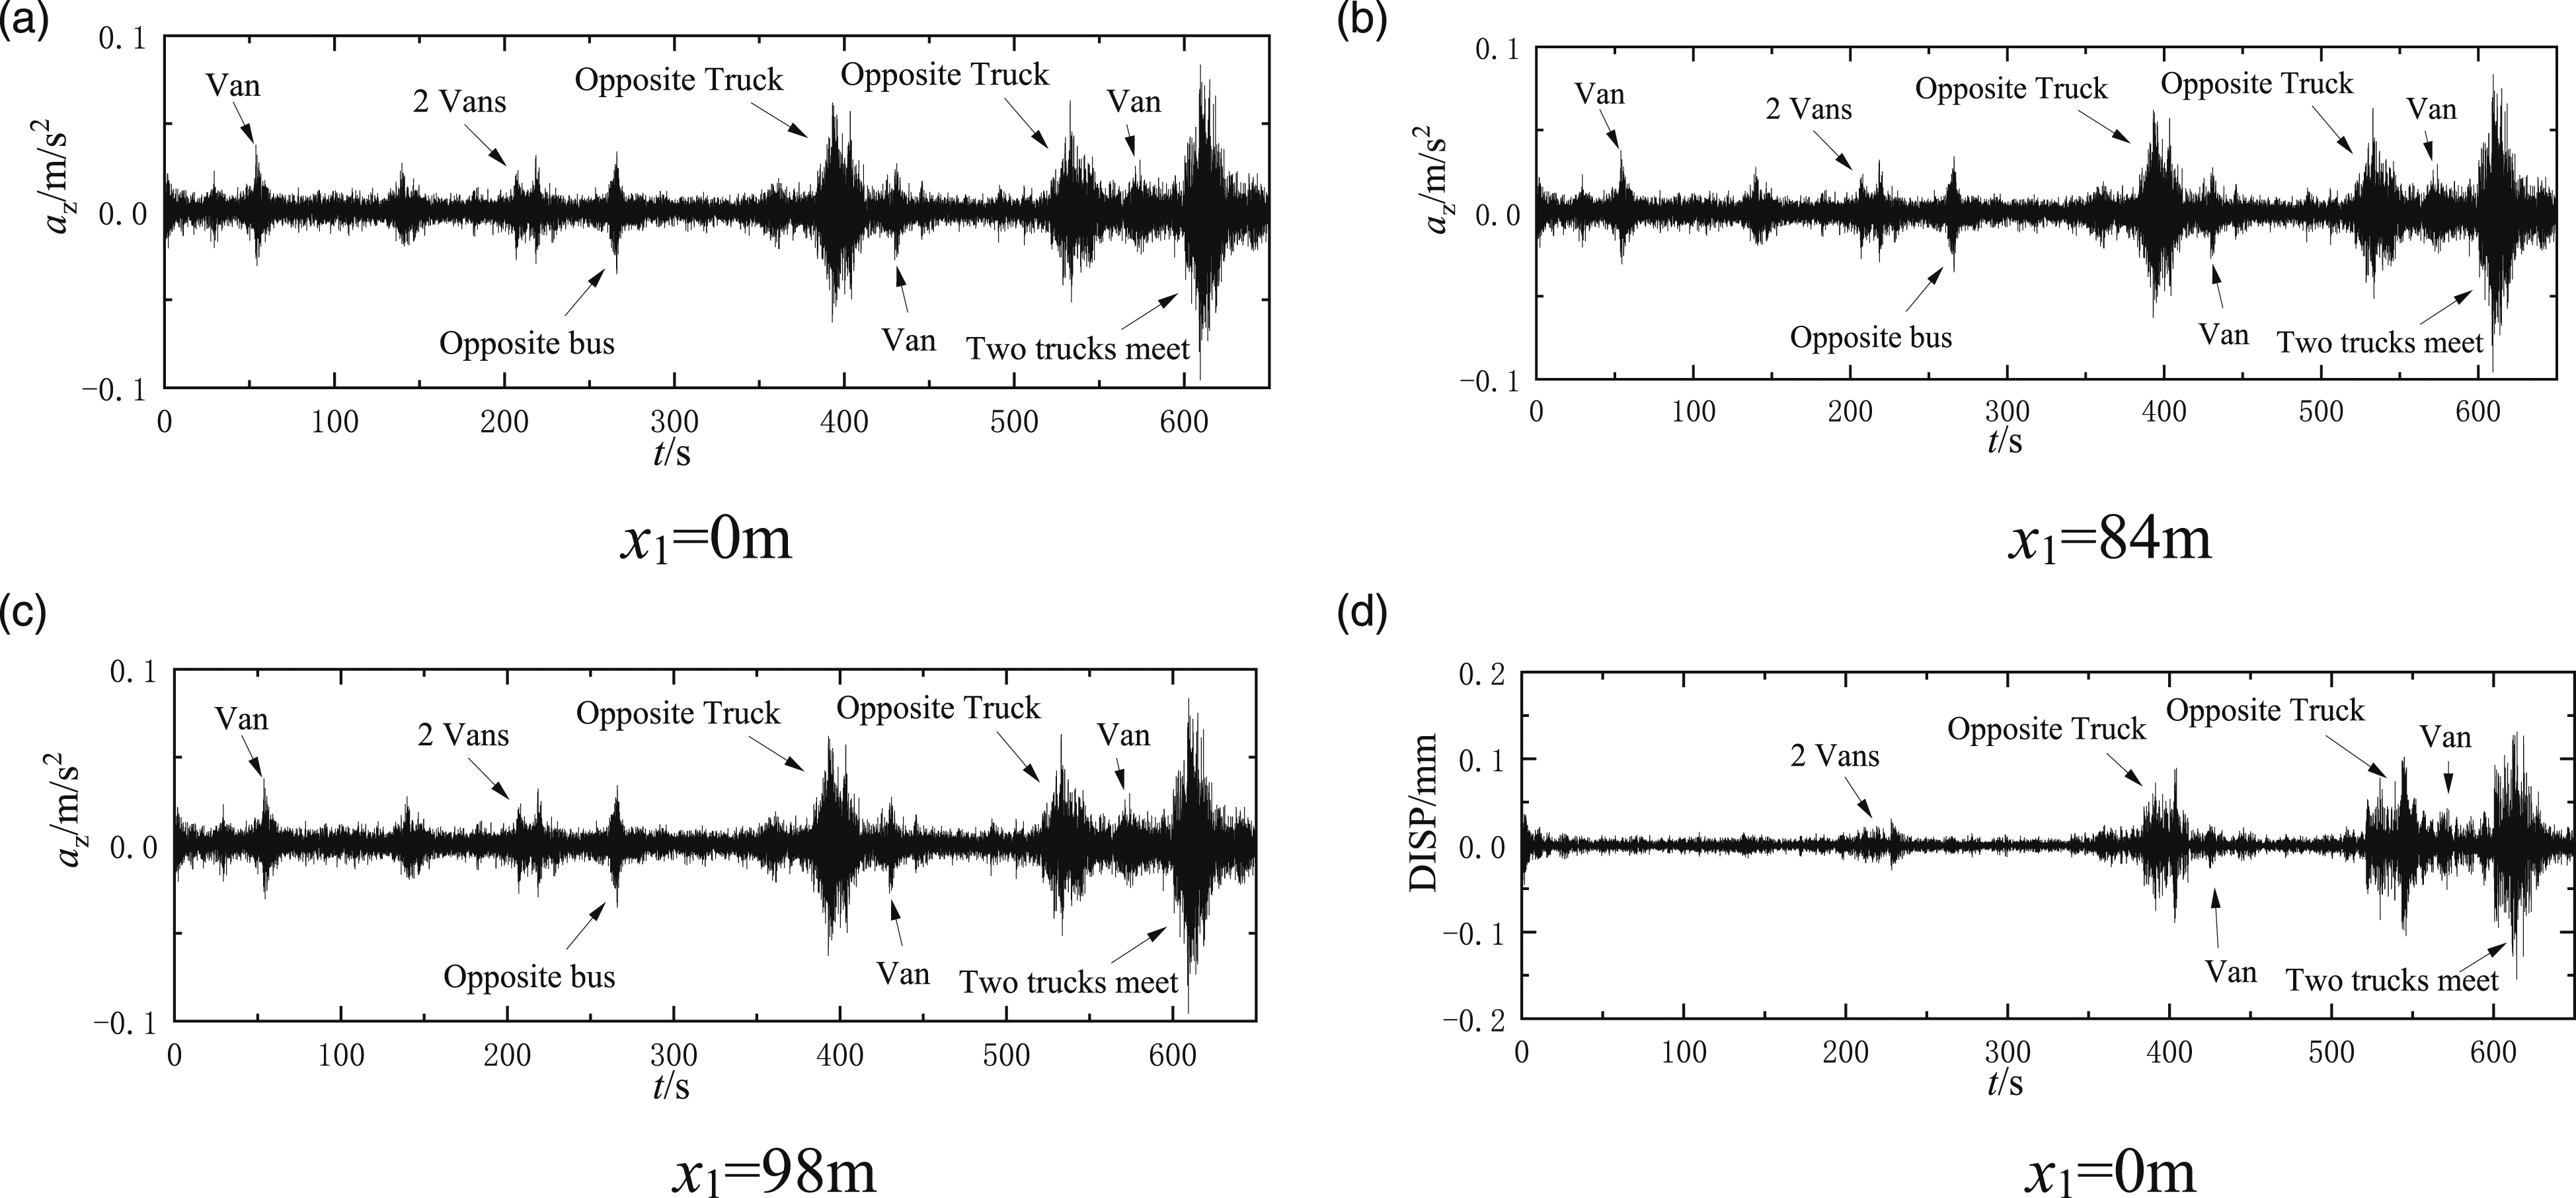
It can be seen from Figure 8 that the amplitude of the transverse acceleration at the bridge mid-span is less than 0.02 m/s2, and the displacement is less than 0.1 mm. Due to the small inflow wind speed, although there were various types of vehicles passing through the bridge during the test, the lateral response of the bridge was still small, which in turn exerts negligible effect on the vehicle dynamic response. According to Figure 9, the vertical acceleration of the bridge fluctuates obviously when the large and medium-sized vehicles pass through, and the fluctuation is related to the axle load of the vehicle. Trucks experienced the greatest response among various types of vehicles when passing through the bridges, due to its heavier gross vehicle weight. In addition, when the two trucks meet, the maximum response at the bridge mid-span is 0.096 m/s2, and the maximum displacement of the bridge is 0.143 mm. The maximum acceleration is 0.081 m/s2 at x1 = 84 m, and 0.071 m/s2 at x1 = 98 m. With the measuring point position away from the span, the vertical acceleration gradually decreases. Therefore, when large and medium-sized vehicles pass, the response of the bridge at the bridge tower position will be smaller. During the test, there were also small vehicles passing through the bridge. Because of the large distance between these vehicles, they could be considered as a single vehicle crossing the bridge. In Figure 9, there is no large fluctuation in other intervals except the marked vehicles, thus it showed that small vehicles did not show a significant impact on bridge response. According to the above results, the response of the bridge under vehicle load is small, and its amplitude is much smaller than that of road roughness (Its amplitude is 1 mm∼200 mm) (Shi et al.,2009). So, it can be inferred that its impact on vehicle response should be small. In view of this, the influence of bridge vibration is neglected in the subsequent analysis on the vehicle dynamic response.
Vehicle response
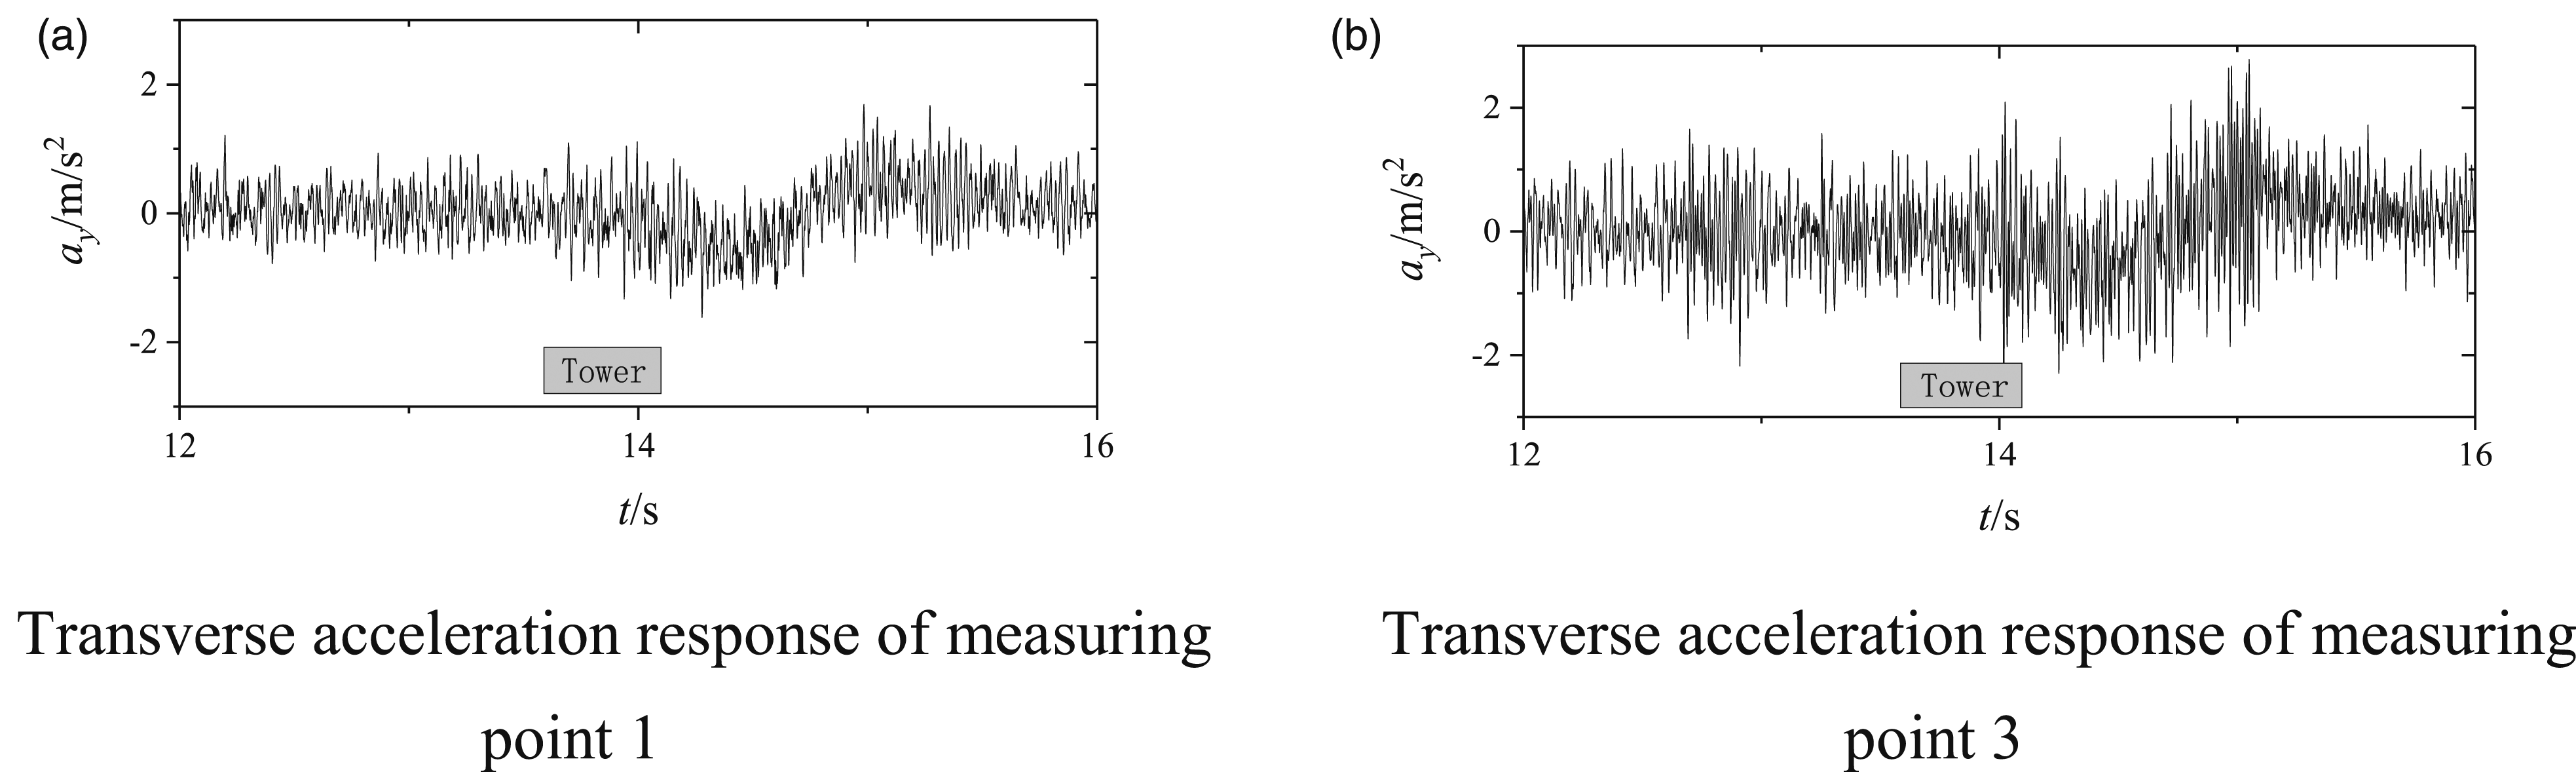
The vehicle response when passing through the bridge tower is investigated in this section. Figure 10 shows the acceleration response of the vehicle under the engine start-up state. The vertical and lateral acceleration responses of No. 2 measuring point are shown in the figure. Figure 11 shows the acceleration response of No. 2 measuring point when the vehicle passes through the windward side tower and the leeward side tower. And Figure 12 shows the acceleration responses of No. 1 and No. 3 measuring points when the vehicle passes through the leeward side tower. It can be seen from Figure 10 that the acceleration response of the test vehicle after the engine starts is relatively stable and the amplitude is small. The maximum acceleration in transverse direction is 0.046 m/s2, and the maximum acceleration in vertical direction is 0.075 m/s2. It indicates that the influence of vehicle engine noise is small and can be ignored in subsequent research. Acceleration response of No. 2 measuring point under engine starting condition. Acceleration Response of No. 2 Measuring Point. Acceleration response of No. 1 and No. 2 measuring points when vehicle passing through Leeward side bridge tower.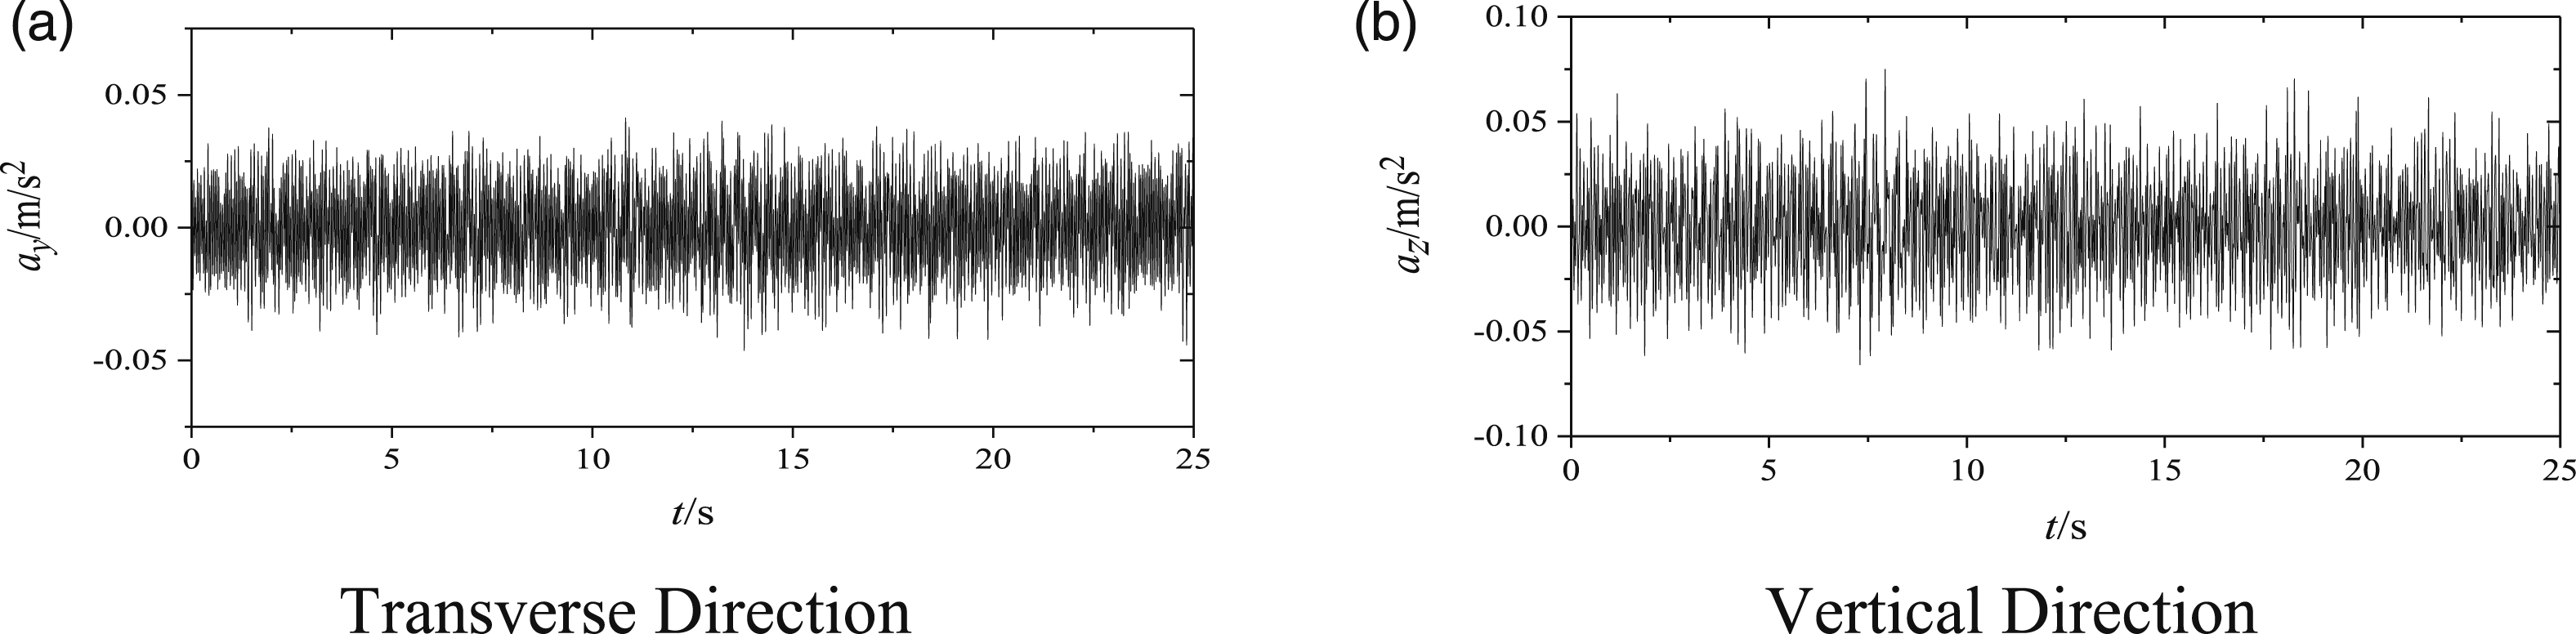
During the test, when the vehicle on the windward side passed through the bridge tower at a speed about 110 km/h, the 10 s average wind speed at the reference tower was 10.16 m/s, the average wind direction angle was
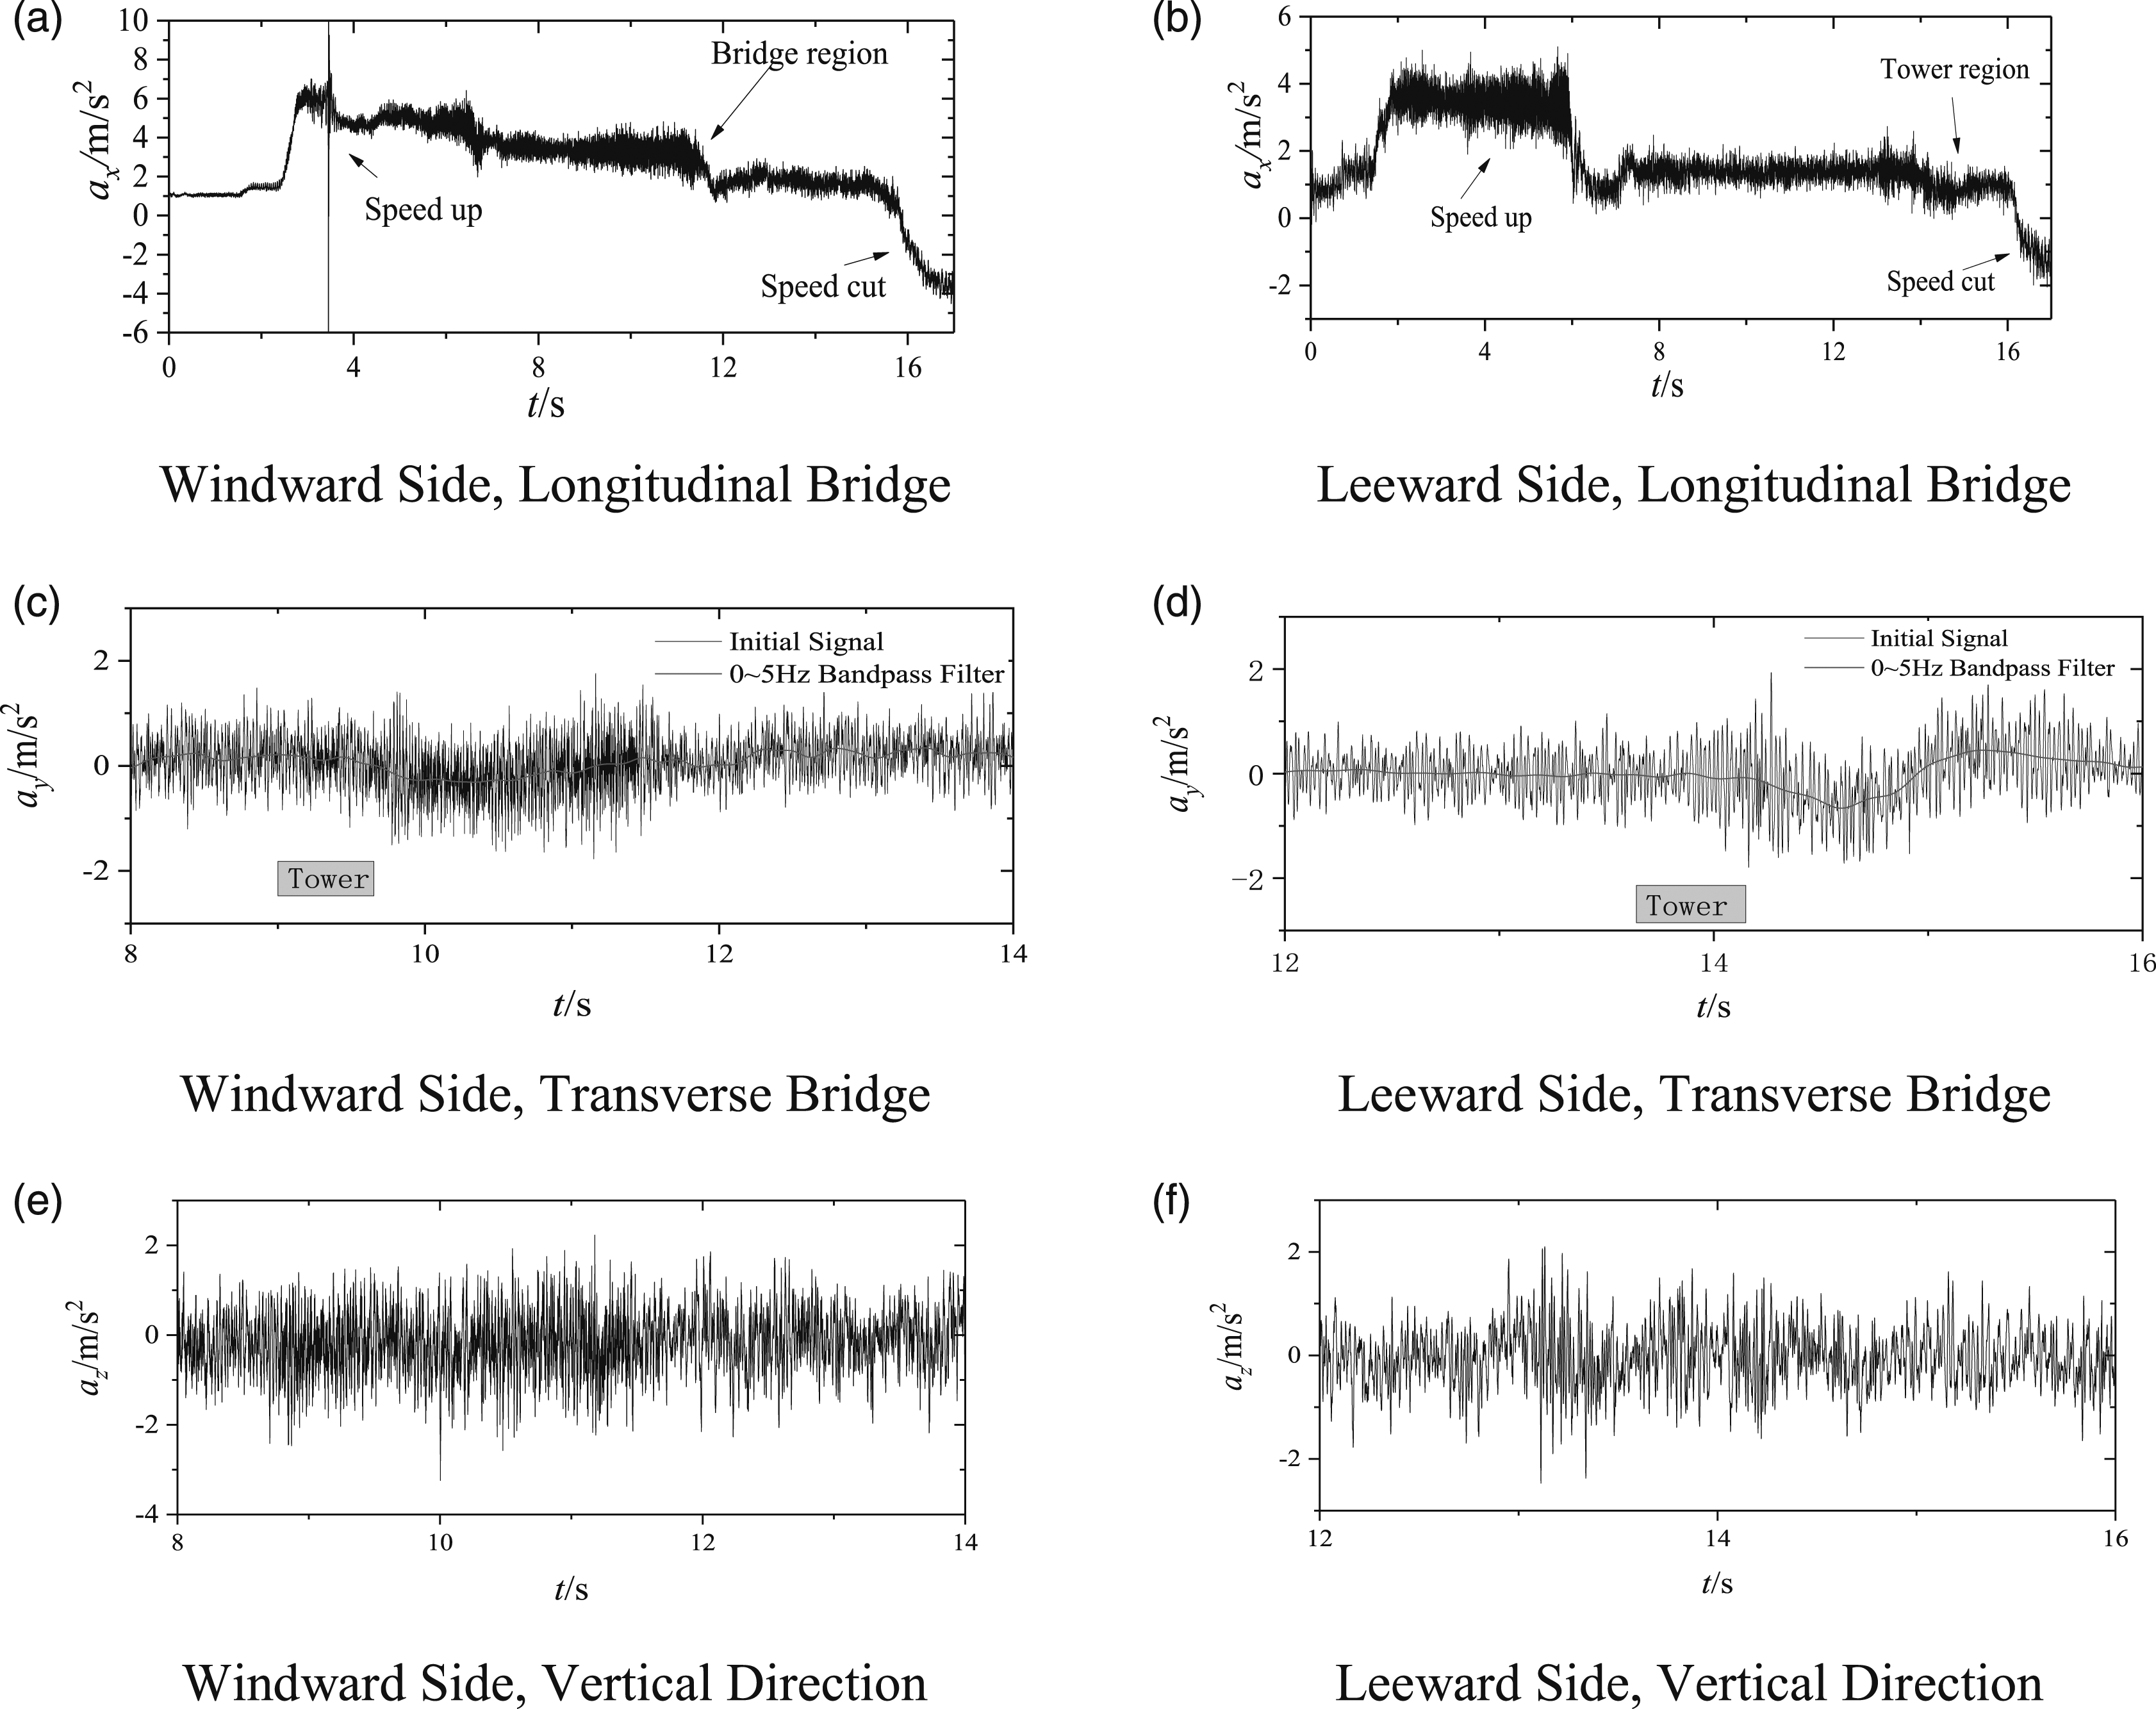
Before the vehicle entered the bridge tower, the response of the vehicle on the windward side and leeward side was relatively stable, and the response on the windward side was larger than that on the leeward side, which is in consistent with the law of the general vehicle force measurement results. In the process of vehicle passing through the bridge tower, when the vehicle entered the bridge tower, no sudden change is observed for the vehicle dynamic responses, see Figure 11(c) and (d). This is also in consistent with the wind field test results. However, when the vehicle exited the bridge tower, both the windward side and the leeward side of the bridge tower, the car experiences obvious horizontal shake. When the vehicle leaves the windward side tower, the response of the vehicle does not show sudden change, as shown in Figure 11(c). The maximum acceleration is 1.77 m/s2. The test vehicle passes through the bridge tower area for about 0.5 s and its frequency is about 2 Hz. On the basis of Nyquist theory, the raw data are filtered by 5 Hz low pass filter. After filtering, the maximum change of acceleration is 0.441 m/s2, from -0.273 m/s2 to 0.168 m/s2. However, according to the Figure 11(d), it is observed that when the vehicle drives out of the leeward side bridge tower, the lateral acceleration exhibits sudden change, and the maximum acceleration is 1.93 m/s2. After filtering, the maximum change of acceleration is 1.109 m/s2, from -0.661 m/s2 to 0.448 m/s2. The acceleration of the process increases rapidly, and the vehicle swaying time is about 1 s. If the wind speed is larger, the driver will be difficult to react immediately, and it is easy to cause traffic accidents. In the process of vehicle entering and leaving the bridge tower, the vertical acceleration of the vehicle changes smoothly without showing obvious fluctuation, as shown in Figure 11(e) and (f).
When the vehicle passed through the bridge tower on the leeward side, the lateral accelerations at different measuring points of the same vehicle have obvious swaying (see Figure 12). Before the vehicle enters the bridge tower, the acceleration response fluctuation of measuring point one is relatively small, while the response fluctuation of measuring point three is relatively large. This indicates that the vehicle has a certain amount of yaw acceleration and roll acceleration. A test has also shown that (Xiang et al., 2017), when the wind angle is small, the vehicle also has a larger yawing and rolling moment.
Comprehensively considering the wind field test results and vehicle test results, due to the excessive porosity of the anti-collision guardrail, the wind speed at the height of about 1 m from the bridge deck in the bridge tower area has a significant mutation. As a result, vehicles passing through the bridge tower area, especially low-height vehicles, have a large lateral acceleration mutation, which seriously affects the driving safety of the vehicle. Because the wind speed at the height of 2 ∼ 5 m does not fluctuate greatly according to Figure 7(a), it proves that the wind barrier has good wind resistance effect. Therefore, the suitable decrease of the anti-collision guardrail porosity in the bridge tower will improve the running safety of vehicles.
Conclusions
By using the field measurement method, the wind field distribution, bridge response and vehicle response in the bridge tower area of a long span cable-stayed bridge are tested, and the results are discussed. The following conclusions are drawn: (1) The field measurement scheme, which is a step-by-step test method, is useful for understand the wind shielding effect of bridge tower. (2) At the height of 1 m, the wind speed of windward lane in the bridge tower area has a significant mutation, and the wind speed coefficient fluctuation is relatively small. On the contrary, the wind speed coefficient of leeward lane fluctuates greatly. (3) The response of two trucks passing through the bridge is small and the displacement amplitude is much smaller than that of road roughness. On this bridge, the coupling effect between a single car and the bridge can be neglected. (4) The observed lateral response mutation is obvious when the vehicle drives out of the leeward side bridge tower, and the sloshing duration is very short. (5) The design of the wind barrier in the bridge tower area should reduce the porosity of the anti-collision guardrail to enhance the driving safety of small vehicles, rather than only considering the driving safety of high side vehicles.
Footnotes
Declaration of conflicting interests
The author(s) declared no potential conflicts of interest with respect to the research, authorship, and/or publication of this article.
Funding
The author(s) disclosed receipt of the following financial support for the research, authorship, and/or publication of this article: This work was supported by the National Natural Science Foundation of China (51778544, 51978589), and the Fundamental Research Funds for the Central Universities (2682021CG014).