
Abstract
This study proposes a novel method to identify structural damage considering ambient temperature variations. In this method, the normalized modal flexibility based index (nMFBI) and autoregressive (AR) coefficients are combined to form the nMFBI-AR hybrid index, and convolutional neural networks (CNN) are exploited to locate and quantify the damage. Moreover, the effects of ambient temperature variations and measurement noise are not considered in the training dataset, which is preferable in practical engineering. To verify the effectiveness of the proposed method, firstly, a numerical structure of a simply supported beam is investigated, and the performance of the nMFBI-AR index is evaluated by making a comparison with the nMFBI and AR indexes. Then, the proposed method is further verified by a test model of a three-story frame and a practical engineering example of a continuous rigid frame bridge. The results demonstrate that although the influence of ambient temperature variations and measurement noise are only considered in the test datasets, this approach has the best performance in locating and quantifying structural damage, and the errors are less than 16%, which is promising. In addition, this paper provides a guideline and a new idea for the study of damage index based on time-frequency hybrid information.
Keywords
Introduction
Structural damage identification (SDI), as an important part of structural health monitoring (SHM), aims to identify structural damage timely. During several decades, many methods have been proposed to solve this problem, one of the most popular is the vibration-based damage identification (VBDI) method (Guo et al., 2020; Huang et al., 2022). Although this kind of method has obtained good results, it still faces a challenge, namely, some external interference in the natural environment will cause fluctuations of measured dynamic characteristics. These fluctuations may mask the changes in dynamic characteristics caused by damages, which means inaccurate damage identification results.
To eliminate the environmental effects on SDI, some researchers have studied the environmental factors that affect dynamic characteristics, such as ambient temperature variations, humidity changes, traffic loads, and so forth. It is observed that the ambient temperature variations are the most significant factors affecting the measured dynamic characteristics (Gu et al., 2017; Nandan et al., 2014a, 2014b). Therefore, some researchers have further considered how to analyze the influence of ambient temperature variations on SDI. Yan et al. (2005) assumed that Young’s moduli of concrete and steel vary with the ambient temperature. Jiao et al. (2014) studied the mechanical properties change of concrete at different ambient temperatures (−20°C to 60°C) through tests and then obtained a linear equation, which can describe Young’s modulus changes of concrete under the ambient temperature variations. Xia et al. (2012) reviewed the literature on temperature effects on structural modal properties. It was emphasized that the variation of frequency was mainly caused by the change in material modulus. With the ambient temperature increased by 1°C, Young’s moduli of steel, aluminum and reinforced concrete decreased by 0.02%, 0.03% and 0.15%, respectively. Combining these ideas and a series of SDI approaches, the accuracy of SDI under the influence of ambient temperature variations can be improved.
Furthermore, the accuracy of SDI largely depends on the damage index adopted by the VBDI methods. The existing frequency domain indexes, such as natural frequency (Chinka et al., 2021), curvature mode shape (Gomes and Giovani, 2022), flexibility matrix (Huang et al., 2020) and modal strain energy (Huang et al., 2023; Sadeghi et al., 2021) have been widely used in SDI. All of them are based on the structural modal parameters or their extension. The other is based on the time domain indexes, including nodal accelerations (Pahnabi and Seyedpoor, 2021), dynamic displacements (Oh et al., 2020), stress influence lines (Chen et al., 2015) and inclination and strain (Sun et al., 2019). However, the former indexes usually show incomplete due to the limitations of sensors, and the latter indexes are easy to be polluted by the ambient vibration and measurement noise. It is crucial to find a powerful index for SDI. Thus, Teng et al. (2020) proposed a damage index based on modal features and dynamic responses to identify damage accurately. Due to the information fusion and complementarity, the combination of the frequency and time domain indexes has great potential for accurate damage identification.
Since modal flexibility (MF) is sensitive to structural damages and can be obtained from several lower modes, it has been used to develop various SDI methods. Wang et al. (2018) proposed a MF-based approach for detecting and locating damage. This method can detect single and multiple damages in the beams and columns of asymmetric building structures. Bernagozzi et al. (2018) developed a MF-based approach to locate damage. When the mass of the system is unknown or there is little information about it, the damaged location of frame building structures can be determined. On the other hand, since the autoregressive (AR) model has good time series fitting ability and can be directly extracted from structural responses, it has been extensively used for SDI. Long and Buyukozturk (2017) used the AR coefficients to detect and locate damage by a one-class kernel classifier. Tang et al. (2020) combined the AR coefficients and convolutional neural networks (CNN) to locate multi-location damages and minor damages using limited accelerometers. It can be seen that the MF and AR coefficients have good capability in SDI. However, the aforementioned methods are generally successful in locating damage, while not being straightforward to quantify the damage.
In addition, CNN is the most representative structure in deep learning, which can automatically extract high-dimensional features of data (LeCen et al., 2015). In recent years, it has been widely adopted in the field of SHM, such as crack detection of images (Ye et al., 2019), damage identification using vibration signals (Dang et al., 2022) or vibration characteristics (Sony et al., 2022) and denoising of vibration signals (Fan et al., 2020). Cha et al. (2017) utilized CNN to detect concrete cracks. The performance of this method has been validated by the traditional Canny and Sobel edge detection methods. Abdeljaber et al. (2017) used 1D-CNN to extract the damage-sensitive features from the acceleration signals for detecting damage. The accuracy of this method was verified by monitoring the main steel frame of the Qatar University grandstand simulator. Subsequently, an enhanced CNN-based approach was proposed to overcome the disadvantage that CNN needs a large number of measurement data. It can successfully estimate the damage of nine damage cases in the benchmark study of SHM (Abdeljaber et al., 2018). Therefore, CNN has an excellent performance in feature extraction and great potential in dealing with the challenges of massive data in SDI. Besides, although Li et al (2021) used CNN to quantify the damage severity of concrete structures under varied temperatures, the effect of temperature variations was considered in the training datasets, which is not applicable in practical engineering.
In this paper, a new method combining CNN and normalized modal flexibility based index-autoregressive coefficients (nMFBI-AR) is proposed to solve the problem of SDI considering the ambient temperature variations. Firstly, the ambient temperature variations (including uniform temperature variations and temperature gradient) are considered through the change in the elastic module of material. Secondly, a novel hybrid damage index, nMFBI-AR, is formed by combining the normalized modal flexibility-based index and autoregressive coefficients. Finally, the nMFBI-AR is input into CNN to locate and quantify structural damages. It should be noted that the effects of ambient temperature variations and measurement noise are only considered in test datasets, which is preferable in practical engineering.
The remainder of this paper is organized as follows: (1) the first section describes the damage identification model considering ambient temperature variations; (2) the second section first presents the basic theory of nMFBI, AR coefficients as well as CNN, and then combines the nMFBI-AR index with CNN to identify structural damage; (3) the third section applies a numerical structure to verify the feasibility of the proposed method; (4) the fourth section employs a test model and a practical engineering example to further validate the applicability of the proposed approach; (5) the fifth section summaries some conclusions of this paper.
Damage identification model considering ambient temperature variations
The differential equation of undamped free vibration can be illustrated as follows:


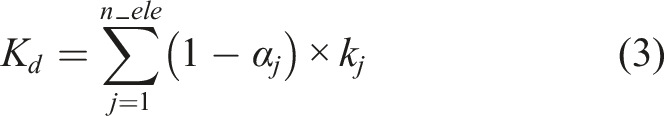
When the change of structural mass is ignored, the damage can be expressed as a linear reduction coefficient in the structural stiffness, which can be written as follows:
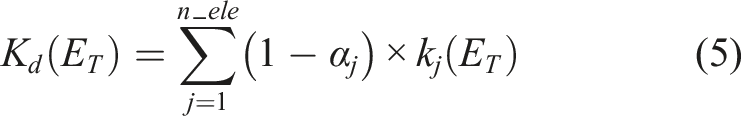
However, ambient temperature variations will cause changes in modal properties, especially the elastic modulus of materials, and then lead to non-negligible errors in structural damage identification (SDI) (Xia et al., 2012). That is, the elastic modulus of the materials can be assumed to be temperature-dependent, which can be expressed as follows (Huang et al., 2019):

Therefore, considering the SDI model (equation (4)) combined with the relationship between ambient temperature and Young’s modulus of materials (Xia et al., 2012), the problem of SDI considering ambient temperature variations can be summarized as follows:
Structural damage identification based on nMFBI-AR and CNN
Damage identification index combining normalized modal flexibility based index and autoregressive coefficients
Normalized modal flexibility based index
The mode shapes are usually normalized with respect to the mass matrix, and their relationships can be established as follows:


Then, the stiffness matrix and flexibility matrix can be written as follows:

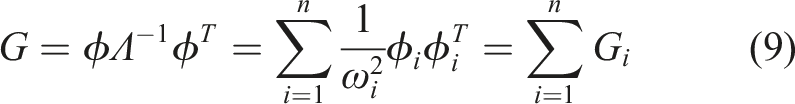
Equation (9) indicates that the contribution of the modes on the flexibility matrix
Normalizing the flexibility matrix based on its main diagonal elements, which can be presented as follows:
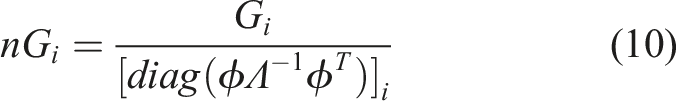
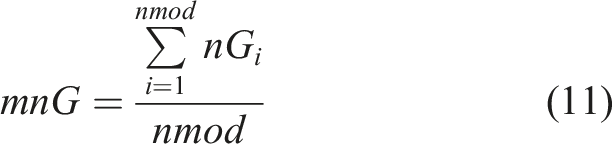

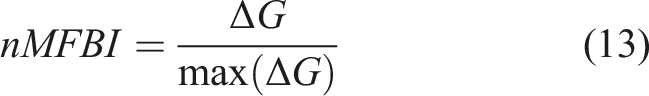
Moreover, maximum normalization is applied to amplify damage features, which can be shown as follows:
Autoregressive coefficients
AR model is a method for dealing with time series. The main theory is to establish a stable, zero mean time series

The order of AR coefficients is the key to the time series model, which is related to computational accuracy and efficiency. In this paper, Akaike’s Information Criterion (AIC) is used to determine the order of AR coefficients, which can be defined as follows:

Due to its good time series fitting ability, AR coefficients are usually employed to analyze dynamic signals (Luo et al., 2022; Svendsen et al., 2022). Therefore, it is feasible to identify structural damage by constructing a damage index with AR coefficients.
The hybrid index combining normalized modal flexibility based index and autoregressive coefficients (nMFBI-AR)
Combining the time domain damage index (AR coefficients) and frequency domain damage index (nMFBI), a new hybrid damage index, nMFBI-AR, is proposed to identify structural damage. The nMFBI-AR is formed into a matrix, as shown in Figure 1, and then input into CNN. Construct input data (A#: acceleration; AR#: AR coefficients; M#: nMFBI; n: the number of DOFs in the considered direction; m: the order of AR coefficients).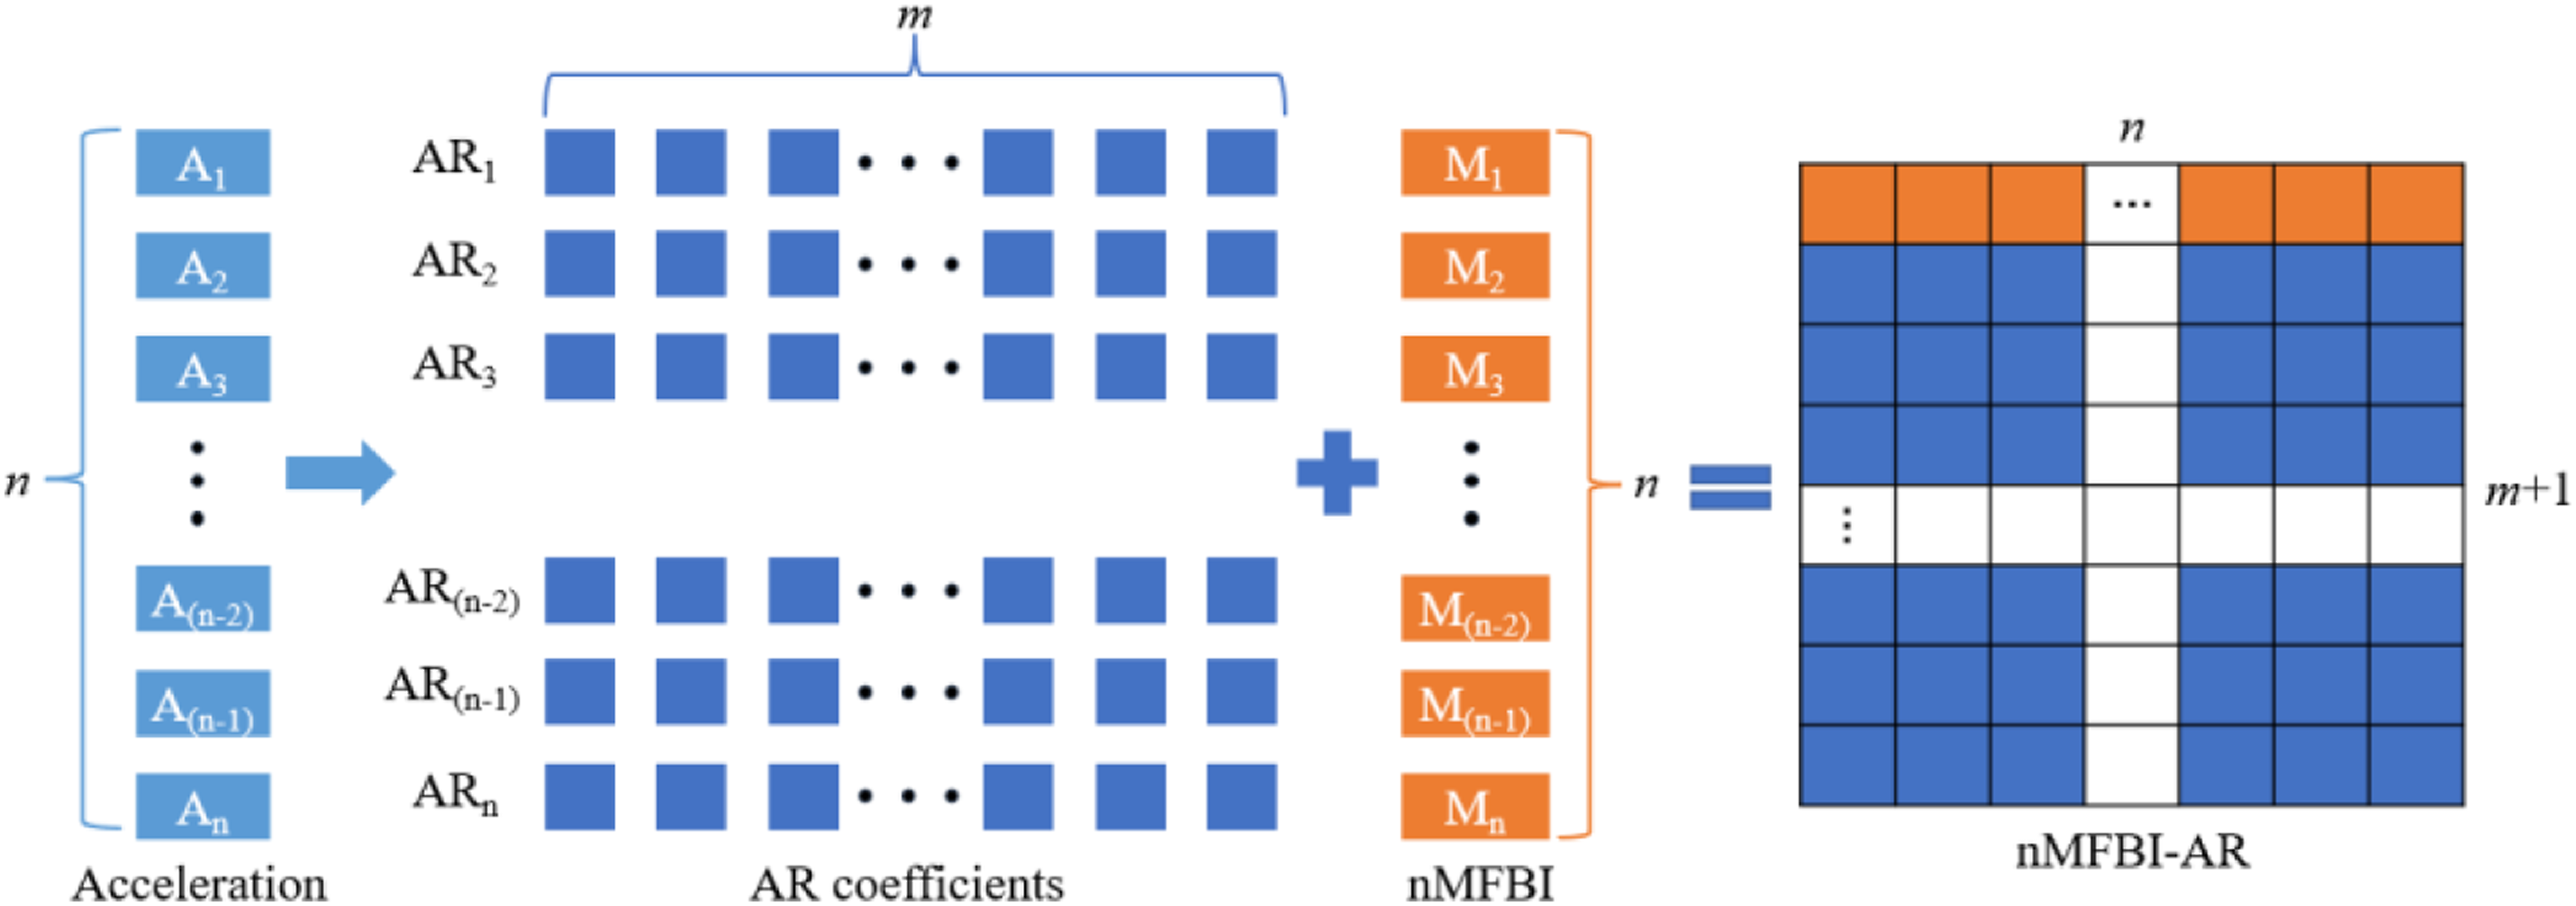
Convolutional neural network
Convolutional layer
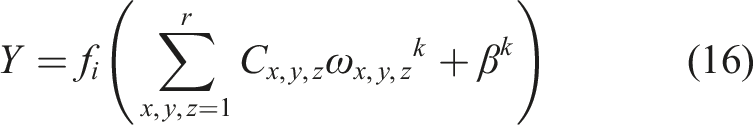
Convolutional neural network is mainly composed of convolutional layers, pooling layers, fully-connected layers and output layers. The convolutional layer is the core of CNN, which extracts different features of input samples. The convolutional operation can be divided into convolution and activation, which can be summarized as follows:
Moreover, the nonlinear activation function such as Sigmoid, Tanh and ReLU converts the network from linear mapping to nonlinear mapping, which improves the fitting ability of the network. In this paper, the ReLU is applied to the convolutional layer, because it eliminates the gradient vanishing effect of the Sigmoid function, and has been widely used in CNN.
Pooling layer
The pooling layer compresses the dimension of the feature matrix to realize the down-sampling of local information, prevent the network from over-fitting, and improve the computation speed of the neural network. In this paper, one of the most popular methods, average pooling, is adopted to improve the calculation efficiency.
Fully-connected layer
The function of the fully-connected layer is to integrate all the feature data after the convolutional and pooling operations, and determine the final prediction value by weighting all local features. For regression processes, the ReLU does not apply to the output layer, since they map the output in the range of [0, ∞). Therefore, in this paper, the ReLU and linear activation function are adopted to the fully-connected layer and output layer, respectively.
The proposed convolutional neural network for structural damage identification
In this paper, a 2D-CNN is designed in MATLAB, as shown in Figure 2, to identify structural damage considering the ambient temperature variations. It consists of multiple hidden layers, namely, the feature learning layer (8 layers) and the fully-connected layer (2 layers). The proposed CNN for SDI.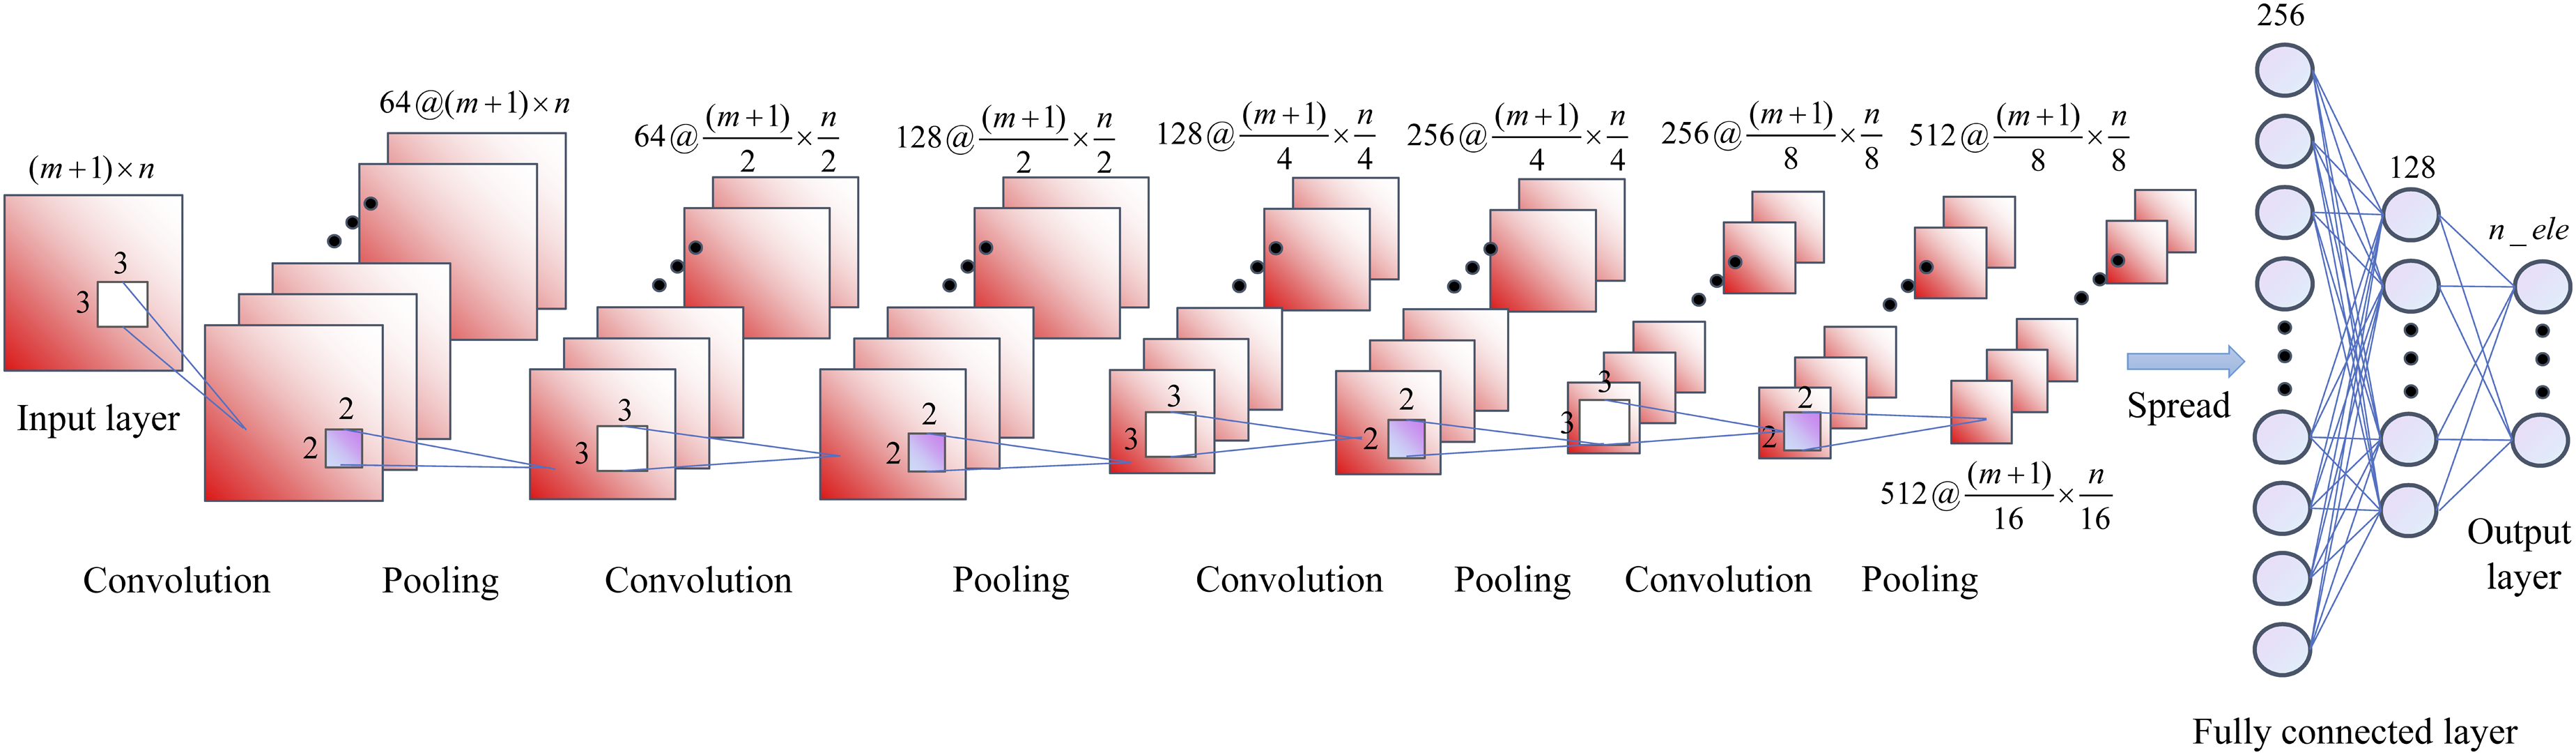
The loss function and evaluation criteria of convolutional neural network
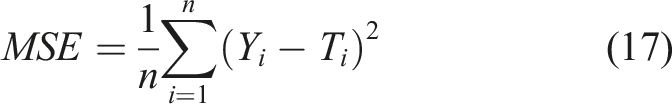
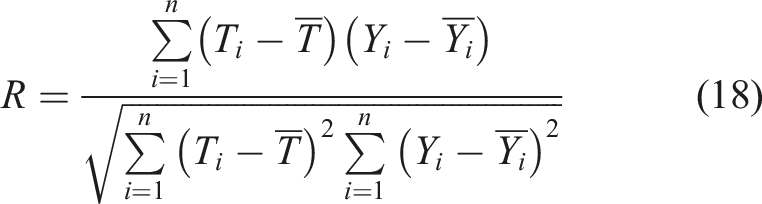
In this paper, mean square error (MSE) is used to evaluate the error between the predicted values and true values. Moreover, the MSE and regression value (R, 0 ≤ R ≤ 1) are widely used to quantitatively evaluate the performance of the trained models (Pathirage et al., 2018; Wang et al., 2021). Thus, the MSE and R of the test datasets are also utilized in this paper. To summarize, the smaller MSE, the higher R and the higher accuracy of the trained models (Wang et al., 2021). The definition of MSE and R can be shown as follows:
The flowchart of structural damage identification
A novel damage identification approach, which utilizes the combination of CNN and time-frequency hybrid damage index (nMFBI-AR) to locate and quantify structural damage, is proposed in this paper. The main steps are listed as follows: (1) Construct finite element models (FEM) considering ambient temperature variations to obtain the modal parameters and acceleration responses; (2) Calculate the nMFBI, and build the AR model to obtain the AR coefficients; (3) Combine the nMFBI and AR coefficients into the nMFBI-AR index, and then CNN is adopted to construct the mapping relationship between the nMFBI-AR index and the corresponding damage location and severity; (4) Evaluate the performance of the trained model according to the preceding subsection. When the accuracy meets the criteria (MSE < 10−2 and R > 0.90), the trained CNN can be saved for the subsequent procedure; (5) Input the measured data of a practical engineering structure into the trained CNN for SDI.
The flowchart of damage identification can be shown in Figure 3. The flowchart of the damage identification method.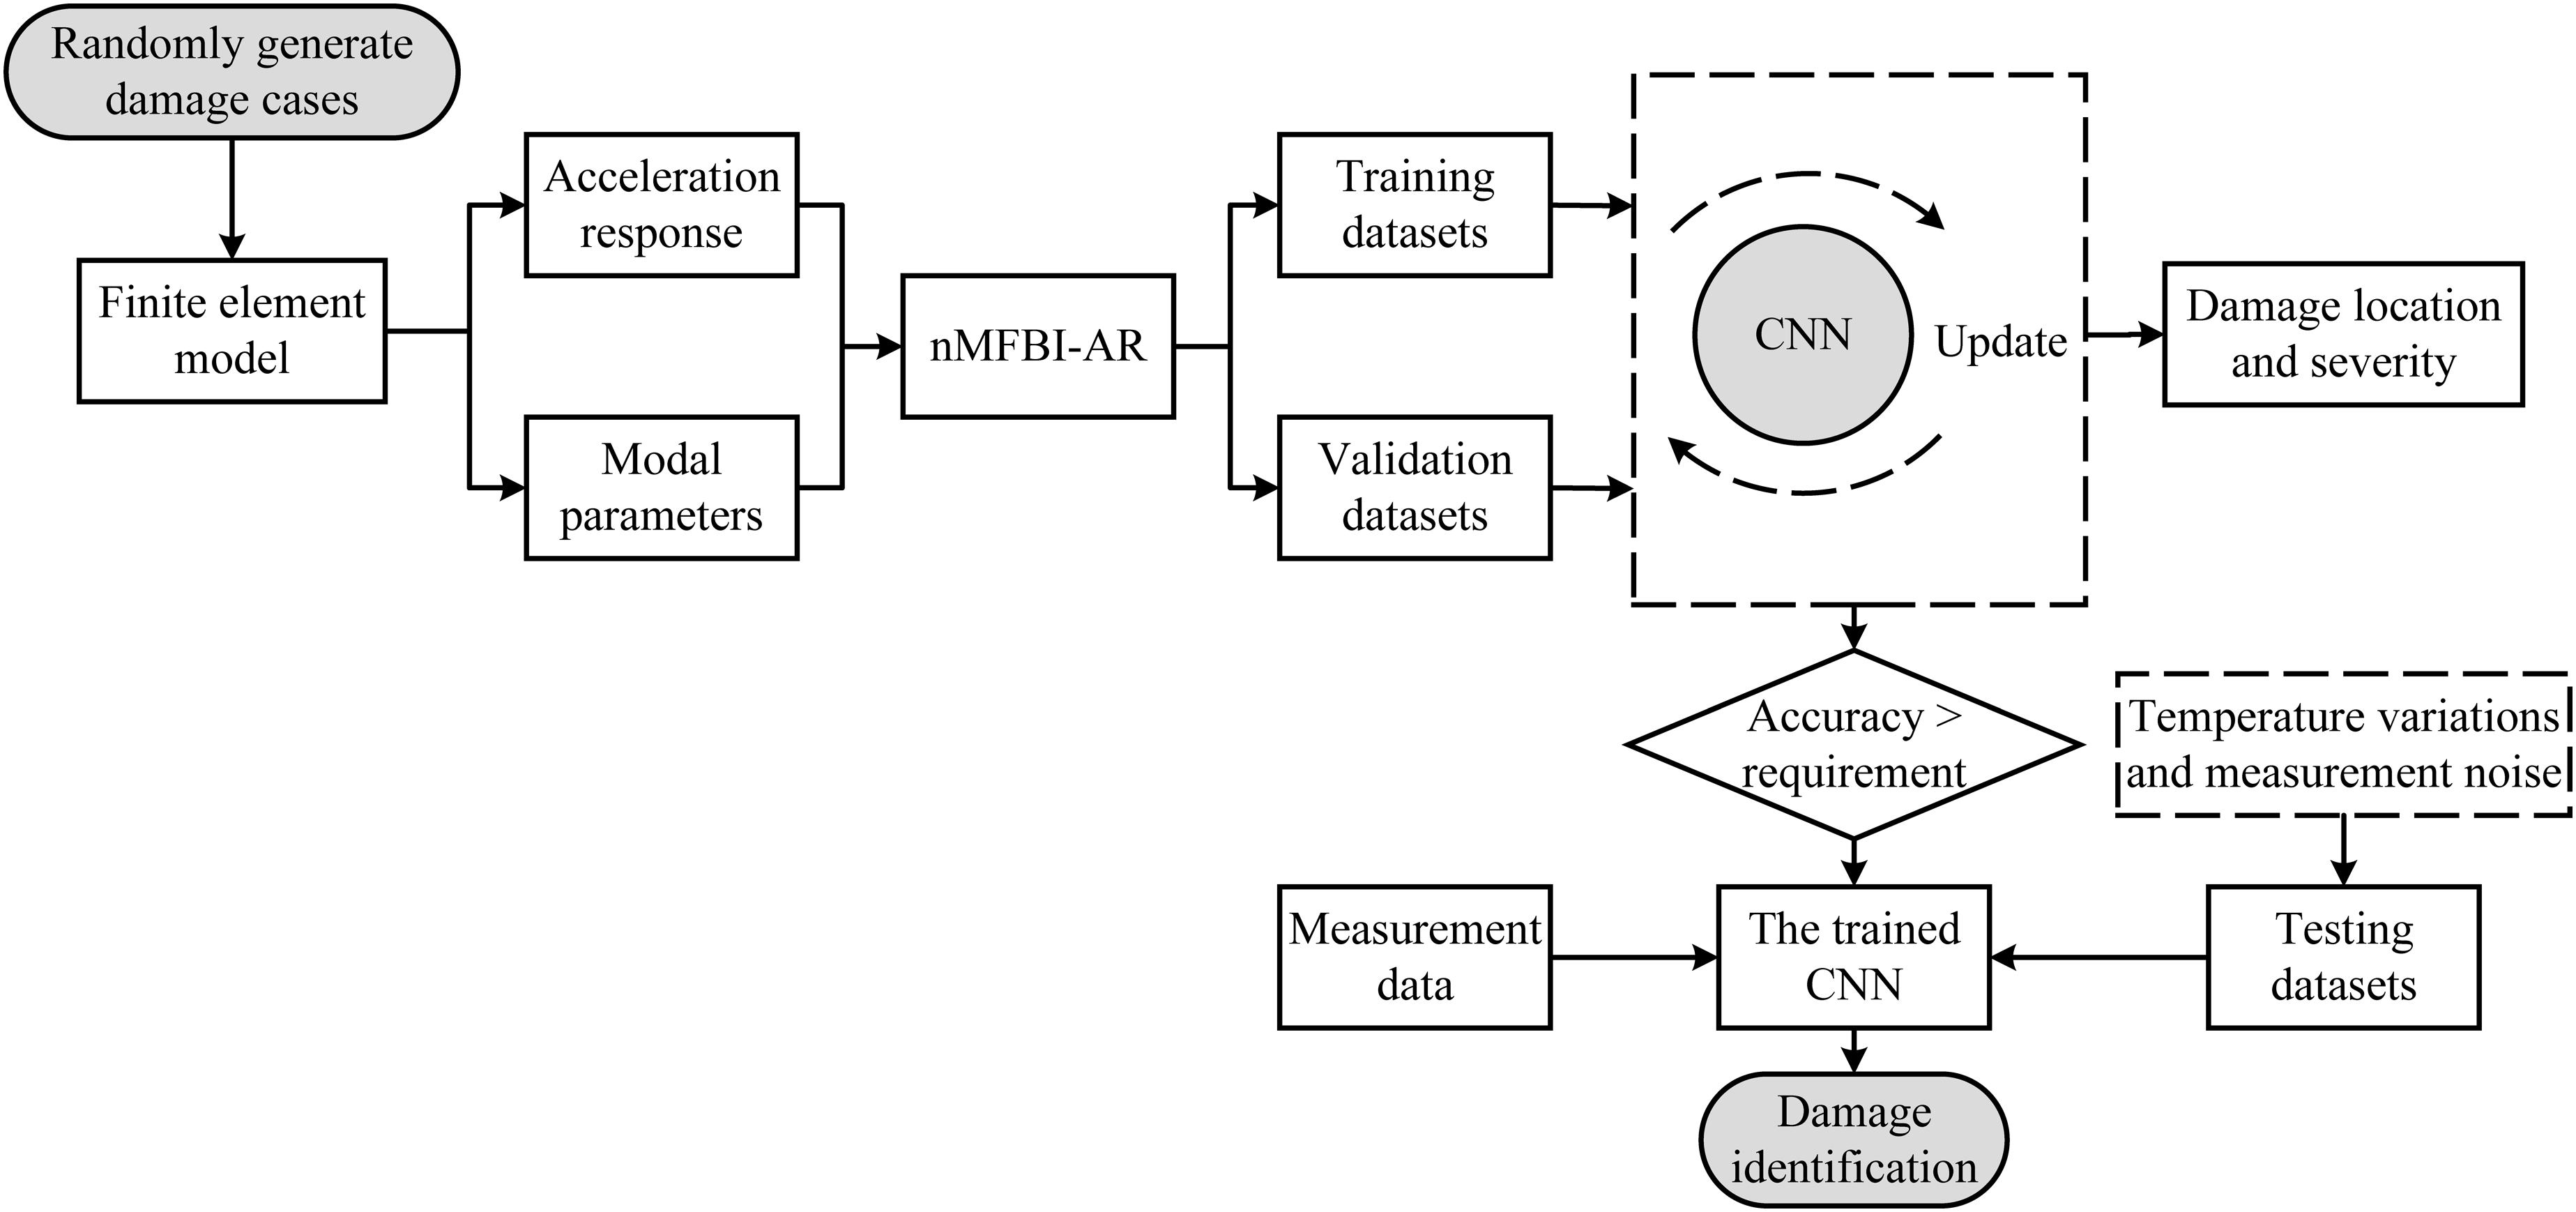
Numerical studies
In this section, a simply supported steel beam, as shown in Figure 4, is programmed using MATLAB to validate the accuracy of the proposed approach. There are 16 elements, and the length of each element is 0.5 m. The Young’s modulus, mass density, rectangular cross-sectional area, moment of inertia and thermal coefficient are 3.475 × 10¹⁰ Pa, 2500 kg/m3, 0.03 m2, 2.5 × 10⁻⁵ m4 and 1 × 10⁻⁵/°C, respectively. The performance of nMFBI-AR (time-frequency hybrid index) has been evaluated by making a comparison with nMFBI (frequency domain index) and AR (time domain index). The vertical acceleration signals of all DOFs except the supports are extracted to construct those damage indexes. Diagram of the simply supported beam.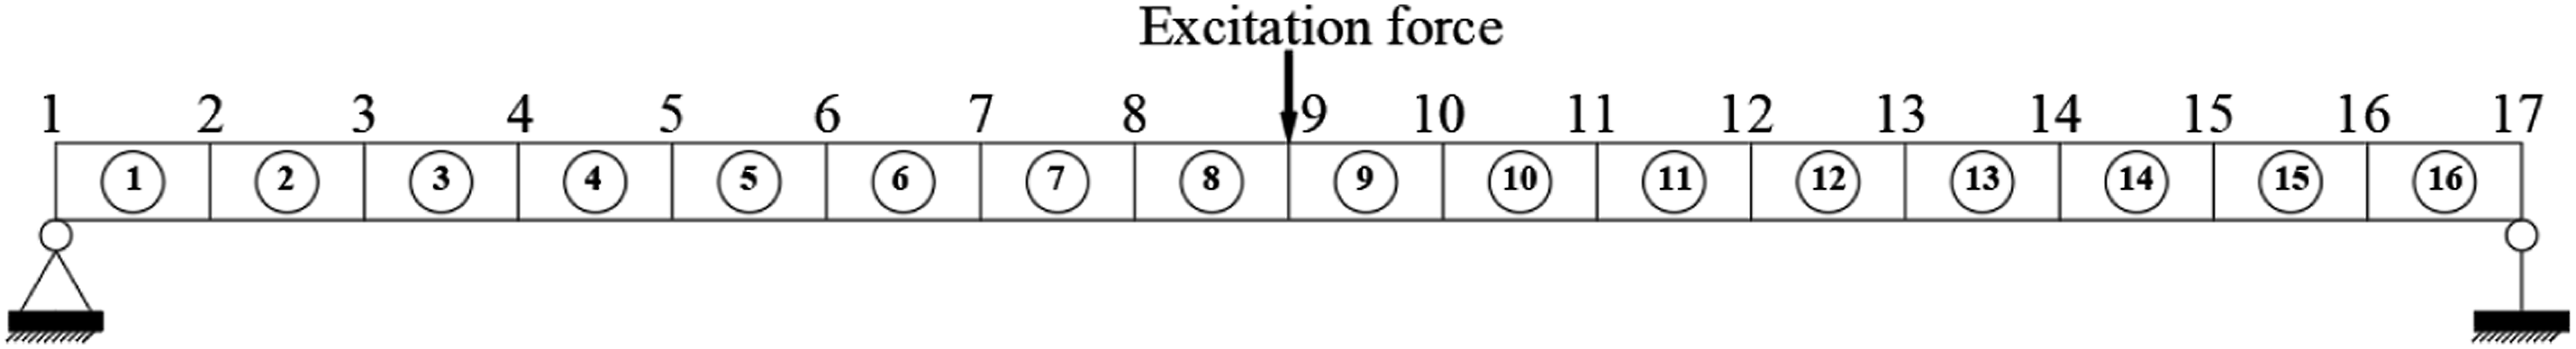
Data generation for training
The structural damages are introduced by the reduction of elements stiffness, and the stiffness reduction range is 0%–40%. The damage type of single-element (S), double-element (D) and three-element (T) are considered (Ding et al., 2020; Lee et al., 2021; Sadeghi et al., 2021; Wang et al., 2021). For each damage type, the damage elements and stiffness reduction parameters are randomly selected to generate 40,000 damage models for obtaining the damage indexes. Gaussian noise is applied at the 9th node of the simply supported beam to excite the system, and the state space method is used to calculate the vertical acceleration responses. The sampling frequency and sampling time are 1024 Hz and 20 s, respectively. Consequently, the natural frequencies and mode shapes can be extracted by the stochastic subspace identification (SSI) method, and the AR coefficients of acceleration are obtained by using the AR model. Then the indexes of nMFBI, AR and nMFBI-AR can be obtained. The considered orders of AR coefficients and modal parameters are 15 and 4, respectively. For each damage type, 40,000 datasets are used to train and validate the CNN. The input data of CNN is the nMFBI index, AR index and nMFBI-AR index, respectively, and the output is a vector of structural stiffness reduction. Therefore, the input dimensions of nMFBI, AR and nMFBI-AR indexes are 1 × 15, 15 × 15 and 16 × 15 (1 × 15 + 15 × 15), respectively, and the output dimension is 16 × 1. The three damage indexes are fed into the CNN for feature learning respectively. Then the learned features are mapped to a vector of structural stiffness reduction, identifying the location and severity of structural damage.
The simulated environmental conditions in the test datasets.
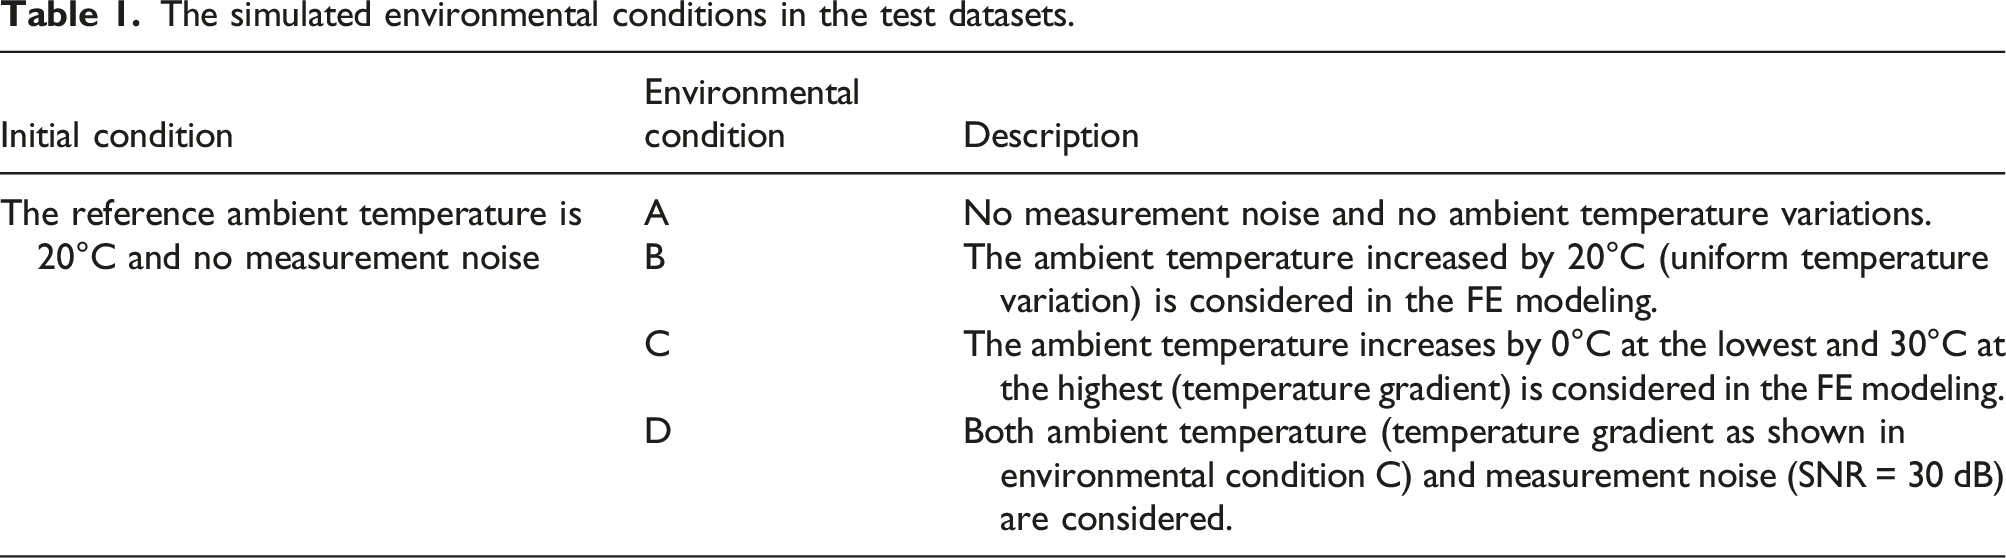
The temperature variations can be introduced according to the relationship between ambient temperature and Young’s modulus, as shown in equation (4). The measurement noise can be simulated as follows:
Performance evaluation of the convolutional neural network model
During the training process, the datasets are randomly divided into two parts, 90% for training, and 10% for validation. All hyper-parameters are selected based on the validation loss. The initial learning rate is 0.8 × 10⁻⁴, decaying 0.5 factor per 20 epochs. The mini-batch size is 64, and performs 150 epochs with the Adam optimizer. Due to limited space, as shown in Figure 5, the training loss curves in the most complex situation, namely, the three-element damage type are illustrated. It can be observed that the training loss of the nMFBI-AR index consistently outperforms the other indexes, and its final training loss is less than 50% of the other two indexes, indicating that the nMFBI-AR index has better convergence efficiency. The training loss curves of the simply supported beam.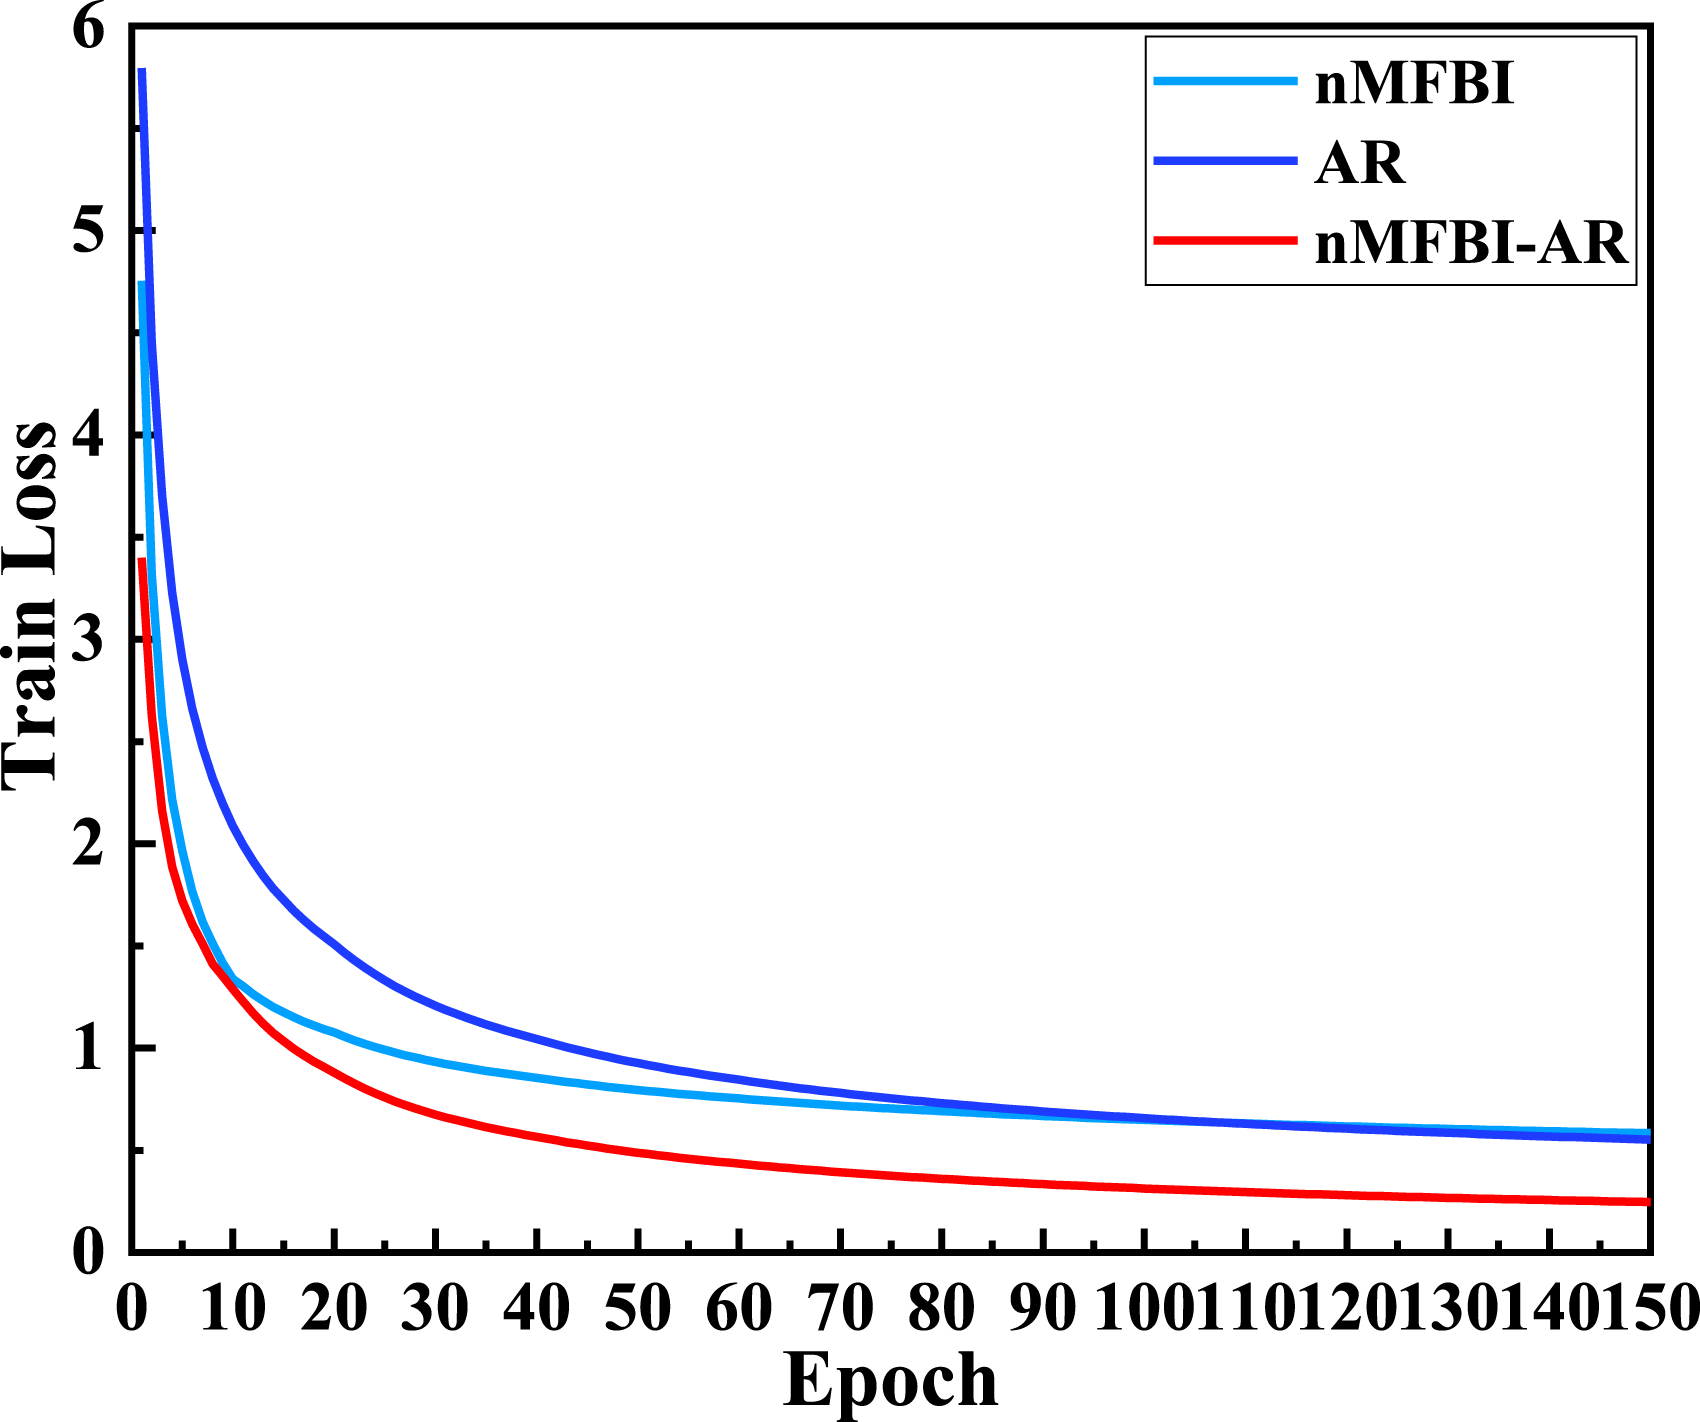
Performance evaluation results.
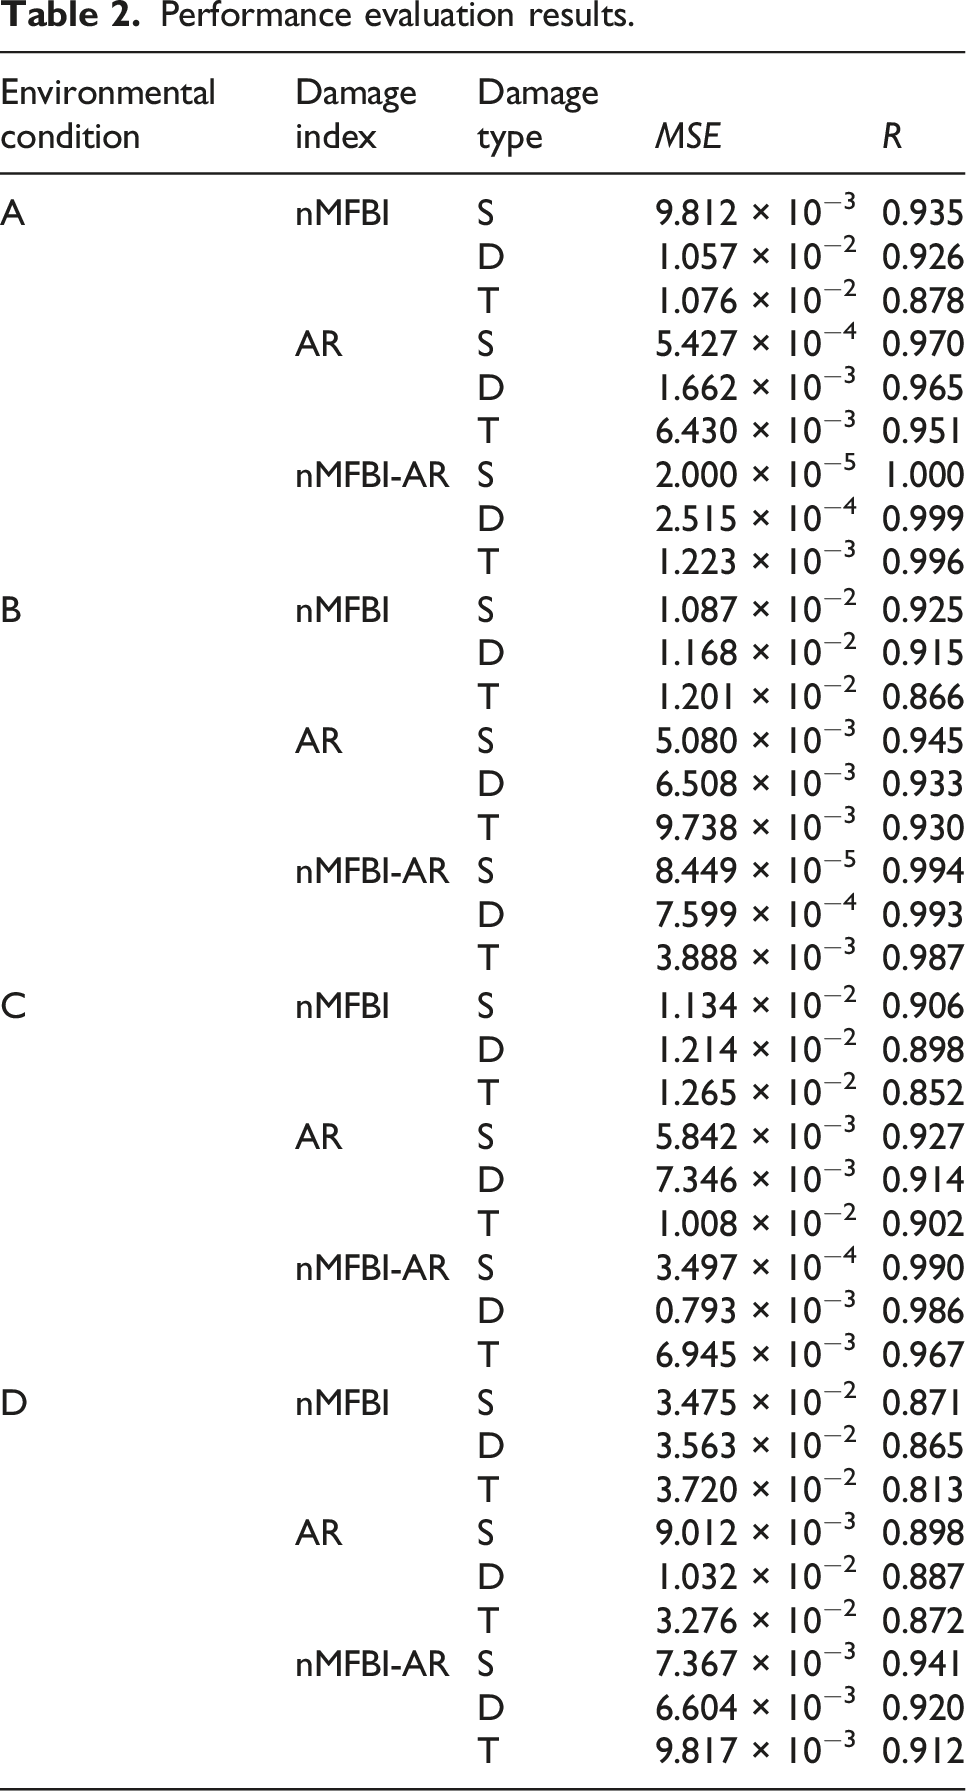
For environmental condition A, when three elements are damaged, both MSE (1.223 × 10⁻³) and R (0.996) indicate an outstanding performance of the nMFBI-AR index using clean datasets. Similarly, in environmental conditions B and C, both MSE and R of the nMFBI-AR index are much better than the other two indexes, whether considering uniform temperature variations or temperature gradients. This indicates that the proposed index is effective for damage identification considering the ambient temperature variations. Regarding environmental condition D, when the temperature gradient and measurement noise are considered, the performance is worst for all indexes. But the performance of the nMFBI-AR index is also the best one with the lowest MSE and the highest R in the three damage types.
In summary, when the complexity of ambient conditions and the number of damaged elements increase, the performance of the trained model degrades. For the most challenging case, i.e., three-element damage under the environmental condition D, the MSE and R of the nMFBI-AR index are 9.817 × 10⁻³ and 0.912, respectively, which is acceptable. Thus, although the training datasets do not consider the effect of ambient temperature variations and measurement noise, the trained CNN model based on the nMFBI-AR index has great potential to identify the damage of the simply supported beam.
Damage identification results
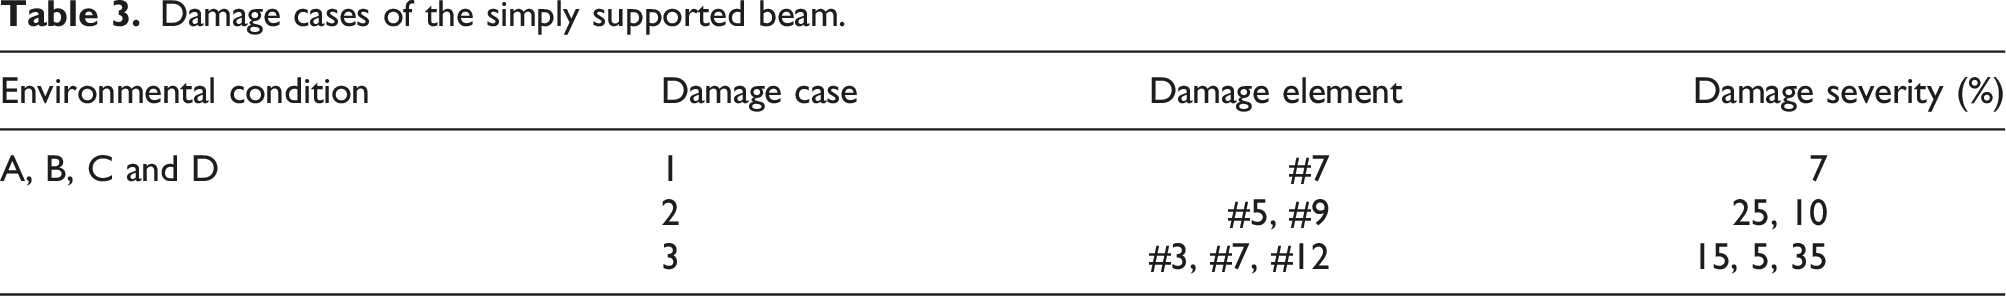
Damage cases of the simply supported beam.
The damage identification results are presented in Figure 6. For the single-element damage case, the damage location can be detected using all indexes under different environmental conditions. However, when considering the ambient temperature variations and measurement noises, the AR index produces a false prediction greater than 1%. The damage quantification results of the nMFBI and AR indexes are not as accurate as those of the MFBI-AR index. The errors of the nMFBI-AR index under the environmental conditions A, B, C and D are only 1.53%, 5.08%, 9.79% and 11.17% respectively, indicating well consistent with the true structural damage. Damage identification results of the simply supported beam. (a) A-1, (b) A-2, (c) A-3, (d) B-1, (e) B-2, (f) B-3, (g) C-1, (h) C-2, (i) C-3, (j) D-1, (k) D-2, (l) D-3.
For the double-element damage case, when the uniform temperature variations or temperature gradient is considered, the AR index occurs a false prediction greater than 1%; when the temperature gradient and 30 dB noise are considered, the indexes of nMFBI and AR produce two false predictions greater than 1% respectively. Moreover, it is observed that the indexes of nMFBI and AR cannot accurately quantify the damage severity. However, the nMFBI-AR index can accurately locate and quantify damages under different environmental conditions. Under the influence of ambient temperature variations and measurement noise, the identification errors are only 10.76% and 11.90%, respectively.
For the three-element damage case, the index of nMFBI and nMFBI-AR can detect multiple damage locations, while the AR index cannot locate the minor damage of 5%. Moreover, the nMFBI and AR indexes tend to generate several false alarms greater than 1%. It is observed that the damage identification errors of the nMFBI and AR indexes are much larger than those of the nMFBI-AR index. For the nMFBI-AR index, the maximum errors corresponding to the damaged elements are only 8.79%, 14.39% and 7.96%, respectively, which is acceptable.
To summarize, for the simply supported beam, although the nMFBI and AR indexes can be used to effectively locate the damage in most cases, their damage quantification results are inaccurate. Besides, as shown in Figure 6, the nMFBI-AR index can achieve smaller errors at other locations, while the others produce several false identification results. Therefore, under the influence of ambient temperature variations and measurement noise, the proposed approach has great potential in structural damage localization and quantification.
Application Cases
A three-story frame structure
In this section, to further validate the effectiveness of the proposed approach, a three-story aluminum frame structure is first adopted, as shown in Figure 7. The structure consists of aluminum columns and plates assembled by bolted joints, which slide on rails that allow movement in the x-direction only. Four aluminum columns (17.7 × 2.5 × 0.6 cm) are connected to the top and bottom aluminum plates (30.5 × 30.5 × 2.5 cm) on each floor to form a four DOF system. As shown in Figure 7, four accelerometers are attached to the middle of each floor at the opposite side from the excitation source to measure the response of each floor. The sampling frequency and sampling time are 320 Hz and 25.6 s respectively. Details about the frame structure are provided in reference (Figueiredo et al., 2009). Three-story frame structure (Figueiredo et al., 2009) and its simplified four DOF system.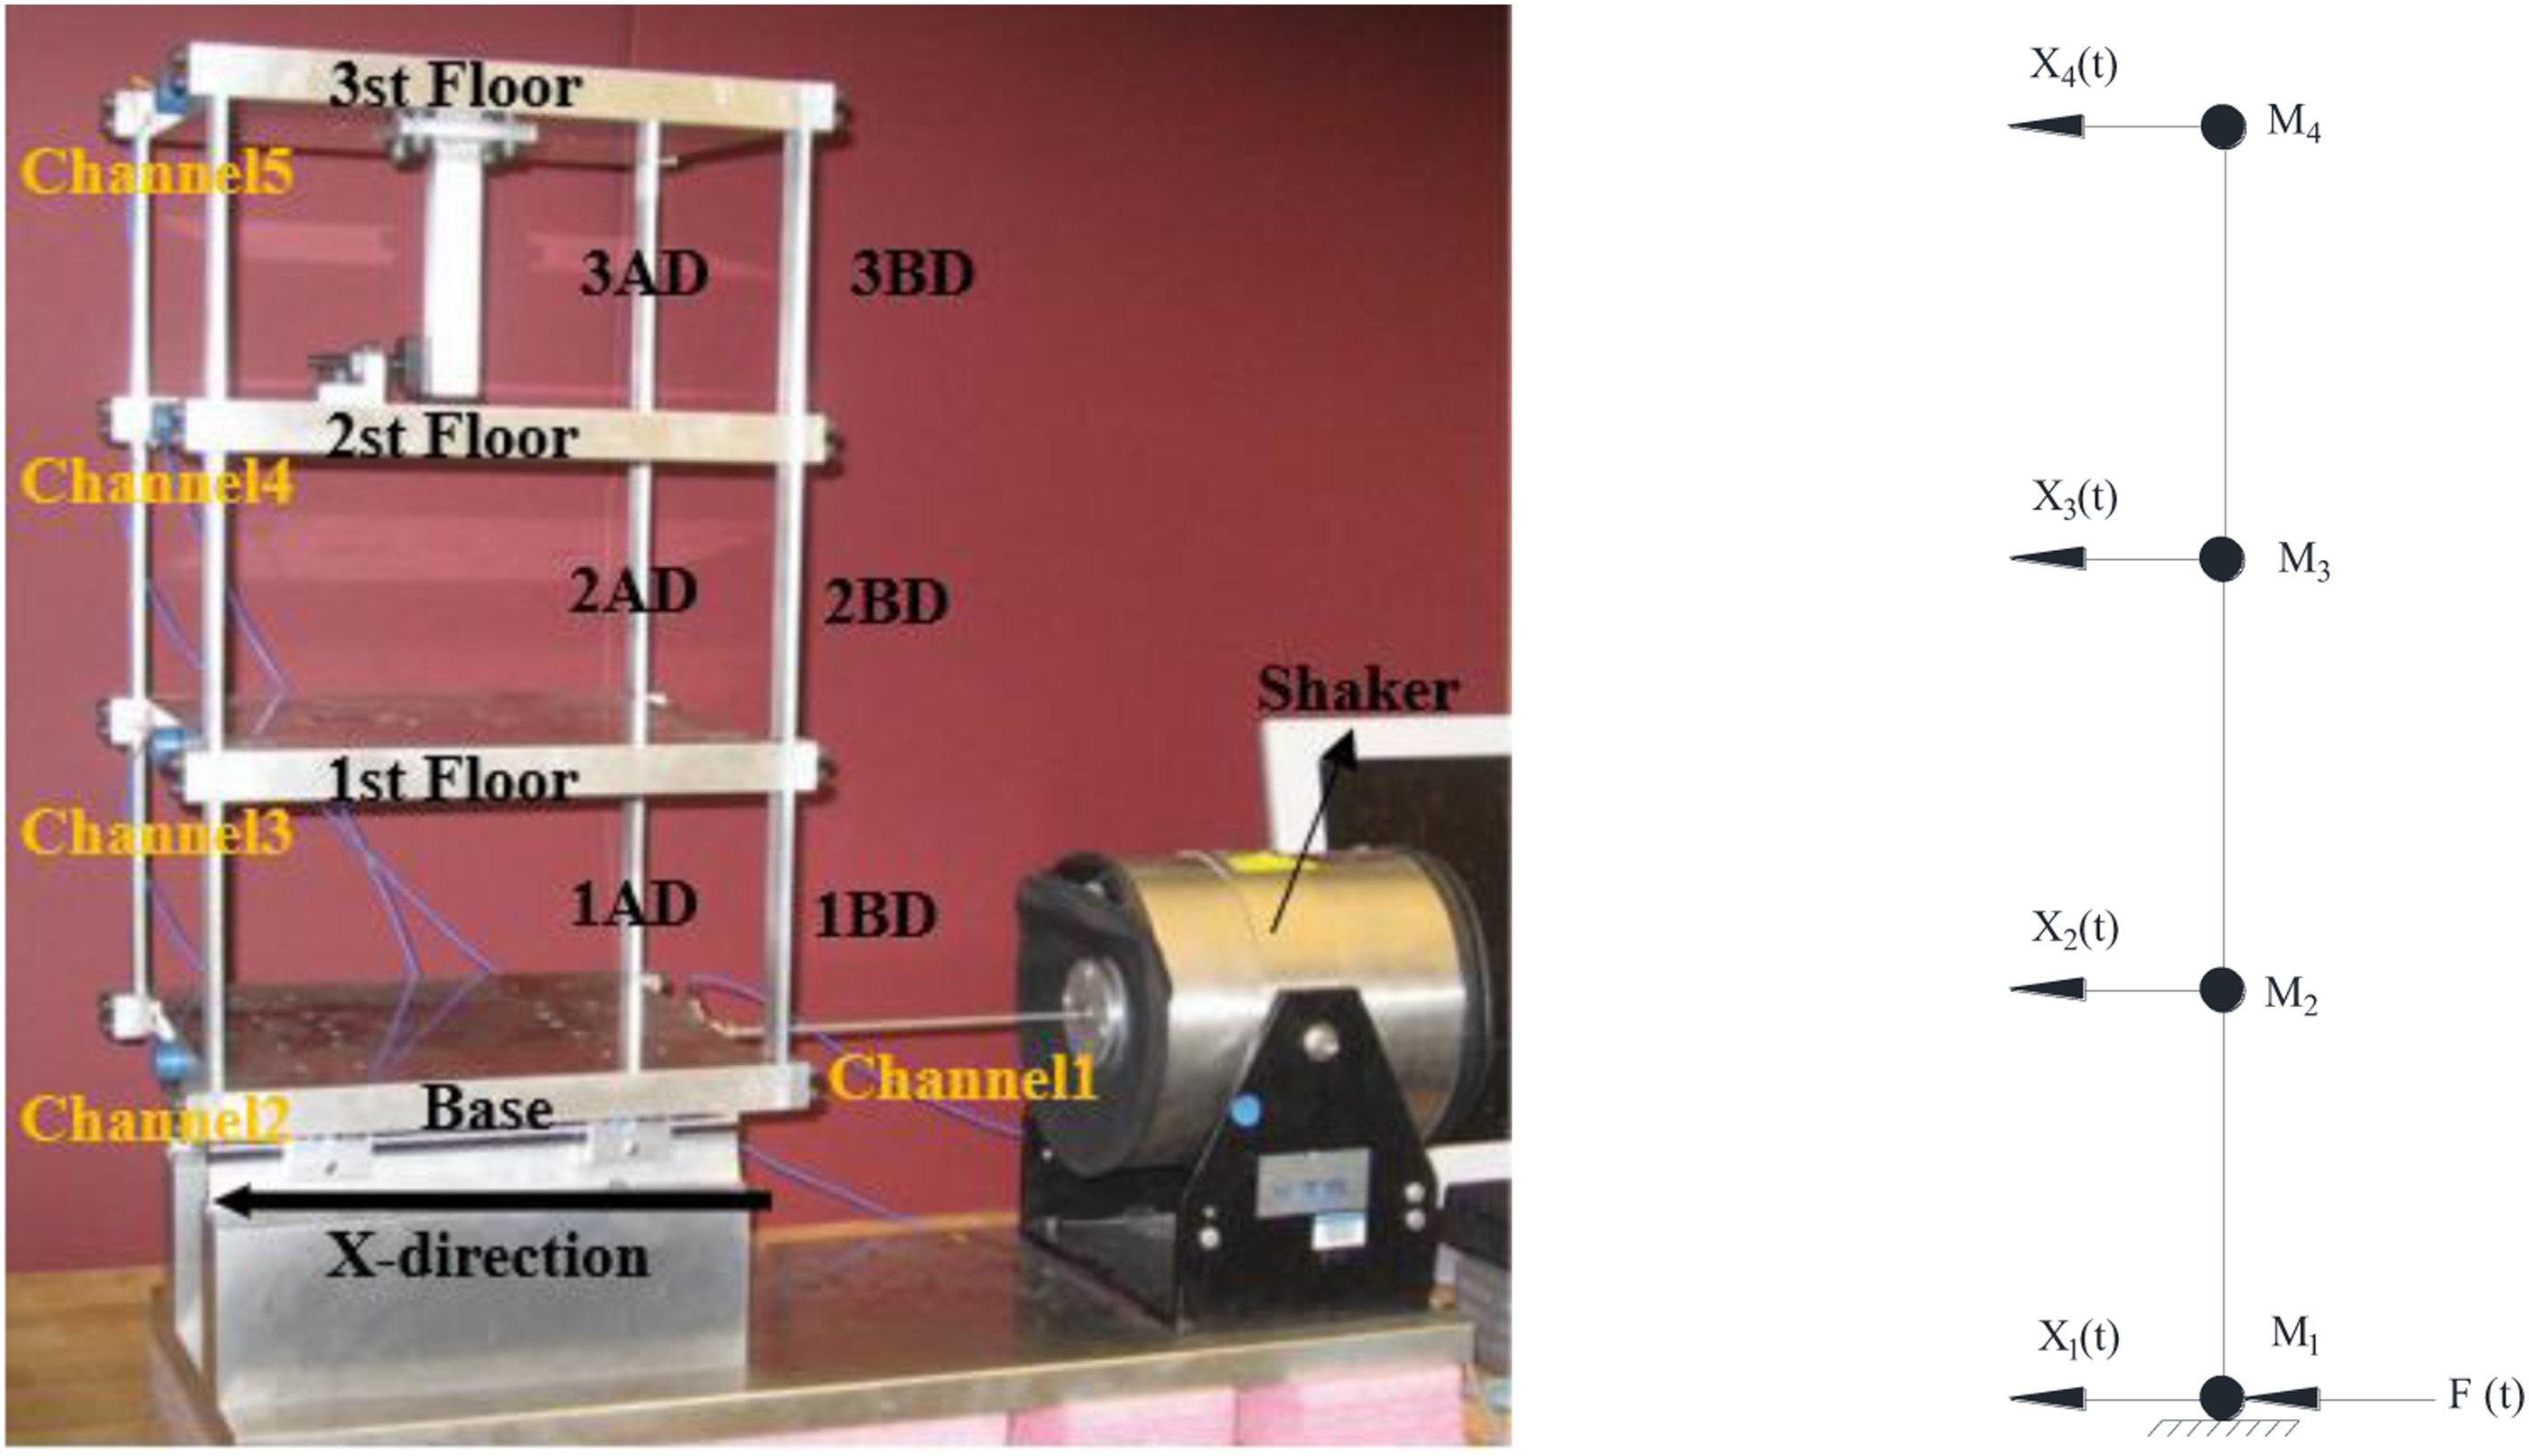
Data labels of the structural states.
The updated finite element model
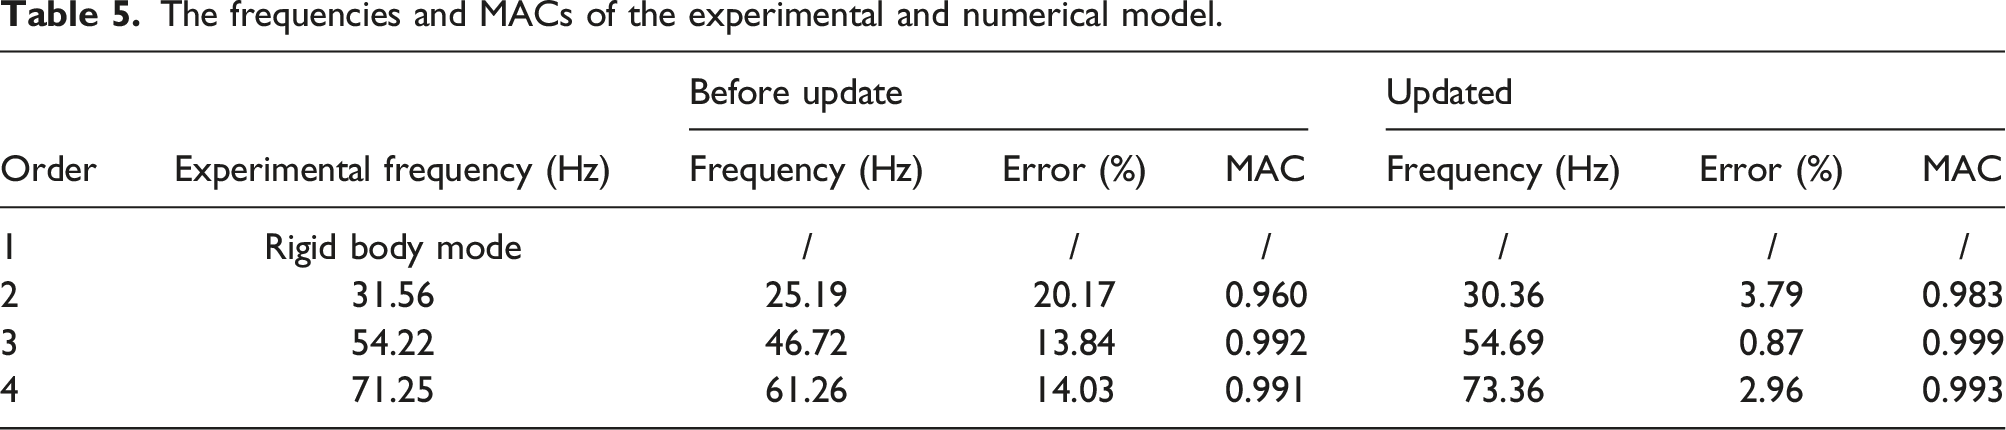
The frequencies and MACs of the experimental and numerical model.
Data generation for training
Performance evaluation results of the three-story frame structure.
Damage identification results
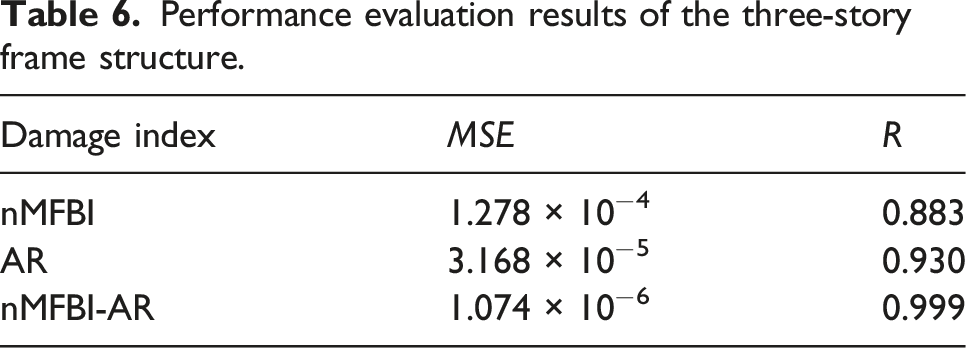
Figure 8 shows the training loss curves of the single-element damage case. It can be observed that the curve of nMFBI-AR has the best convergence performance, and the ultimate training loss is 2.839 × 10⁻³. In addition, Table 6 shows that the proposed approach has the best performance with the MSE (1.074 × 10⁻⁶) and R (0.999) of test datasets. These results indicate that the proposed approach has great potential for accurate SDI. The training loss curves of the three-story frame structure. The frequencies and MACs of the experimental and numerical model.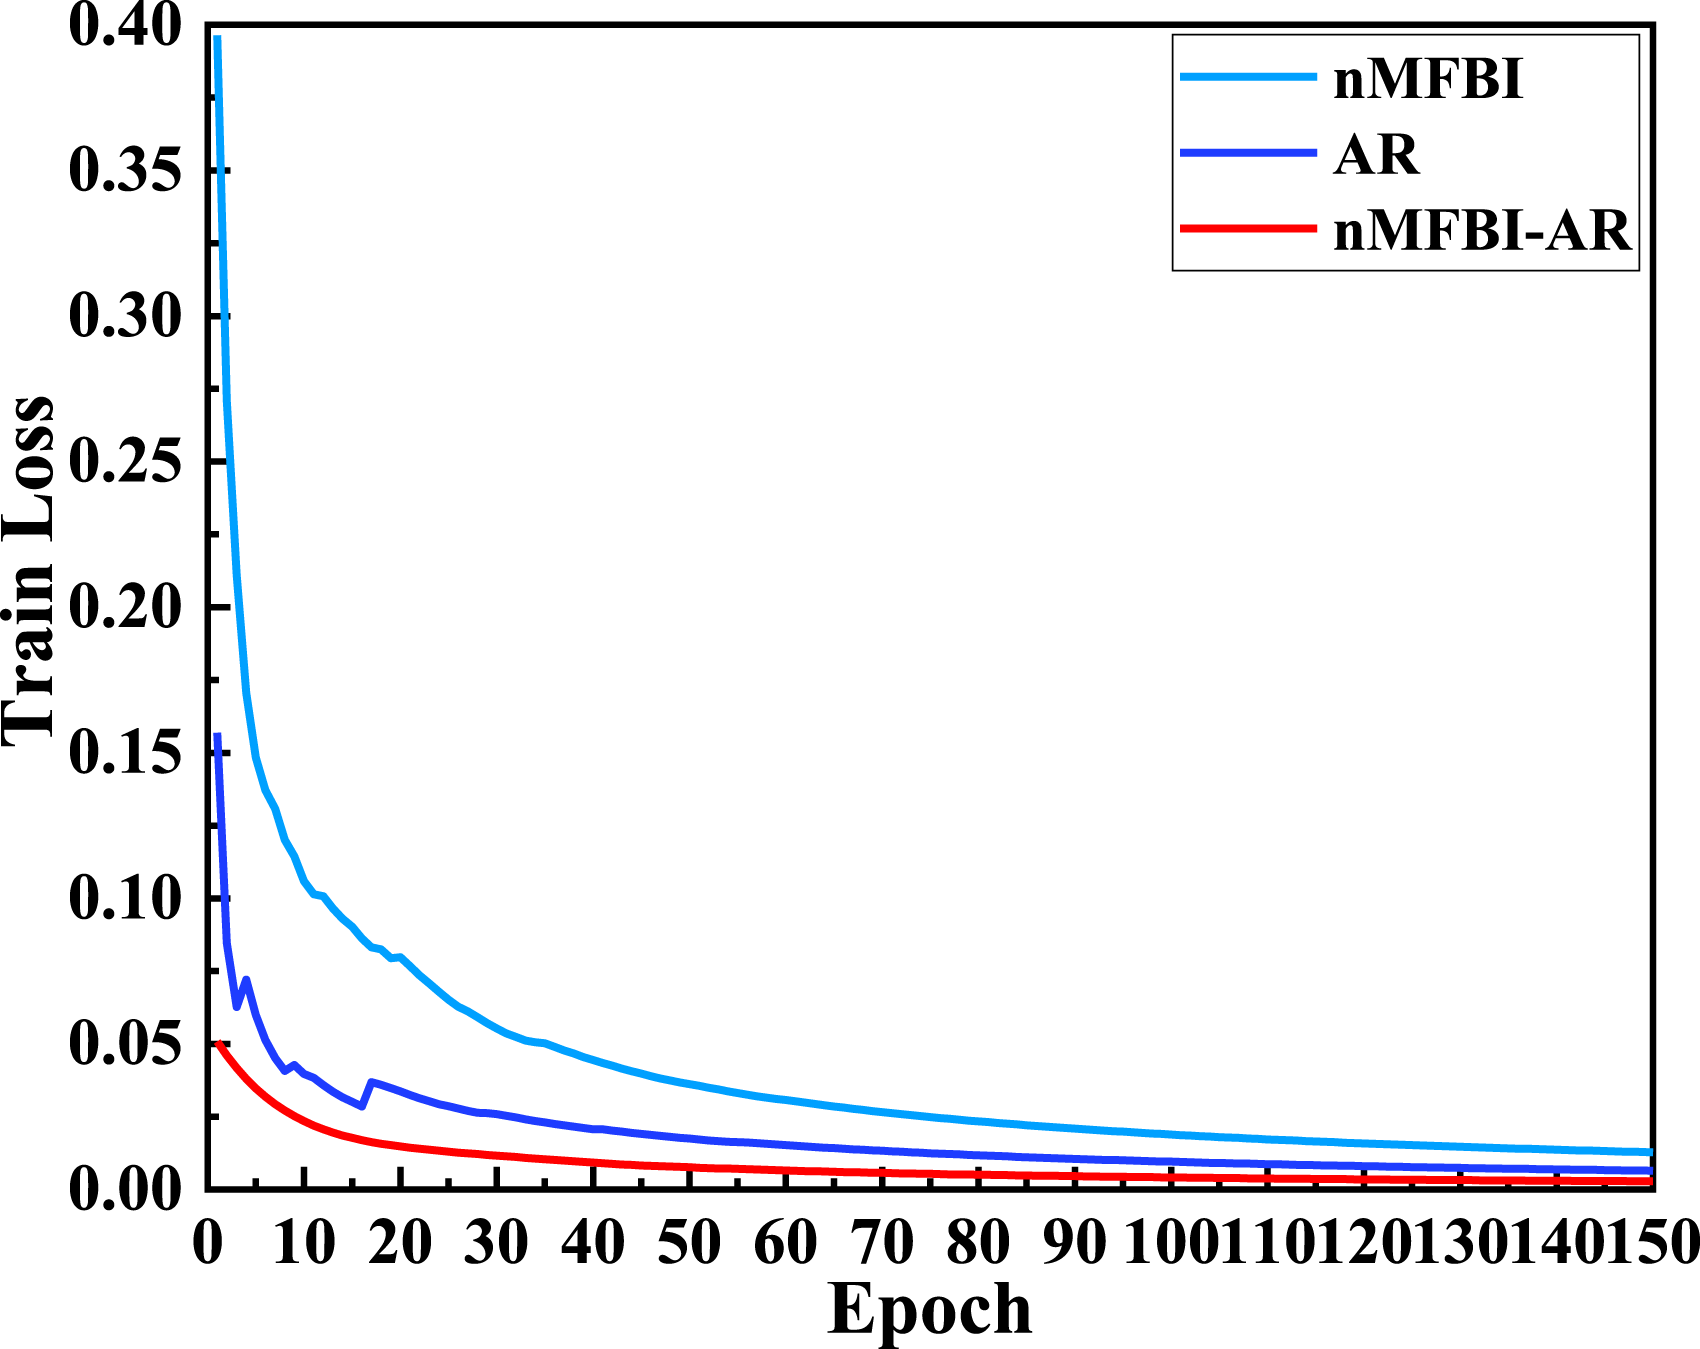
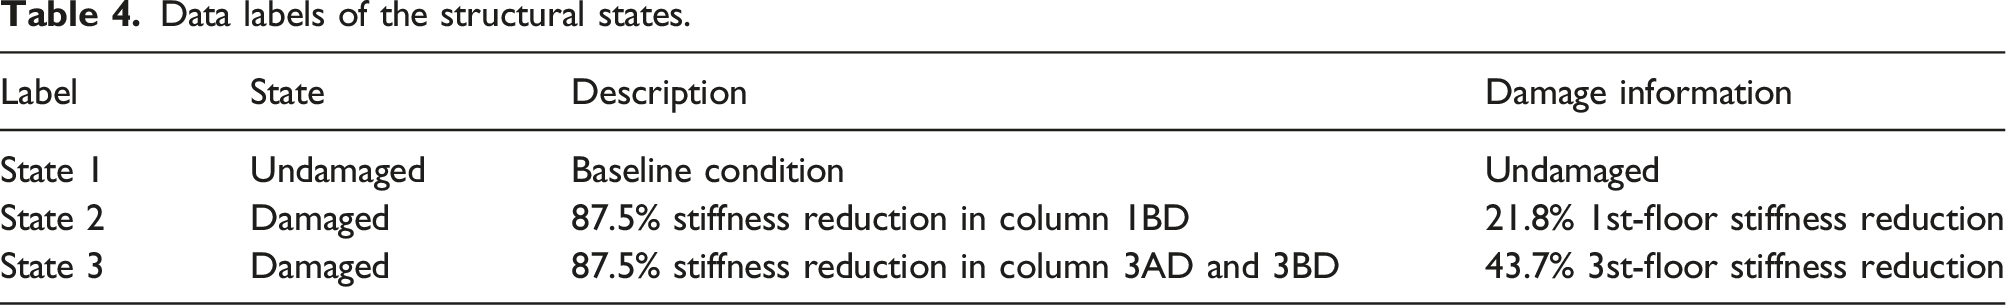
Two damage cases in the laboratory test, i.e., States 2 and 3, as shown in Table 4, are adopted to test the proposed approach. The results are shown in Figure 9. The identification errors of the nMFBI-AR index in State 2 and State 3 are only 1.33% and 0.27%, respectively. Thus, the experimental verification of the two damage cases illustrates that the proposed method can identify the structural damage in the practical application because the testing data measured from the experimental model already include ambient temperature variations and measurement noise (Ding et al., 2020). Damage identification results for the three-story frame structure. (a) State 2, (b) State 3.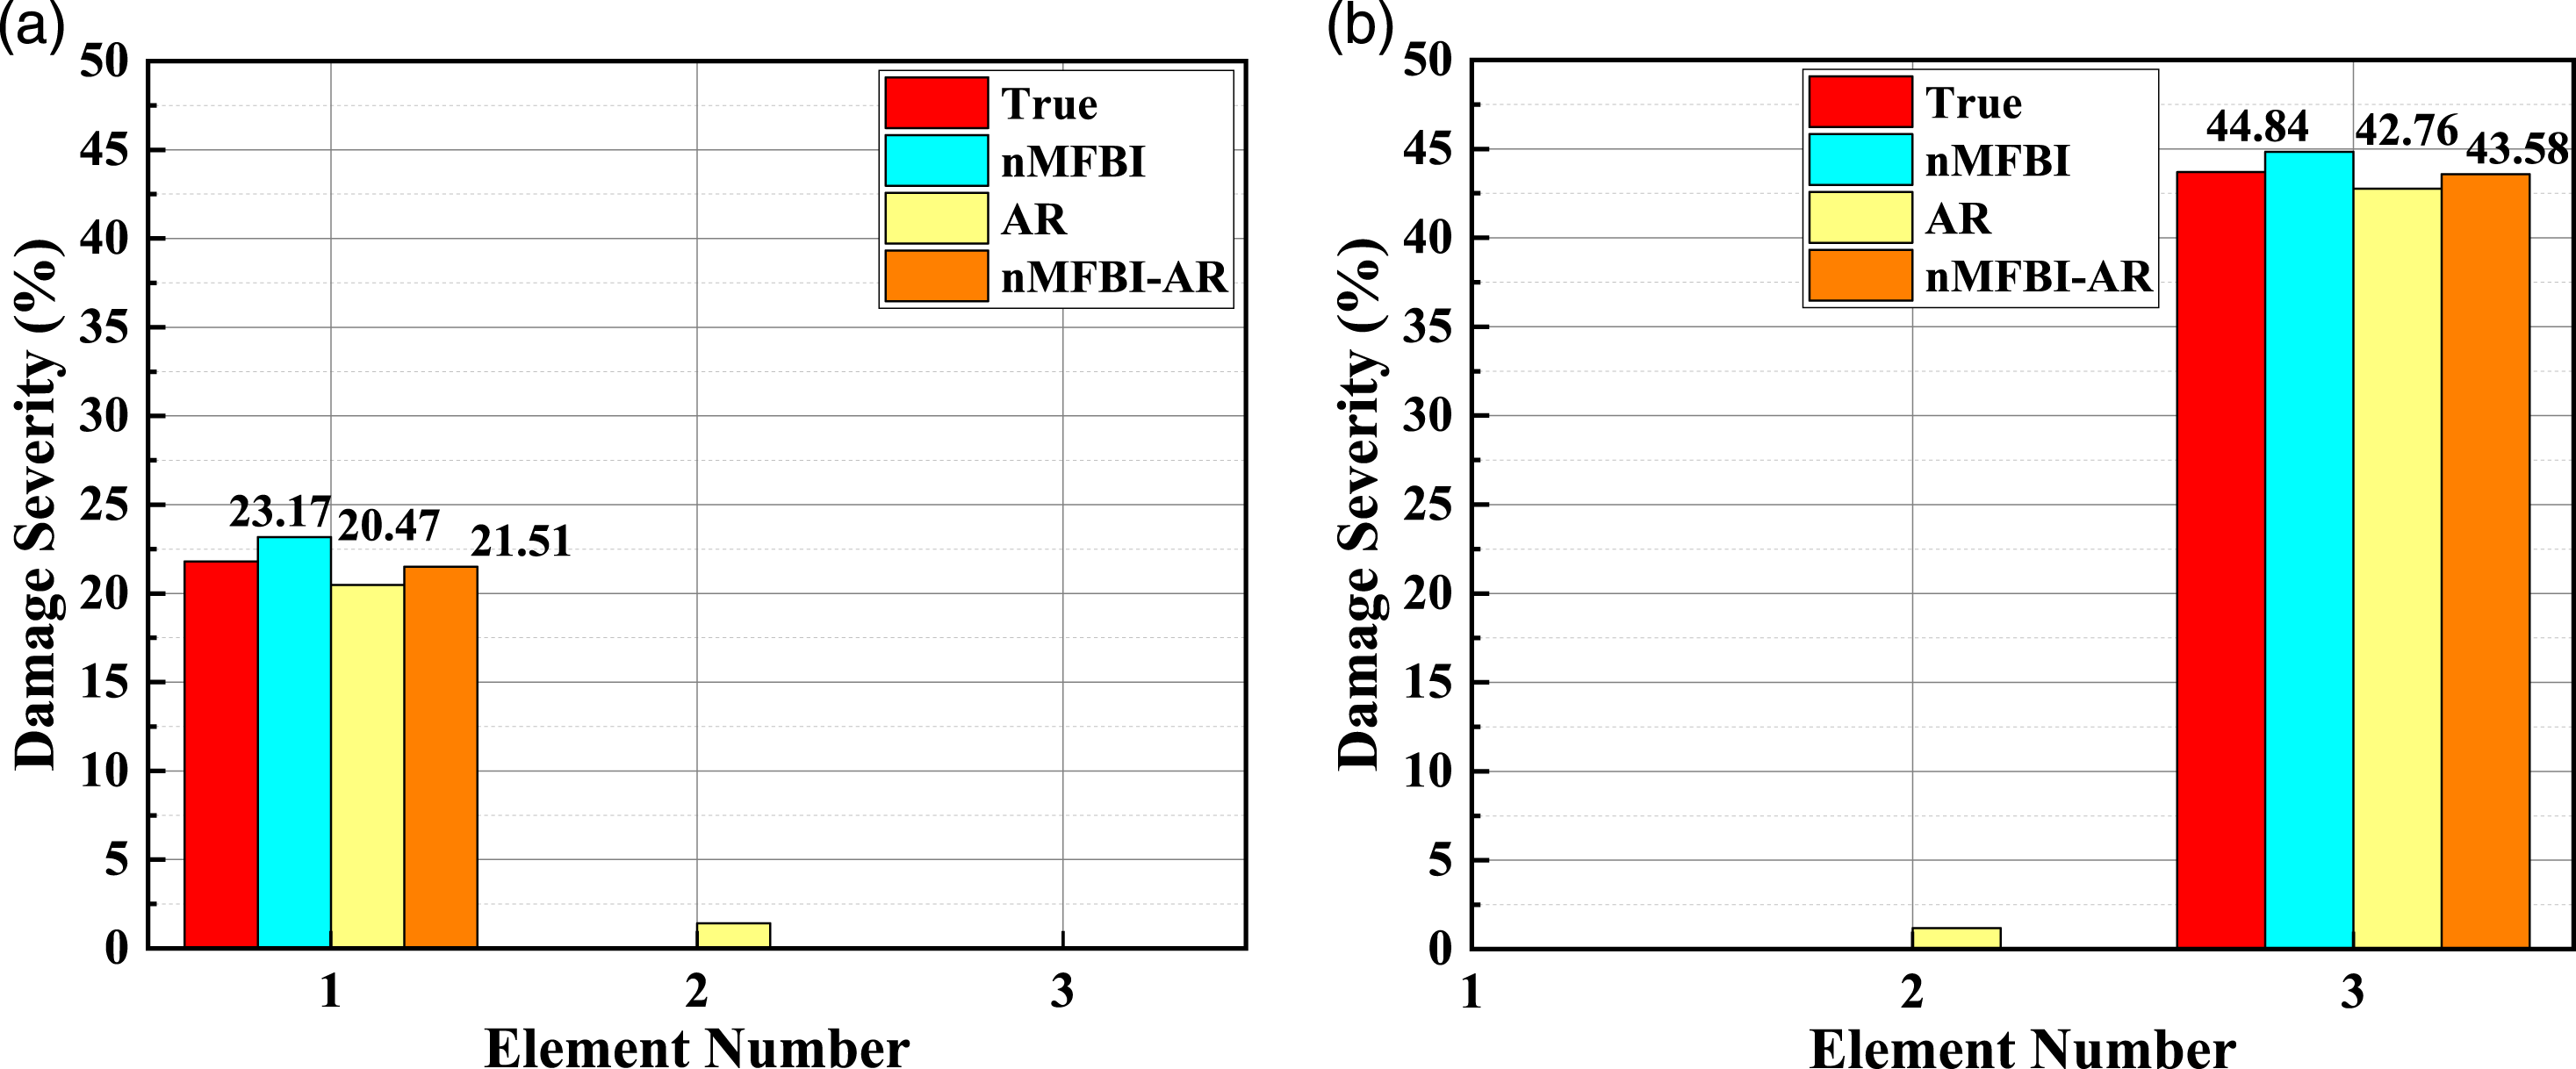
A continuous rigid frame bridge
As shown in Figure 10, a more complex structure, the Renyi Guijiang Bridge (a pre-stressed concrete continuous rigid frame bridge) is employed to further verify the feasibility of the proposed approach. The bridge is located in the ring expressway of Changzhou District, Wuzhou City, Guangxi Province. The main bridge has three spans of 64m + 120 m + 64 m, the piers and transition piers are double-leg thin-walled piers and thin-walled piers, respectively. The elevation of the continuous rigid frame bridge.
The acceleration data was collected by the DH5907 wireless vibration testing system. The working ambient temperature range of the testing system is 0∼60°C, which is suitable for environmental monitoring. The excitation was generated by a heavy truck, whose maximum velocity is 40 km/h. The layout of accelerometers is shown in Figure 11, and the acceleration responses are utilized to obtain the first three frequencies and mode shapes. Accelerometers layout of the continuous rigid frame bridge (Unit: cm).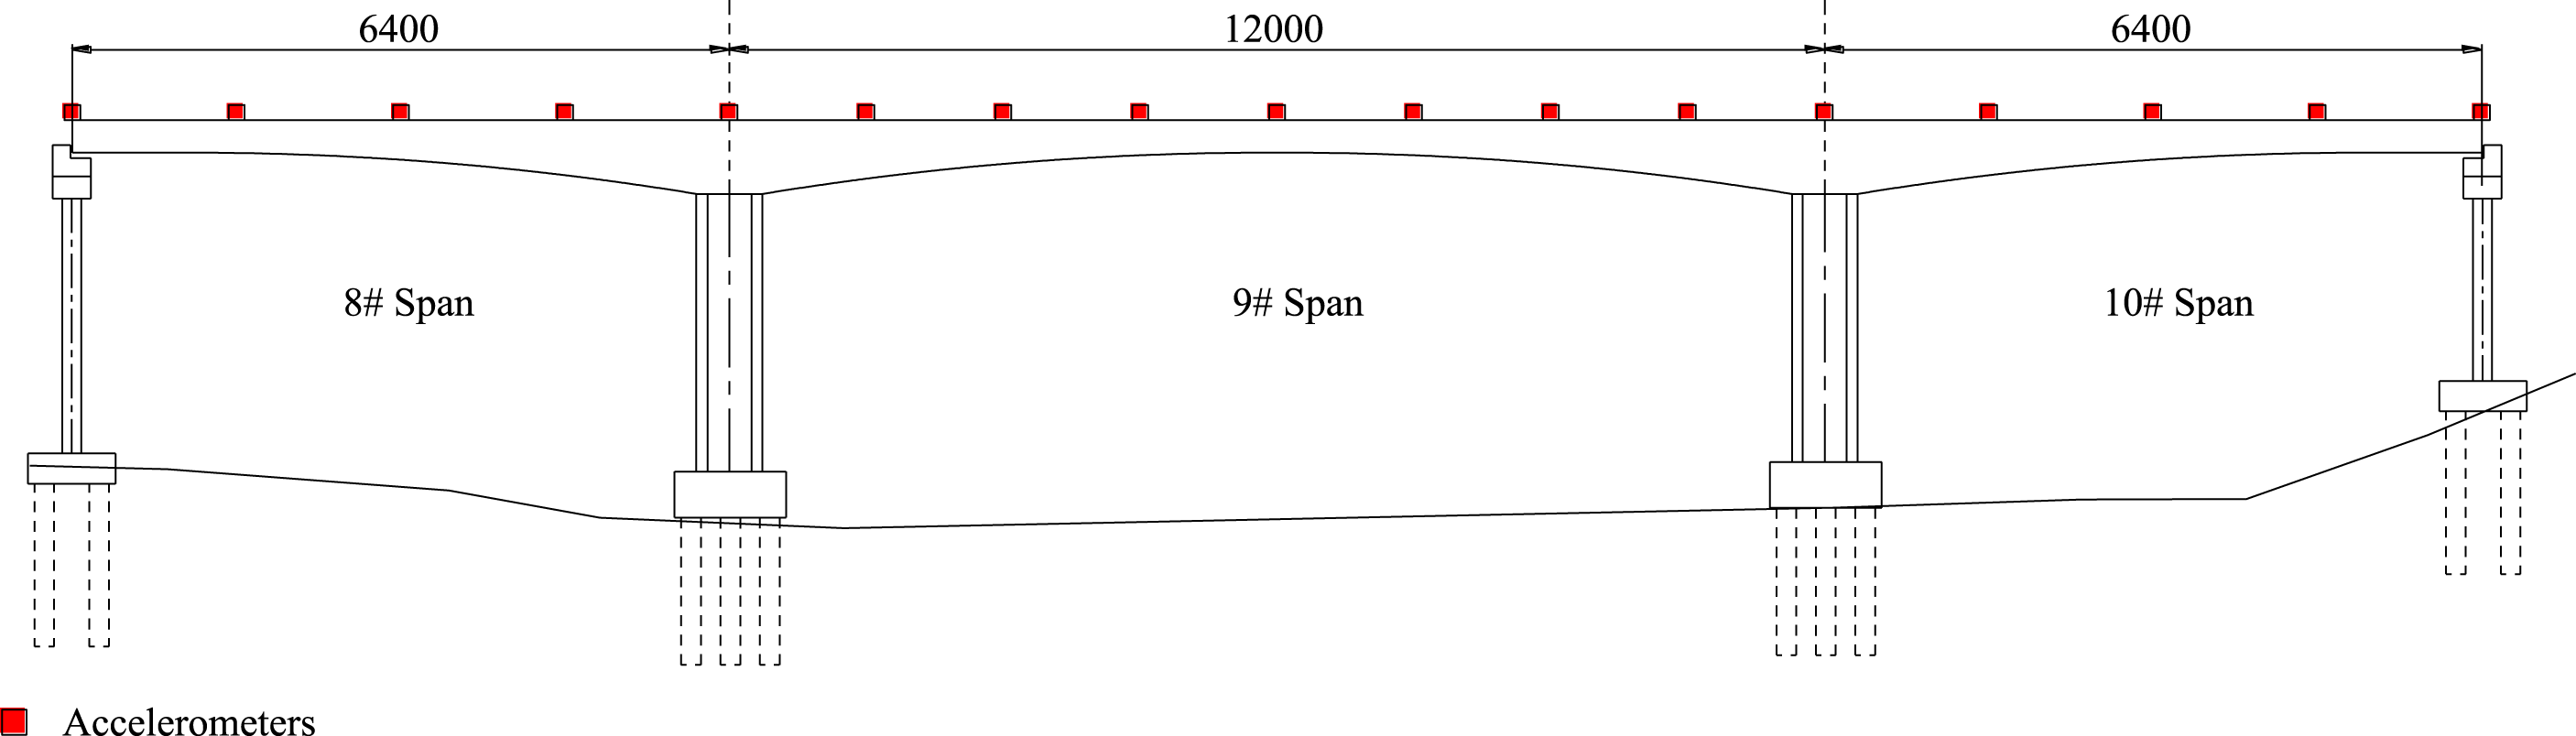
The updated finite element model
During the vibration test, the average ambient temperature was 28.25°C. The initial FEM is simulated using MATLAB. Both the superstructure and the piers are discretized by 3D beam elements with 2 nodes. The elastic modulus, Poisson’s ratio and material thermal coefficient are 3.465,375 × 1010 Pa, 0.2 and 10 × 10−6/°C, respectively. The mass densities of the superstructures and piers are 2500 kg/m3 and 2450 kg/m3, respectively. The superstructure and piers are discretized into 74 elements and 11 elements, respectively, and the main bridge has a total of 118 elements. For the simulation of boundary condition, it is assumed that the superstructure is fixed on the top of the piers; the translational DOFs in the vertical and transverse directions and the rotation DOFs in the vertical and longitudinal directions are constrained at both ends of the superstructure, respectively. Similarly, the PSO algorithm is used for model updating. The diagram of the FEM is shown in Figure 12. The diagram of the FEM.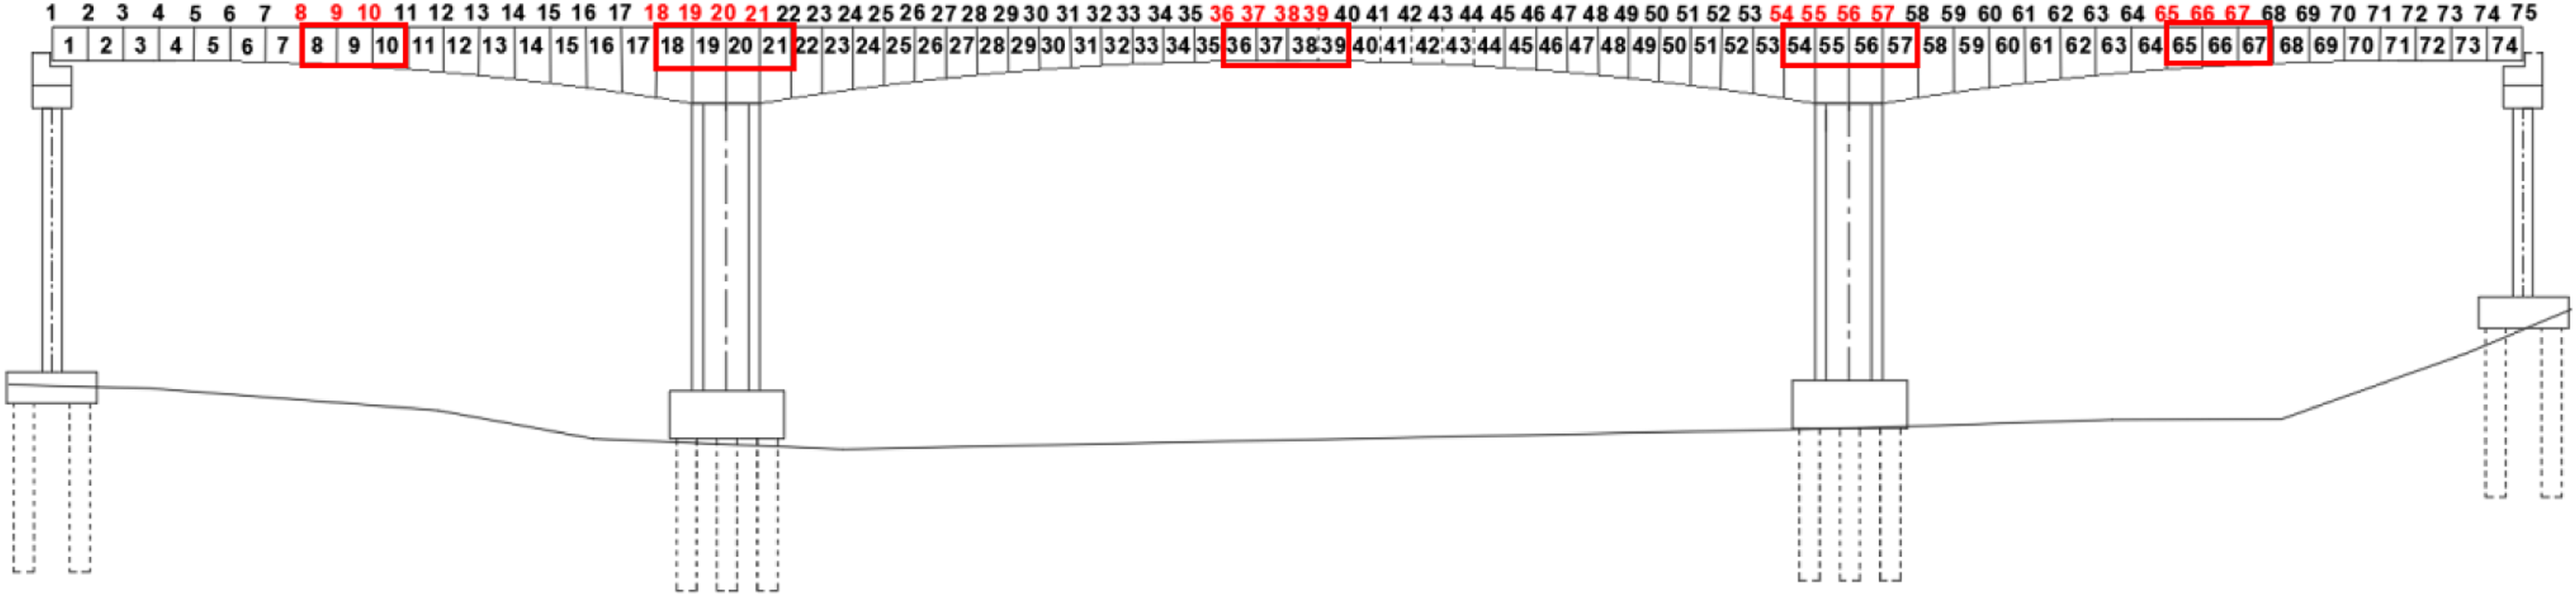
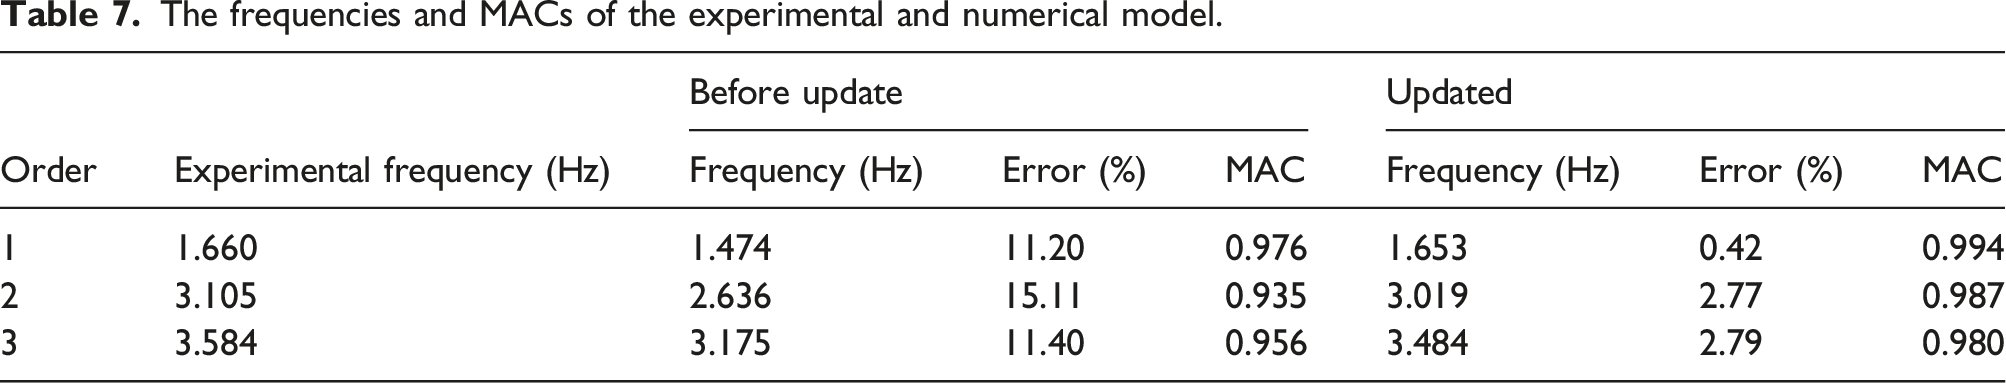
The updated results about frequencies and MACs are listed in Table 7. After updating, the maximum frequency error is 2.79%, and all the first three MACs are more than 0.98. Therefore, the updated FEM can accurately simulate the actual bridge.
Data generation for training
In practical engineering, structural damage generally occurs at 1/2 span of each span, and the top of the bridge piers. Regarding this, the damage is only introduced into the elements of 8, 9, 10, 18, 19, 20, 21, 36, 37, 38, 39, 54, 55, 56, 57, 65, 66, 67, as shown in the red boxes of Figure 12. The stiffness reductions are simulated from 0 to 5%. The damage elements and stiffness reduction parameters are randomly selected, and the maximum number of damaged elements is three. The vertical Gaussian noise is applied at the whole bridge to obtain the acceleration responses of nodes 8, 9, 10, 18, 19, 20, 21, 36, 37, 38, 39, 54, 55, 56, 57, 65, 66, 67, as shown in the red of Figure 12. The sampling frequency and sampling time are 1024 Hz and 20 s, respectively. Then, based on the SSI method and AR model, the damage indexes are calculated to train the network. The damage types, considered orders of AR coefficients and modal parameters, sample numbers, data split ratio, network architecture and hyper-parameters applied to train the network are the same as those in the fourth section. Therefore, the input dimensions of nMFBI, AR and nMFBI-AR indexes are respectively 1 × 18, 15 × 18 and 16 × 18 (1 × 18 + 15 × 18), and the output dimension is 18 × 1.
Furthermore, to verify the performance of the proposed method under the influence of ambient temperature variations and measurement noises. The environmental condition B, C and D (as defined in the fourth section, when the temperature gradient is considered, the ambient temperature increases from 0°C to 60°C) are considered in the updated FEM to generate the test datasets. When the CNN is trained, the test datasets are conducted to verify the feasibility and robustness of the proposed method.
Damage identification results
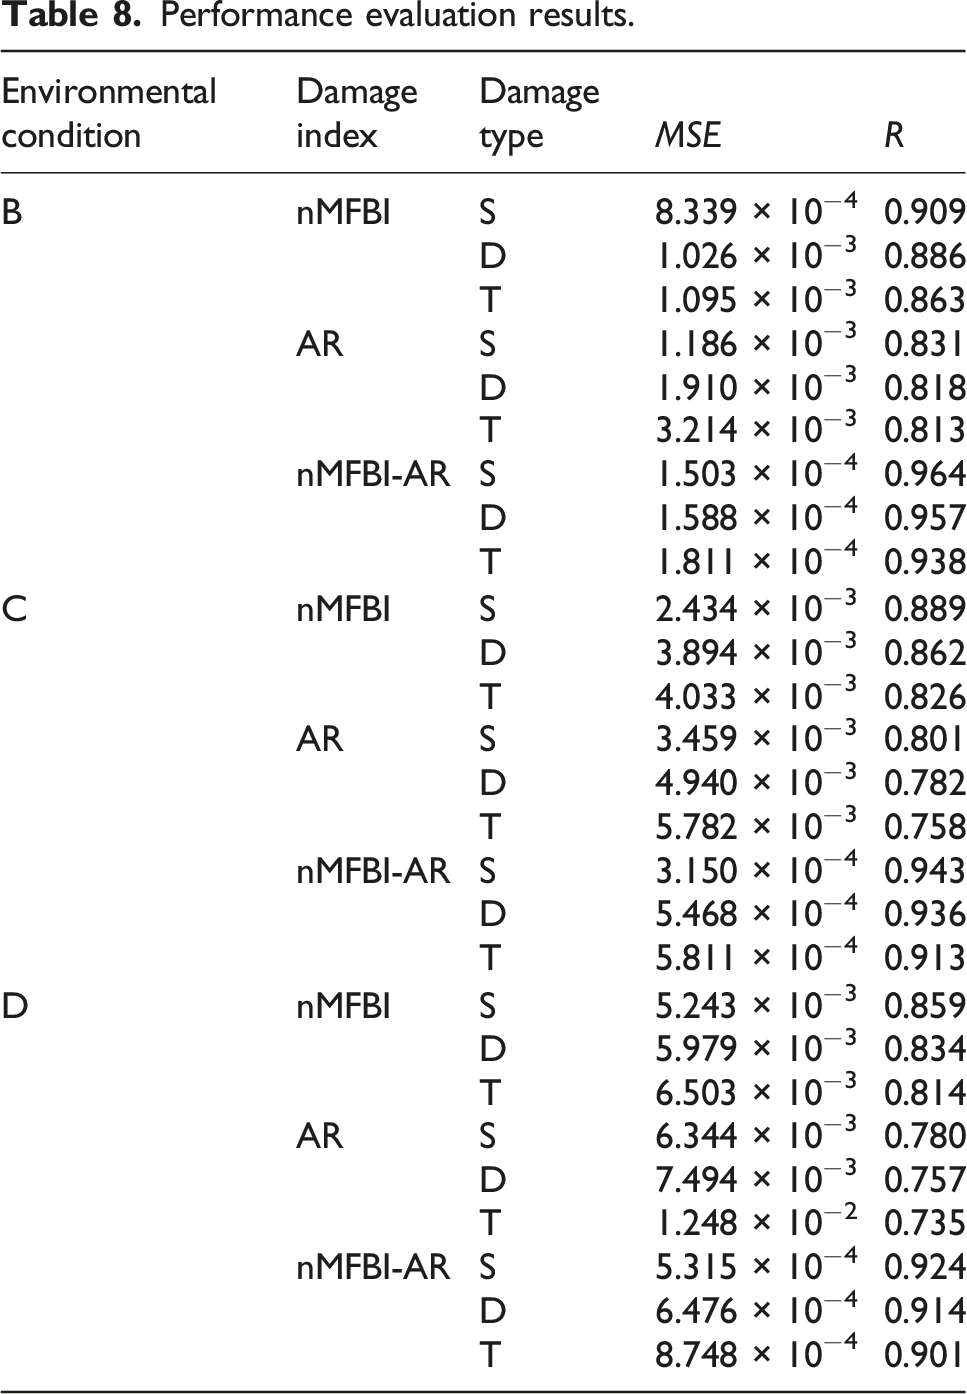
Figure 13 shows the training loss curves of this structure. It can be seen that the curve of the nMFBI-AR index shows the best convergence performance and the final training loss is less than 0.79. In addition, Table 8 presents the MSE and R of the test datasets. It can be shown that under different environmental conditions, the proposed approach has the best potential for damage identification with the highest R and the lowest MSE. Although in the most complex situation, namely, under the influence of temperature gradient and measurement noises, when three elements are damaged, the proposed approach also shows excellent performance with the MSE (8.748 × 10⁻⁴) and R (0.901). The training loss curves of the continuous rigid frame bridge. Performance evaluation results.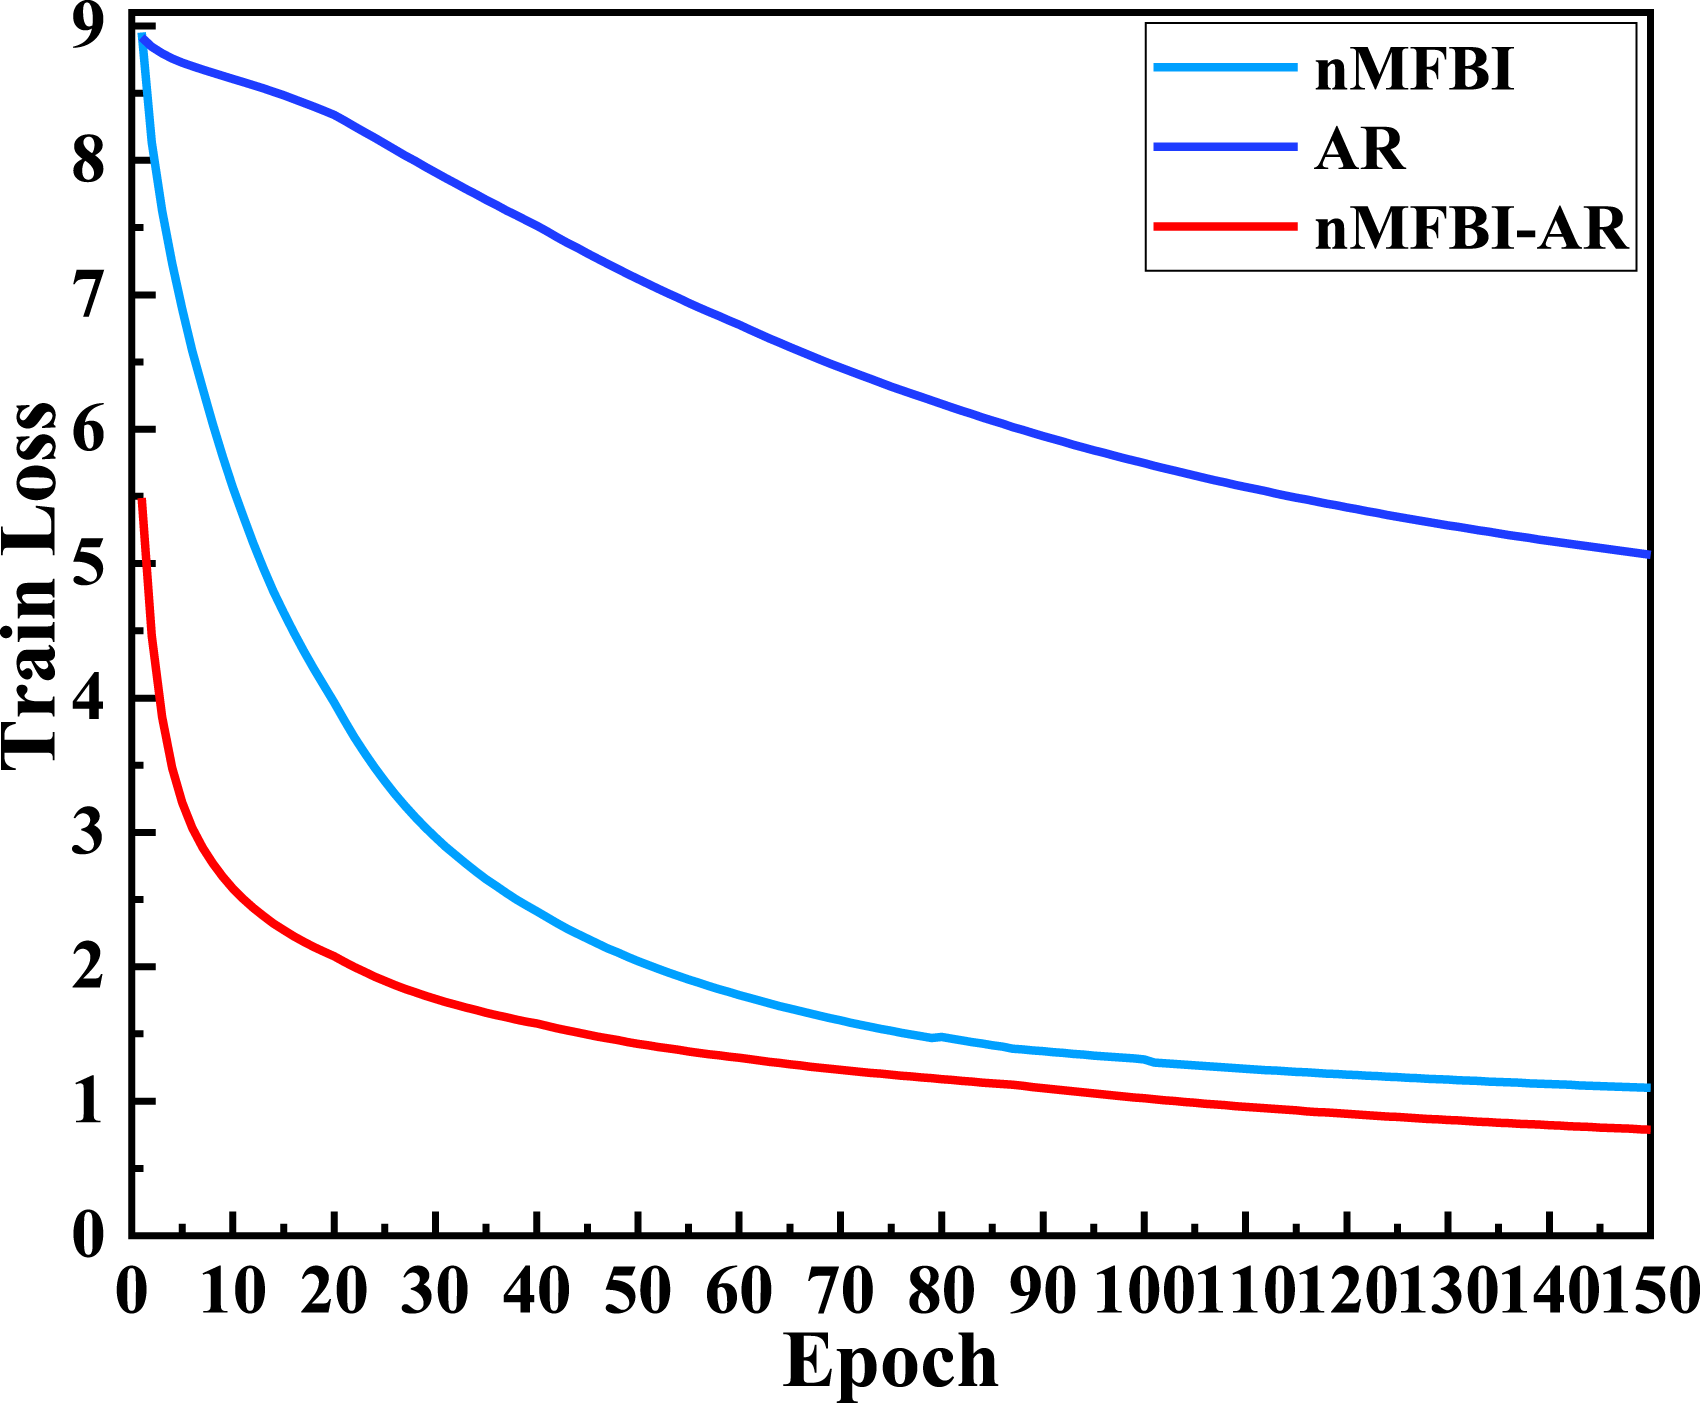
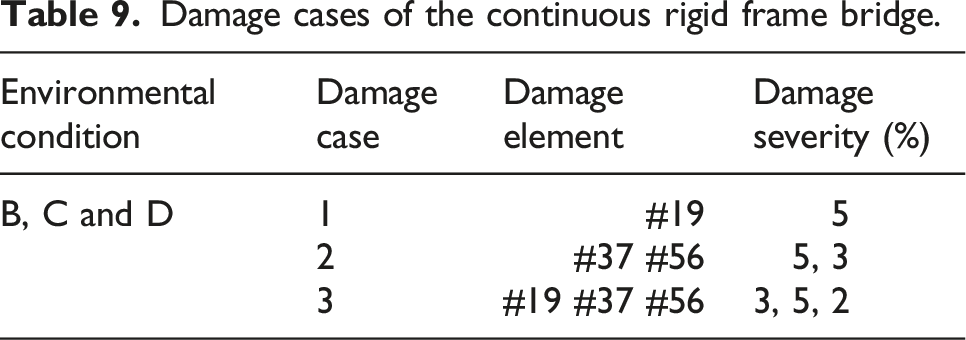
Damage cases of the continuous rigid frame bridge.
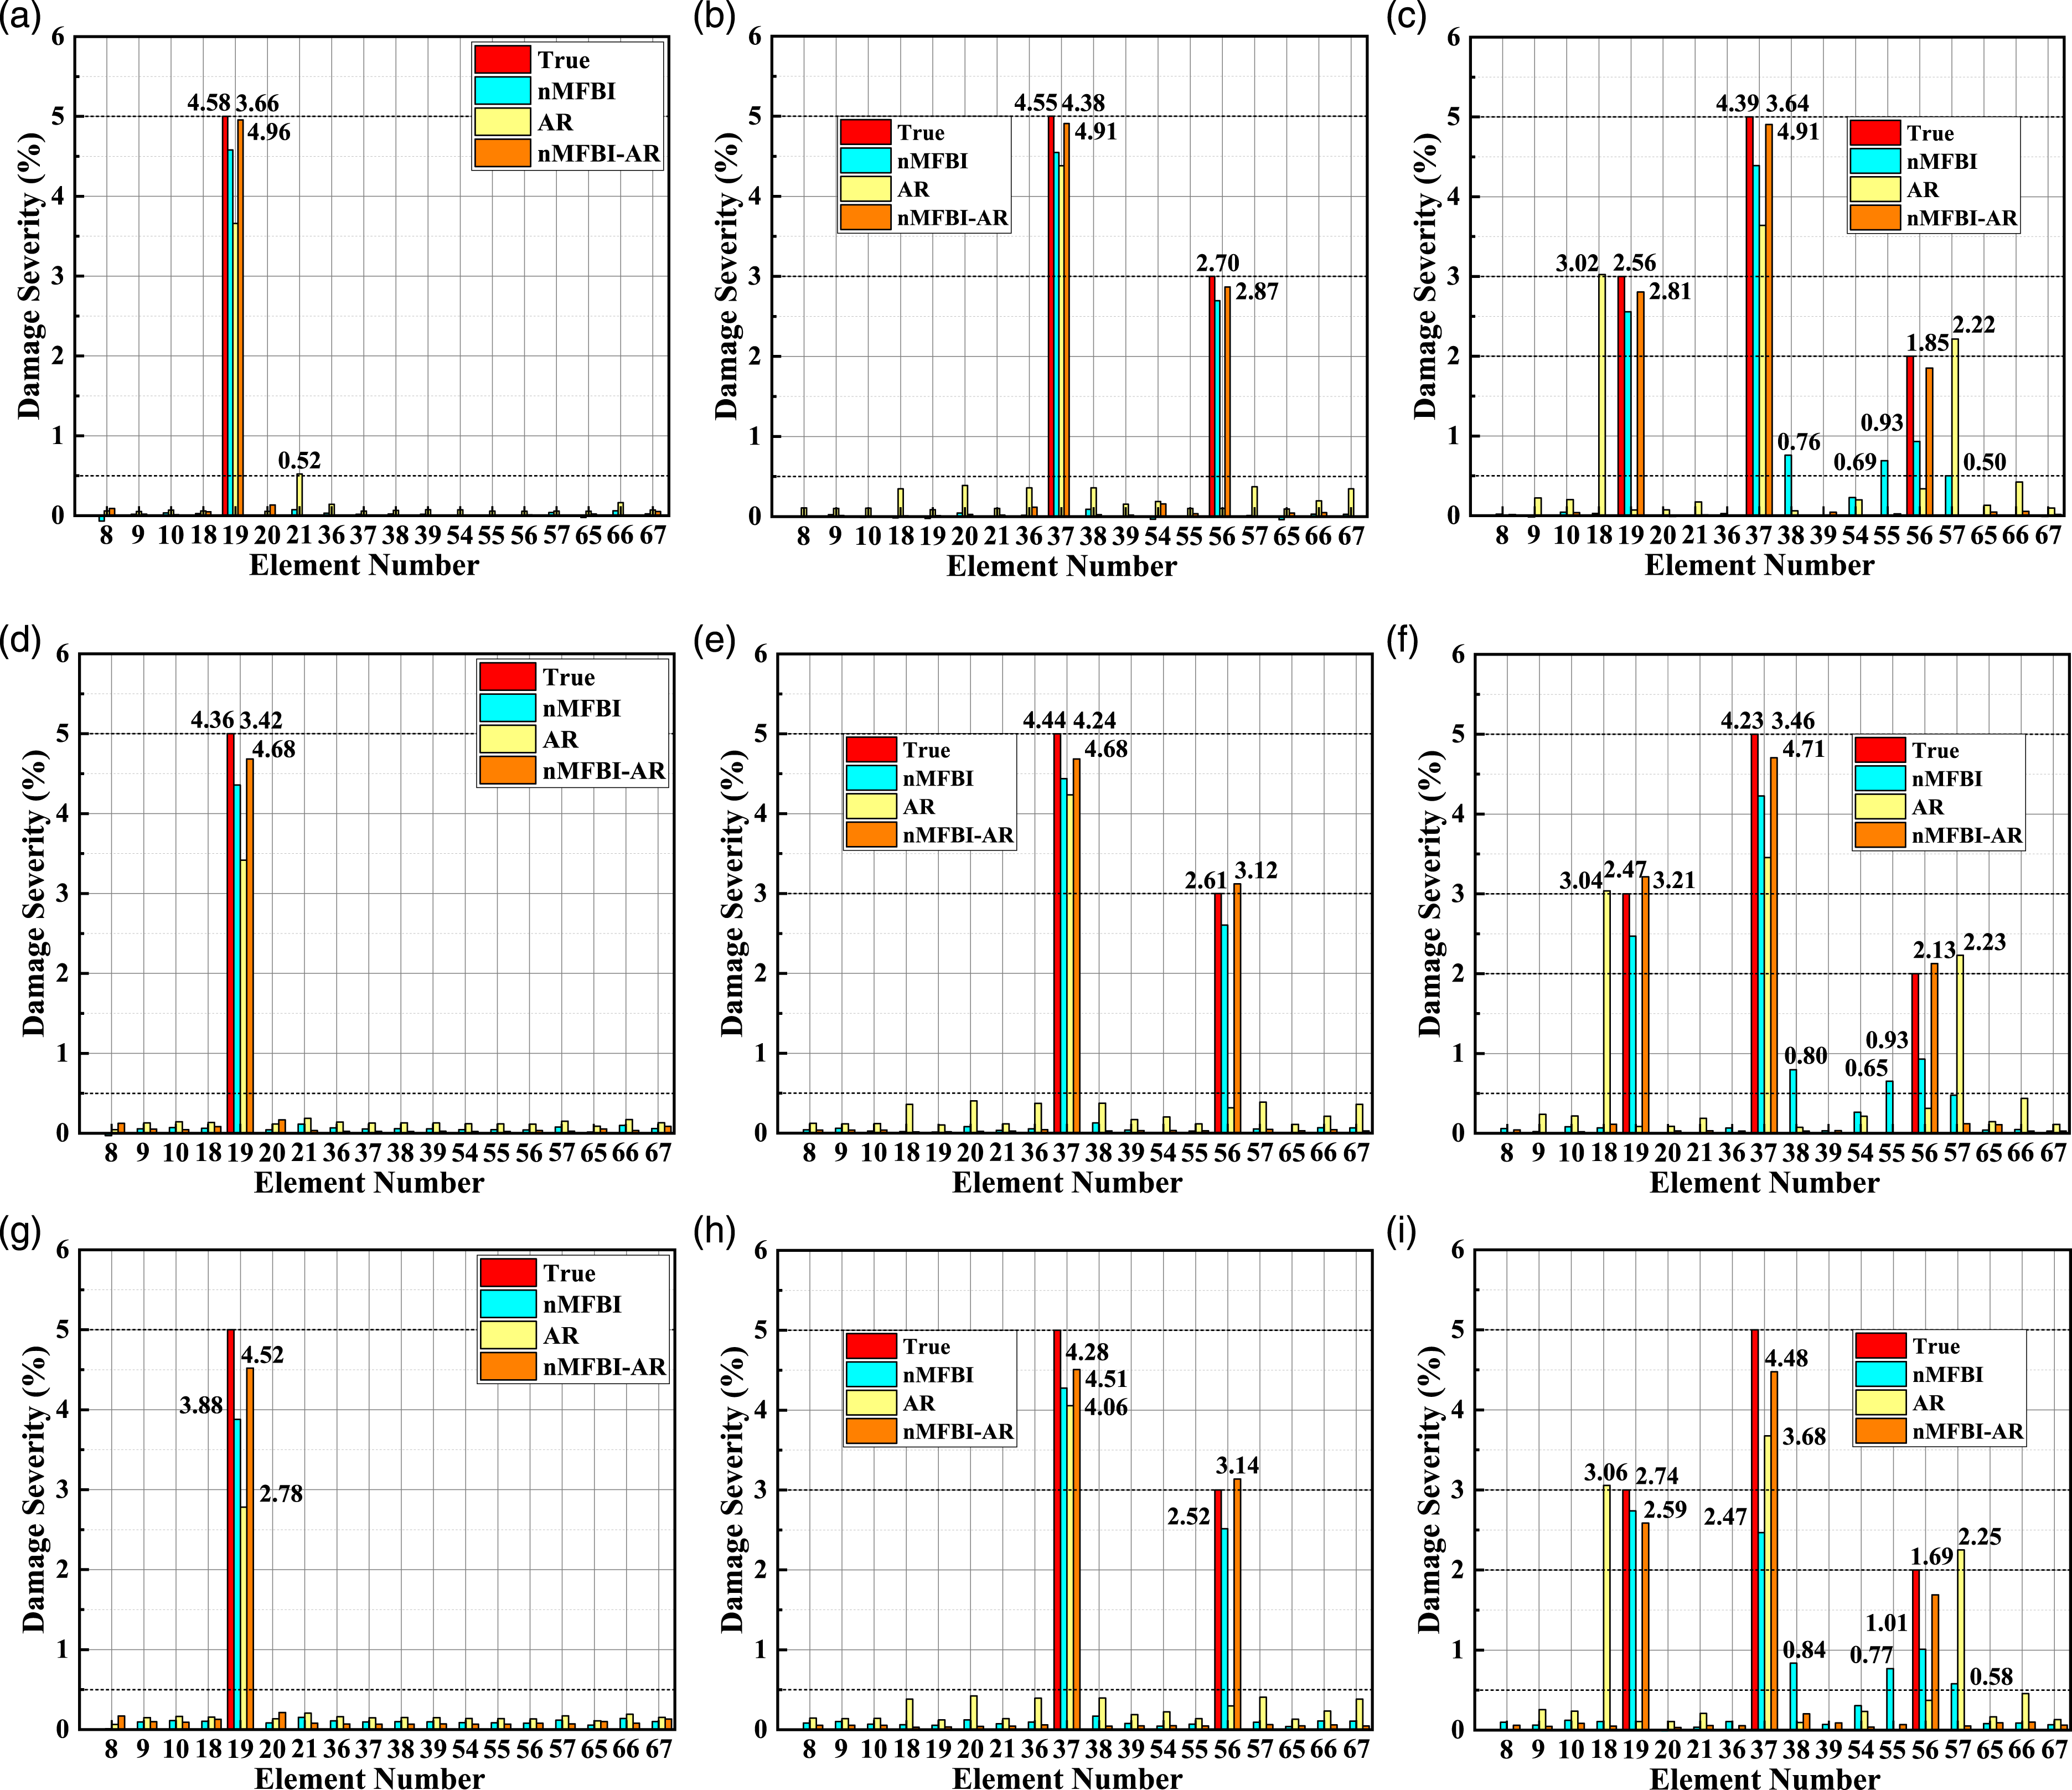
Damage identification results for the continuous rigid frame bridge. (a) B-1, (b) B-2, (c) B-3, (d) C-1, (e) C-2, (f) C-3, (g) D-1, (h) D-2, (i) D-3.
In summary, for the continuous rigid frame bridge, the nMFBI-AR index is also consistently superior to the nMFBI and AR indexes in localization and quantification of single-element and multiple-element damage under different environmental conditions. Although the performance of the nMFBI-AR index degrades slightly with the effect of ambient temperature variations and/or measurement noises, the maximum damage identification errors under the environmental conditions B, C and D are only 3.84%, 7.14% and 15.51%, respectively, which is acceptable. Therefore, under the influence of ambient temperature variations and measurement noises, the combination of frequency domain and time domain indexes can overcome the shortcomings of each single damage index. Meanwhile, although the influence of ambient temperature variations and measurement noise is not considered in the training datasets, the proposed method can identify the single and multiple-element damage accurately.
Conclusion
In this paper, combining CNN and normalized modal flexibility based index-autoregressive coefficients (nMFBI-AR), a novel approach is proposed to eliminate the influence of ambient temperature variations in structural damage identification (SDI). In addition, the influence of ambient temperature variations and measurement noises are only considered in the test datasets. The feasibility of this method is investigated by numerical simulation, experimental structure and practical engineering example. There are several conclusions can be summarized as follows: (1) A numerical structure of a simply-supported beam considering temperature variations and measurement noises, is investigated, and the SDI performance of the nMFBI-AR index is evaluated by making a comparison with the indexes of nMFBI and AR. The results show that the training loss curve of the nMFBI-AR index has the best convergence performance, and the final training loss is less than 50% of the other two indexes. The proposed method has the best accuracy and robustness for damage localization and quantification even if the ambient temperature variations and measurement noise are only considered in the test datasets. (2) A test model of a three-story frame and a practical engineering example of a continuous rigid frame bridge, are adopted to further verify the feasibility of the proposed method. The results demonstrate that although the influence of ambient temperature variations and measurement noises are only considered in the test datasets, the proposed method has the best performance in damage identification, and errors are less than 16%. (3) This study illustrates that the combination of the time domain index and frequency domain index can achieve more accurate damage identification through information fusion and complementation. In addition, the method is robust to measurement noises and the effects of temperature variations, even though these effects are not considered in the training dataset, which is preferable in practical engineering. However, in practical application, it is difficult to obtain the true structural damage, namely, the label of training. Besides, the models of different damage types are trained separately in this paper, which has high computational costs. Therefore, a low computation cost method based on unsupervised learning will be the focus of future studies.
Footnotes
Acknowledgments
The authors sincerely gratitude Yongzhi Lei of Curtin University for his help to this paper.
Declaration of conflicting interests
The author(s) declared no potential conflicts of interest with respect to the research, authorship, and/or publication of this article.
Funding
The author(s) disclosed receipt of the following financial support for the research, authorship, and/or publication of this article: This study was supported by the National Natural Science Foundation of China (Project No. 52178300), the Graduate Innovative Fund of Wuhan Institute of Technology (Project No. CX2022184), and the Anhui international joint research center of data diagnosis and smart maintenance on bridge structures (Project No. 2022AHGHYB08).
Data Availability Statement
The data used to support the findings of this study are available from the corresponding author.