
Abstract
Lacing reinforcement plays a critical role in the design and performance of reinforced concrete (RC) slabs by distributing the applied loads more evenly across the slab, ensuring that no specific area of the slab is overloaded. In this study, nine slabs, divided into three groups according to the investigated parameters, were meticulously designed and evaluated to study the interplay between the lacing reinforcement and other key parameters. Each slab was crafted for simple support and was subjected to both static and repeated two-point load tests. The lacing reinforcement had an angle of 45° with various tension and lacing steel. The repeated-tested specimens with lacing reinforcement experienced smaller ductility than those of similar static-tested specimens, where the reduction in ductility factor ranged between 8.4% and 22.3% for all specimens. Additionally, the tested slabs were analyzed numerically using the ABAQUS software package. The validated FE test program was used to study the effect of varying the lacing reinforcement ratio, the compressive strength of concrete, and the material types of the tension and lacing reinforcements. The lacing reinforcement becomes more effective in increasing the slab capacity when using the higher compressive strength of concrete.
Keywords
Introduction
Reinforced concrete slabs with lacing systems typically refer to a structural engineering technique used to strengthen and support concrete slabs. The lacing system comprises a network of steel bars or other structural members arranged in a crisscross pattern within or beneath the concrete slab. This reinforcement system enhances the slab’s load-carrying capacity, resistance to deflection, and overall structural integrity (Allawi et al., 2023). Moreover, the lacing system evenly distributes loads and reduces the span of the concrete slab between support points. This helps prevent excessive deflection and potential structural failure. Reinforced concrete slabs with lacing systems are commonly used in heavy-duty applications such as industrial floors, warehouse floors, parking garages, and areas where heavy machinery or equipment is operated. The lacing system helps the slab withstand heavy loads, prevents cracking or sagging, and enhances the durability and longevity of the concrete slab by minimizing cracking, reducing deflection, and improving resistance to wear and tear. Also, lacing systems resist dynamic loading such as vibrations, cyclic loading, and repeated loading, which leads to fatigue failure over time if not properly addressed, such as the movement of heavy vehicles or machinery (Hallawi and Al-Ahmed, 2019).
A brief review of the previous studies dealing with the behavior of laced reinforced concrete members under static loading is presented by discussing the previous experimental investigations. Improvements in the ductility of the flexural members due to lacing reinforcement were the main conclusion (Parameswaran et al., 1986). Moreover, the end support rotations varied between 6° and 8°. The lacing reinforcement technique was very effective for the blast resistance of RC structures (Keshava Rao et al., 1992). The post-ultimate behavior of the slabs with lacing reinforcement obtained a substantial amount of reserve capacity (Woodson, 1992; Woodson, 1994). The behavior of laced RC concrete beams with steel fibers was investigated (Lakshmanan, 2008). Adding steel fibers improved the energy absorption characteristics without much strength degradation. Anandavlli et al., (2012a) suggested a new system of composite construction consisting of thin steel cover plates with slots where the lacing steel reinforcement passes through it and is kept in locations by using cross steel bars, thereafter the concrete was poured between the two steel plates, this system was named Laced Steel-Concrete Composite. The new technique showed better ductility relative to the conventional one. Madheswaran et al. (2015) demonstrated the proper technique to satisfy the ductile failure of the laced reinforced geopolymer concrete beams. Previous investigations were conducted on RC slabs with lacing reinforcement and under repeated loading. The cyclic load reduced stiffness, failure load, and ultimate deflection of the tested slabs with lacing reinforcement relative to the specimens under monotonic loading only (Adom-Asamoah and Kankam, 2009). The flexural behavior of one-way slabs reinforced with GFRP rebars, subjected to monotonic and repeated loads was investigated (Sivagamasundari and Kumaran, 2008; Sivagamasundari and Kumaran, 2011). The concrete slabs with GFRP rebars obtained better fatigue capacity in comparison to the steel rebars case. Analysis and design procedures for RC slabs with lacing reinforcement and subjected to blast pressure were suggested by Salih et al. (2006). This evaluation adopted the single degree of freedom analysis (SDOF). Thirumalaiselvi and Anandavalli (2013) developed an analytical FE model of the lacing reinforcement system under static loading by utilizing a beam, shell, and solid elements. The suggested model was reliable for supporting the applied loads and the loads were lumped and applied in increments.
Lacing reinforcement in RC slabs wasn’t a widely recognized or prevalent topic in the academic literature related to structural engineering and reinforced concrete design. Typically, lacing reinforcement has been associated with bundled bars in columns rather than in slabs. Moreover, the available data on integrating lacing reinforcement in concrete slabs and their response to cyclic loading is currently limited in the public domain. Based on the existing experiments, there is a pressing need for further tests to comprehensively grasp how various parameters influence the performance of these slabs. Therefore, a total of nine slabs were designed and tested to reflect the interaction of the lacing reinforcement with the other primary parameters. All slabs were designed to be simply supported and tested under static and repeated two-point loading. Moreover, the tested slabs were analyzed numerically using the ABAQUS software package. The numerical results were compared with experimental results to confirm the FE models’ accuracy. The geometric and mechanical properties of the concrete slab and reinforcement used in the finite element analysis were the same as those of experimental specimens. The validated FE test program was used to study the effect of varying the lacing reinforcement ratio, the compressive strength of concrete, and the material types of the tension and lacing reinforcements, such as Glass Fiber Reinforced Polymer (GFRP) and Carbon Fiber Reinforced Polymer (CFRP).
Experimental program
Preparation of slab specimens
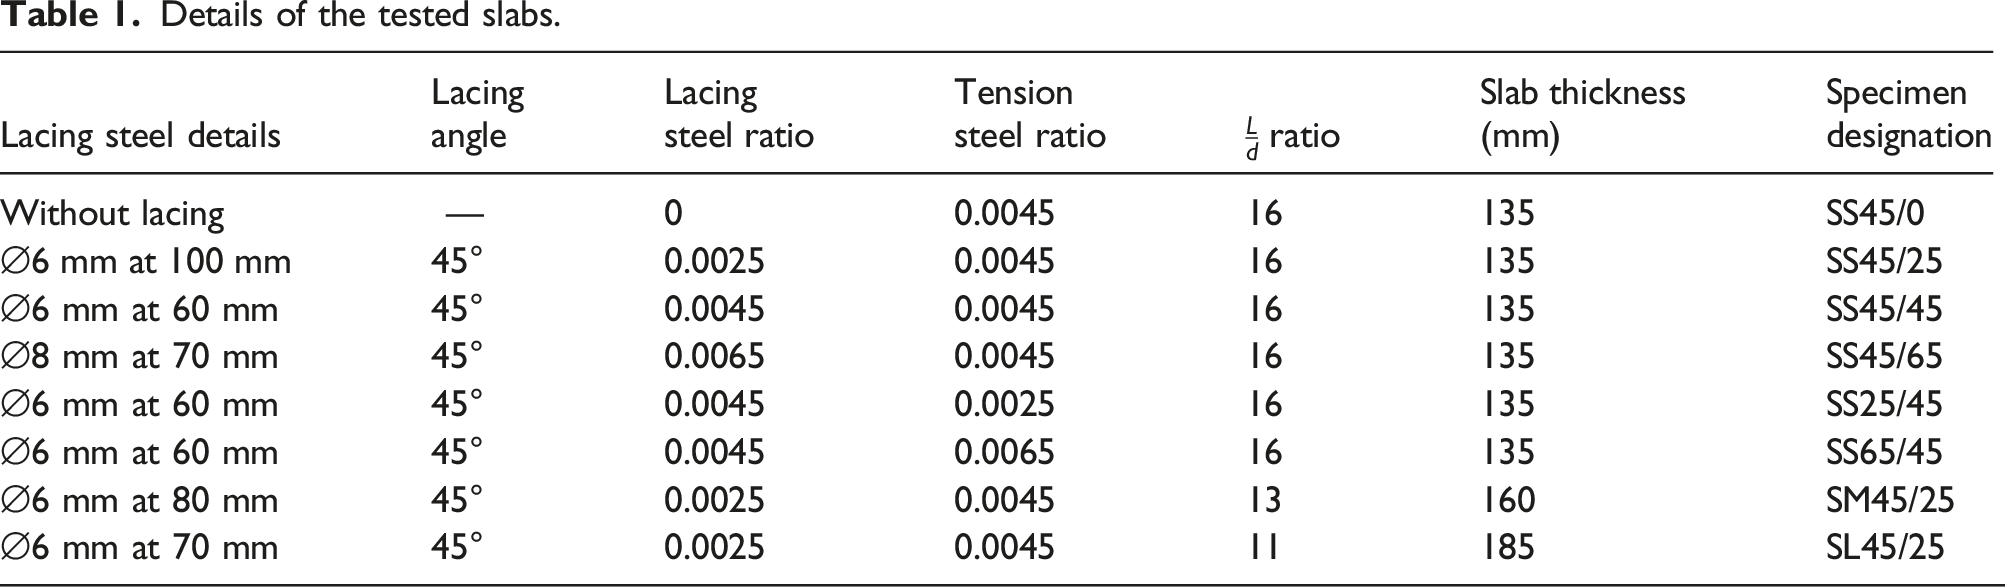
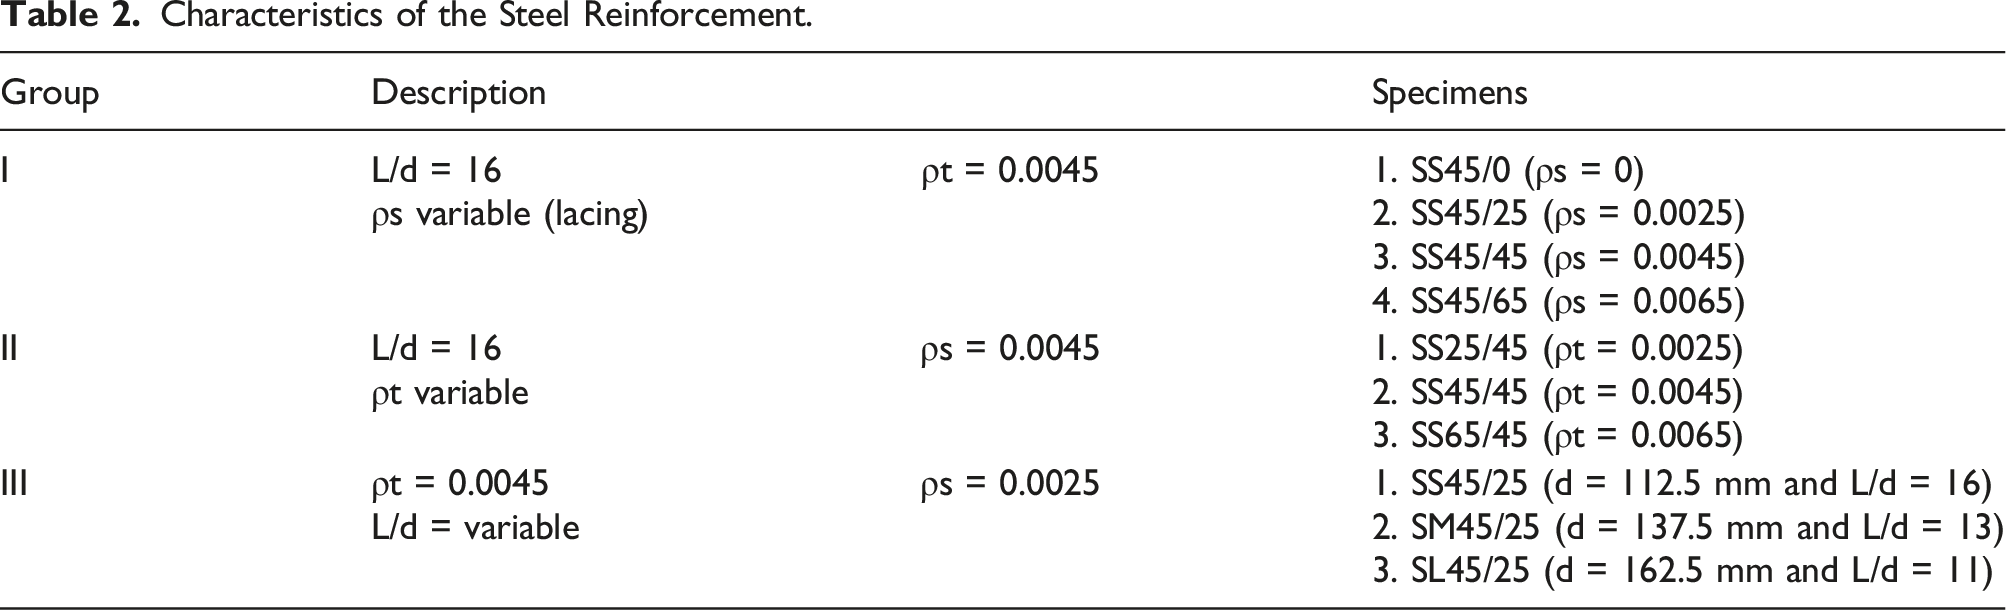
Nine slabs were meticulously designed and evaluated to understand the synergy between lacing reinforcement and other essential parameters. Each slab, designed for simple support, boasted a total span of 2000 mm and a clear span of 1800 mm. The dimensions and reinforcement ratios were chosen based on ACI 318-19 (2019) and UFC 3-340-02 (2008) guidelines for laced reinforced concrete structures. Figure 1 displays the specifics of test specimens, both with and without laced reinforced steel. The evaluated slabs, measuring 2000 mm × 700 mm, varied in thickness: 135 mm, 160 mm, and 185 mm. Two of them served as benchmarks, lacking lacing reinforcement. The lacing reinforcement was angled at 45°, and incorporated a variety of tension steel ratios (ρt) such as 0.0025, 0.0045, and 0.0065, along with lacing steel ratios (ρs) of the same values. The ratios of clear span to effective depth (L/d) were recorded as 11, 13, and 16, as listed in Table 1. Specifications and measurements of the evaluated slab samples. (a) Elevation of the reference slab without lacing reinforcement. (b) Elevation of the slab with lacing reinforcement. Details of the tested slabs.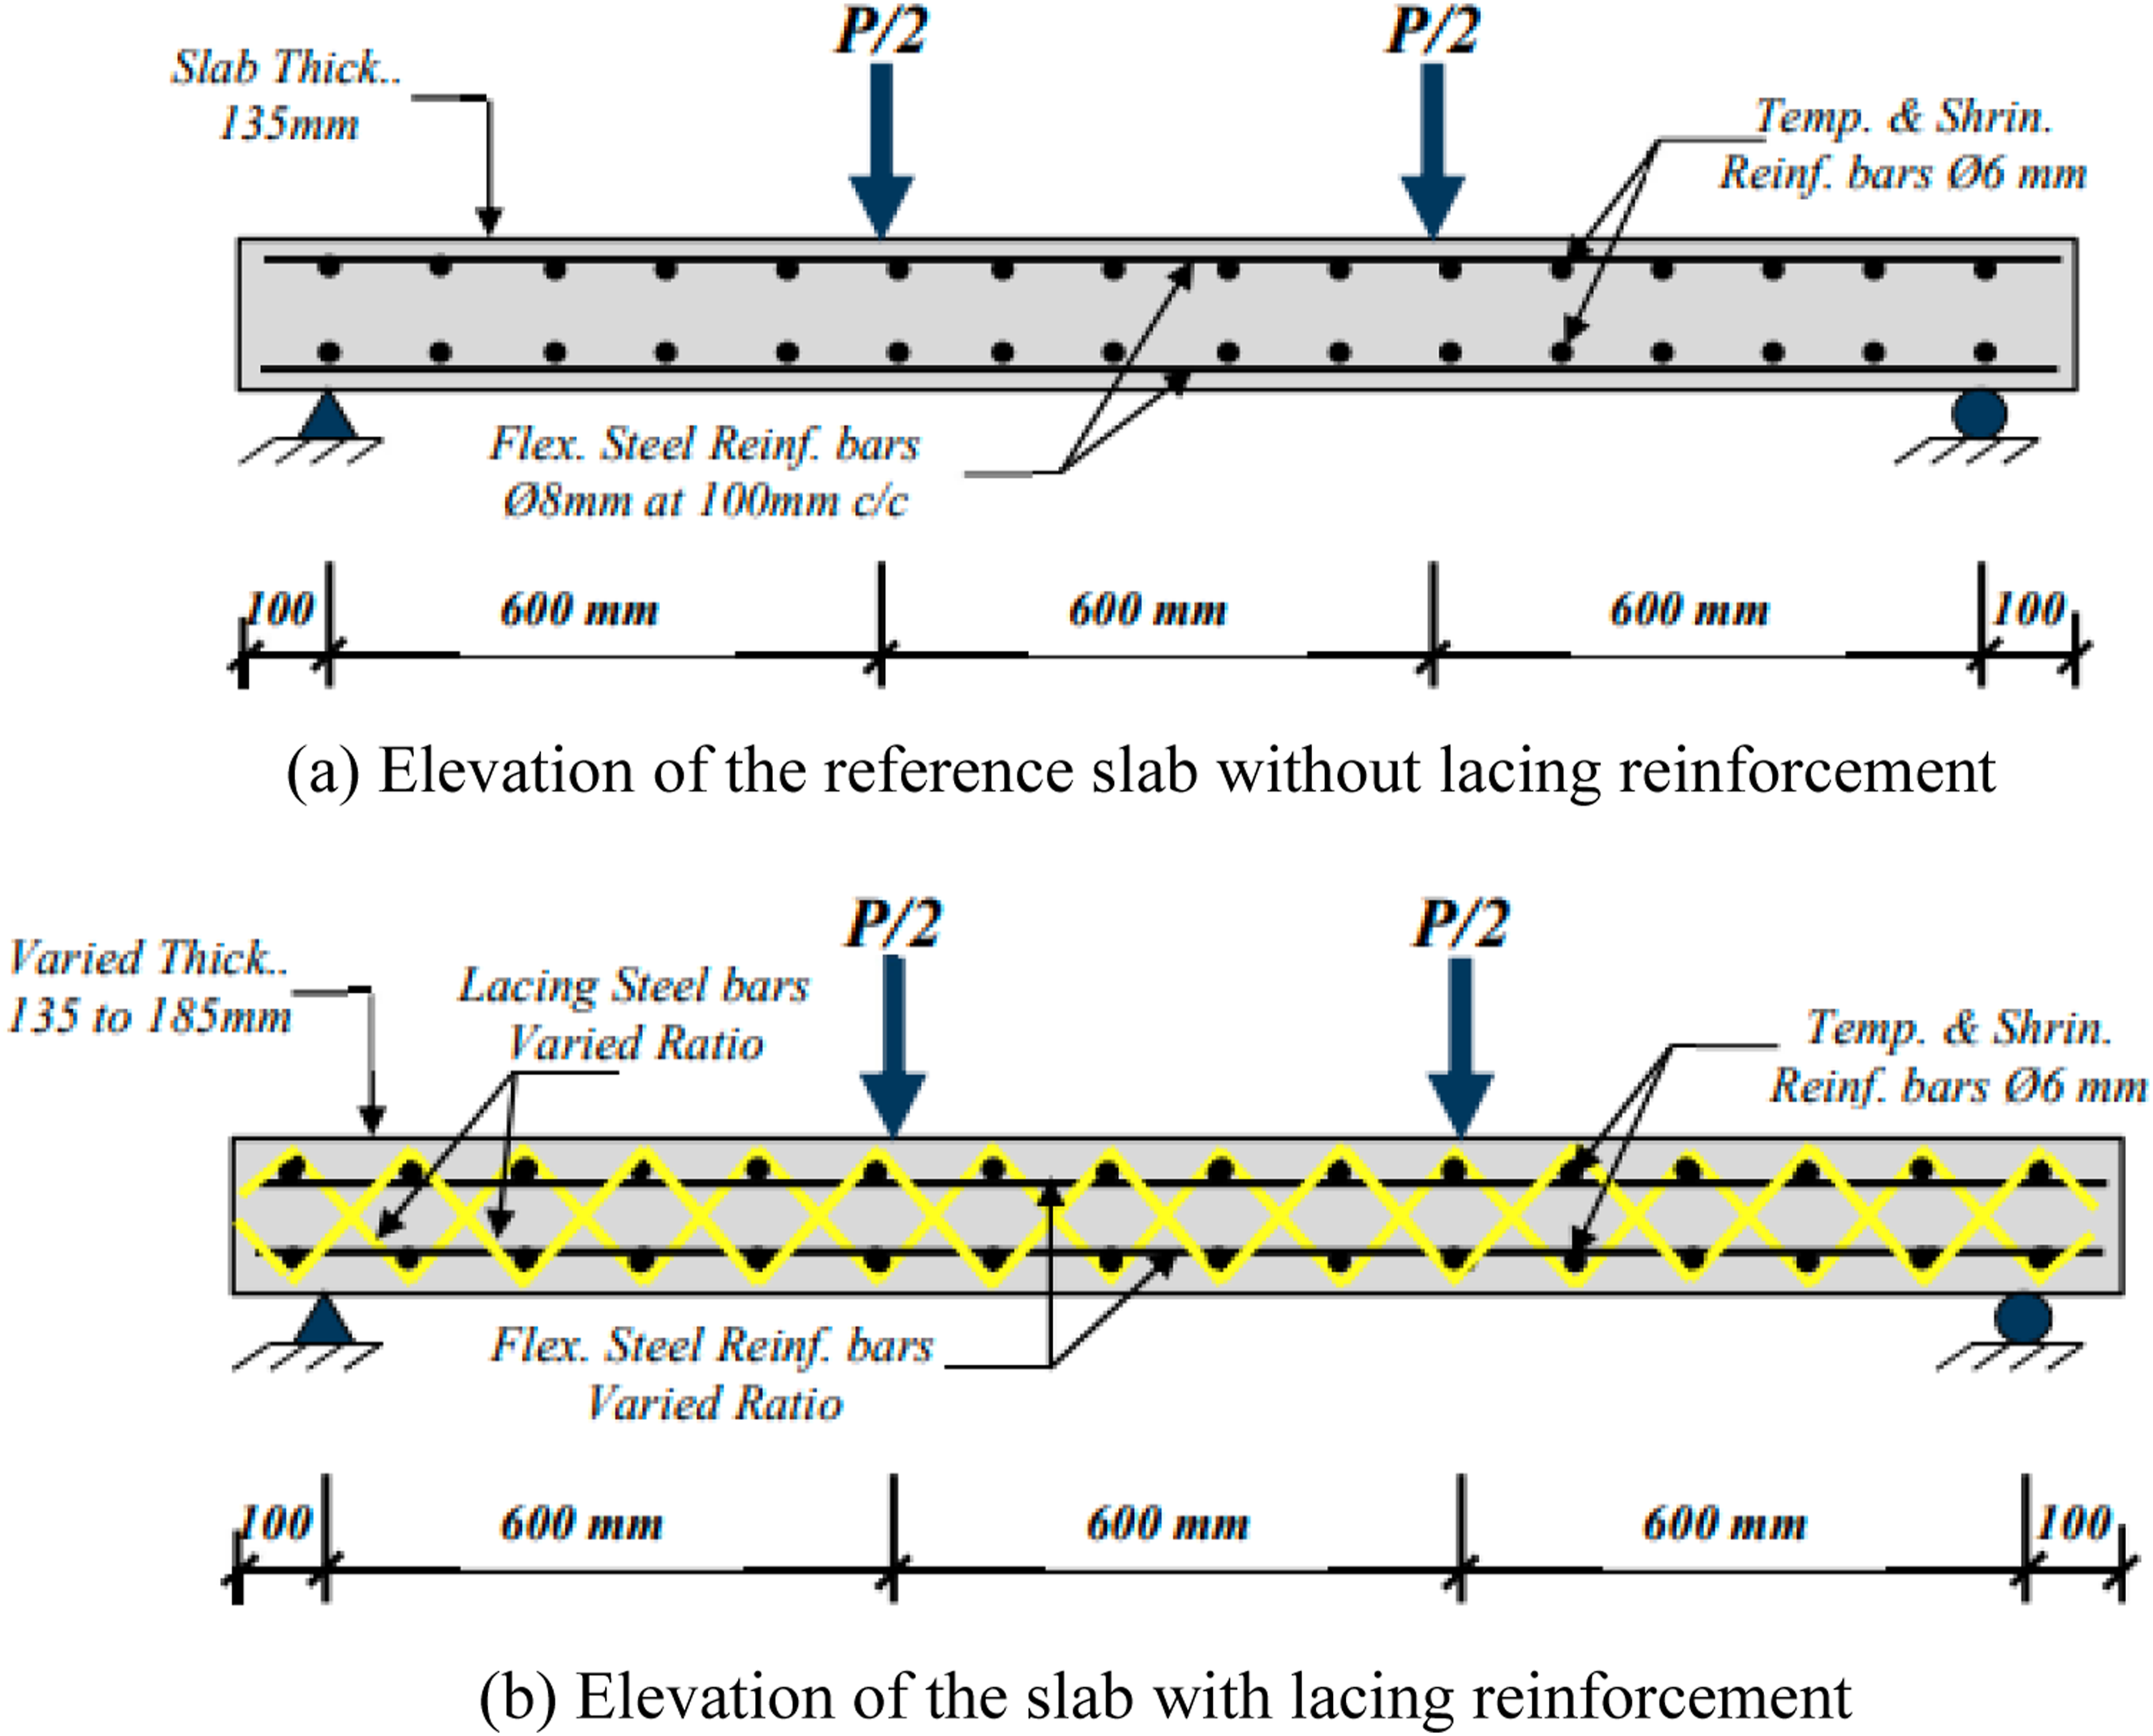
Characteristics of the Steel Reinforcement.
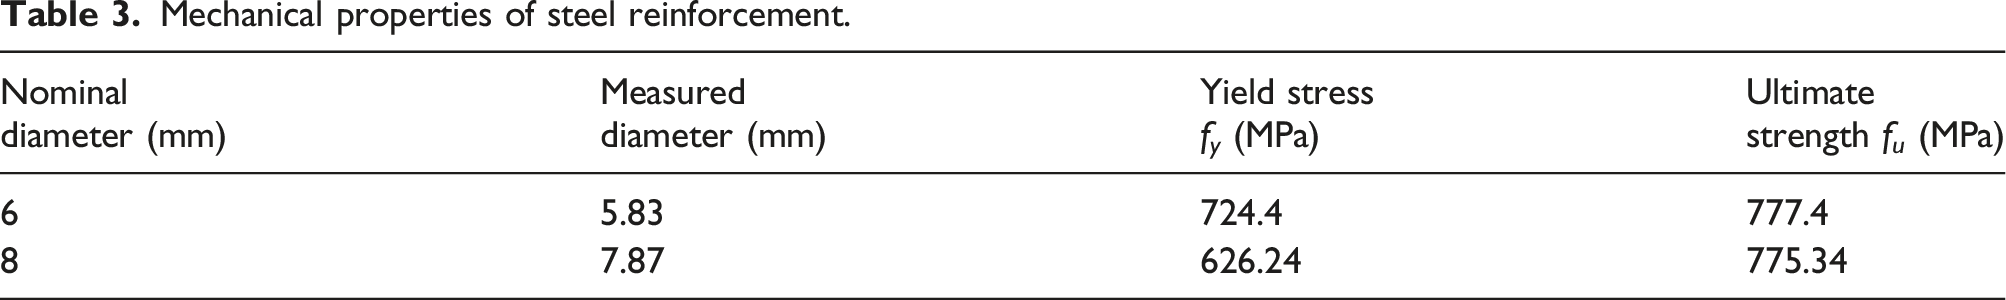
Material properties
Mechanical properties of steel reinforcement.
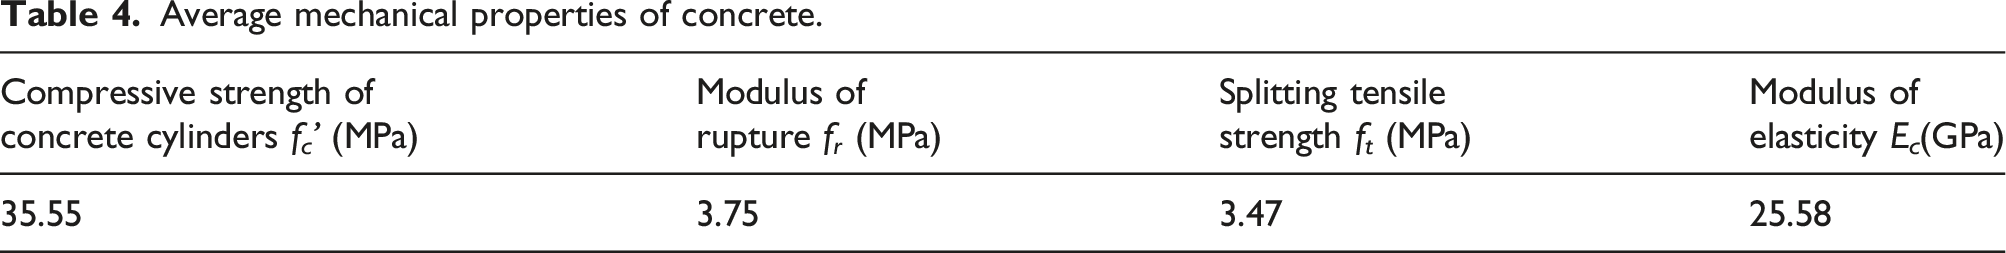
Average mechanical properties of concrete.
Test setup and instrumentations
On the testing day, the specimens were positioned within the testing frame. The support and loading lines, and the Linear Variable Differential Transformers (LVDTs) were meticulously affixed to each specimen at predetermined locations, as illustrated in Figure 2. Utilizing a hydraulic jack with a 500 kN capacity, the specimens underwent testing under two lines of loading, facilitated by a spreader beam. The static load was steadily increased at a rate of 3.63 kN/minute until the specimen’s failure. Conversely, the repeated load application proceeded differently. The repeated load was ramped up to 80% of the static failure load observed in the reference specimen. Following this, the load was fully released, marking a single loading-unloading cycle. This sequence was reiterated five times, as illustrated in Figure 2(c). Ultimately, each specimen was subjected to a static load until its breaking point. At every stage of loading, a comprehensive set of data was recorded: the amount of load applied and the slab’s deflection at three distinct points, as shown in Figure 2. Test setup and loading scheme. (a) Loading lines, supports, and instrumentations. (b) On-site photo of the testing machine. (c) Cyclic loading pattern.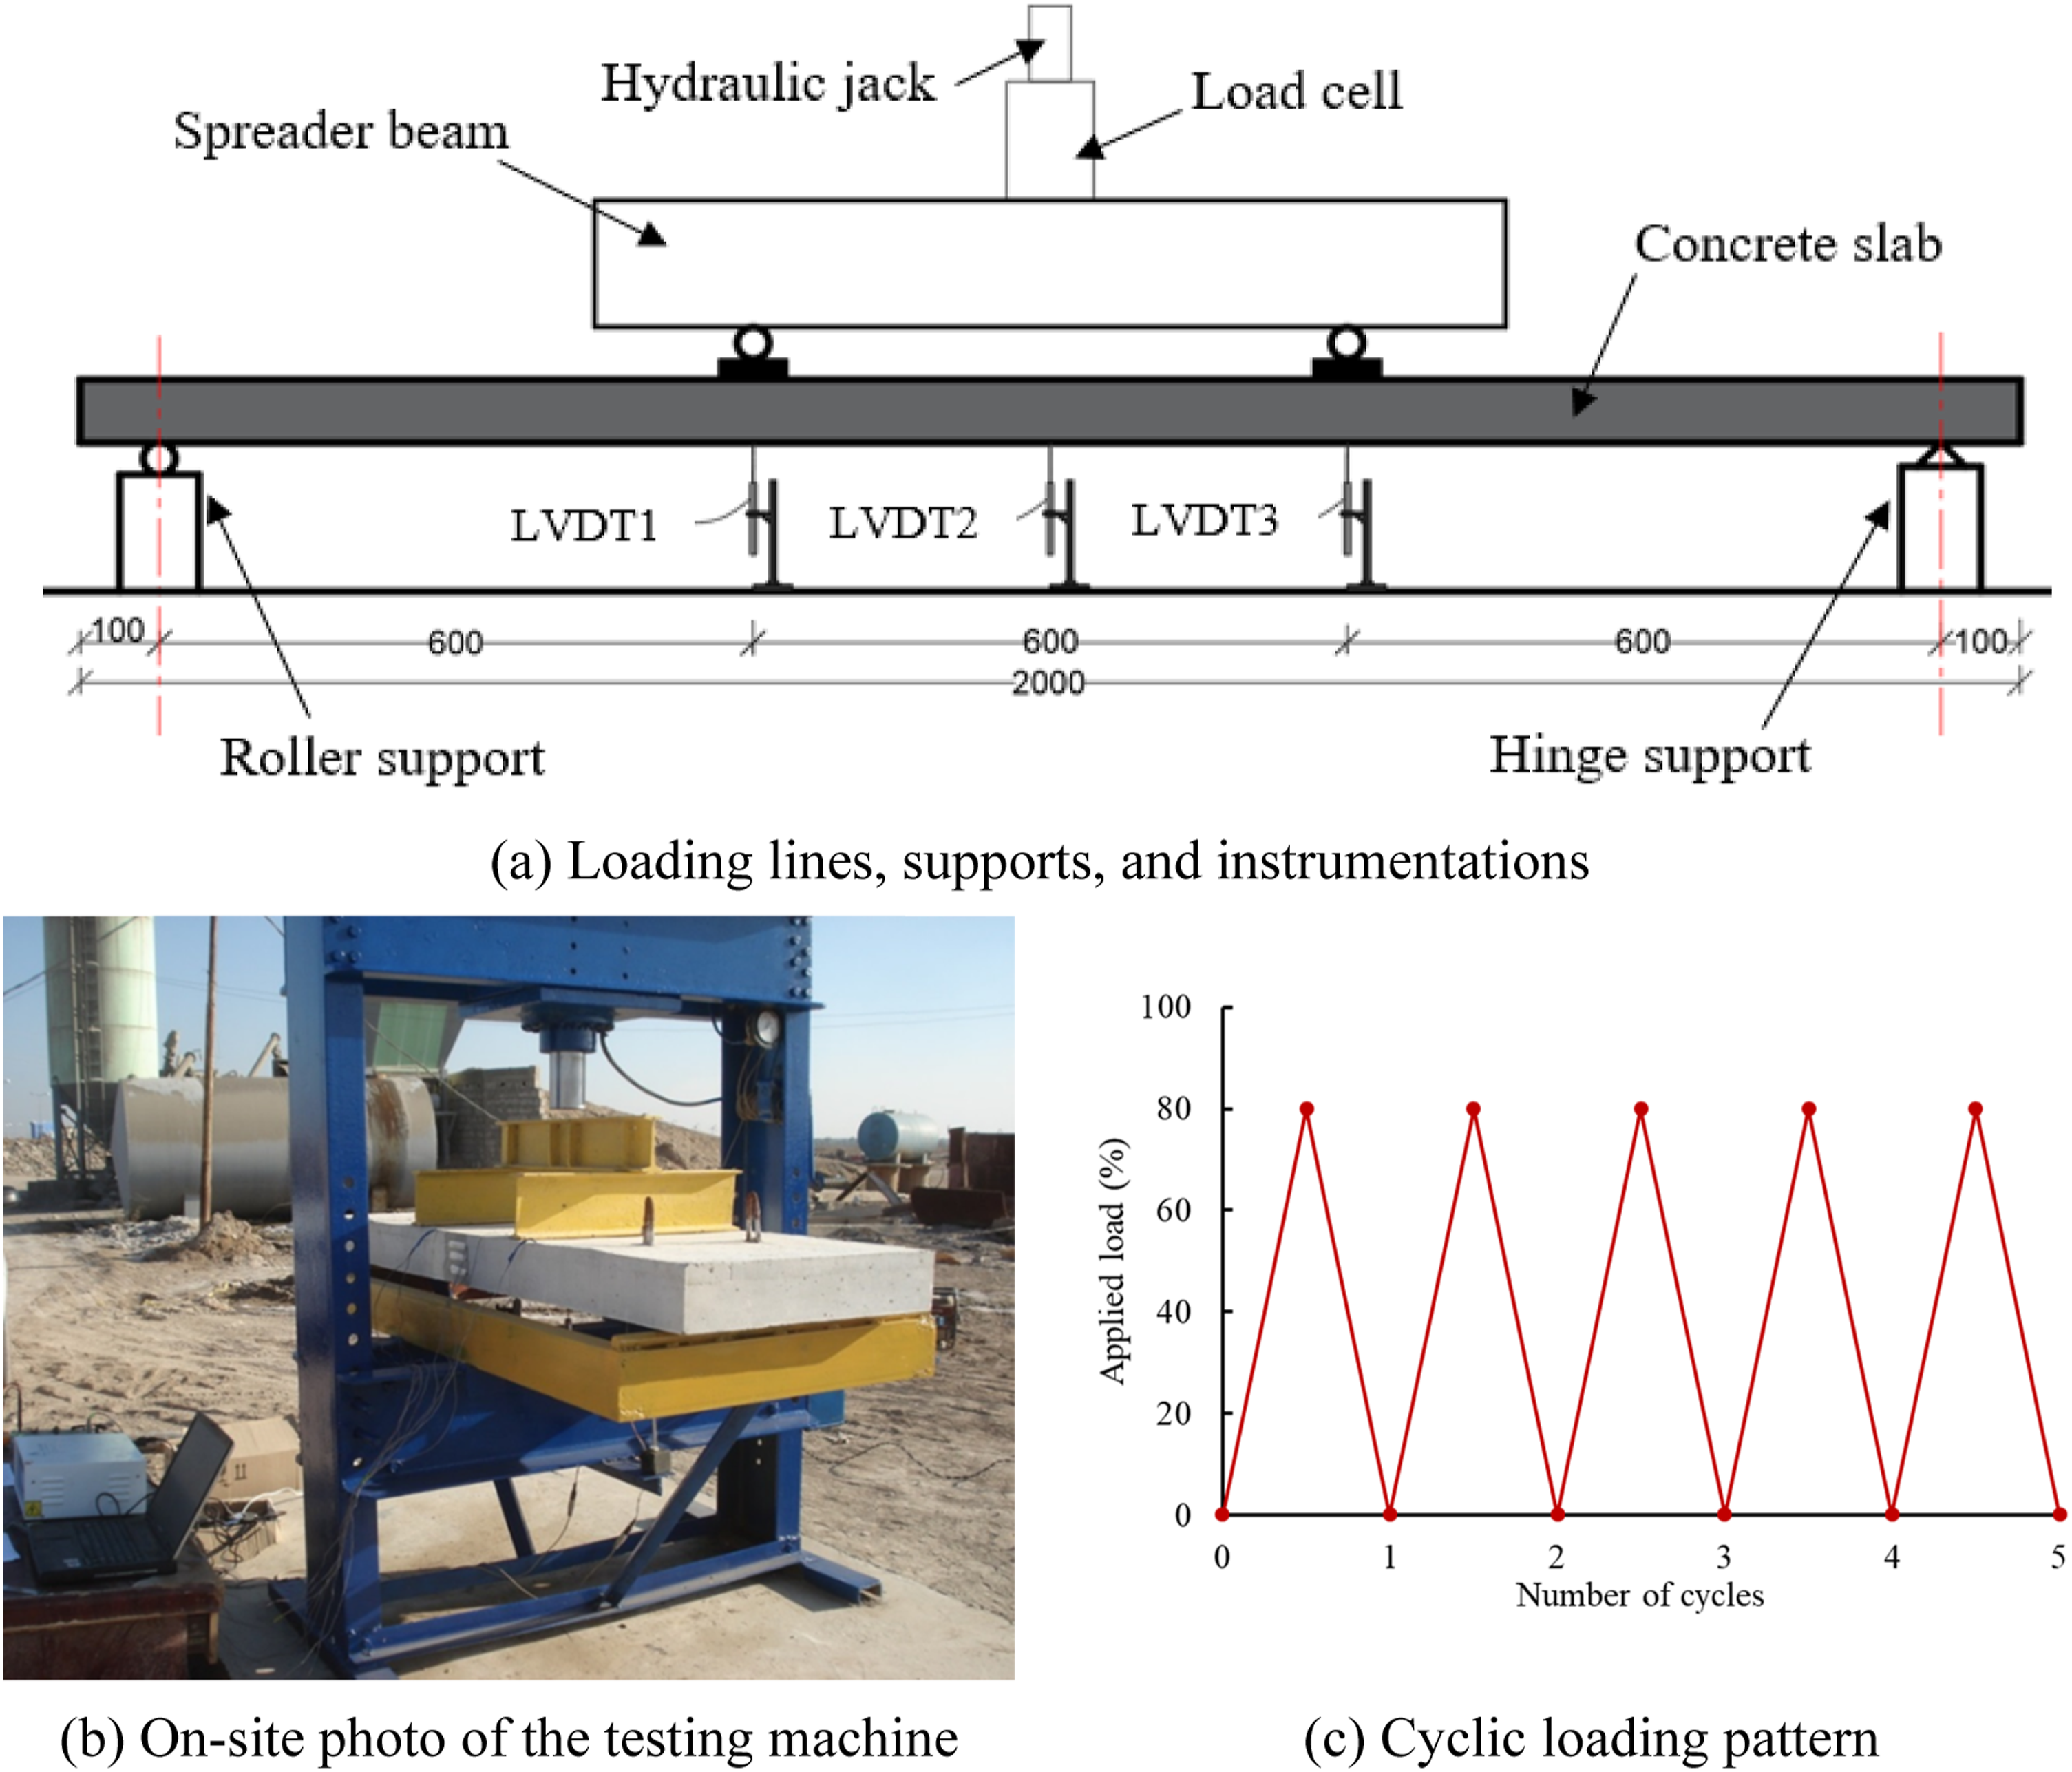
Experimental results
Crack pattern and failure mode
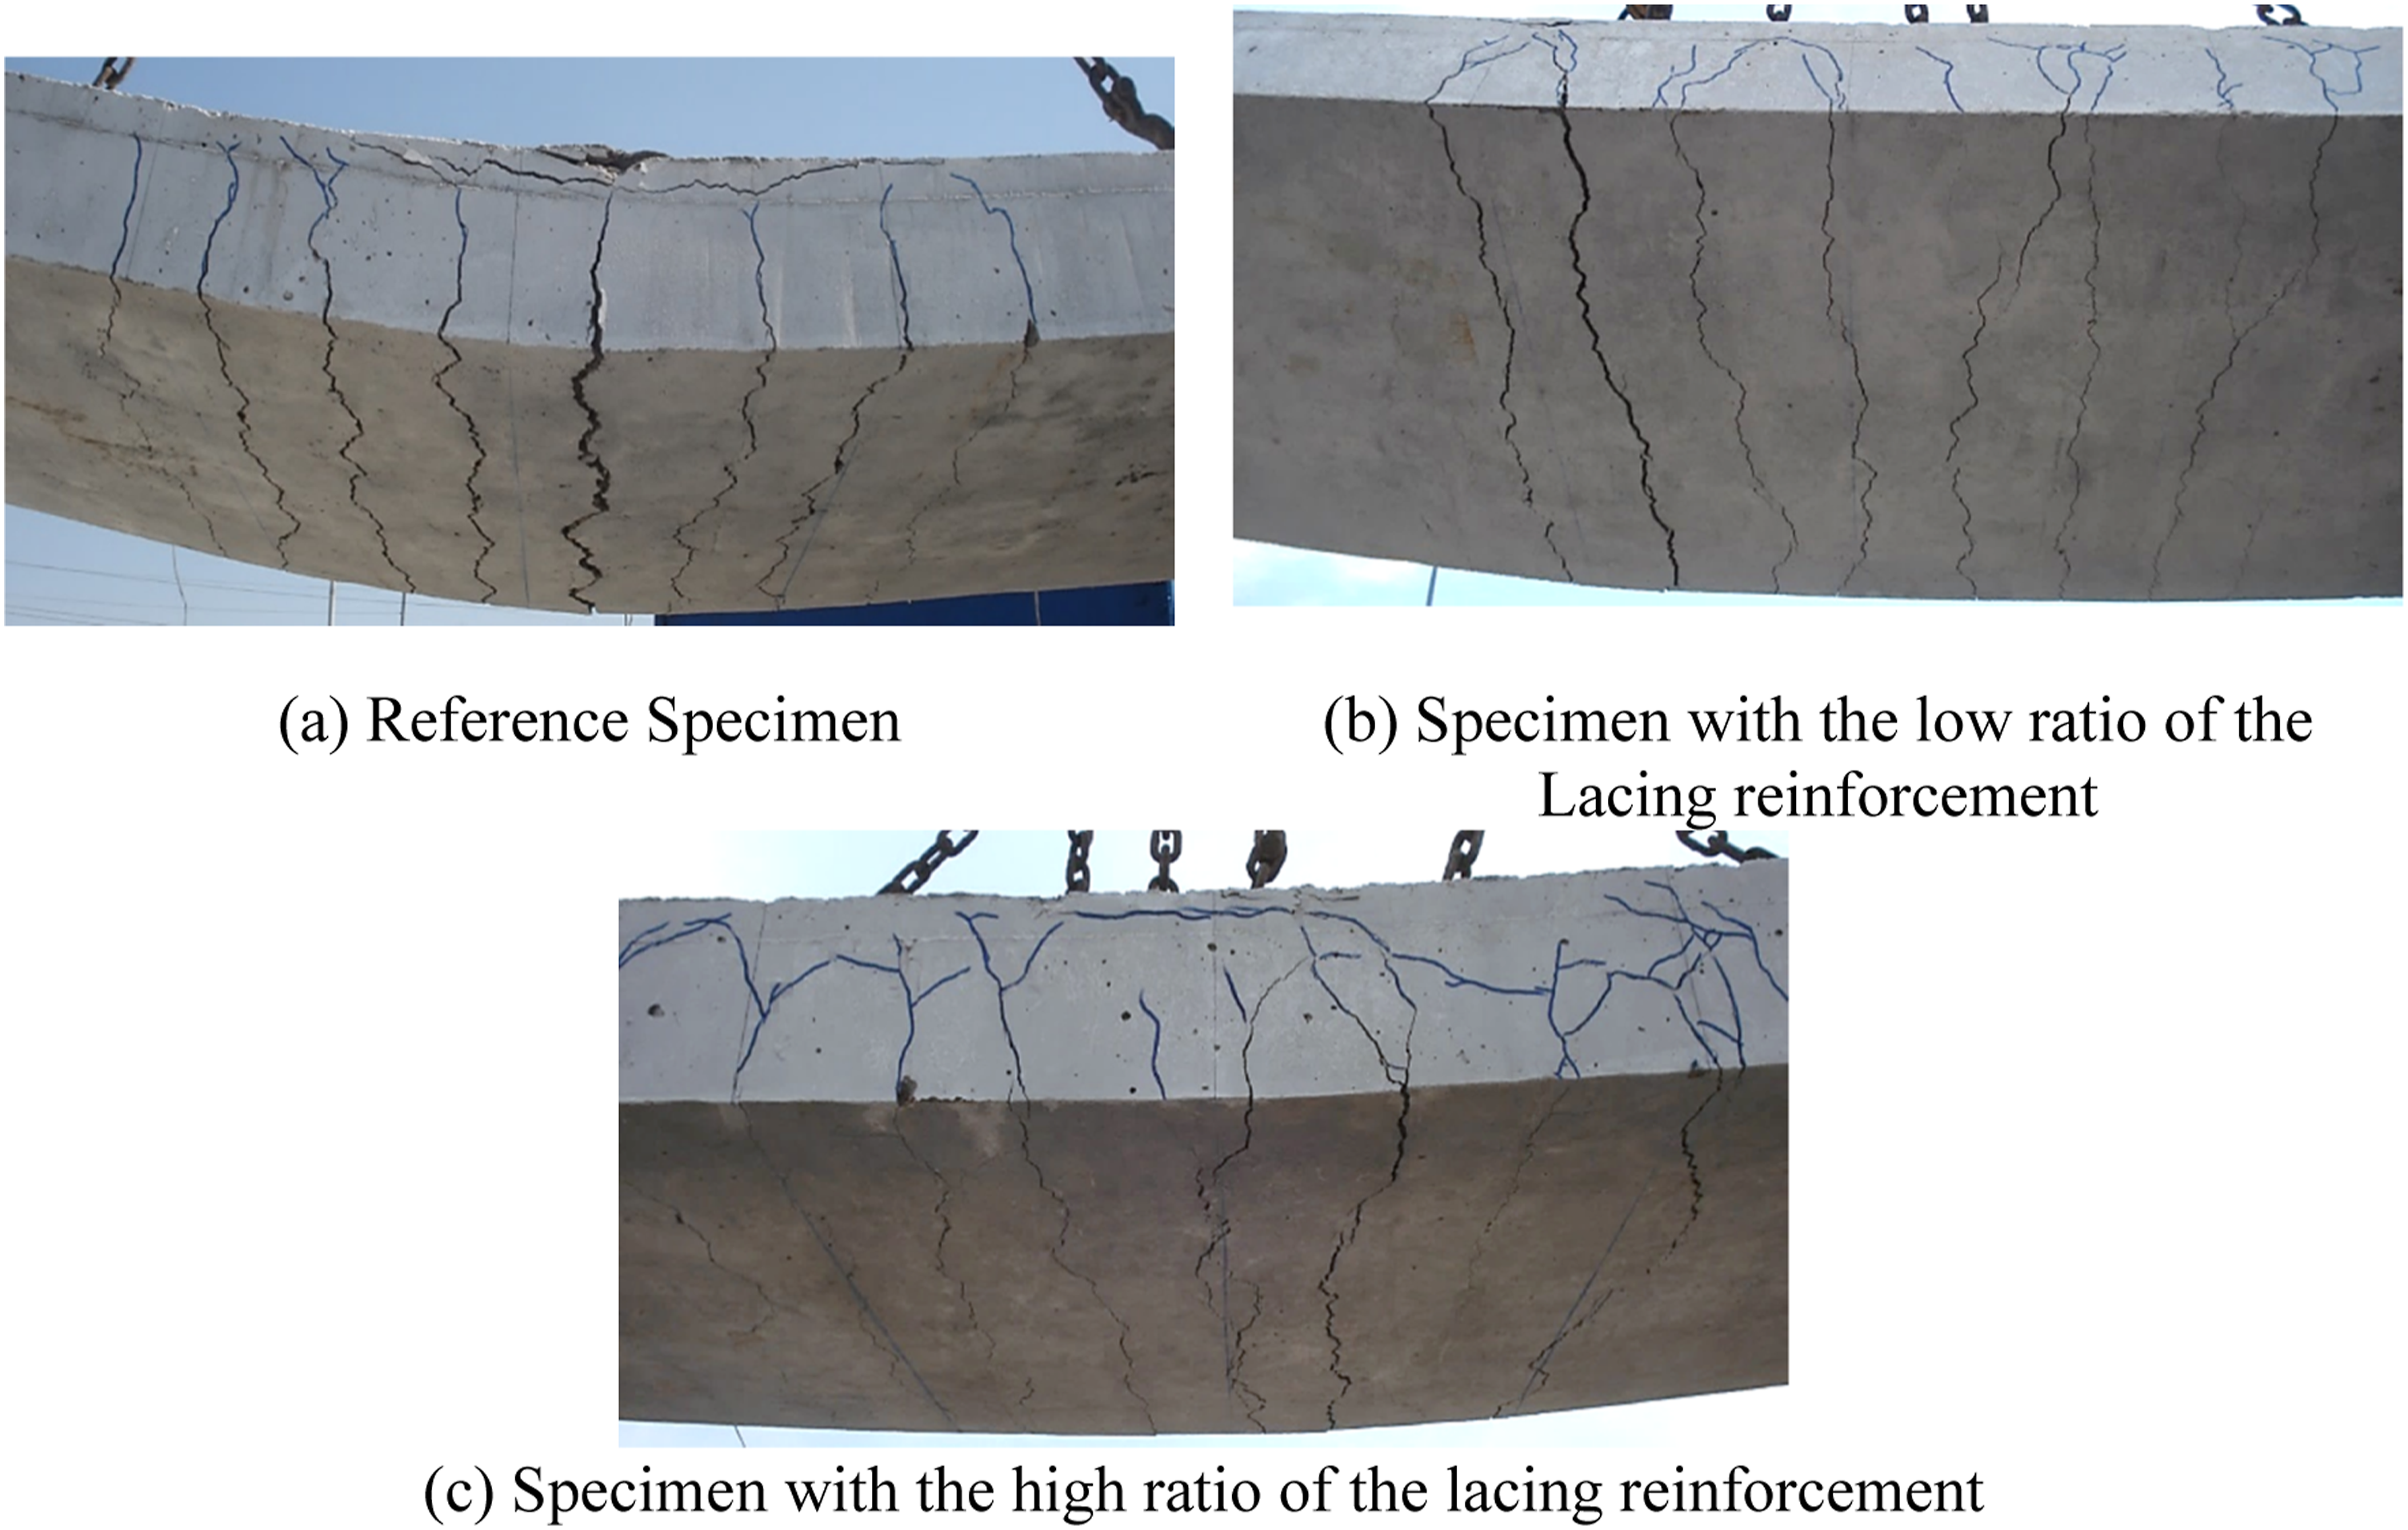
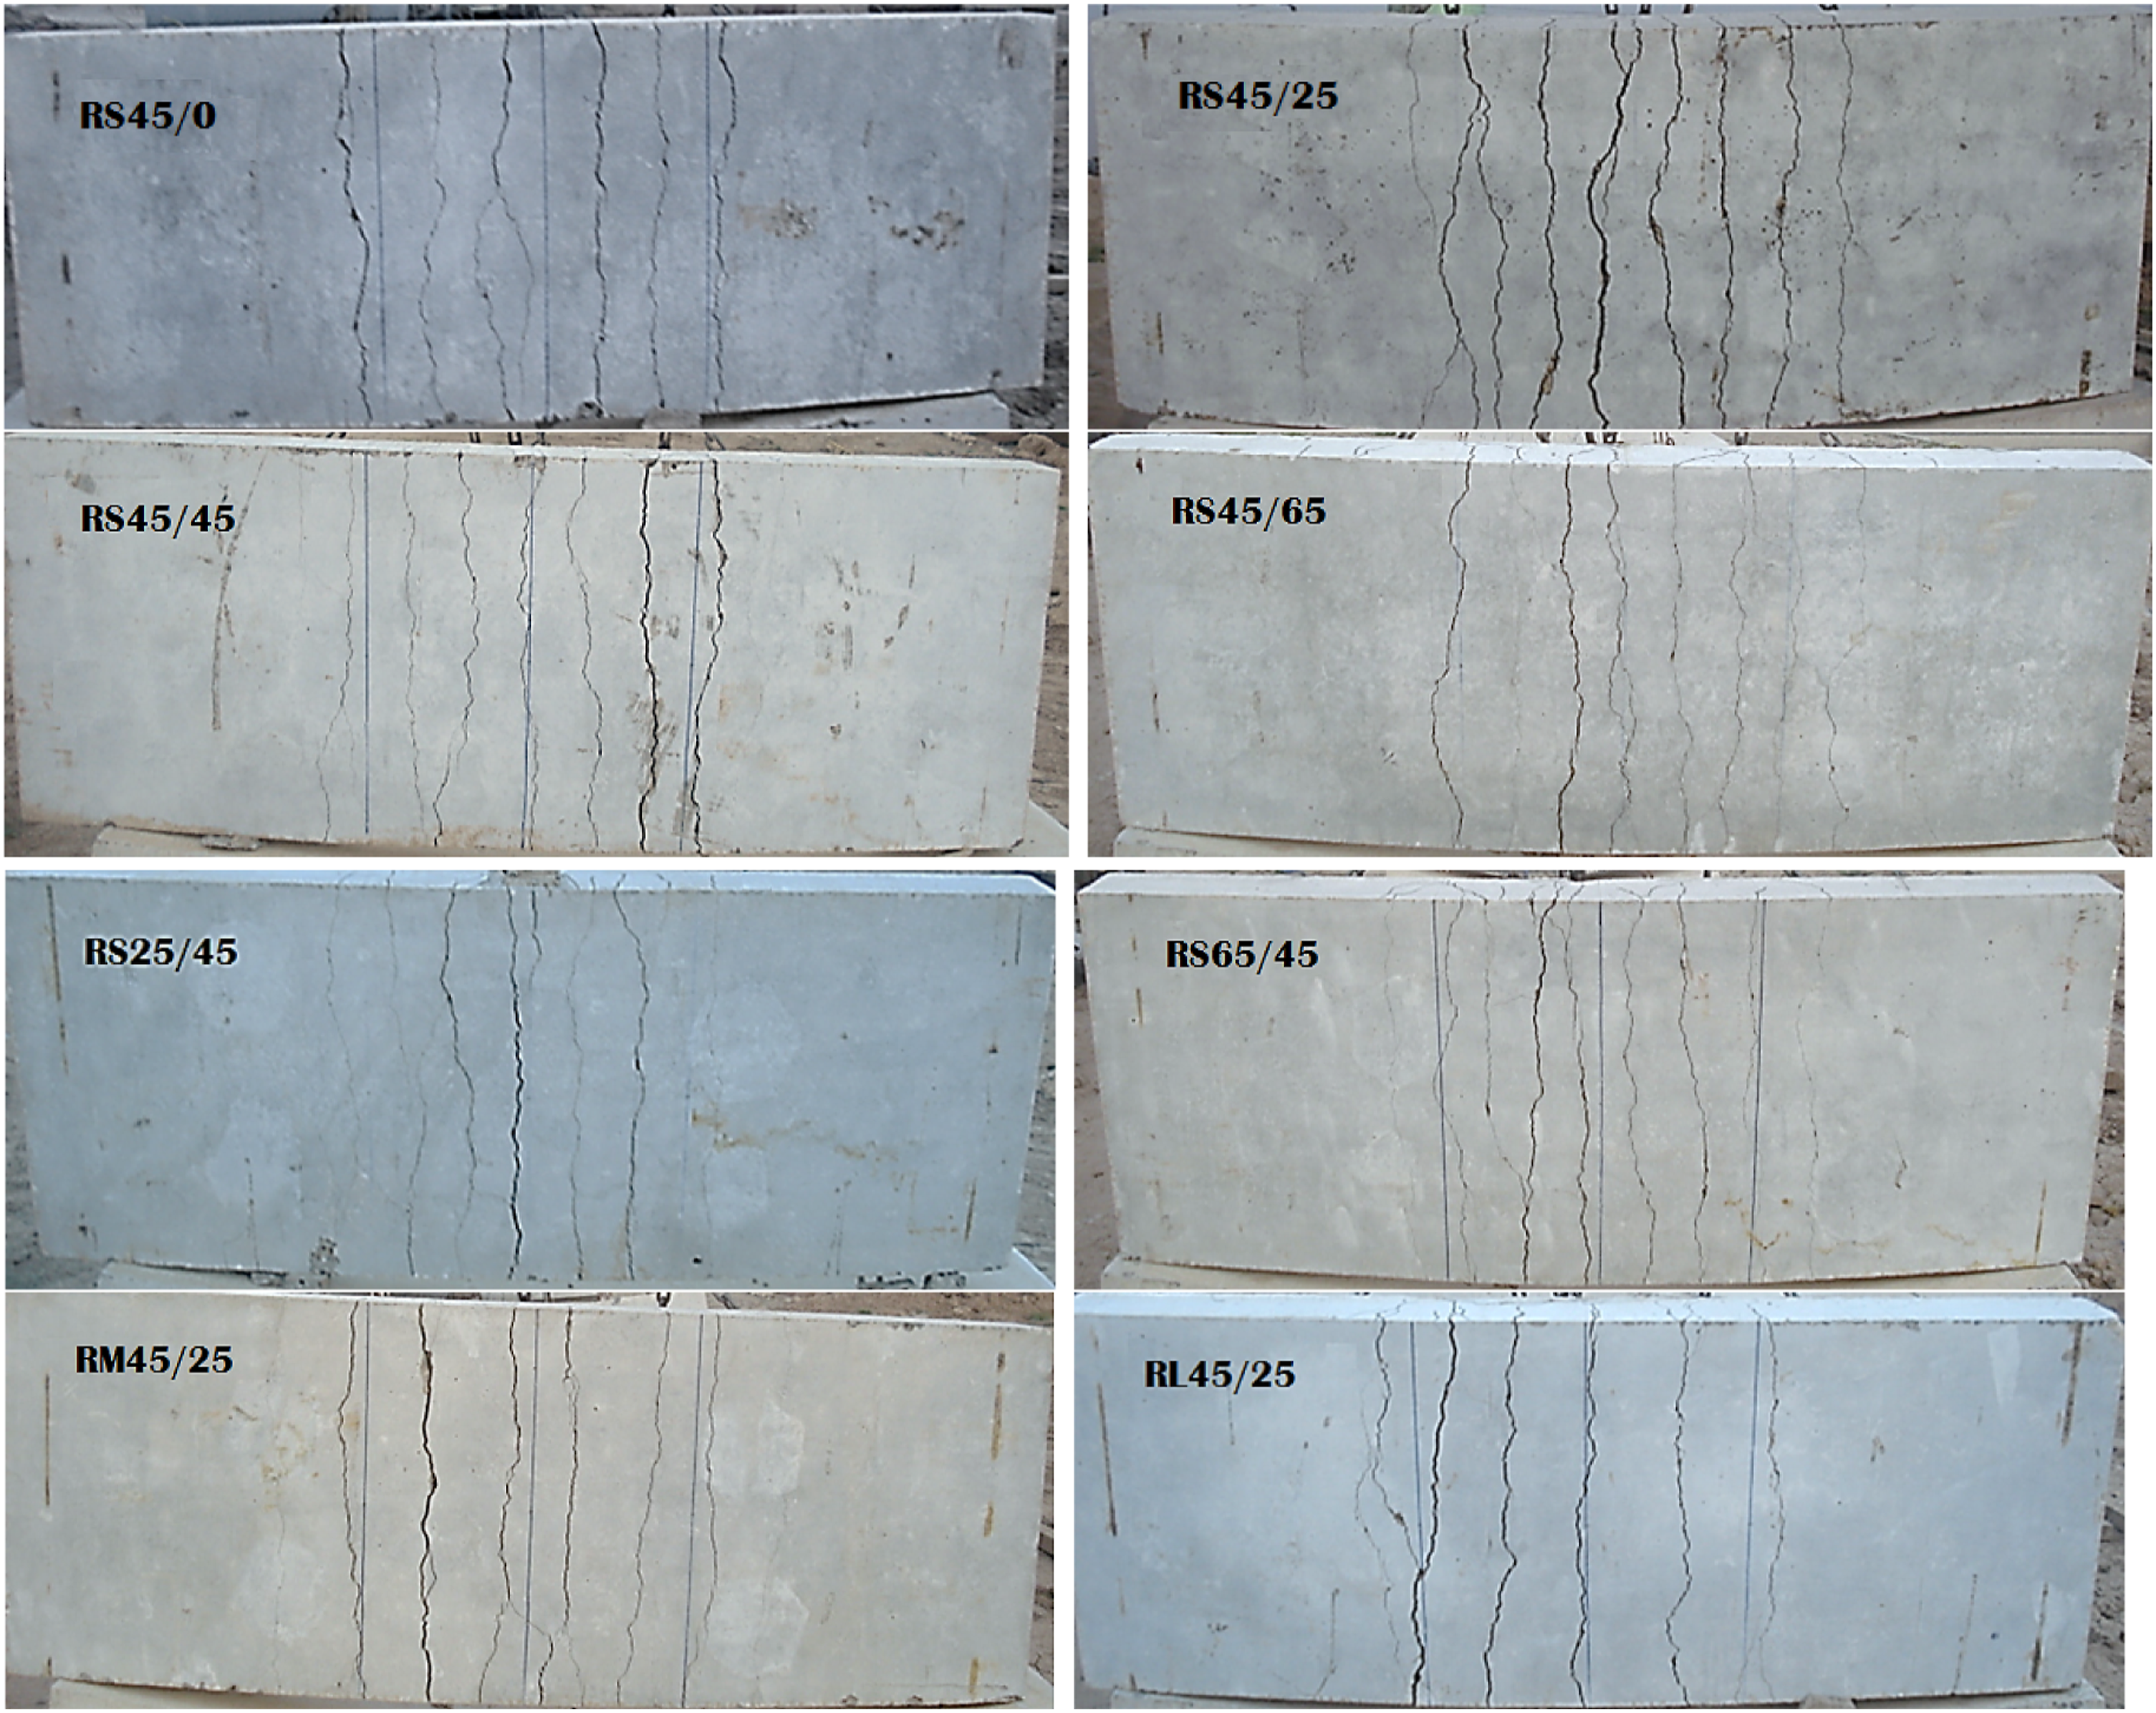
The testing results revealed a consistent initial cracking behavior across all statically-tested specimens. The inaugural flexural cracks manifested when the applied load ranged between approximately 15.6% and 22.6% of the specimens’ peak load capacity. As the tensile forces surpassed the concrete’s rupture modulus, the first fissures appeared at the slab bottoms, specifically in the central third region where maximum bending is observed. These cracks expanded gradually, running parallel to the supports, and encompassing the slab’s width. As the static load intensified, additional flexural cracks, parallel to the initial ones, began to spread throughout the slab’s thickness. Figure 3 depicts the crack patterns for the static-tested specimens, highlighting the parallel progression of flexural cracks. Notably, no cracks appeared near the support zones on either side of the specimen. In the specimens with lacing reinforcement, the propagation of cracks was limited relative to the reference specimen. This can be attributed to the confinement provided by lacing reinforcement in the concrete slab, which improved the crack resistance of the concrete slabs. Moreover, the cracks in these specimens took a curved shape, intersecting throughout the slab’s thickness. This interconnected pattern became more pronounced with higher lacing steel ratios, as illustrated in Figure 4. Interestingly when observing specimens subjected to repeated loads (see Figure 5), their crack patterns closely mirrored those from static testing. However, with increasing load cycles in the repeatedly loaded specimens, there was a marked escalation in crack development and width. Crack patterns on the tension side of specimens post-failure from static load testing. Crack patterns for the side faces of the specimen with and without lacing reinforcement after static failure. (a) Reference specimen. (b) Specimen with the low ratio of the lacing reinforcement. (c) Specimen with the high ratio of the lacing reinforcement. Cracks pattern for the tension face of the specimens tested under repeated loading after failure.
Load-deflection behavior
All specimens displayed an elastic response until the onset of non-linear strain in the steel reinforcement at the central zone, as depicted in Figure 6. Additionally, the compact graph distributions in the early stages characterized the cyclic load-deflection behavior observed in specimens subjected to repeated loading (refer to Figure 6). The incremental residual deformations were primarily attributed to a slight propagation of initial cracks and the emergence of additional cracks. With an increasing number of load cycles, there was a corresponding escalation in the development of damage within the concrete slab. Load-deflection relations of the static and repeated loadings. (a) Group I. (b) Group II. (c) Group III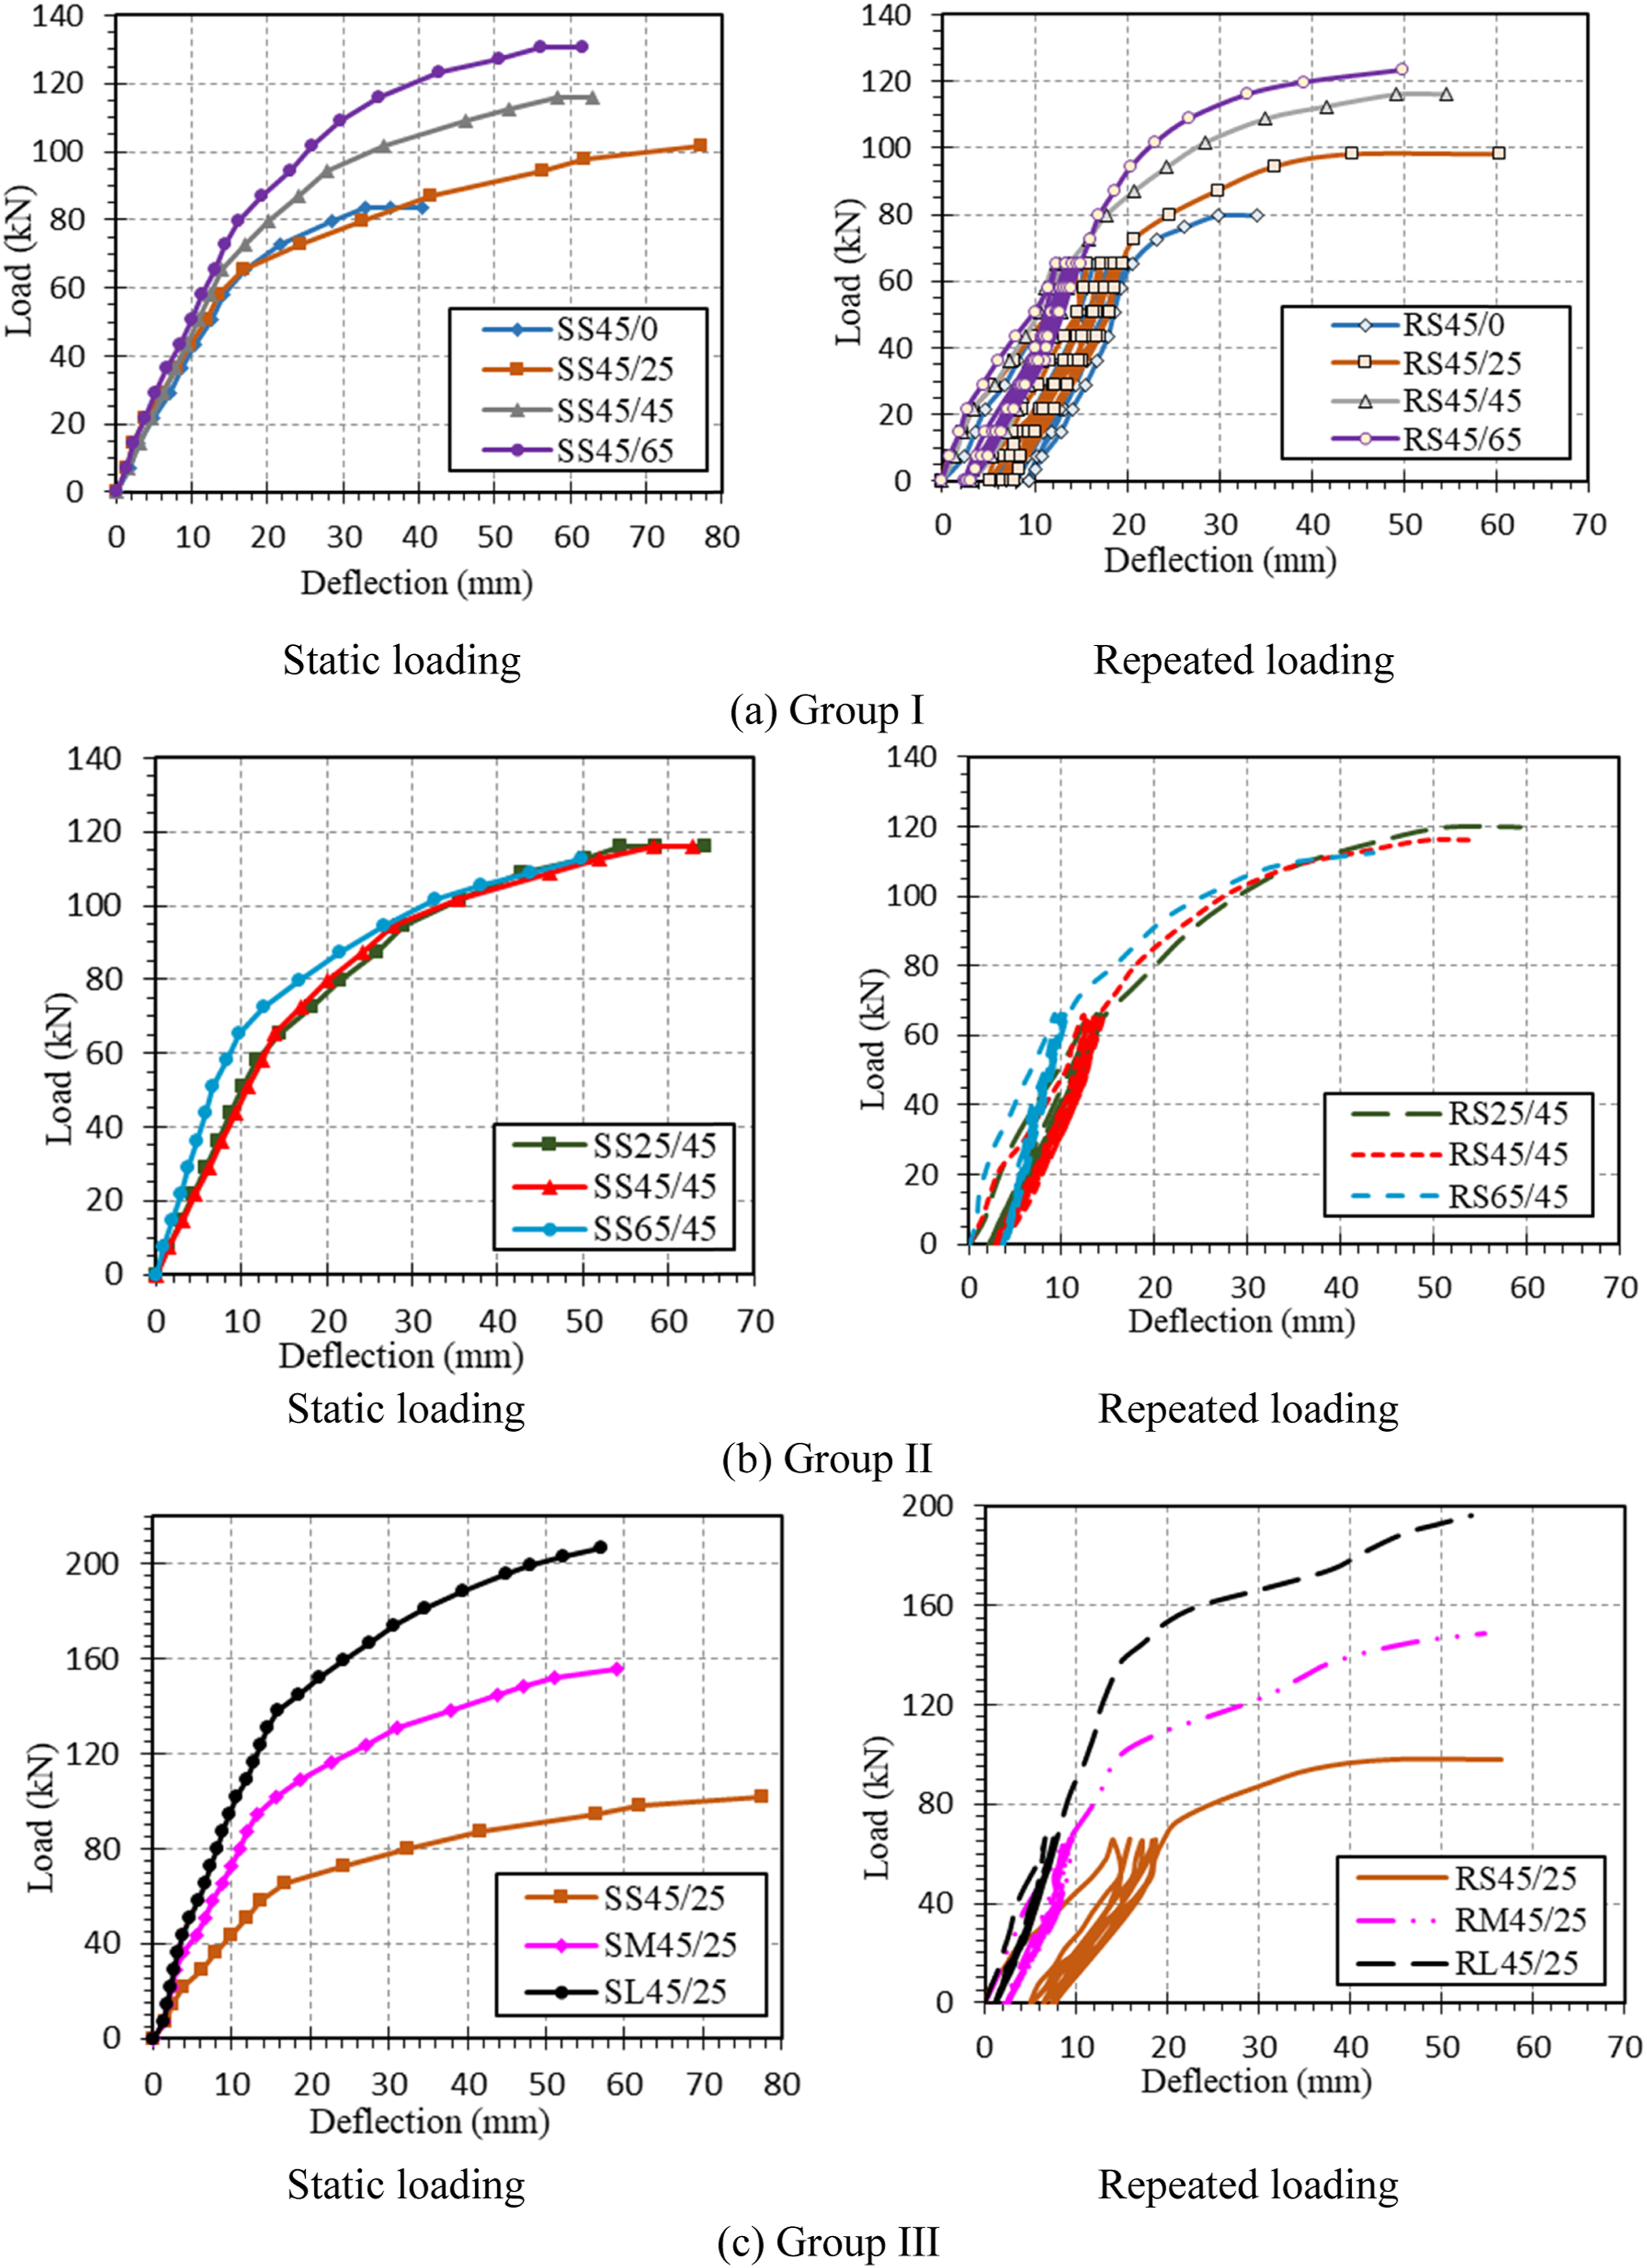
Elevating the lacing reinforcement relative to the longitudinal reinforcement markedly enhanced the flexural behavior of the specimens. In the case of static loading (Figure 6(a)), the static peak loads exhibited a substantial increase of 17.6%, 35.3%, and 58.8% with corresponding increments in lacing reinforcement of 0.25%, 0.45%, and 0.65%, respectively. This emphasizes the pronounced influence of the lacing reinforcement ratio on enhancing the flexural performance of the RC slabs. The efficacy and contribution of lacing steel reinforcement in reactivating the specimen’s energy were attributed to its ability to restrain the tension steel reinforcement and reduce crack width propagation. Conversely, when increasing the longitudinal reinforcement ratio for a constant lacing reinforcement ratio, the flexural behavior remained similar, albeit with slight variations, as illustrated in Figure 6(b). Figure 6(c) reveals the significant impact of slab thickness on the stiffness and capacities of the tested specimens, maintaining constant longitudinal and lacing reinforcements. Doubling the slab thickness from 135 mm to 185 mm resulted in a twofold increase in capacity. This underscores the substantial role played by slab thickness in influencing the overall performance of the specimens.
The residual deflections decreased by about 9.73%, 13.81%, and 8.26% for the specimens RS45/25, RS45/45, and RS45/65, respectively, compared to the similar specimens tested under static loads only. Whereas, for the specimens without lacing reinforcement, there is no difference between the load-deflection behavior under static and repeated loadings. The failure loads of the specimens tested under repeated load were reduced by 4.4%, 3.6%, and 5.6% for the specimens RS45/0, RS45/25, and RS45/65, respectively, concerning the similar specimens tested under static load. In contrast, the failure loads under static and repeated cases for the specimens SS45/45 and RS45/45 were equal, as shown in Figure 6(a) and (b). It is noticed that the same behavior occurs for the specimens RS25/45 and RS65/45, where the deflection is reduced by about 7.7% and 3.5%, respectively when compared with similar specimens tested under static loading, as shown in Figure 6(c) and (d). The failure load of specimen RS65/45 is the same as that of the specimen tested under static load, while there is a slight increase in the failure load of specimen RS25/45 by 3.03% compared with the specimen tested under static load.
It was observed also that when the slab thickness increased, the specimens RM45/25 and RL45/25 behaved with less stiffness than those tested under static load, as shown in Figure 6(e) and (f). This behavior may be explained as the specimen thickness increases, the crack width increases, and the number of cracks decreases. Also, the tensile strain in the tension steel reinforcement is reduced, which reduces the effect of lacing steel reinforcement for the thicker specimens. The failure loads for the specimens were less than those of the similar specimens tested under static load by 5.0% and 5.3% for the specimens RM45/25 and RL45/25, respectively, as shown in Figure 6(e) and (f).
Figure 7 depicts the impact of slab thickness, longitudinal reinforcement, and lacing reinforcement on the ductility factor of the tested specimens. Notably, specimens subjected to repeated testing consistently exhibited lower ductility compared to their statically tested counterparts, with a reduction in the ductility factor ranging between 8.4% and 22.3% for all specimens. Increasing the slab thickness demonstrated a positive correlation with improved ductility in the specimens. However, a counteracting effect was observed with an increase in longitudinal steel reinforcement. Specifically, the ductility factor experienced a notable decrease of 30.4% and 23.9% as the longitudinal reinforcement ratio increased from 0.25% to 0.65% in the cases of static and repeated loadings, respectively. The introduction of lacing reinforcement at a ratio of 0.25% resulted in a significant enhancement of the ductility factor, with improvements of 100% and 81.8% observed in the cases of static and repeated loadings, respectively. Conversely, higher lacing ratios (0.45% and 0.65%) led to reductions in the ductility factor. Ductility factor for specimens tested under static and repeated loads. (a) Effect of lacing steel ratio. (b) Effect of tension steel ratio. (c) Effect of L/d ratio.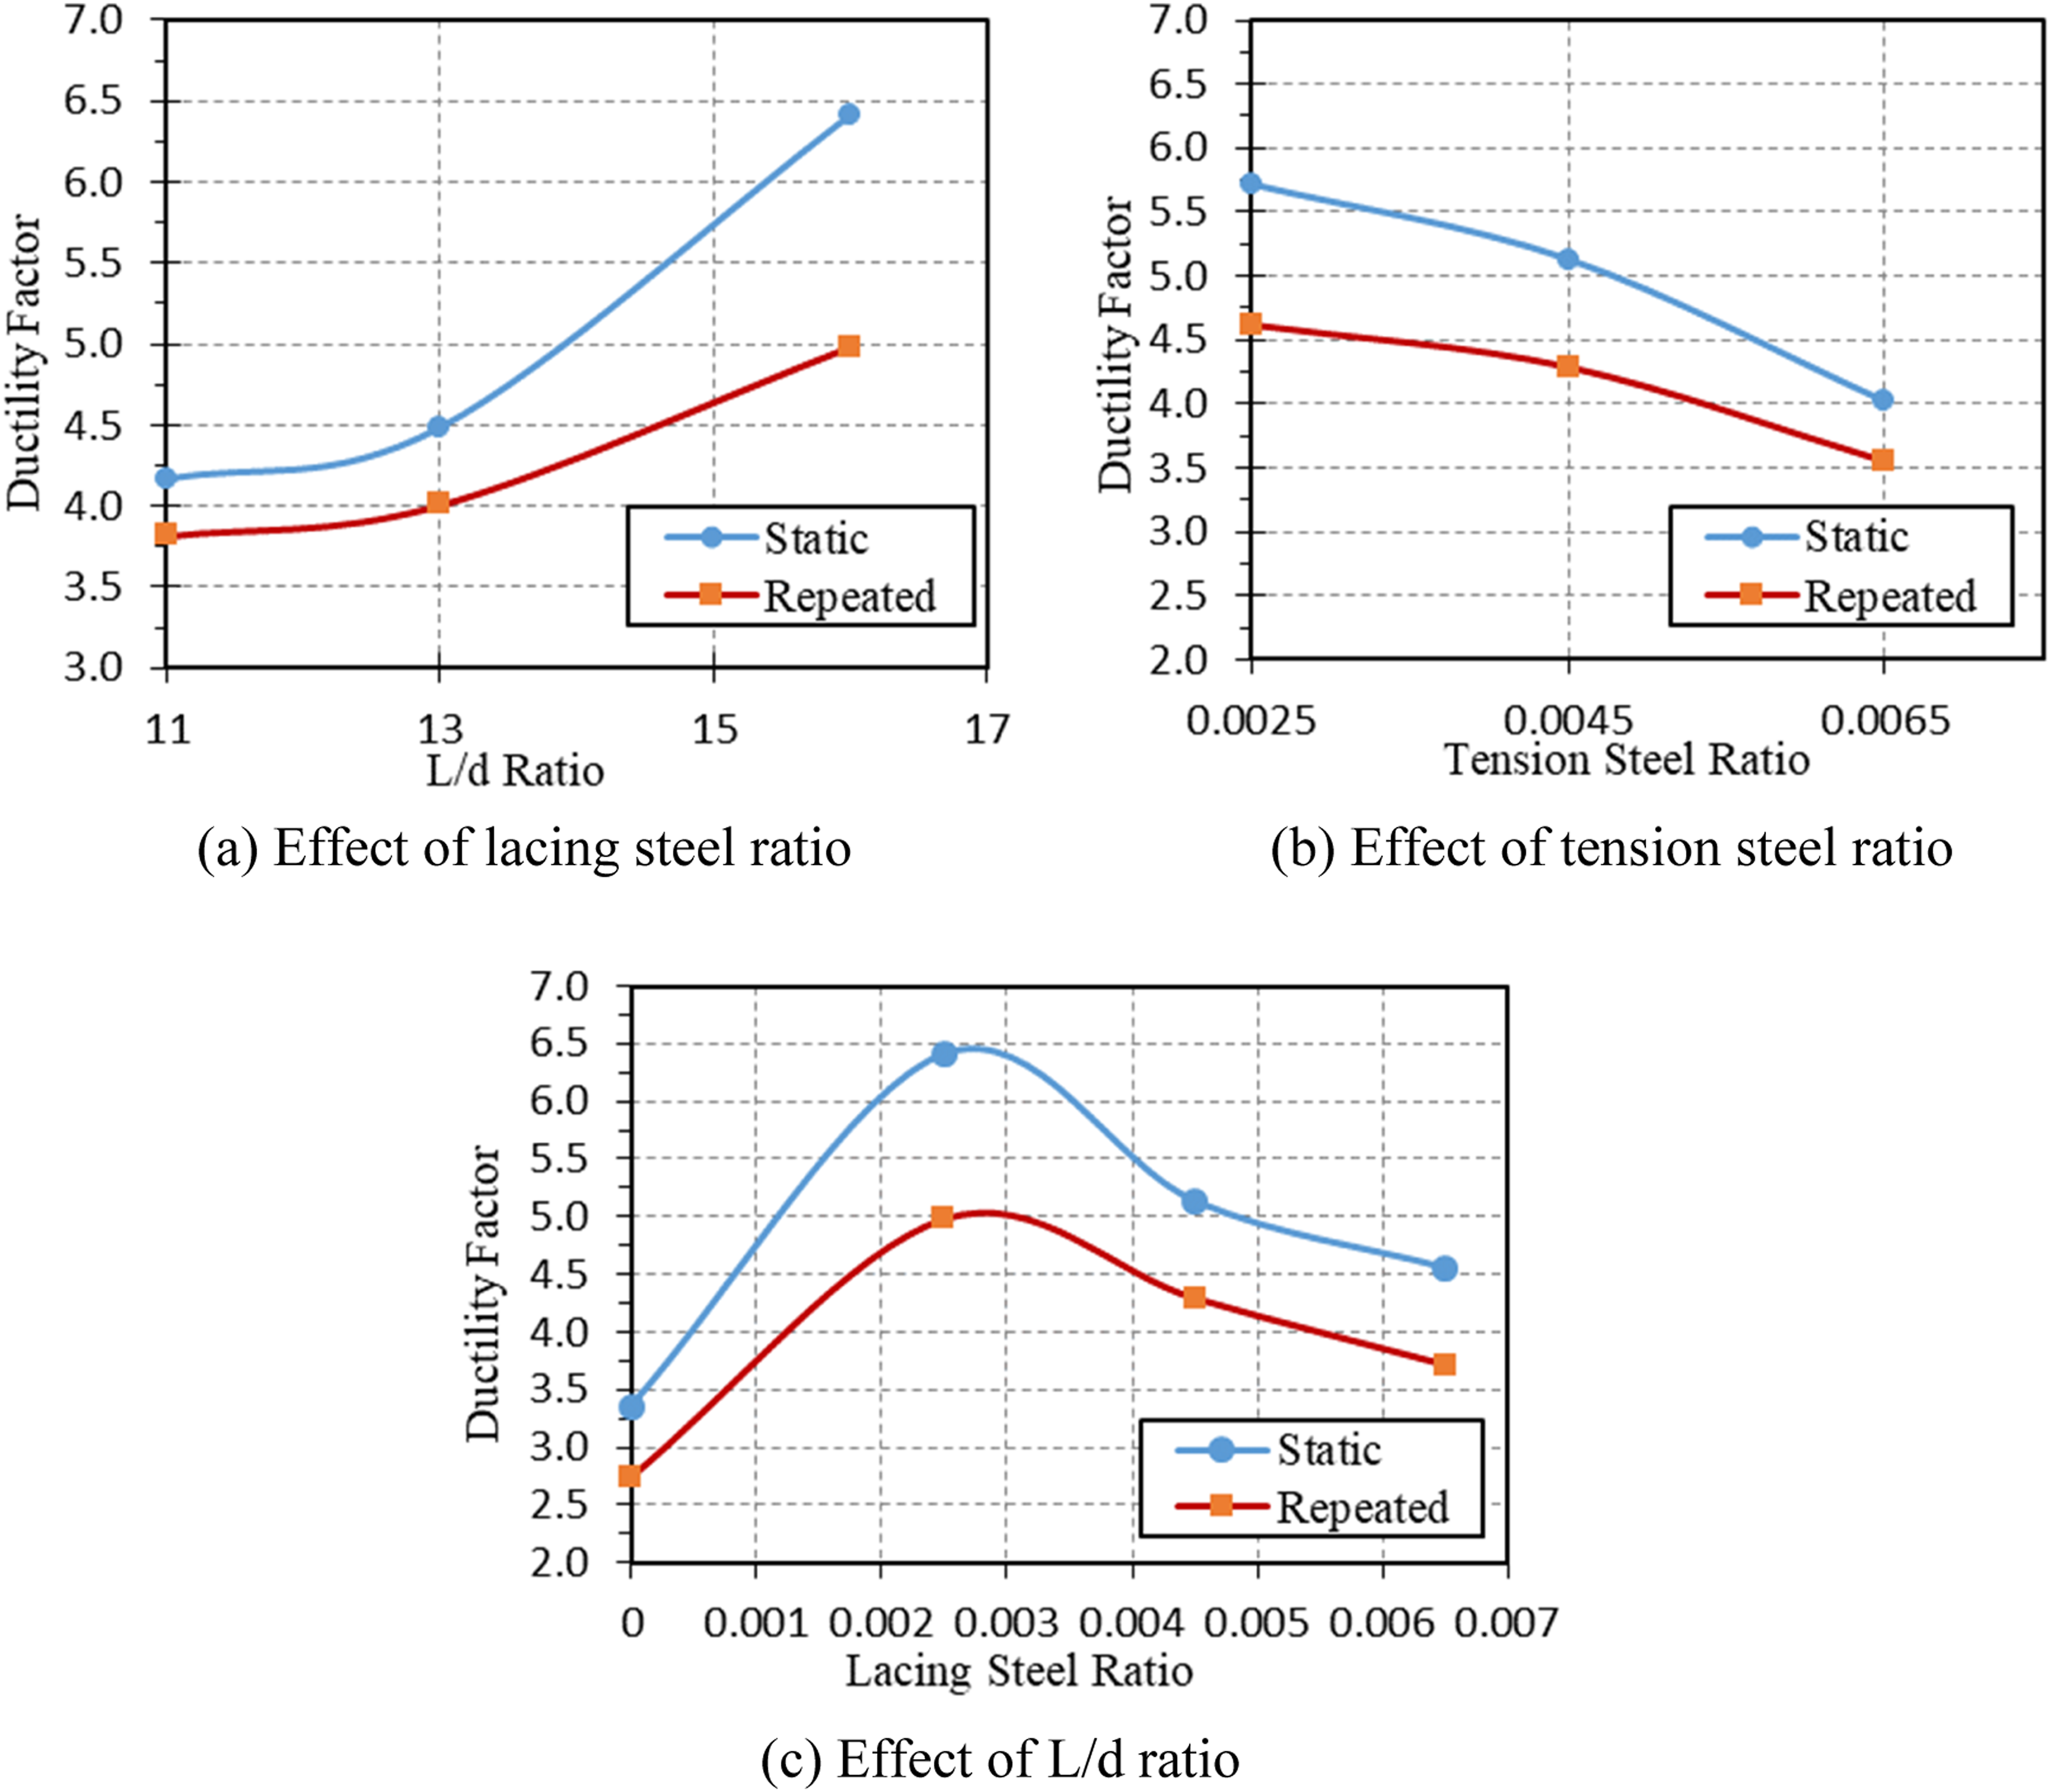
Finite element analysis
The tested slabs were analyzed numerically using the ABAQUS (2020) software package. The numerical results were compared with experimental results to confirm the FE models’ accuracy. The geometric and mechanical properties of the concrete slab and reinforcement used in the finite element analysis were the same as those of experimental specimens. The validated FE test program was used to study the effect of varying the lacing reinforcement ratio, the compressive strength of concrete, and the material types of the tension and lacing reinforcements, such as GFRP and CFRP.
Elements types and meshing
Brick elements with three-dimensional (3D) linear eight nodes (C3D8R) were used to simulate concrete as well as the loading plates (see Figure 8). The C3D8R element is a general-purpose linear brick element, with reduced integration and hourglass control. The C3D8R element has three degrees of freedom per node (displacements in the X, Y, and Z directions) and six faces with four integration points per face. Because bending was the primary mode of deformation, this element was adequate to capture the response adequately. The steel rebars as well as the lacing reinforcement were idealized using 3D truss elements (T3D2). These elements have only translational degrees of freedom at each node (displacements in the X, Y, and Z directions). Moreover, these elements carry only tensile or compressive loads with no resistance to bending. Finite Element model and meshing.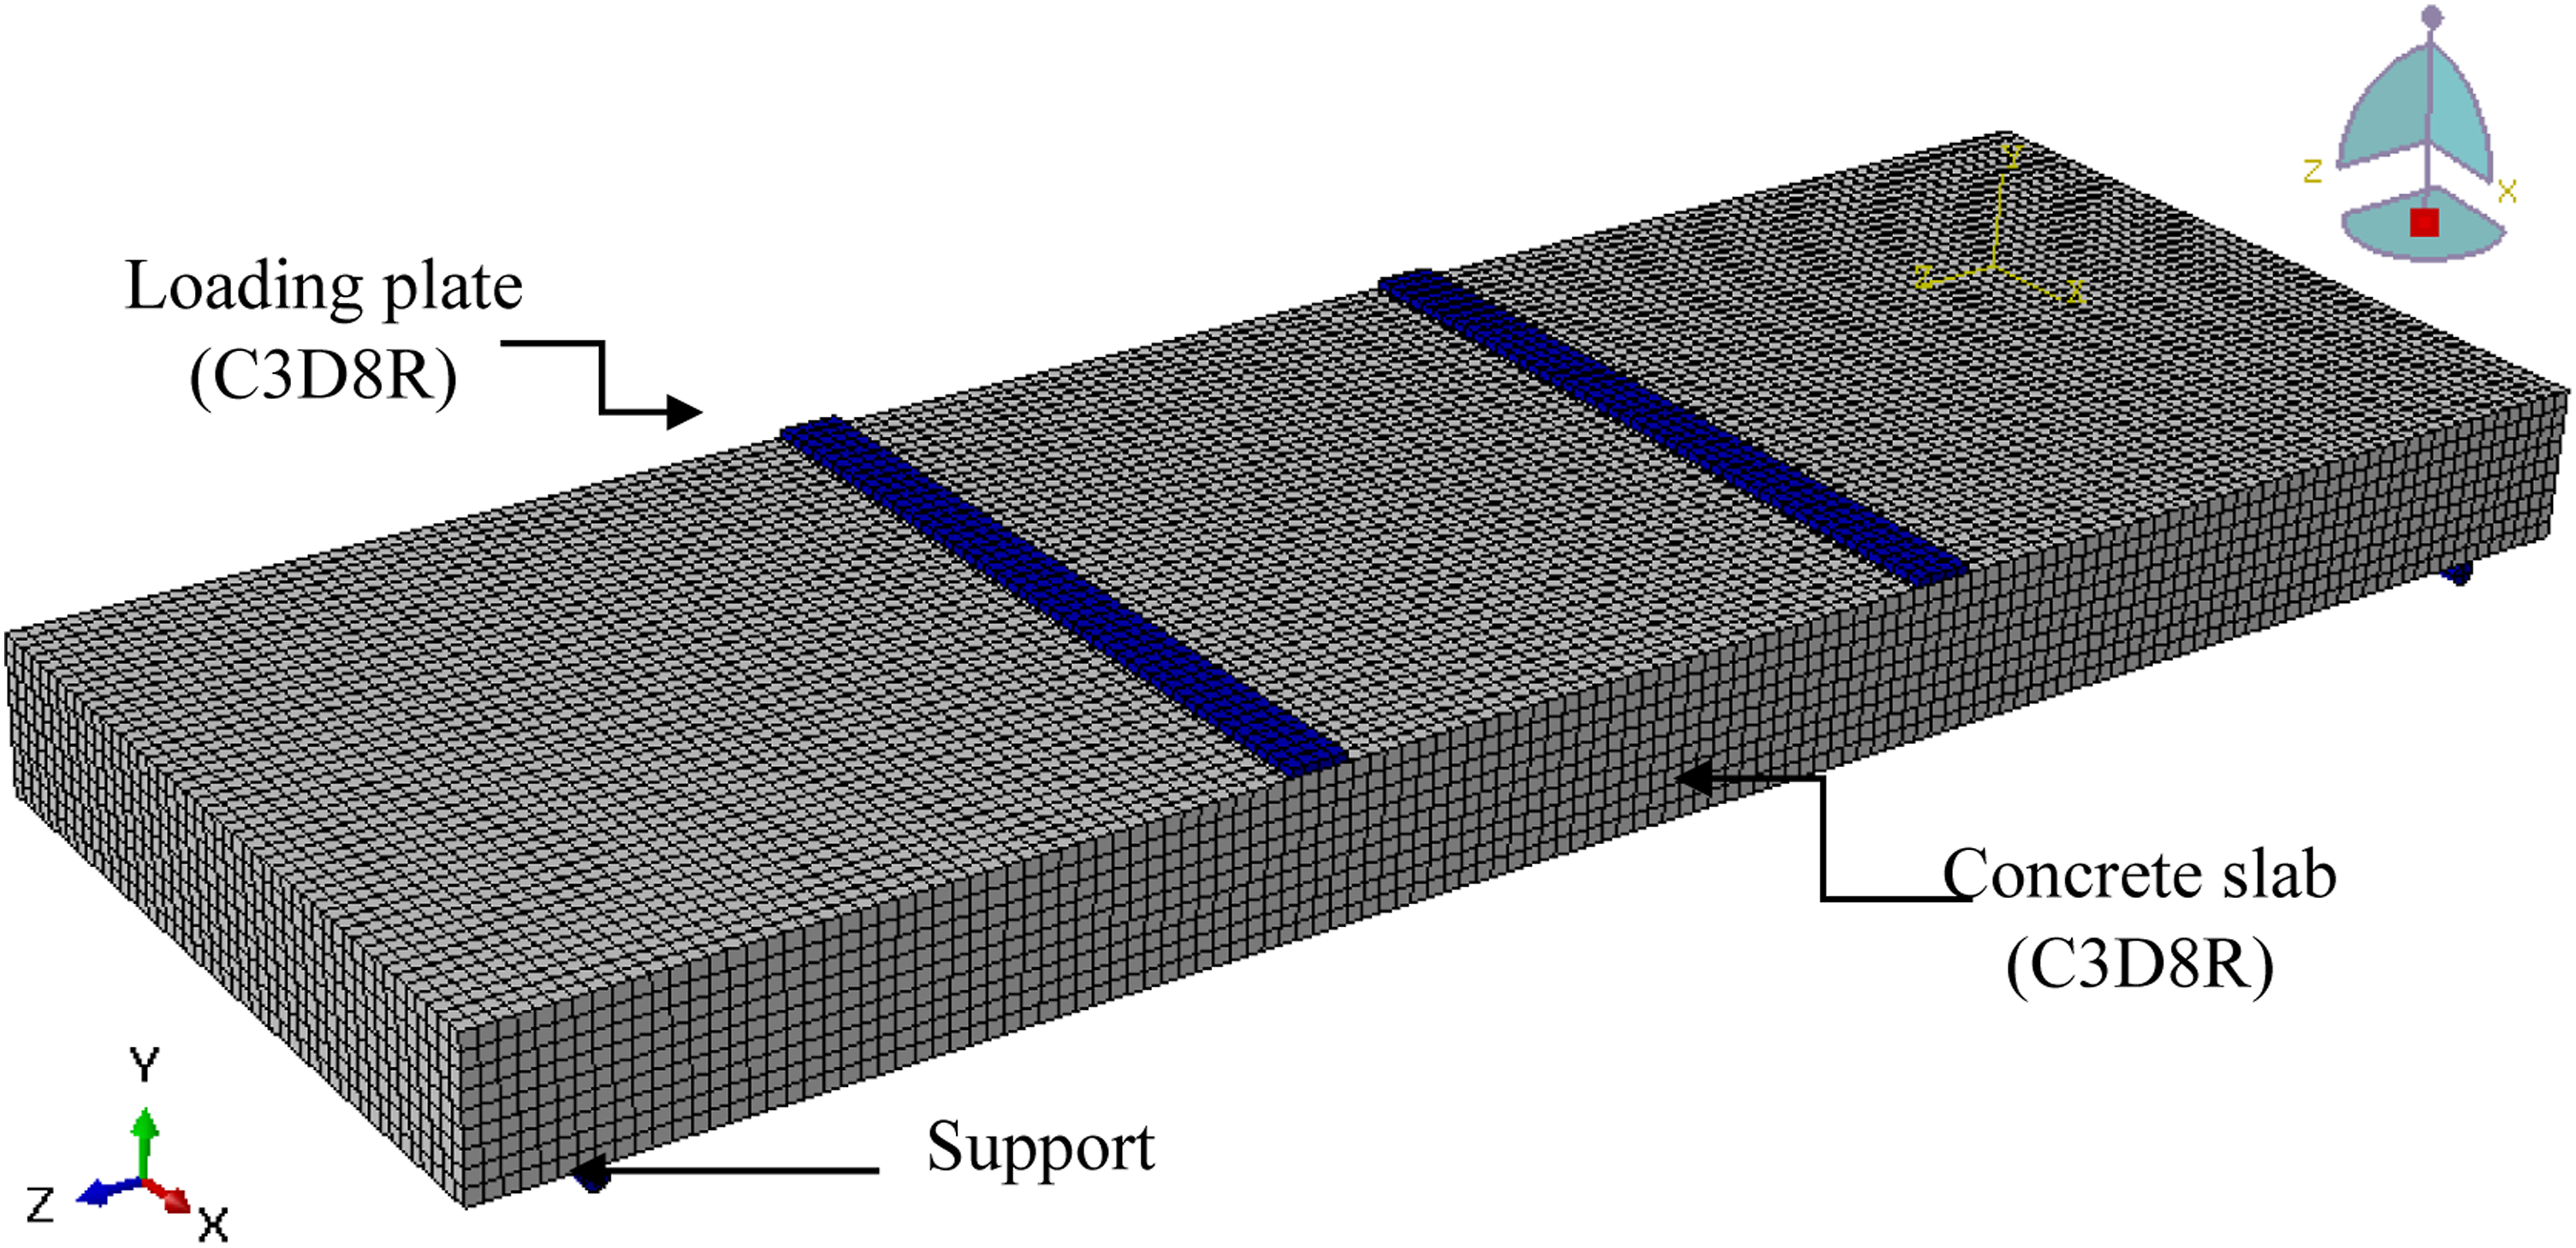
Mesh sensitivity analysis methods were employed to depict the load-displacement behavior of beam specimens. Various mesh sizes (10 mm, 15 mm, and 20 mm) were employed to assess the sensitivity of the simulation. The comparisons were based on the convergence errors and solving time. Following numerous iterations, a mesh size of 15 mm × 15 mm × 15 mm was opted for the concrete elements and loading steel plates (C3D8R size). The 15 mm mesh size was also adopted for the steel rebars and lacing reinforcements to ensure compatibility with the surrounding concrete elements. Comparative analyses indicated that refining the mesh size had no discernible impact on displacement and load. Consequently, a 15 mm mesh size was selected for use in the simulations (Figure 9). Modeling of the steel and lacing reinforcements. (a) Reinforcement steel. (b) Lacing reinforcement.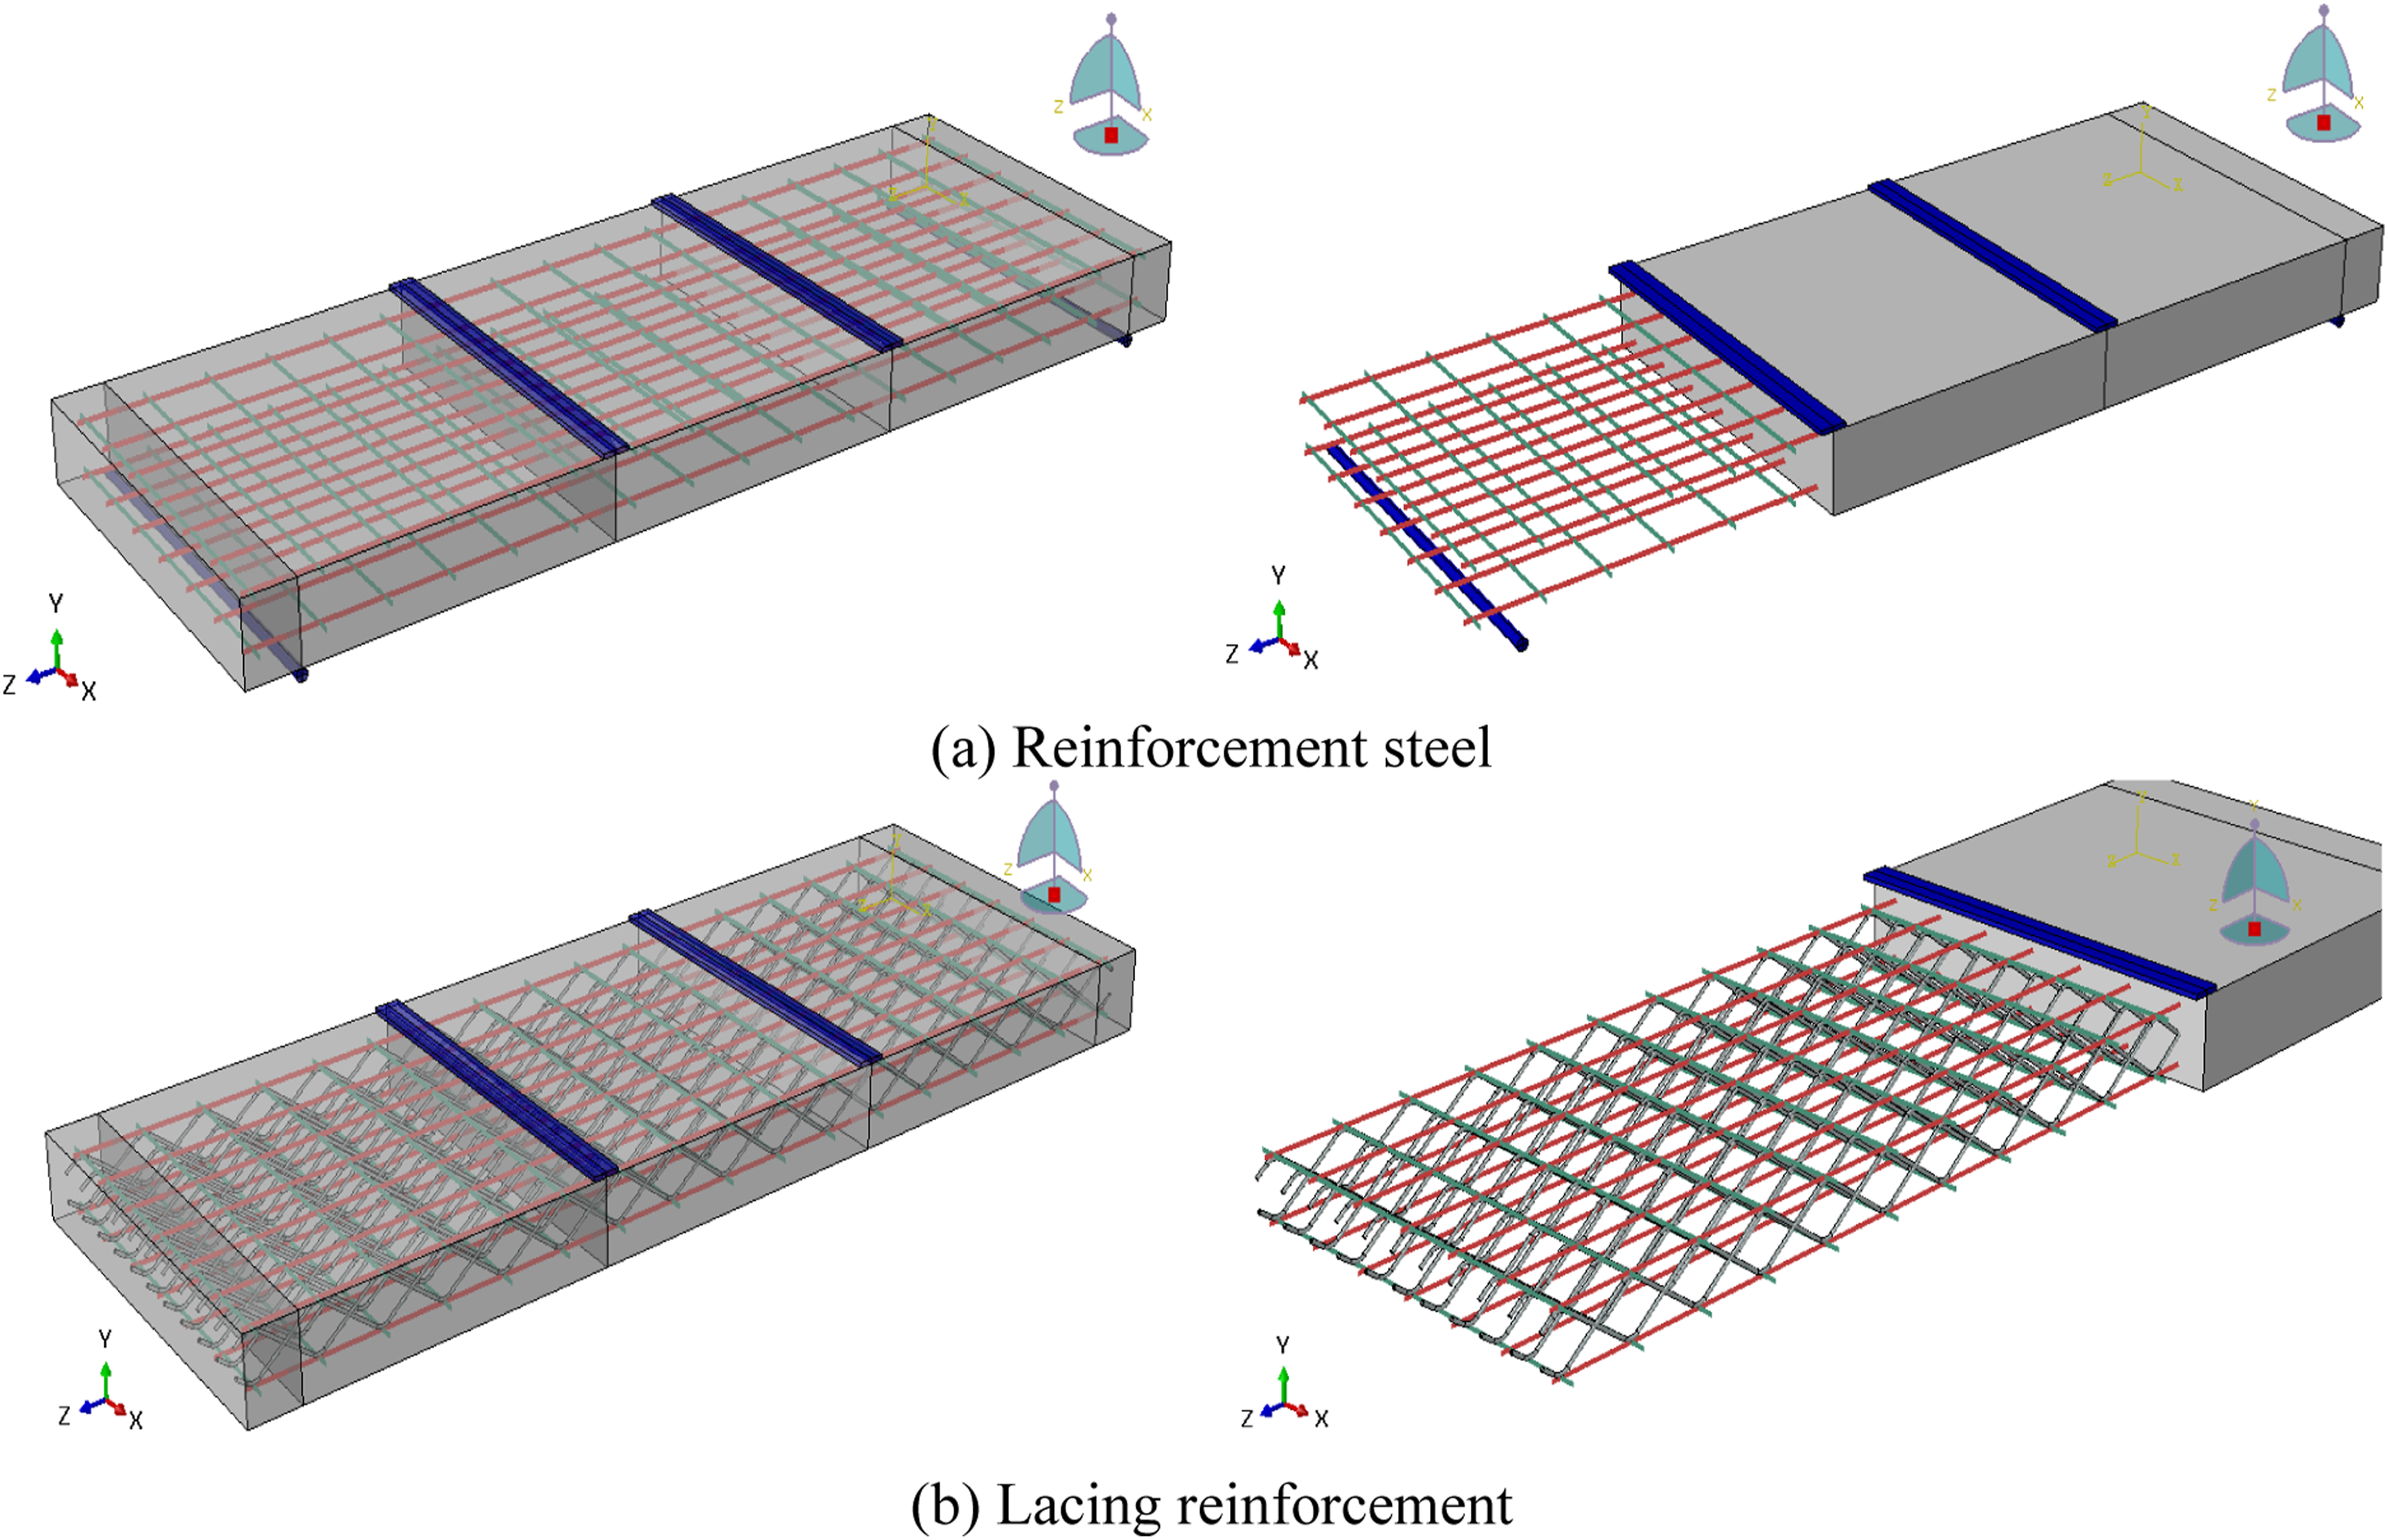
Boundary conditions and applied loading
The embedded element feature was employed to establish connections between the reinforcement and concrete elements. The reinforcement served as the embedded element, while the concrete functioned as the host element. In the present study, the static structural response of the analyzed beams was precisely predicted using the displacement-controlled technique. The modeling of the boundary conditions was done using the nodal displacement load. By restricting the X and Y axes, the hinged support was produced. Figure 10 illustrates the boundary conditions and the applied displacements. The FE solution was terminated by one of the following modes of failure: yielding in the longitudinal steel rebars or crushing of concrete. (a) The boundary conditions simulations, (b) The applied load simulations.
Materials modeling
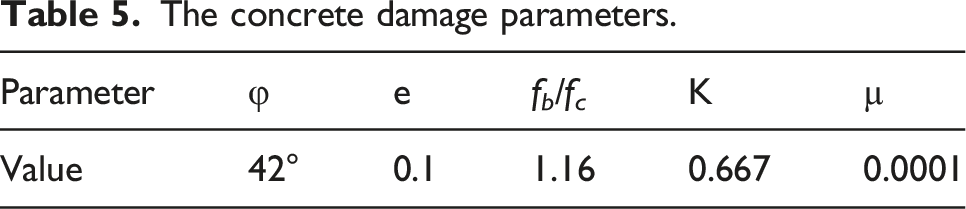
The concrete damage parameters.
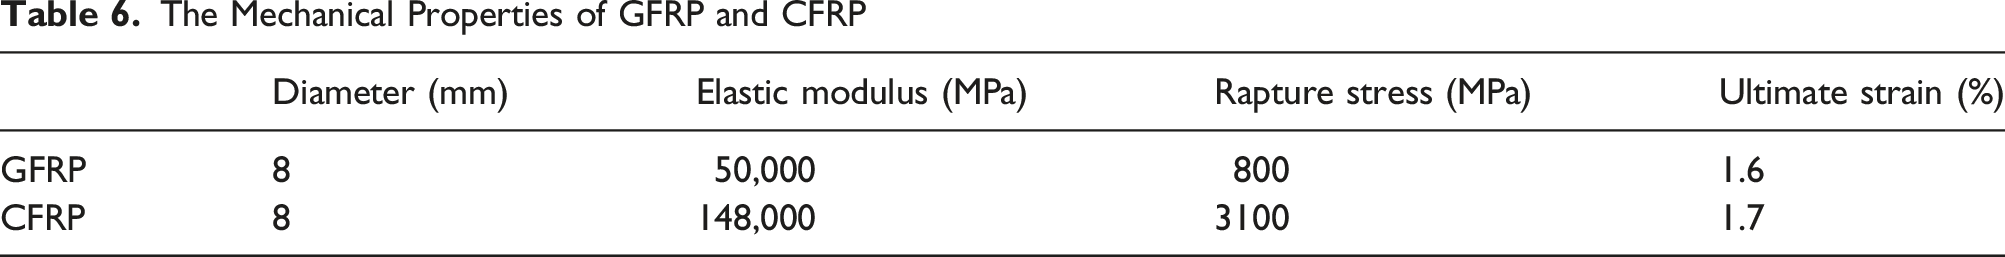
The Mechanical Properties of GFRP and CFRP
Validation of FE modeling
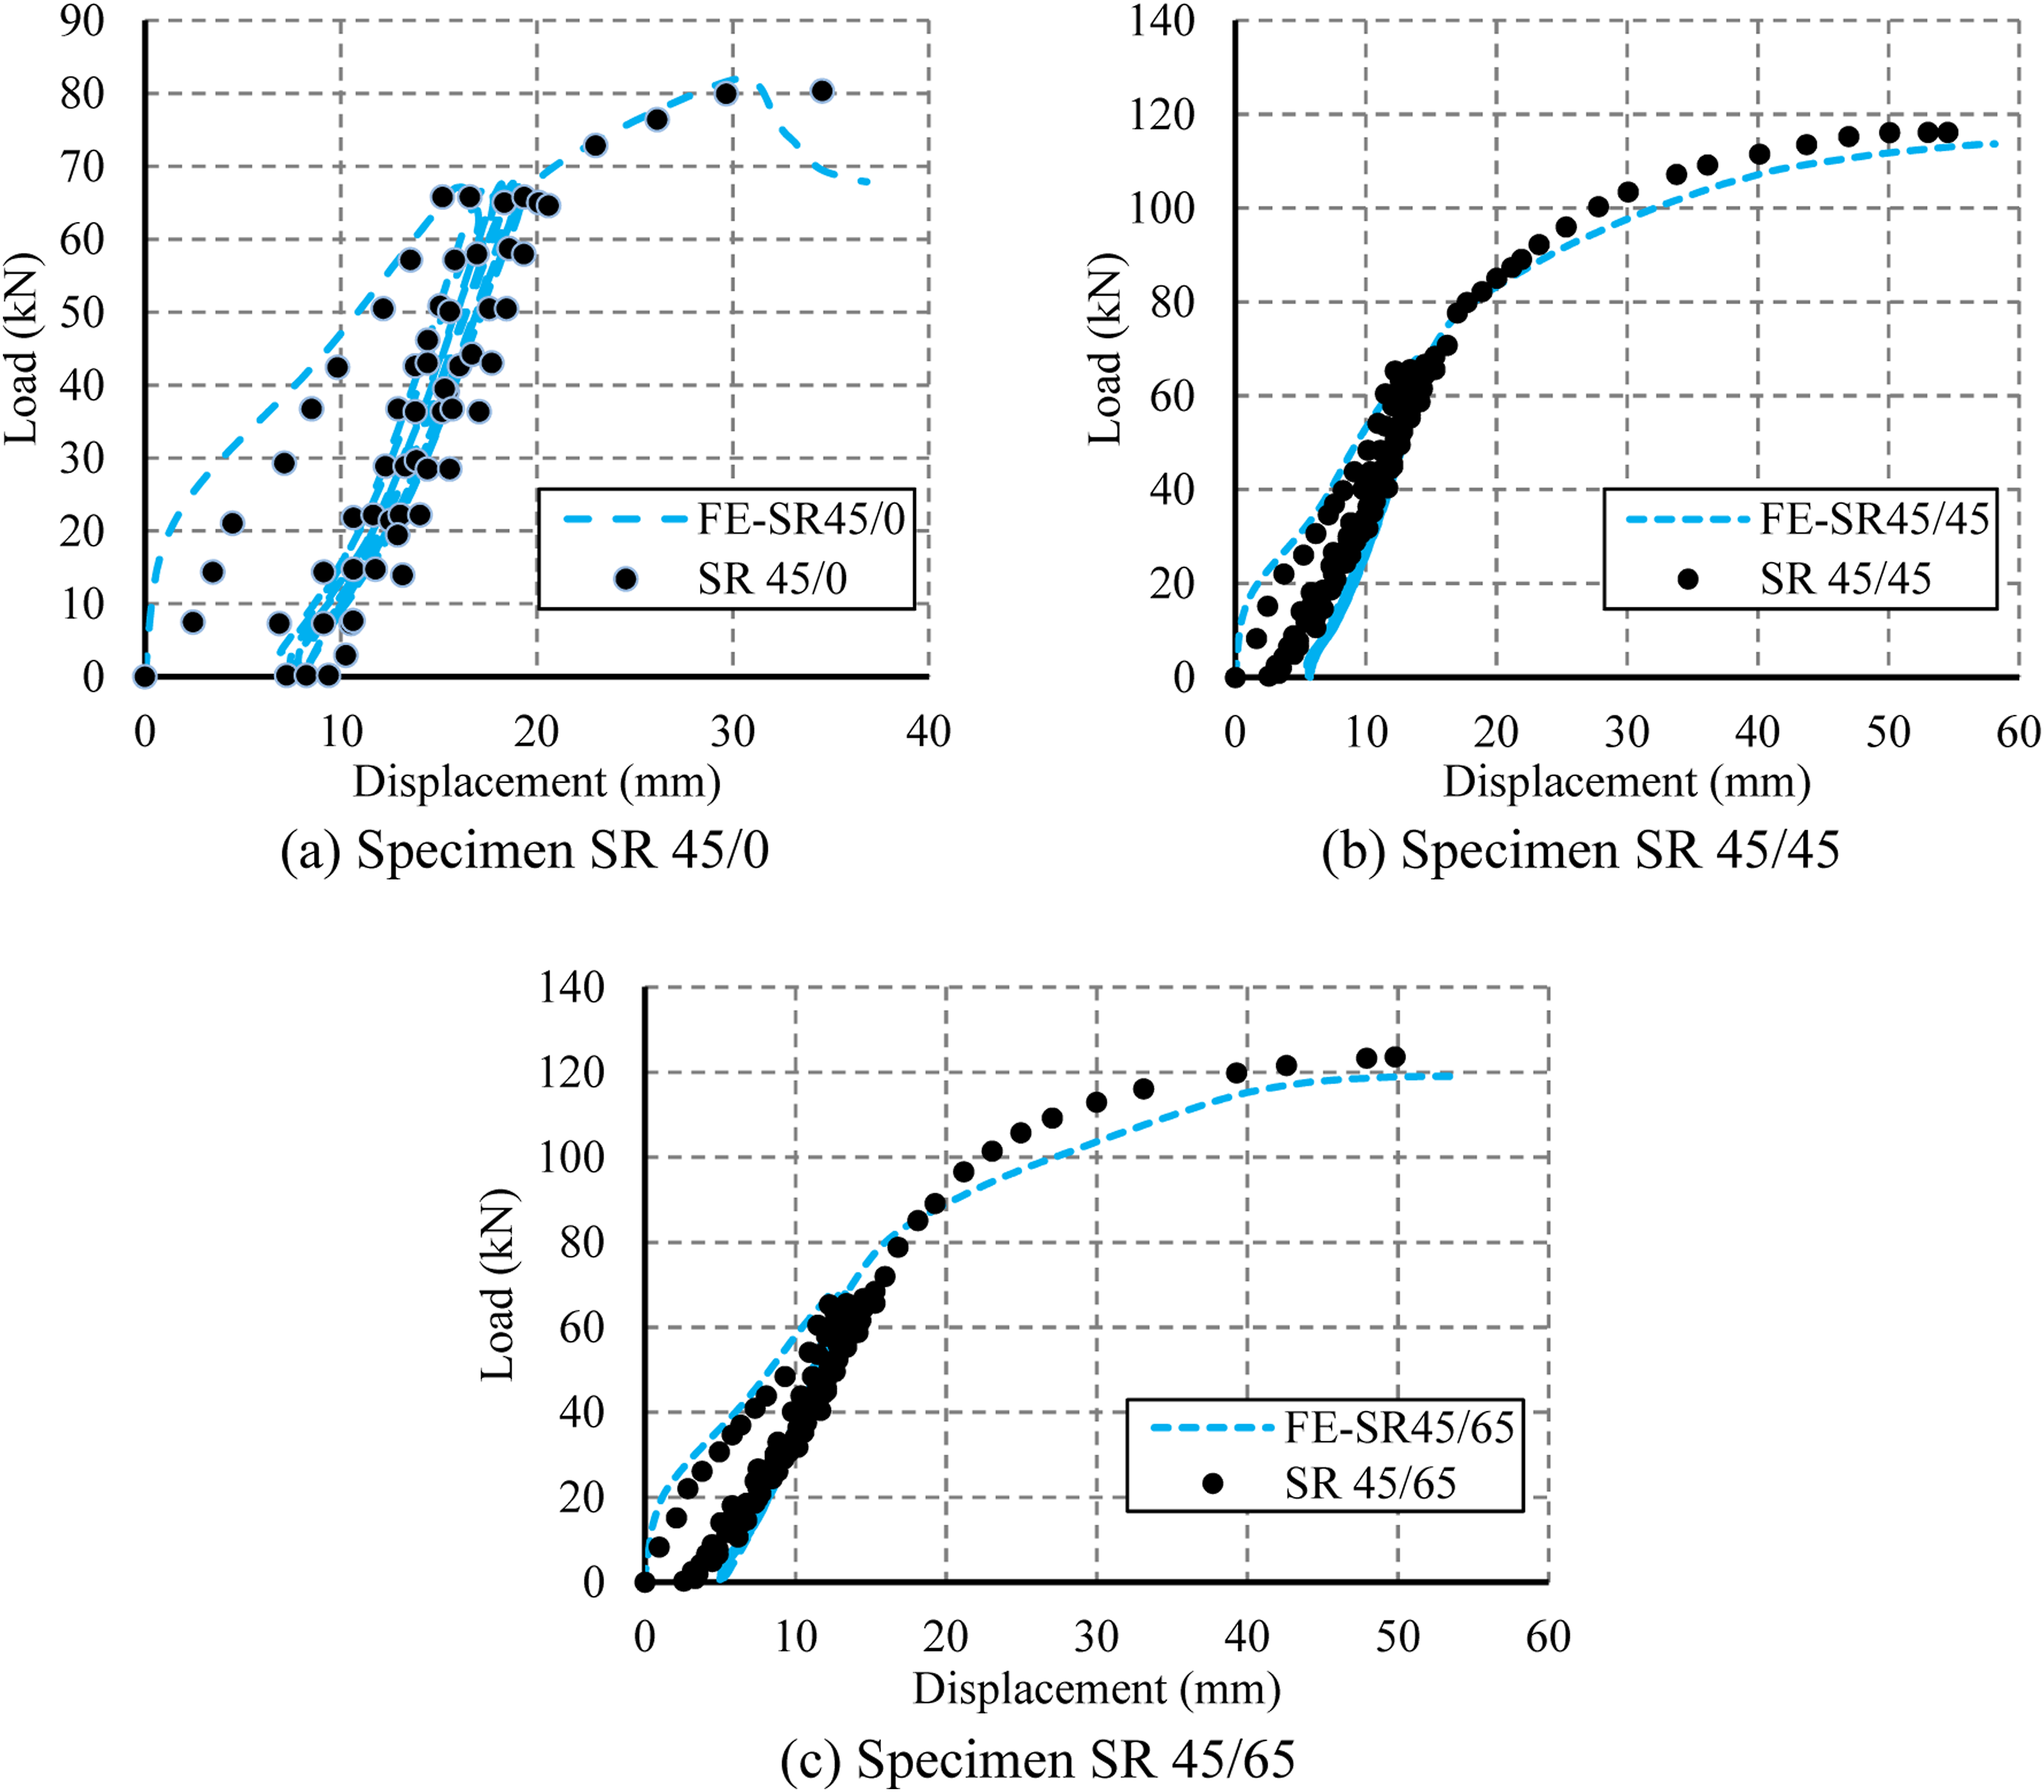
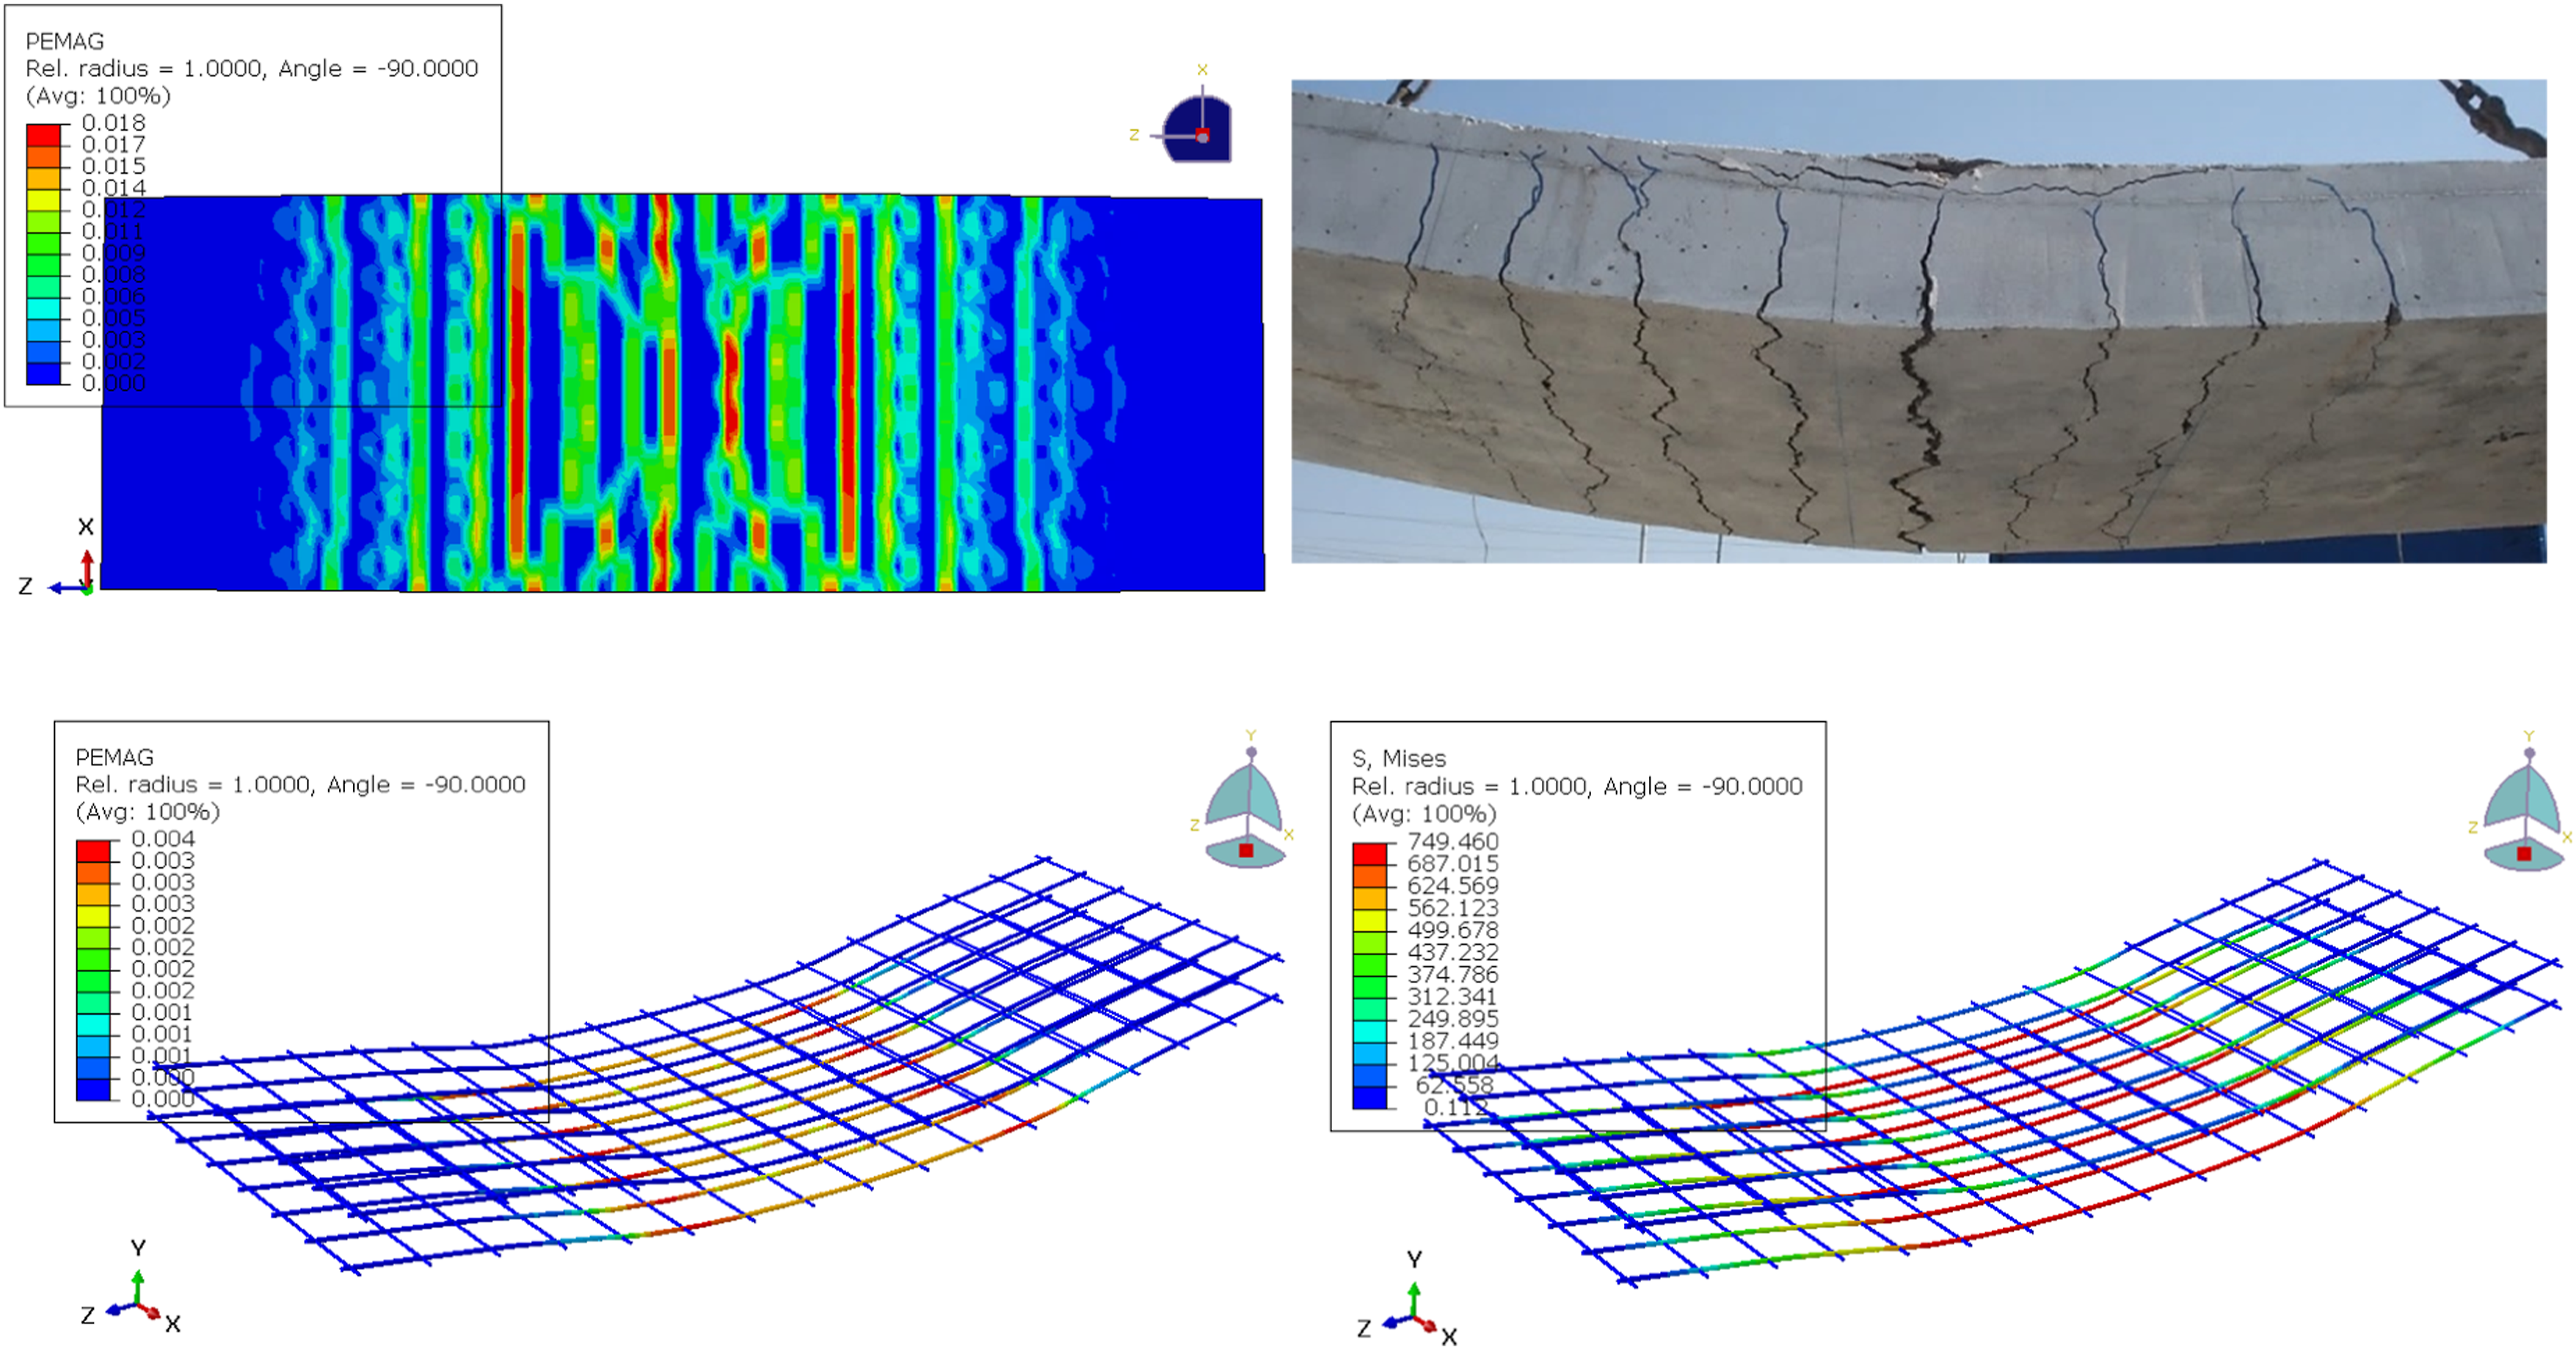
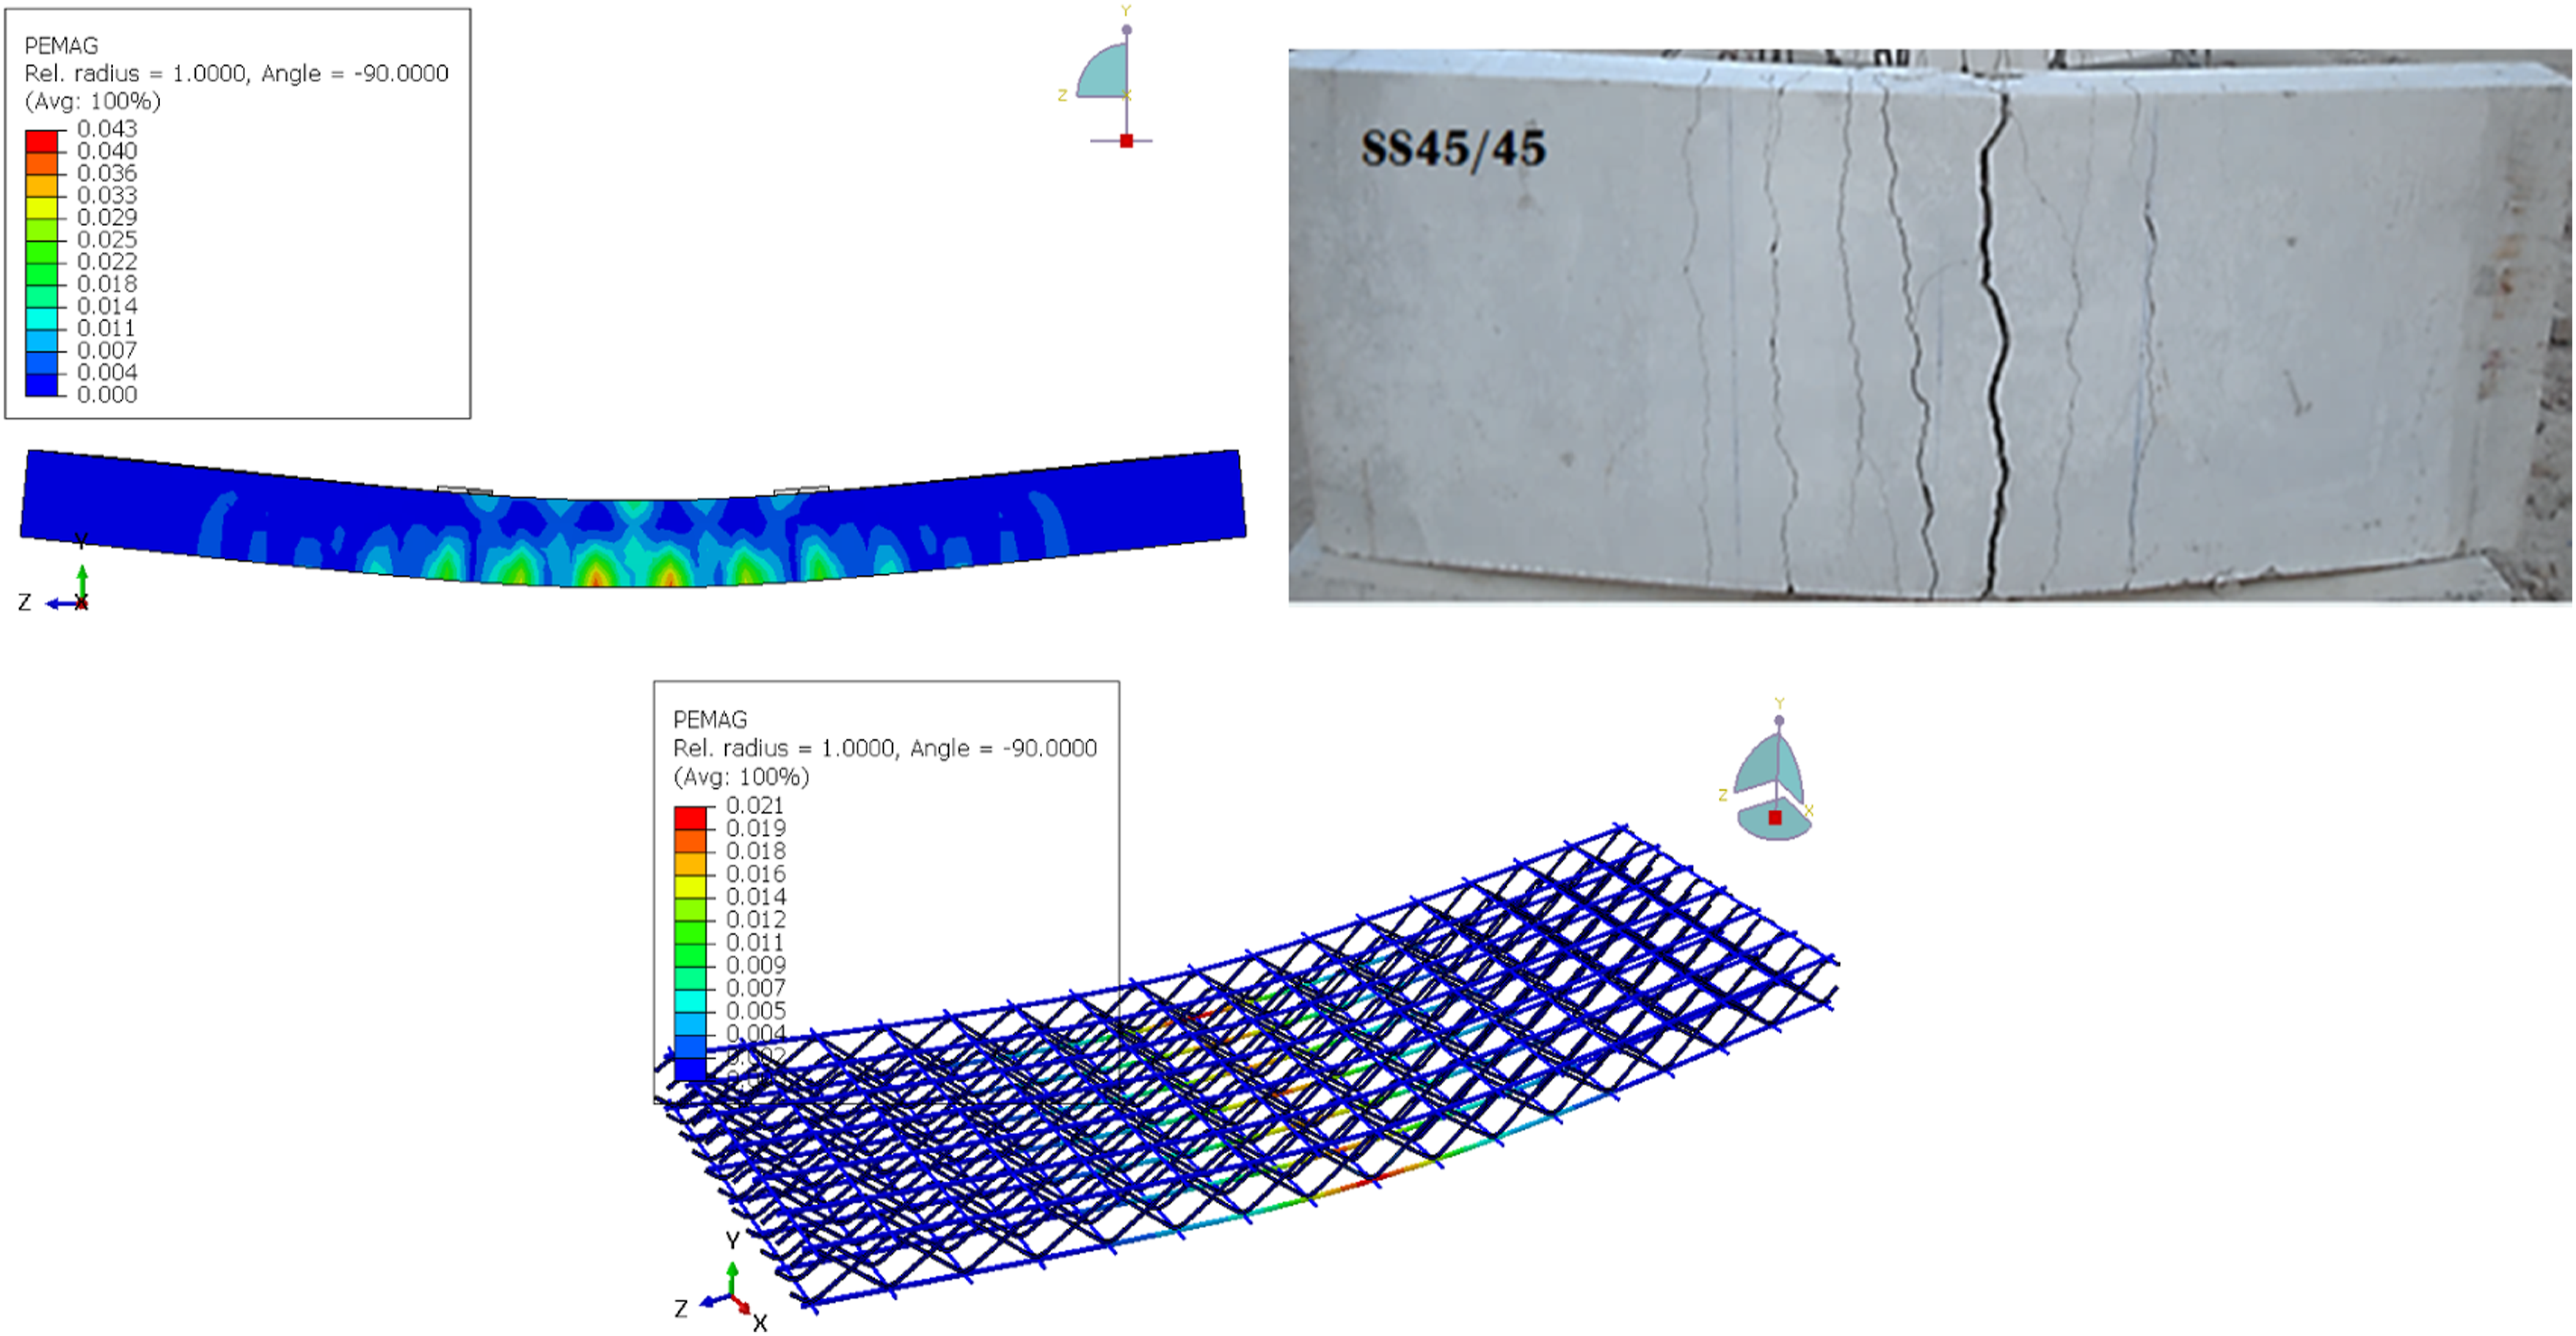
As shown in Figure 11, the experimental results of static tests on the three reference slabs with different amounts of lacing steel (SS45/0, SS45/45, and SS45/65) are compared to the FE results. Moreover, Figure 12 shows the comparisons for the slabs under repeated loading. The differences between the compared results are in the range of 1%–3%. Good agreements between the experimental and FE results were obtained from these comparisons. Moreover, the FE and experimental concrete modes of failure are compared in Figures 13 and 14 as well and the plastic strains and von Mises stresses in the steel and lacing reinforcements are shown. Therefore, the developed numerical models can be used to accurately predict the behavior of the laced reinforced concrete slab with good agreement. Comparisons between the load-displacement curves for the FE and experimental results under static loading. Comparisons between the load-displacement curves for the FE and experimental results under repeated loading. (a) Specimen SR 45/0. (b) Specimen SR 45/45. (c) Specimen SR 45/65. The concrete mode of failure as well as the plastic strains and von Mises stresses in the steel and lacing reinforcements for specimen SS45/0. The concrete mode of failure as well as the plastic strains and von Mises stresses in the steel and lacing reinforcements for specimen SS45/45.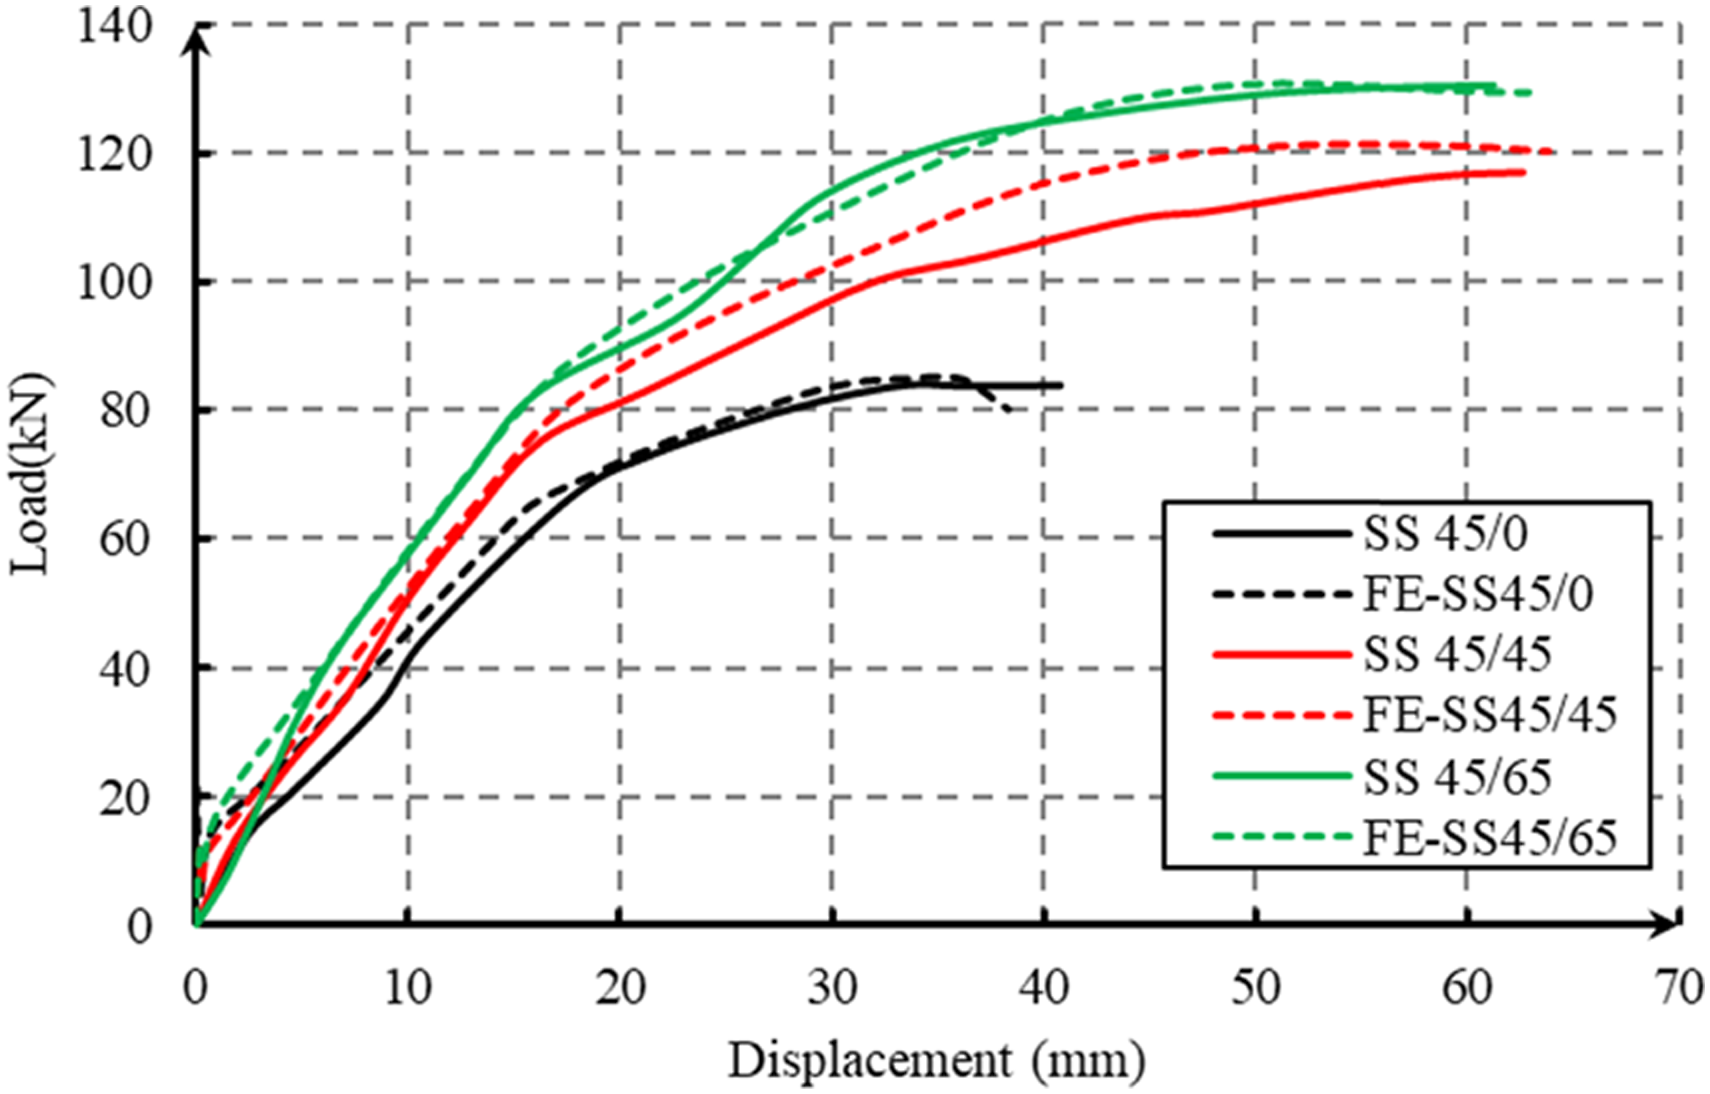
Parametric study
Concrete slabs with lacing reinforcement comprise concrete, flexural reinforcement, and lacing reinforcement elements. Hence, modifying these parameters will enhance our comprehension of the distinct contributions of each element to the overall behavior of such slabs. Therefore, the verified FE models were used to develop the parametric study and to provide the data for design models for the slabs reinforced with lacing systems. The investigated parameters are as follows: (1) The first parameter was the effect of the ratio between the lacing and the flexural reinforcement values. Five reinforcement ratios (r = Alacing (lacing steel)/As (flexural steel)) were used in this study (0, 1.0, 1.44, 2.03, 2.64, and 3.81). These ratios were investigated for concrete compressive strengths of 25, 35, and 50 MPa. (2) The second parameter was the effect of the concrete compressive strength. In this study, three strengths were investigated (25 MPa, 35 MPa, and 50 MPa) for four lacing reinforcement ratios (0.0, 1.0, 2.03, and 3.81). (3) The third one was the material type of the flexural reinforcement. GFRP and CFRP rebars were used instead of steel rebars.
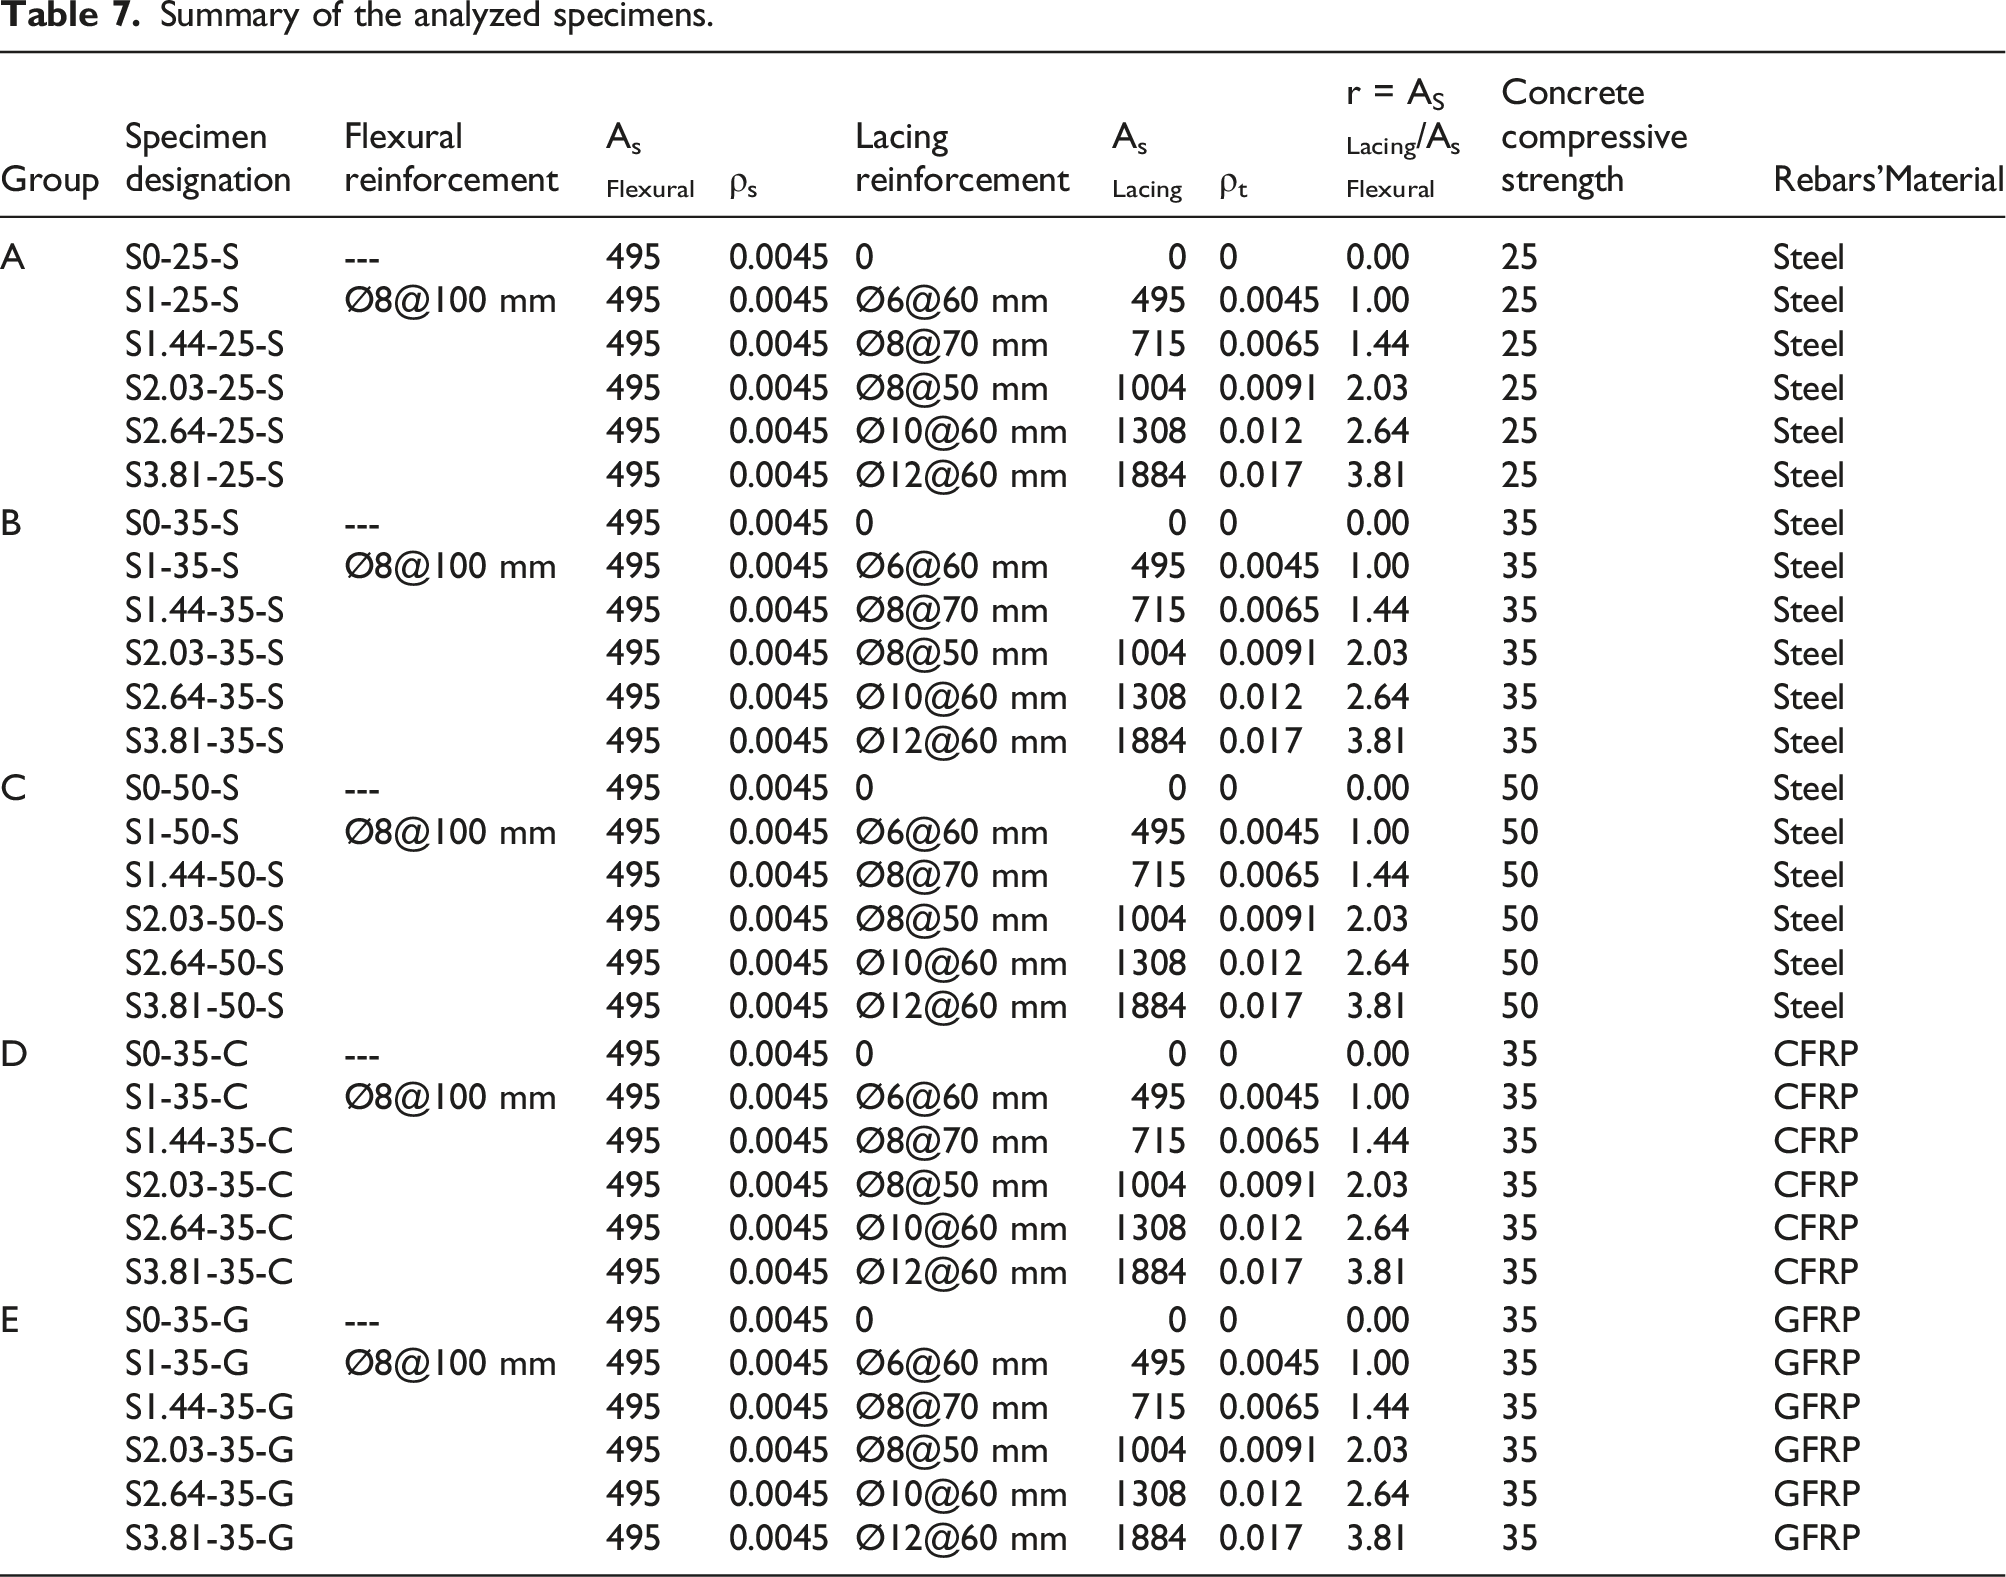
Summary of the analyzed specimens.
Static loading
Effect of the lacing-to-flexural reinforcement ratio and compressive strength of concrete
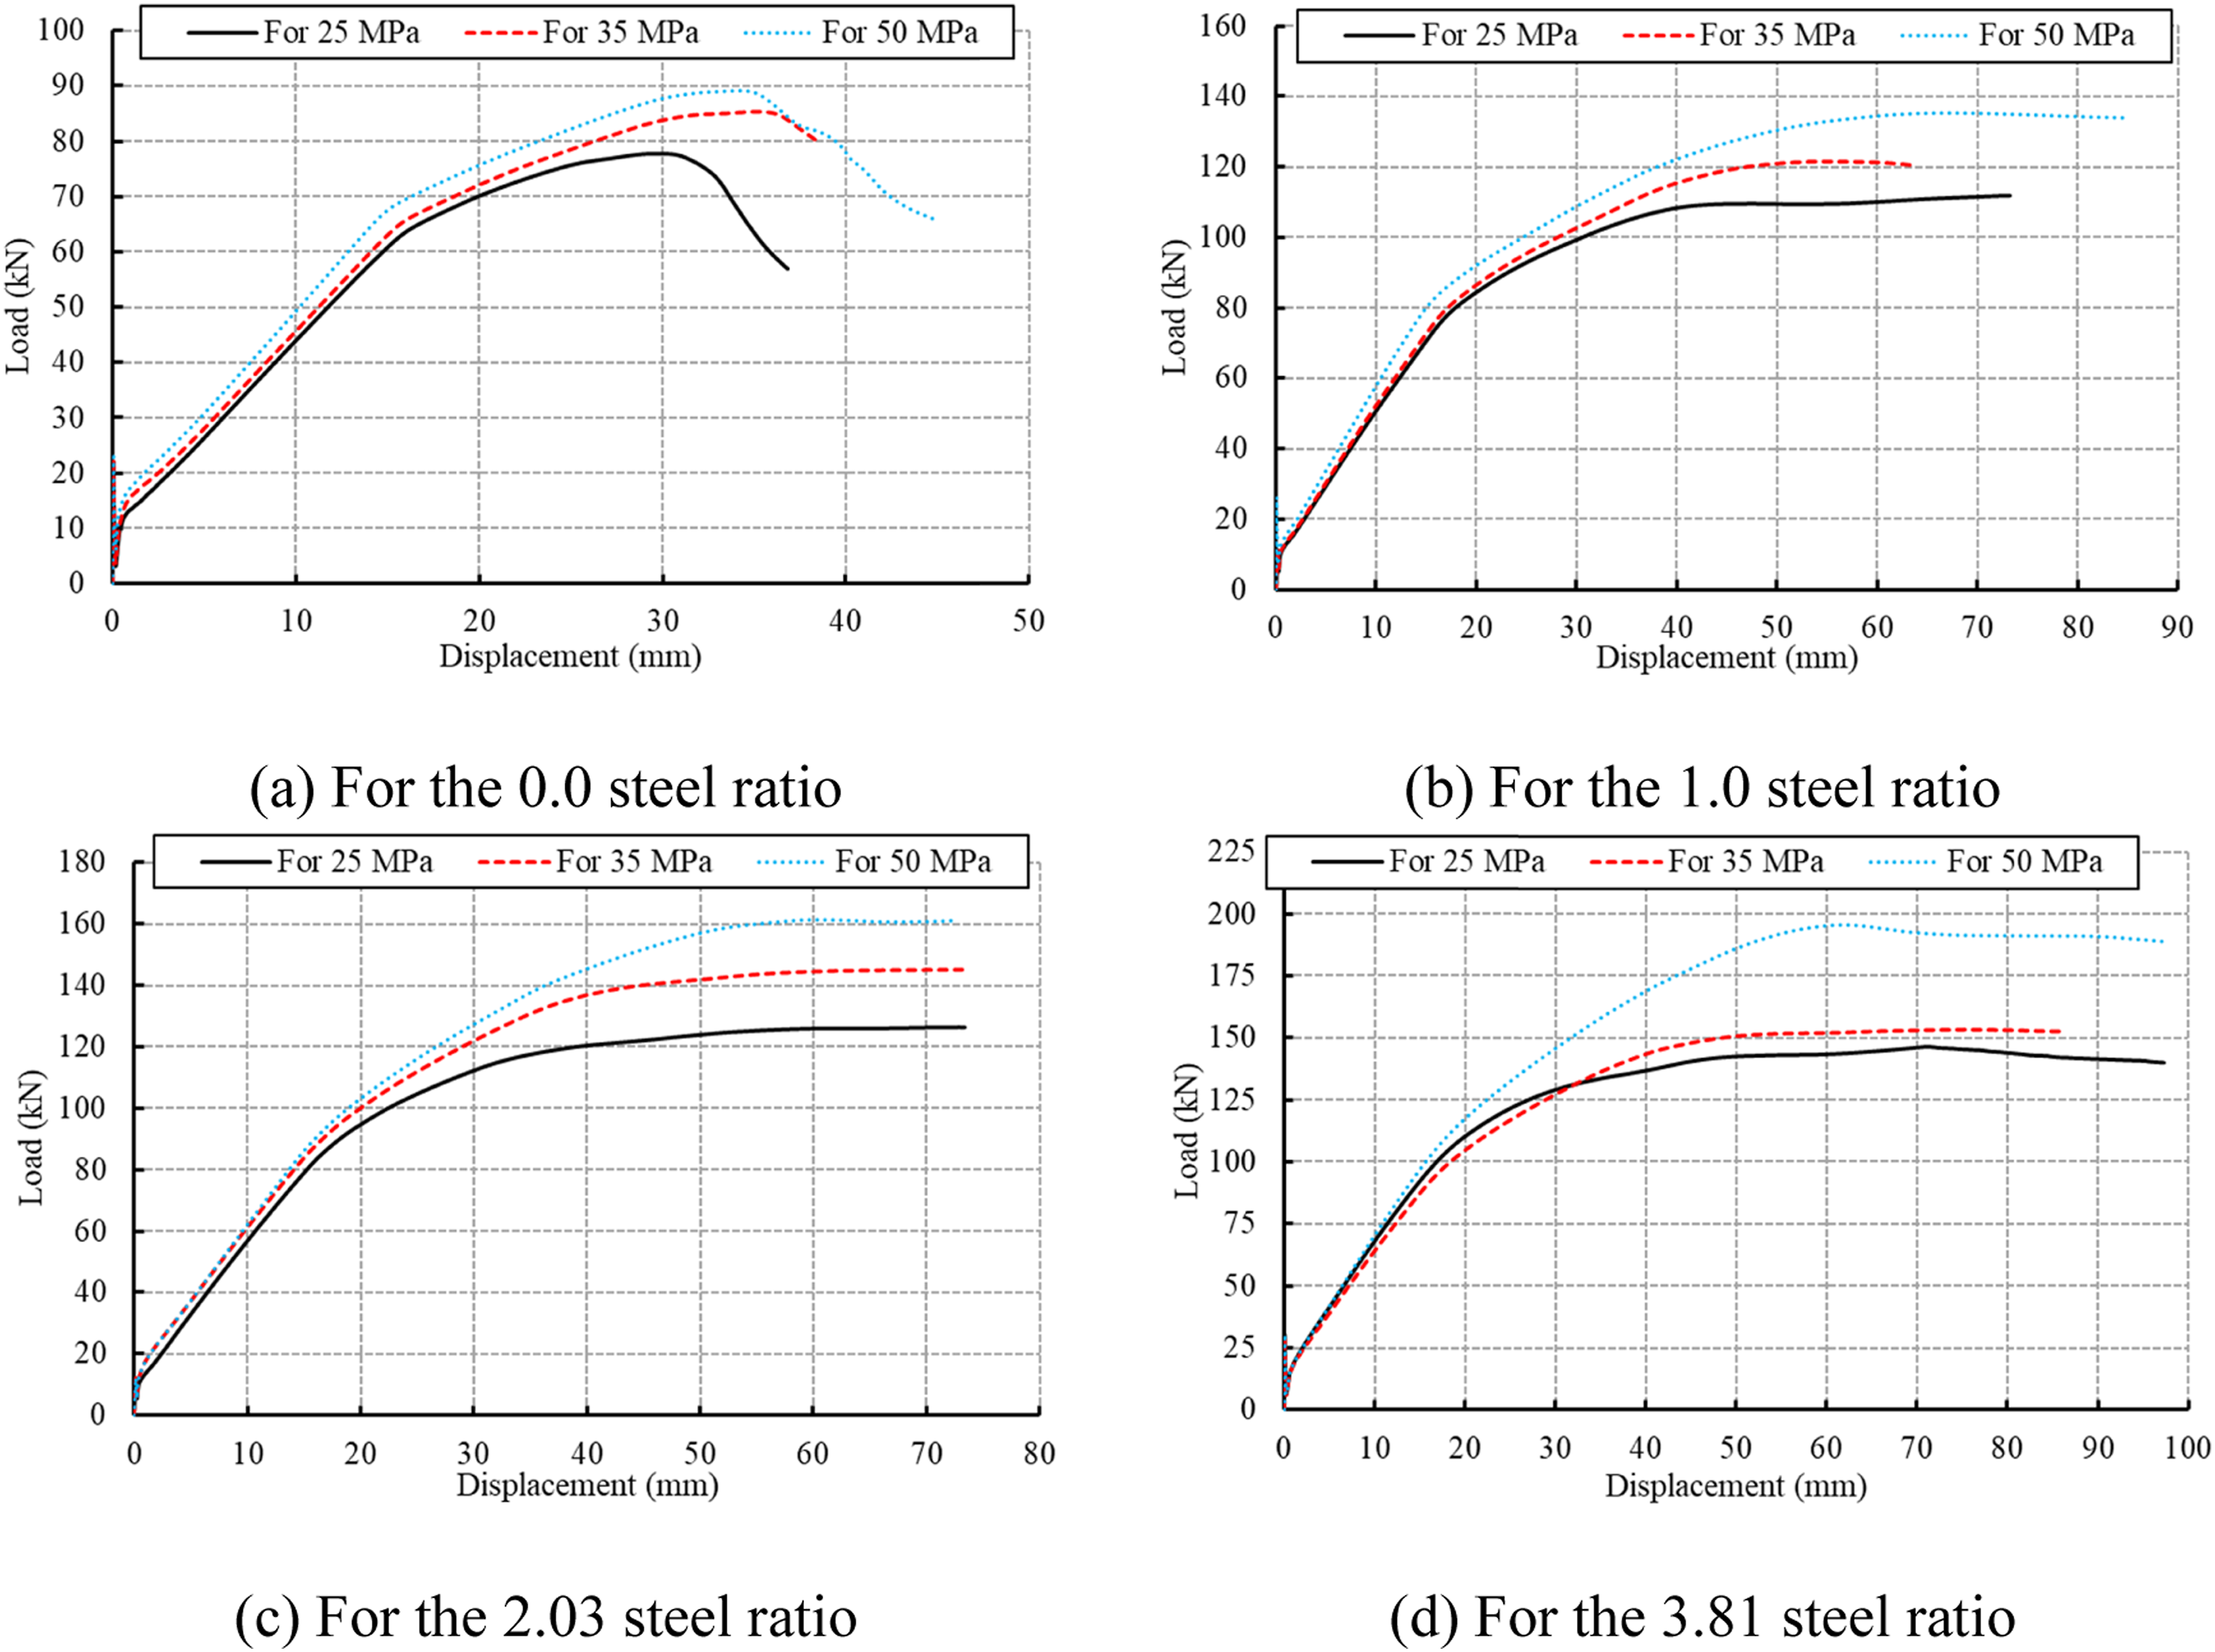
The primary contributor to a slab’s flexural strength is the main flexural reinforcement. If the ratio of flexural reinforcement decreases compared to the lacing reinforcement, the slab might not have sufficient capacity to resist flexural loads. Lacing reinforcement is essential for controlling crack widths and distributions. A higher ratio of lacing reinforcement to flexural reinforcement generally leads to better crack control, especially for shrinkage and temperature-related cracking. The balanced reinforcement design enhances the slab’s ability to undergo deformations without catastrophic failure. The effect of the lacing-to-flexural reinforcement ratio is illustrated in Figures 15 and 16 for the concrete compressive strengths of 25, 35, and 50 MPa. The slab capacity increased by 85.7% when the lacing to flexural reinforcement ratio increased from 0.0 to 3.81 and the concrete compressive strength was 25 MPa. This enhancement in the slab capacity became 119.1% in the case of 50 MPa compressive strength. Moreover, the lacing reinforcement exhibited less strain at the same loading level when the concrete compressive strength increased (see Figure 16). At yielding of lacing reinforcement (strain = 0.002), the corresponding loads were 137 kN and 127 kN in the cases of 50 MPa and 25 MPa, respectively, when using the 3.81 ratio. However, these corresponding loads were 104 kN and 99 kN, respectively, in the case of the 1.0 ratio. That means enhancing the ratio of lacing reinforcement compared to flexural reinforcement proves to be a more impactful strategy, significantly contributing to the increased capacity of the slab, especially when utilizing concrete with higher compressive strength (see Figure 17). As the lacing reinforcement is effectively distributed and properly proportioned, it enhances the ductility of the slab by distributing stresses throughout the slab. Moreover, the higher ratio of lacing reinforcement provided slight increases in the stiffness of the analyzed slabs. Effect of the lacing to flexural reinforcement ratio on the load-displacement relationships under static loading. (a) For compressive strength of 25 MPa. (b) For compressive strength of 35 MPa. (c) For compressive strength of 50 MPa. Effect of the lacing to flexural reinforcement ratio on the strains in the lacing reinforcement. (a) For compressive strength of 25 MPa. (b) For compressive strength of 50 MPa. Effect of the compressive strength. (a) For the 0.0 steel ratio. (b) For the 1.0 steel ratio. (c) For the 2.03 steel ratio. (d) For the 3.81 steel ratio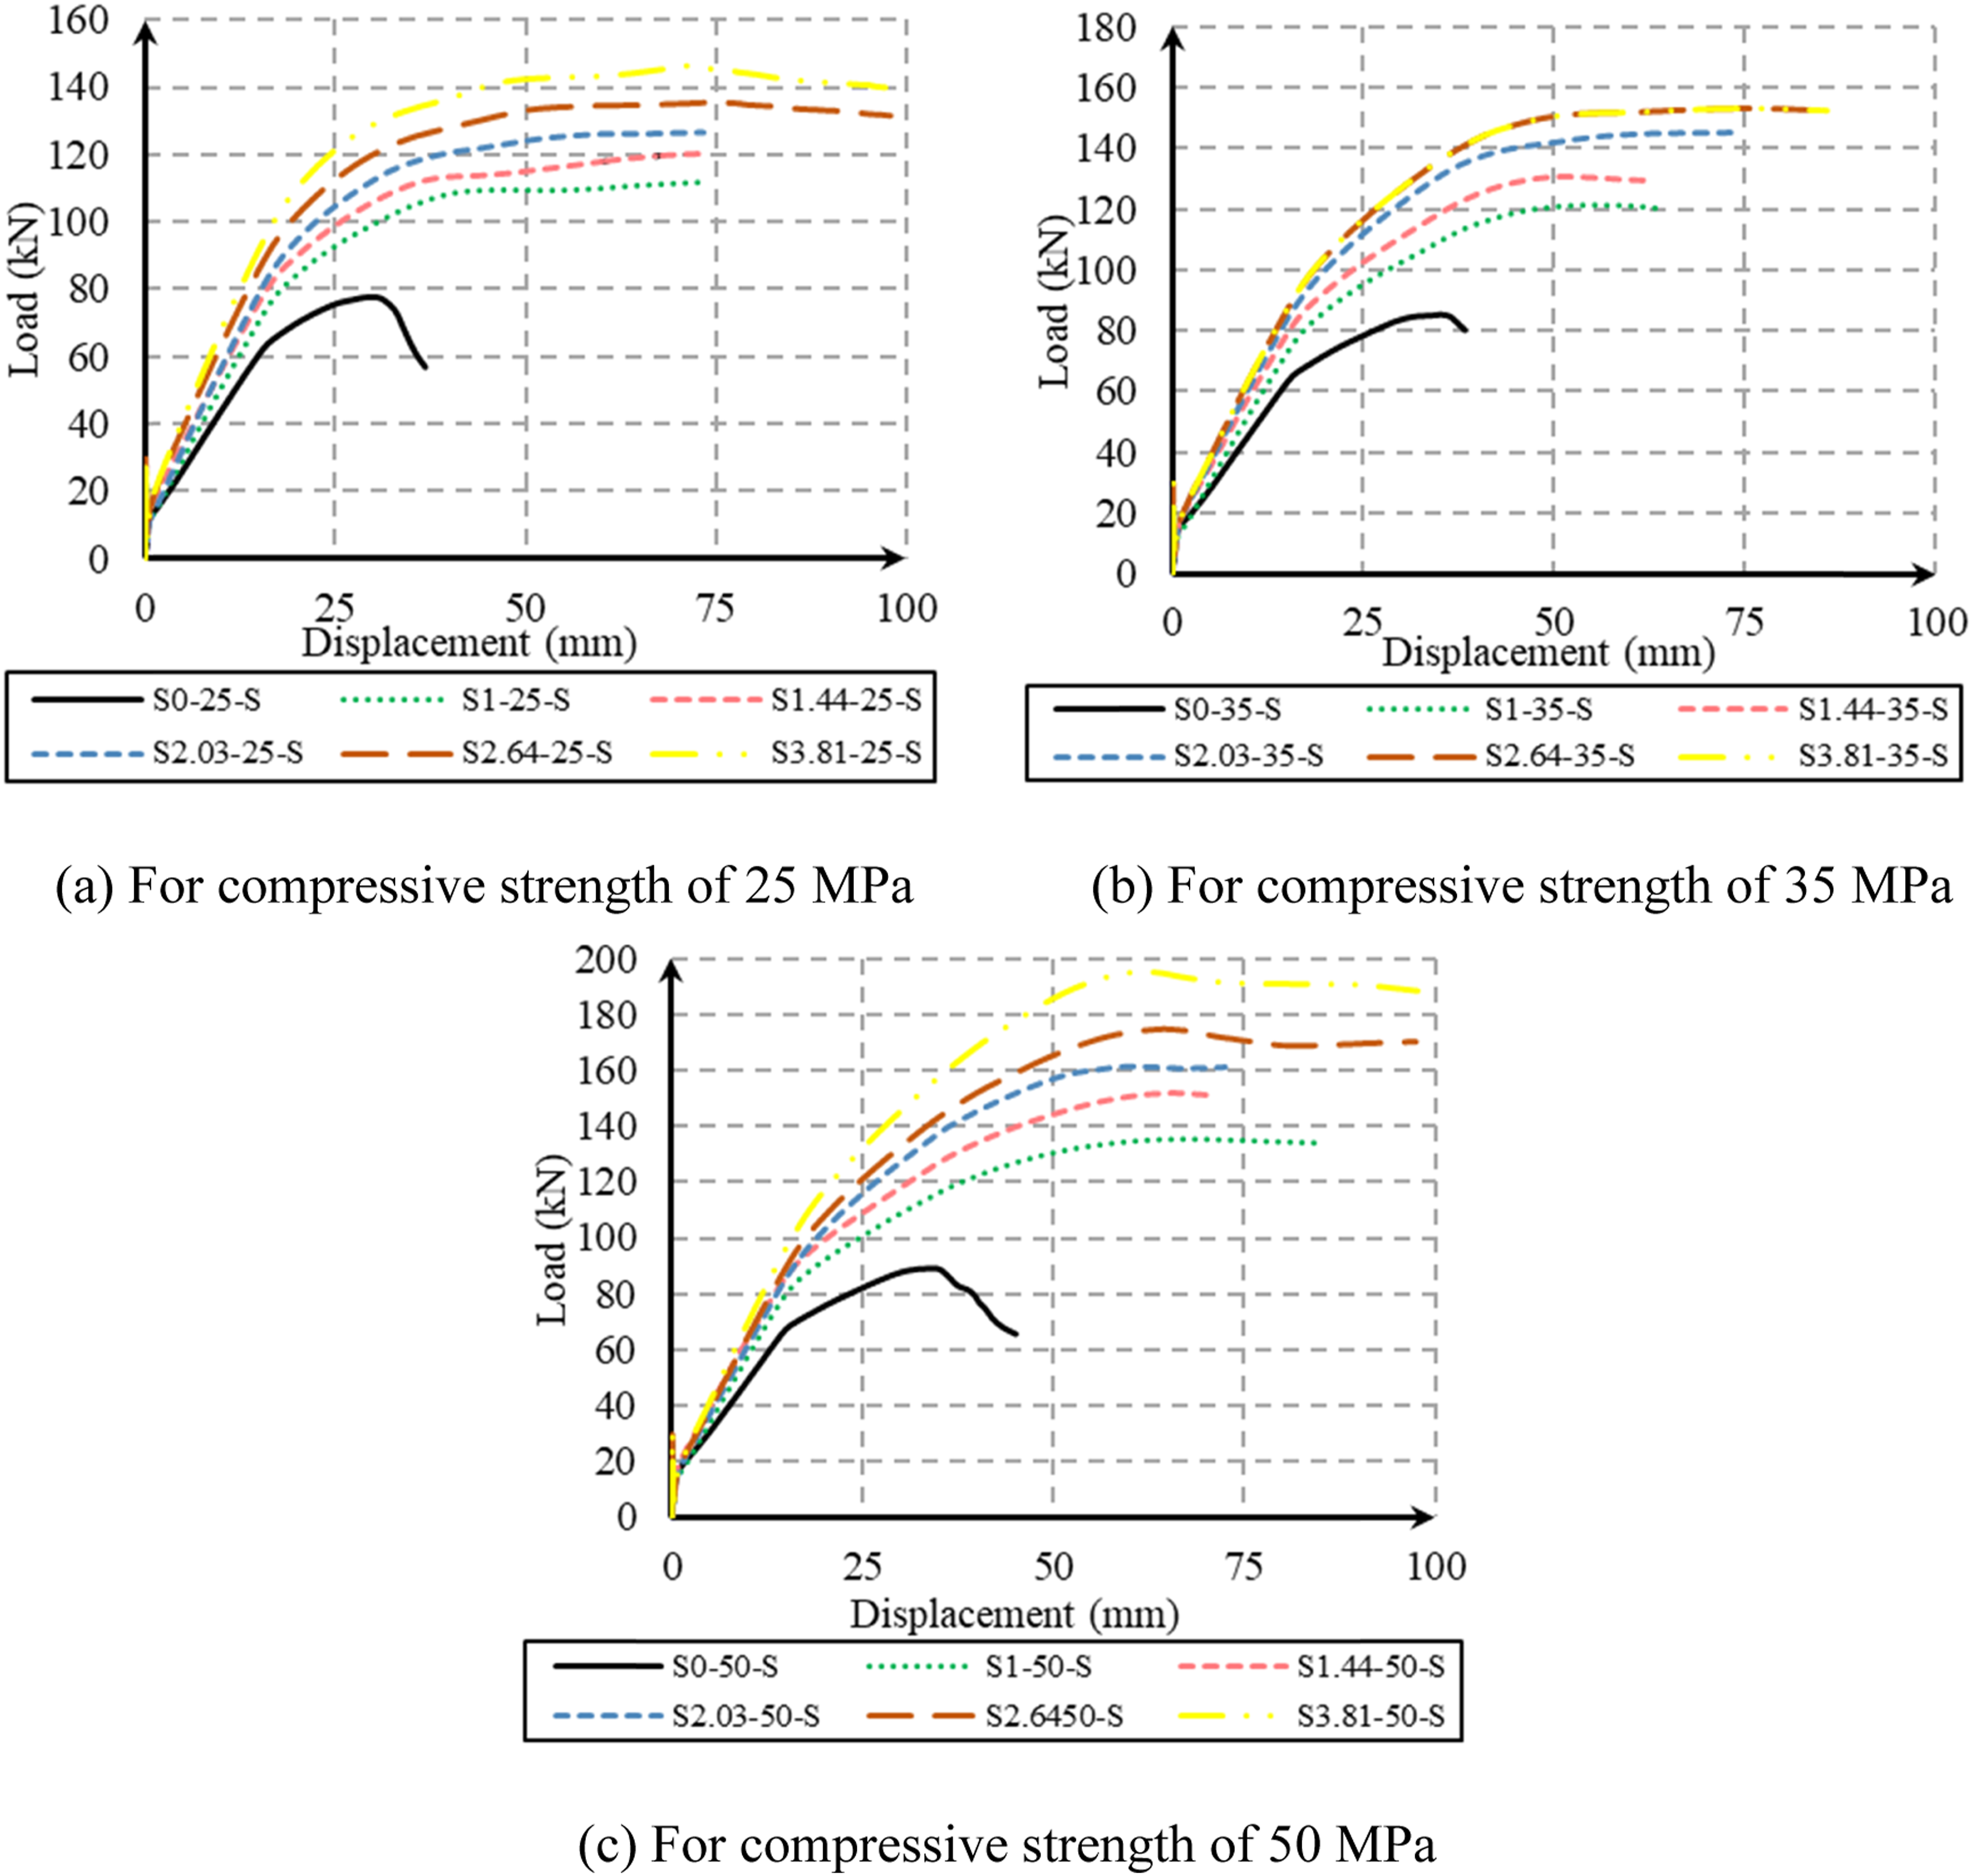
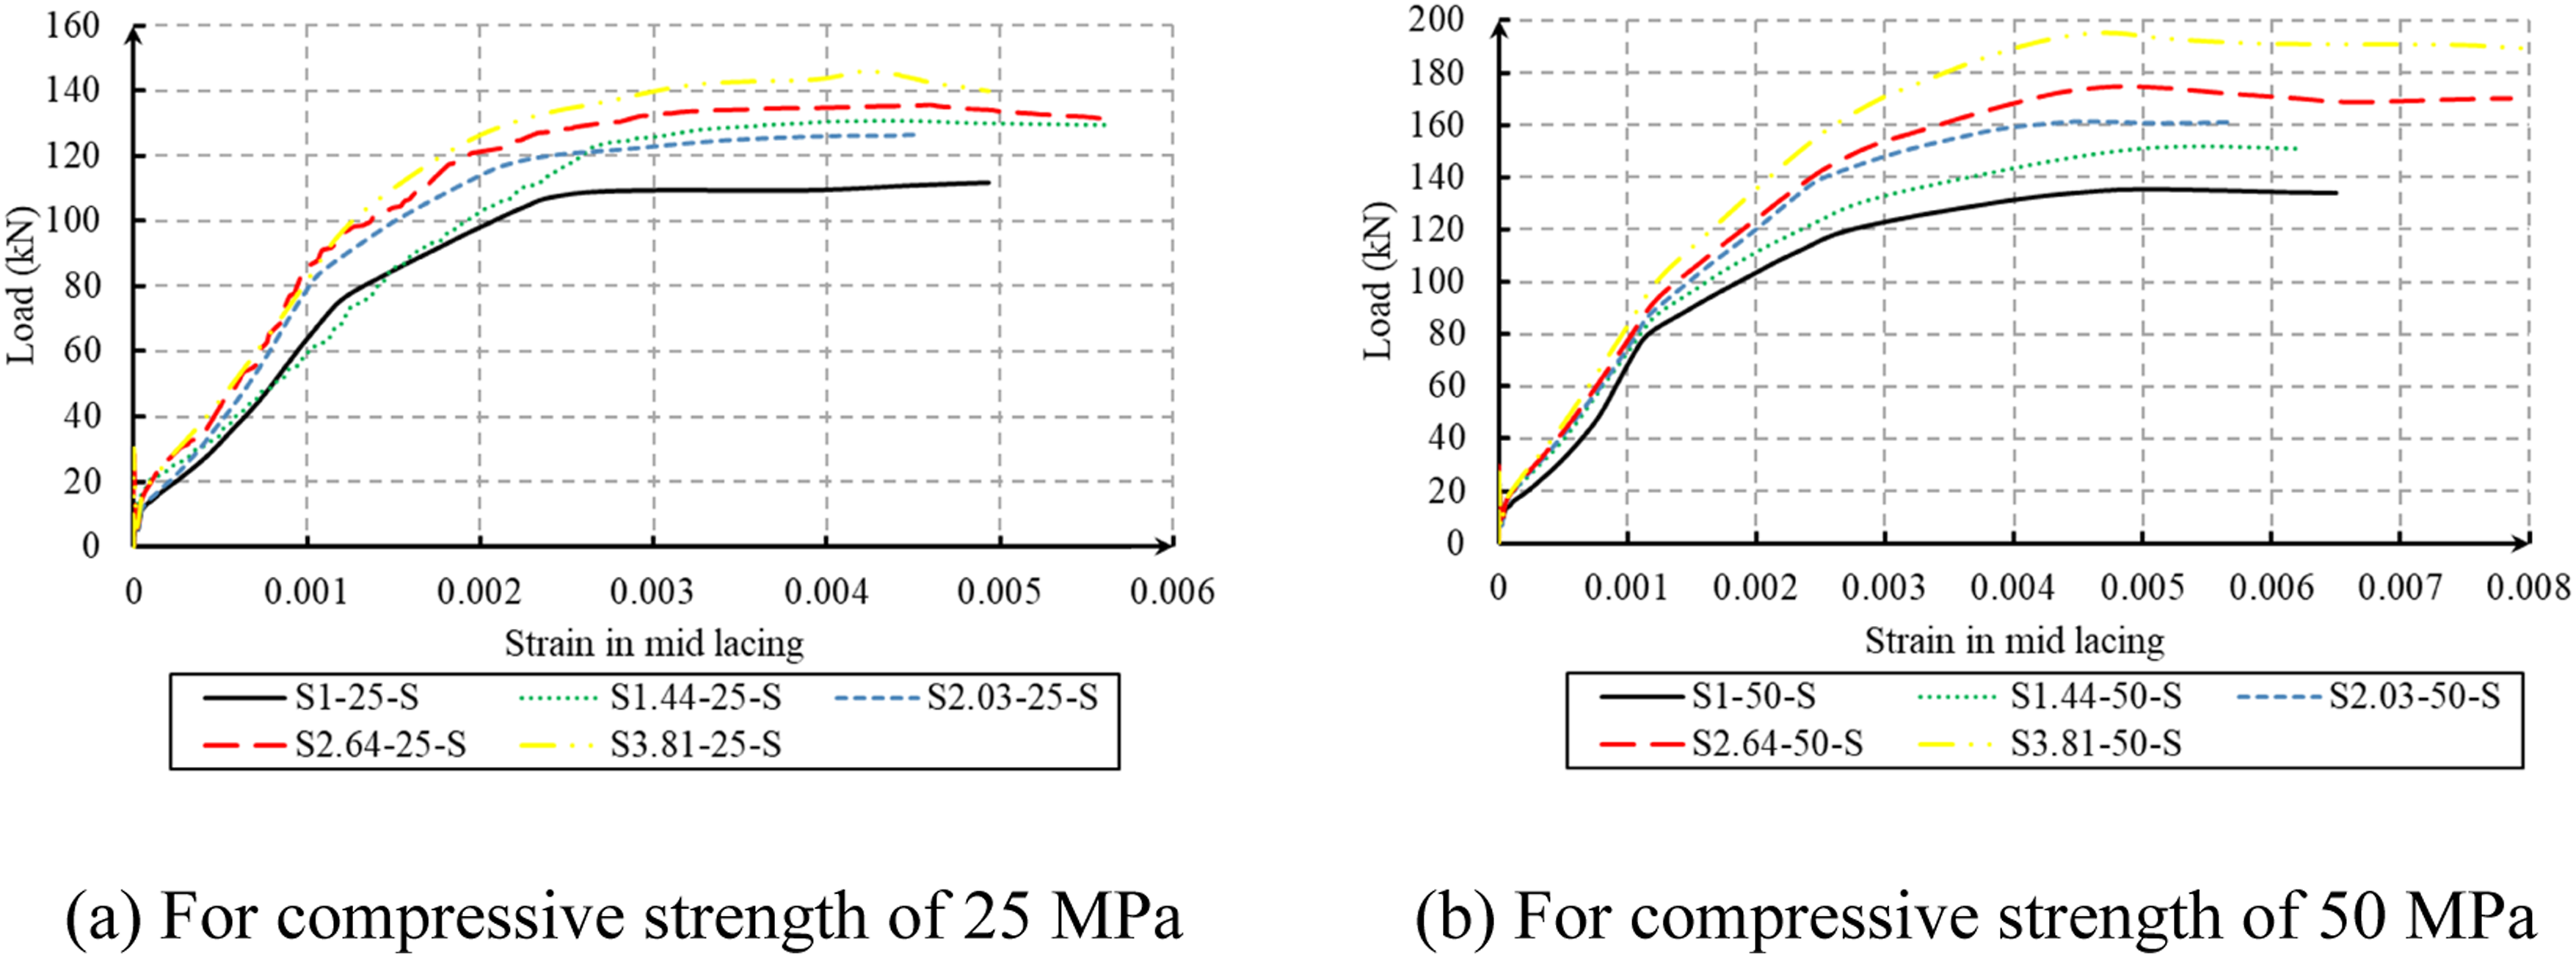
The relationship between the compressive strength and tensile strength of concrete is a crucial aspect. Higher compressive strength provides higher tensile strength of concrete. When the tensile stress exceeded the tensile strength of the concrete, the concrete started to crack, and no stresses were resisted by the concrete, and abrupt changes of stiffness as well as strains in the steel rebars were observed (see Figures 15 and 16). The first crack load was the most variable that increased by increasing the tensile strength of concrete. The crack load increased from 13.4 kN to 19.2 kN (43.3% enhancement) when the concrete compressive strength increased from 25 MPa to 50 MPa, respectively. Before this load, all the results were the same and coincided with each other for all the analyzed slabs with the different lacing reinforcement ratios. However, slight differences in the flexural behavior and stiffness started after the first crack load.
Effect of using different material types for the reinforcement rebars
The use of different reinforcement materials such as Carbon Fiber Reinforced Polymer (CFRP), Glass Fiber Reinforced Polymer (GFRP), and traditional steel rebars can significantly influence the flexural response of RC slabs, even if they use lacing reinforcement. CFRP rebars have high tensile strength and stiffness. It is lightweight and corrosion-resistant. However, it’s often more brittle compared to steel, leading to a less ductile failure mode. On the other hand, GFRP rebars have a lower modulus of elasticity and tensile strength compared to CFRP rebars but are still higher than many grades of steel. They are also lightweight and resistant to corrosion. Like CFRP, GFRP rebars are typically more brittle than steel.
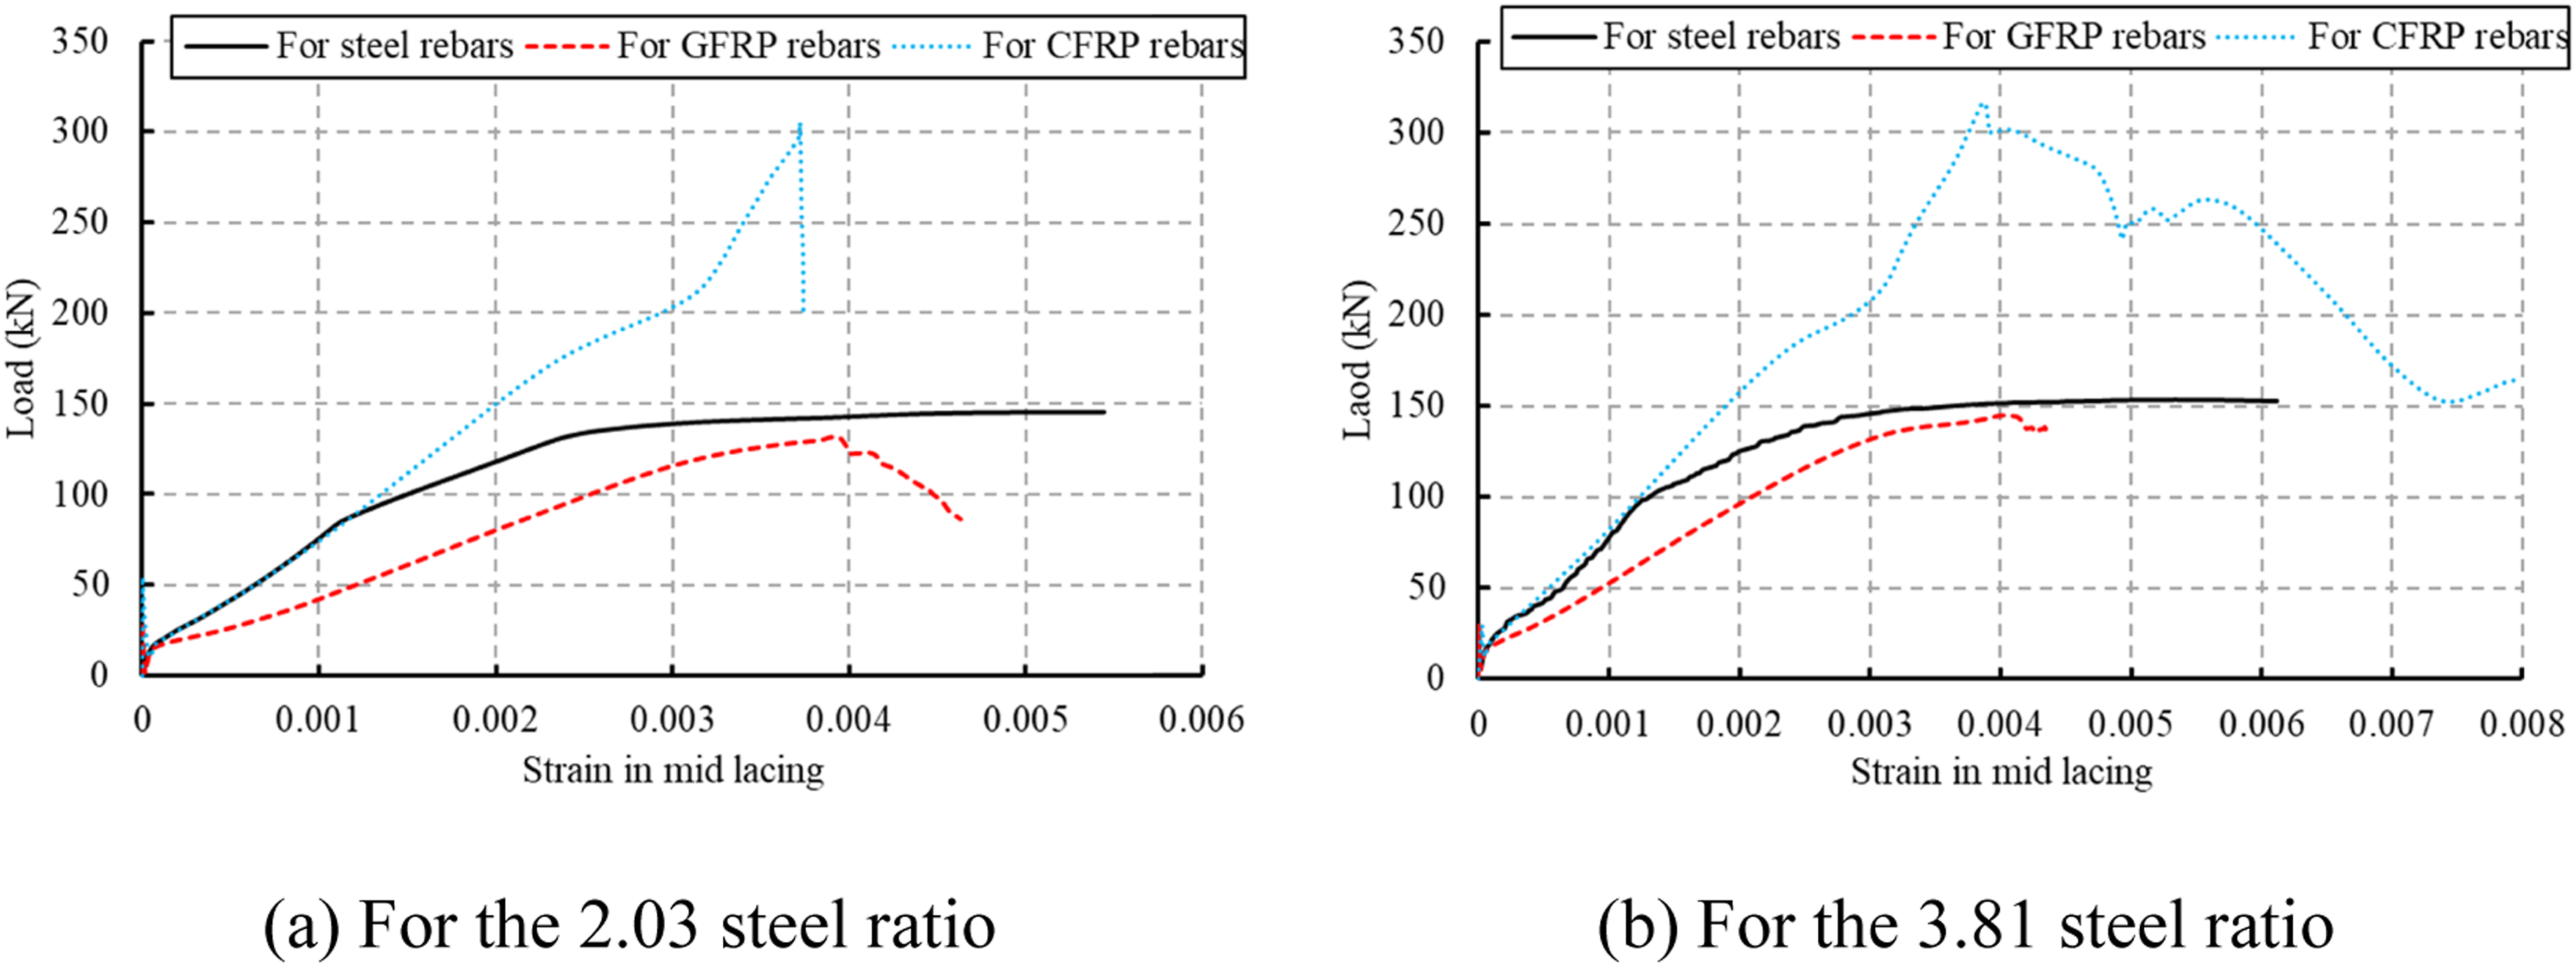
Figure 18 illustrates a comparative analysis of load-displacement relationships associated with various reinforcement rebar materials. Each curve delineates three distinct regions marked by two pivotal turning points. The first turning point signifies the onset of initial cracks in the concrete, while the second turning point denotes either yielding in the steel rebars or the attainment of ultimate capacities in the case of CFRP and GFRP rebars. The CFRP rebars provided significant strength enhancement but led to brittle behavior, as CFRP did not yield like steel. The GFRP rebars enhanced the flexural capacity, but due to their lower stiffness compared to the CFRP rebars, the deflections were larger at the same loading level (see Figure 18). The steel rebars provided a ductile response with a clear yield point, allowing for visible signs before failures such as larger deflections and crack propagation (see Figure 19). Effect of the material types of the reinforcement rebars on the load-displacement relationships. (a) For the 0.0 steel ratio. (b) For the 1.0 steel ratio. (c) For the 2.03 steel ratio. (d) For the 3.81 steel ratio. Effect of the material types of the reinforcement rebars on the strain in the lacing reinforcement. (a) For the 2.03 steel ratio. (b) For the 3.81 steel ratio.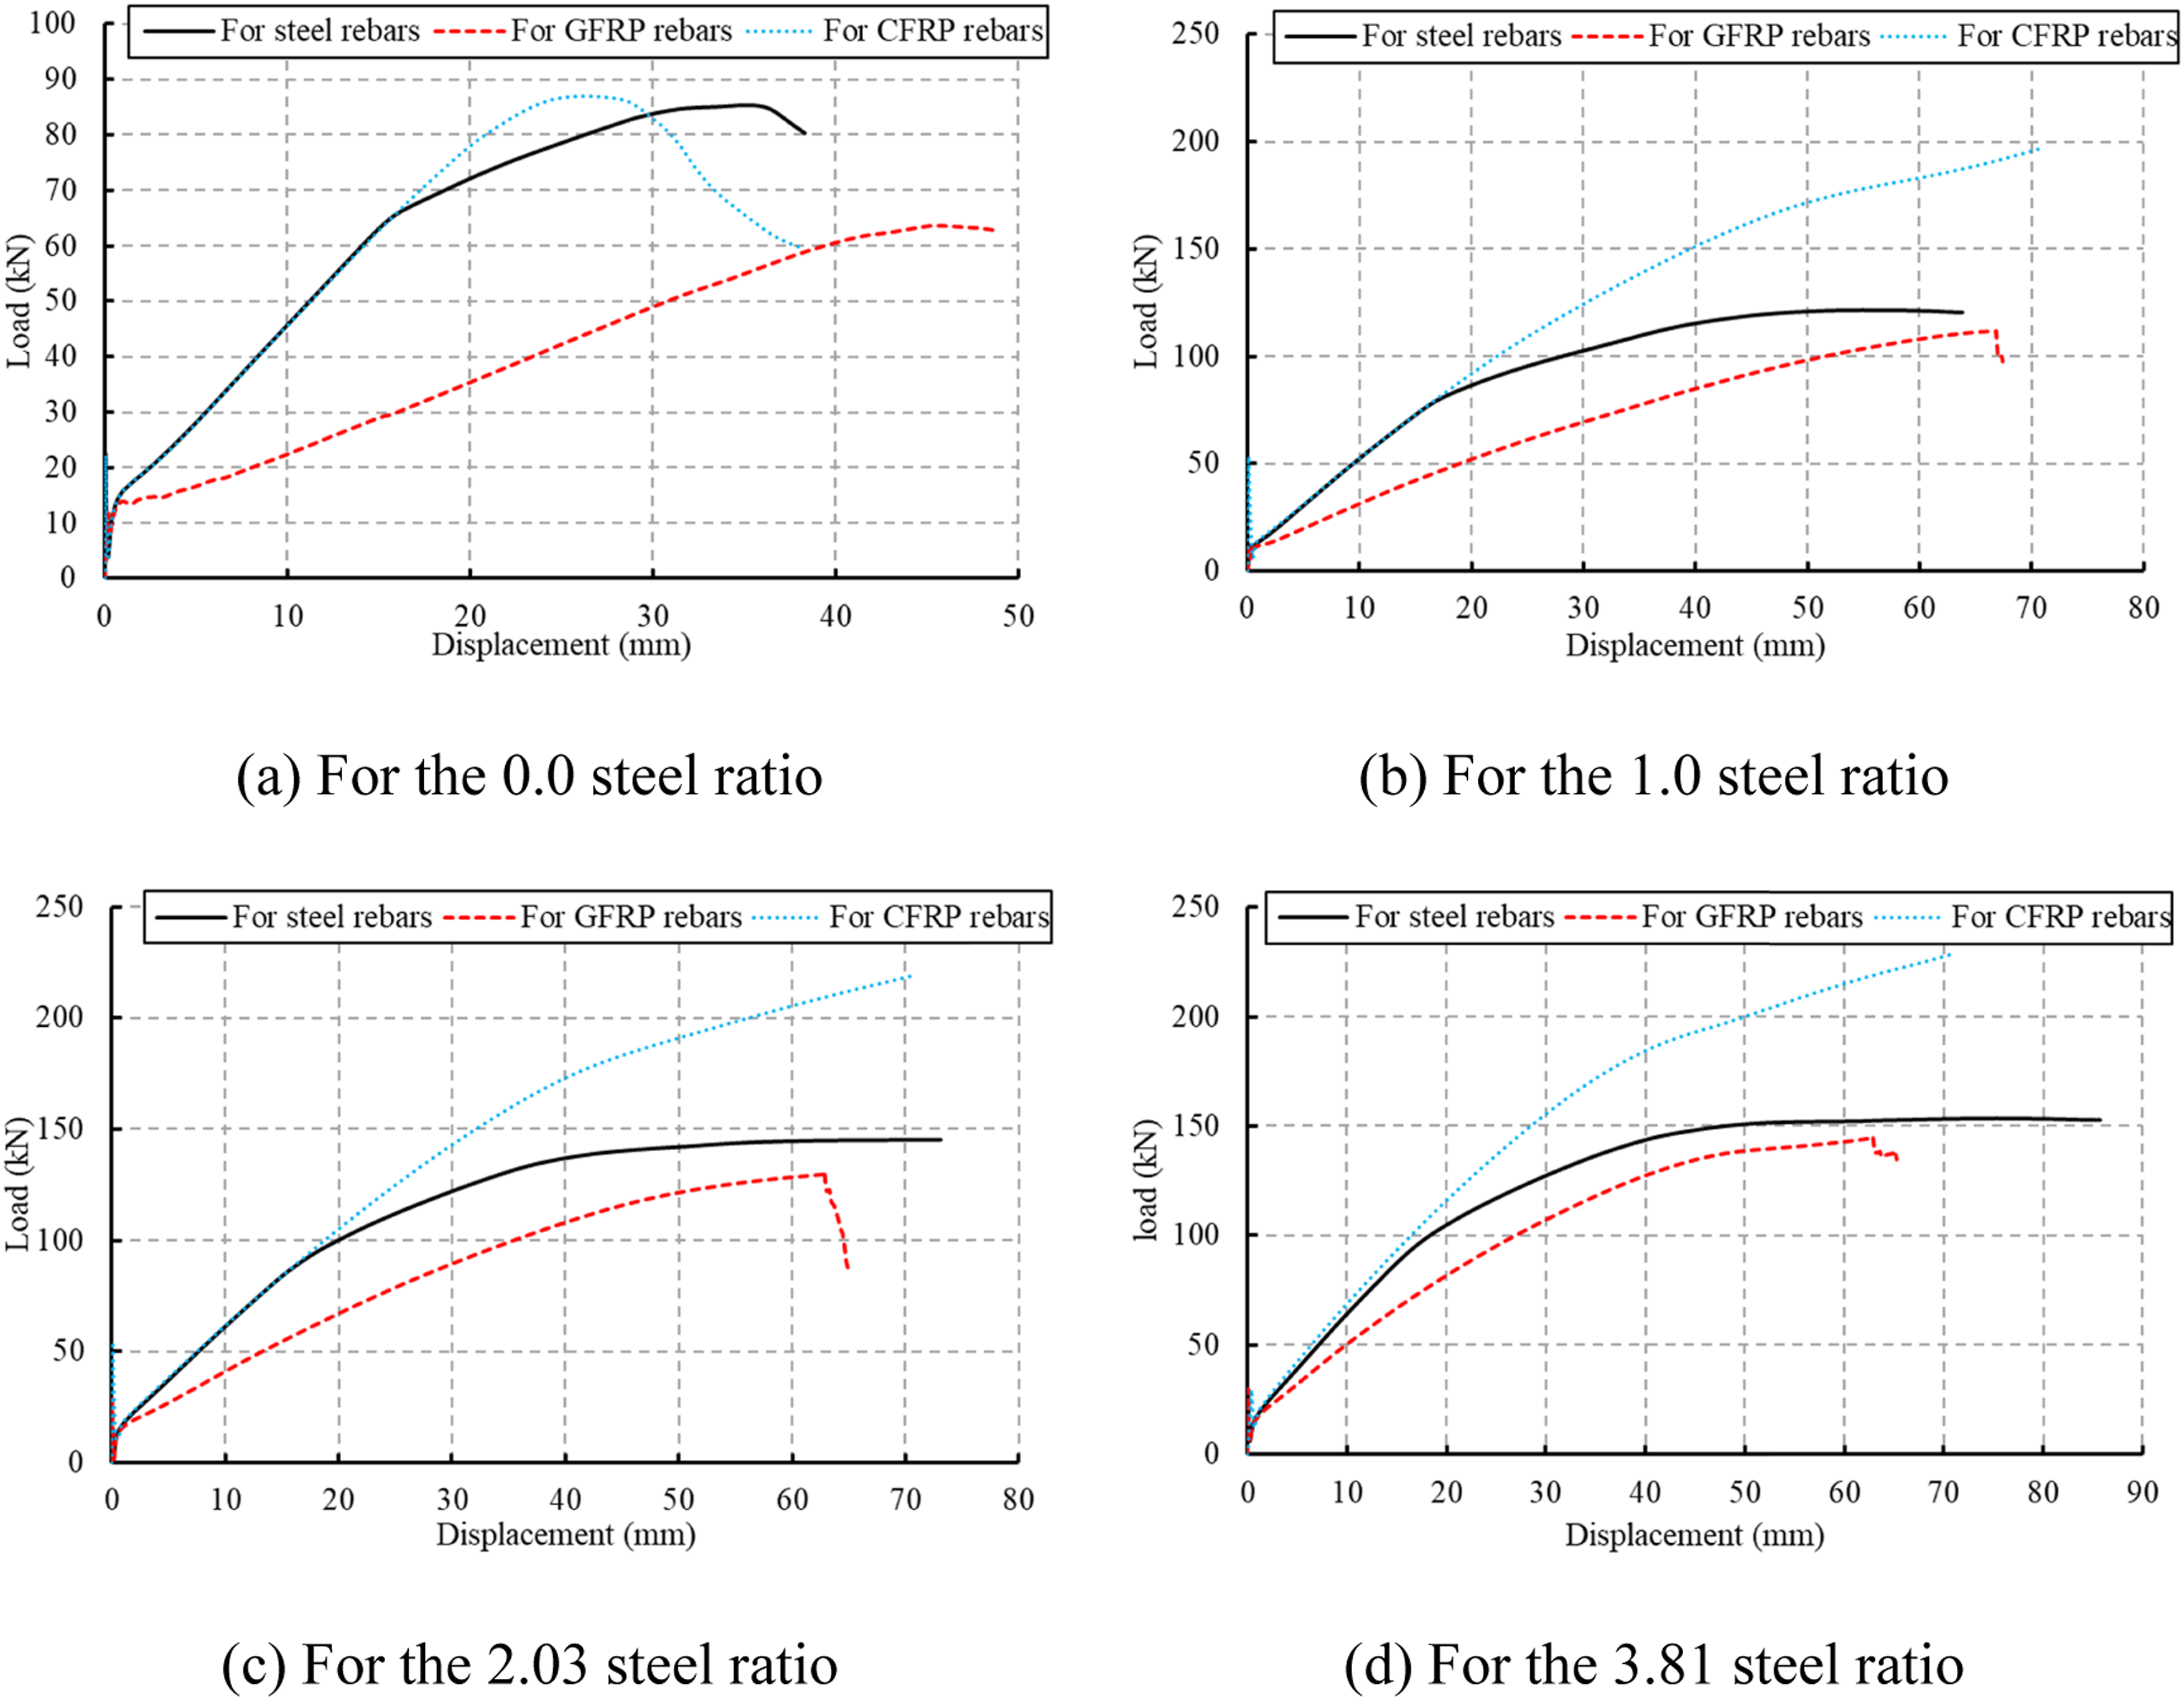
Repeated loading
Effect of the lacing-to-flexural reinforcement ratio and compressive strength of concrete
The ratio of lacing-to-flexural reinforcement can have several effects on the behavior of reinforced concrete slabs. Under repeated loading, lacing reinforcement distributed the stress more uniformly across the flexural bars and subsequently increasd the slab capacity, as shown in Figure 20. Moreover, increasing the lacing reinforcement ratio improved the slabs’ stiffness as well as ductility. The permanent deformations due to the effect of repeated loading reduced as the lacing reinforcement ratio increased, as illustrated in Figure 20. Effect of the lacing to flexural reinforcement ratio on the load-displacement relationships under repeated loading. (a) For compressive strength of 25 MPa. (b) For compressive strength of 35 MPa. (c) For compressive strength of 50 MPa.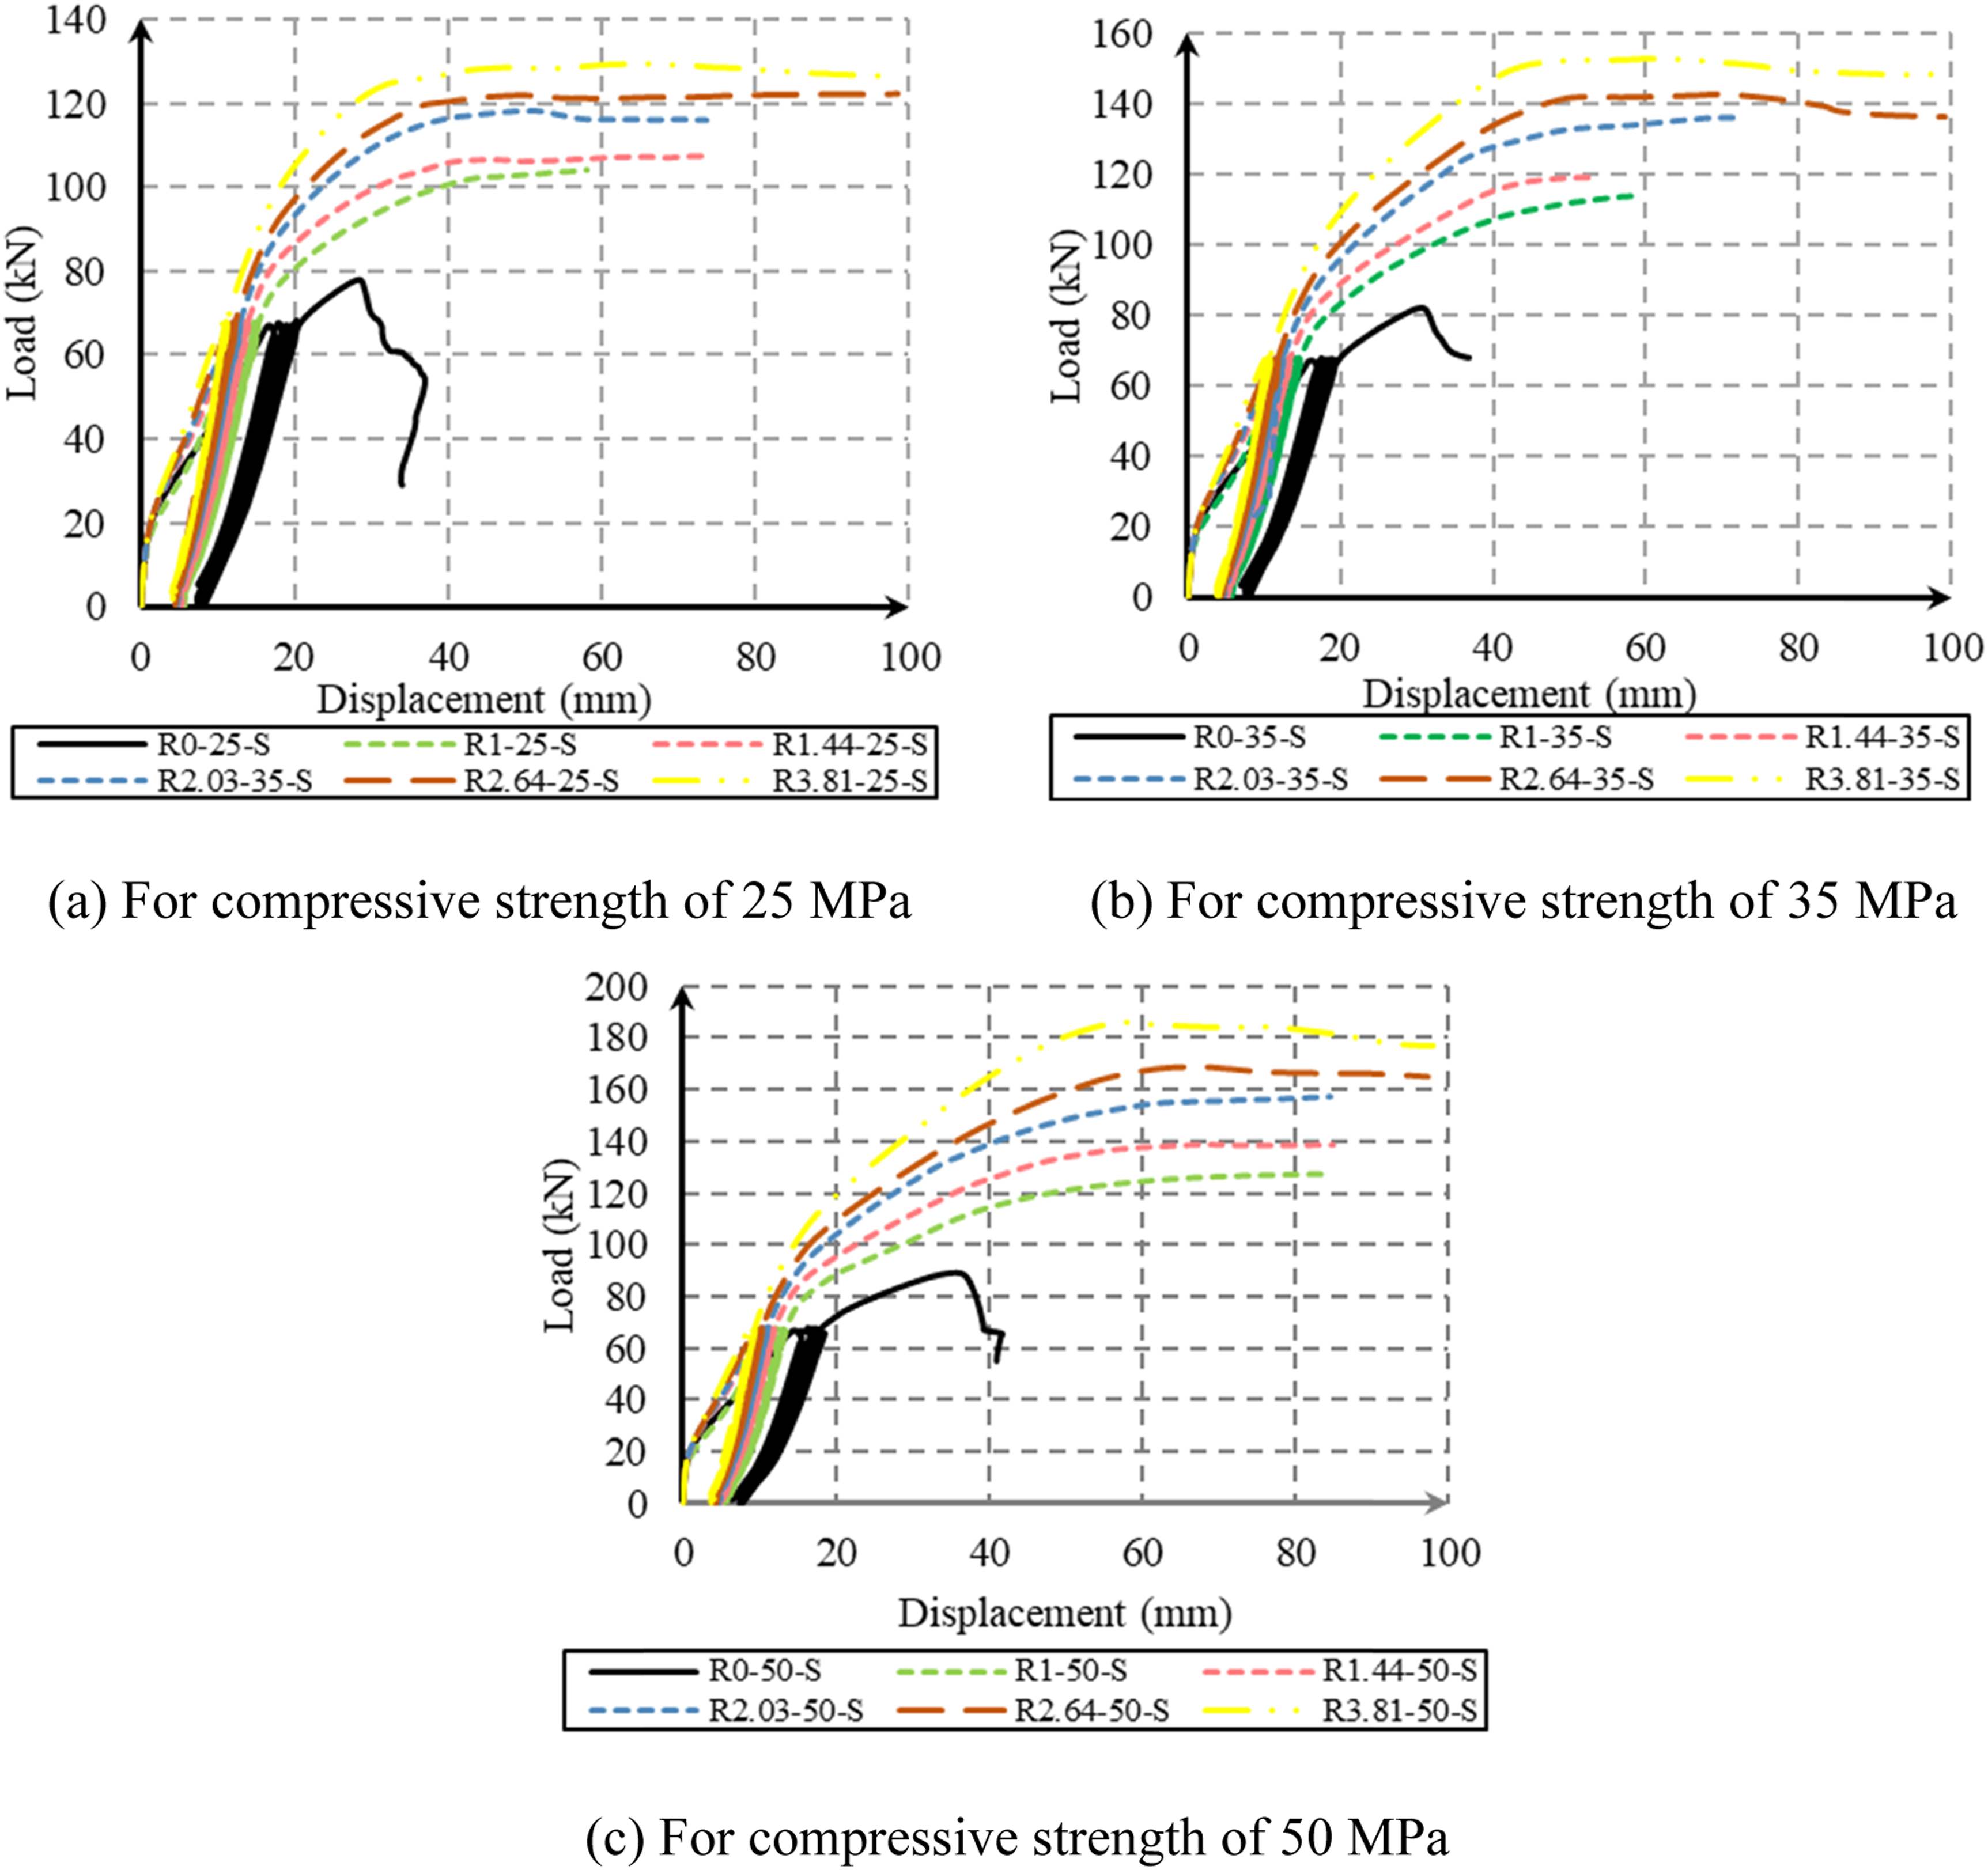
Figure 21 presents the effect of the compressive strength of concrete on the behavior of RC slabs with lacing reinforcement under repeated loading. As the percentage of lacing reinforcement increased, the effect of higher compressive strength was pronounced. High-strength concrete withstood a higher number of load cycles before showing signs of fatigue. Lacing reinforcements are primarily provided to hold the main bars in place and prevent buckling. Stronger concrete provides complementing lateral support to the main rebars besides the lacing reinforcement’s role. Effect of the compressive strength. (a) For the 0.0 steel ratio. (b) For the 1.0 steel ratio. (c) For the 2.03 steel ratio. (d) For the 3.81 steel ratio.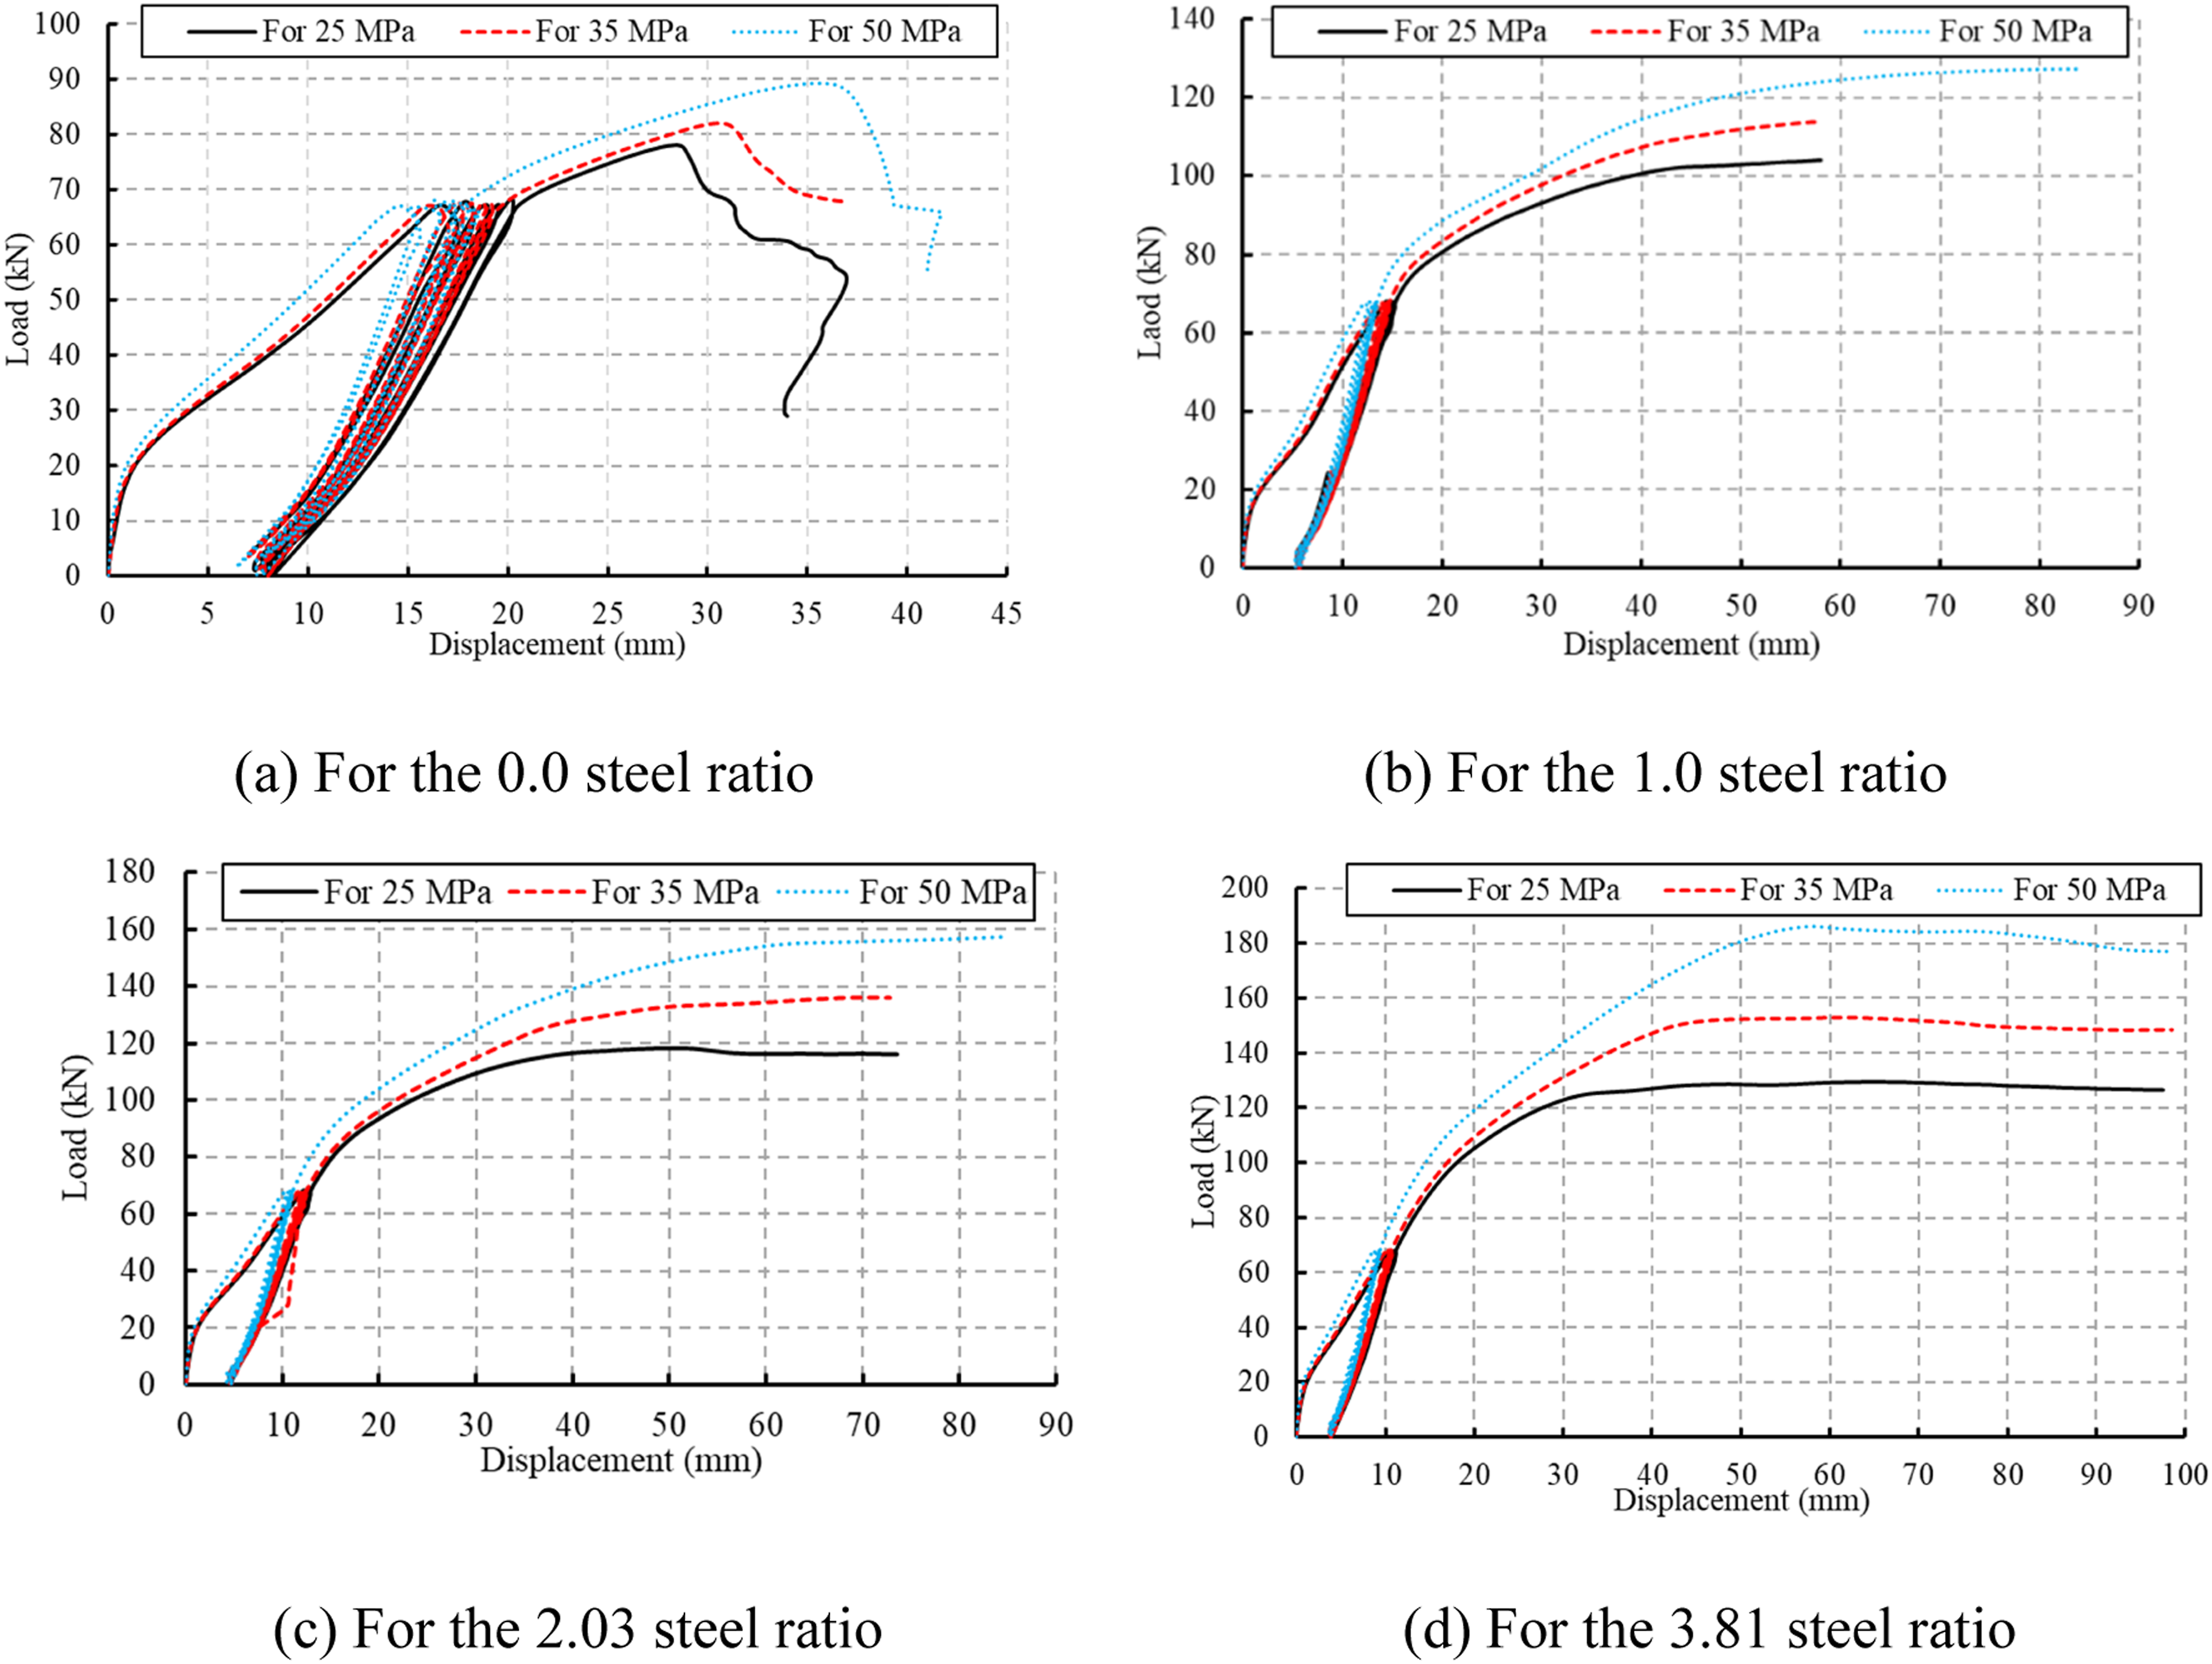
Effect of using different material types for the reinforcement rebars
Using different types of reinforcement materials such as CFRP, GFRP, and traditional steel rebars in concrete slabs with lacing reinforcement introduced various performance attributes under repeated loading. Figure 22 shows comparisons of using these materials for the reinforcement in terms of the load-displacement relationships. During the cyclic loading, the slabs with CFRP and steel rebars exhibited the same cyclic deformation. The permanent cyclic deformations when using GFRP rebars were higher than the peer slabs with steel and CFRP rebars. The permanent cyclic deformations in these slabs were 7.2 mm, 5.8 mm, 4.6 mm, and 3.9 mm when the reinforcement ratios were 0.0, 1.0, 2.03, and 3.81, respectively. However, the slabs with GFRP rebars showed less stiffness and more permeant deformations. These deformations were 16.5 mm, 8.8 mm, 8.2 mm, and 6.8 mm, respectively. Following the cyclic loading, the analyzed slabs were loaded statically to failure. During this loading, the steel rebars obtained better ductility in comparison to the other materials, which exhibited better residual performance after repeated loading. For the CFRP rebars, high strength was obtained but with lower ductility. The lower modulus of elasticity of GFRP compared to steel led to larger deflections. Effect of the material type of the reinforcement rebars. (a) For the 0.0 steel ratio. (b) For the 1.0 steel ratio. (c) For the 2.03 steel ratio. (d) For the 3.81 steel ratio.
Conclusion
In this study, a total of nine slabs were designed and tested to reflect the interaction of the lacing reinforcement with the other primary parameters. All slabs were designed to be simply supported and tested under static and repeated two-point loading. The tested specimens were divided into three groups according to the investigated parameters. Moreover, the tested slabs were analyzed numerically using the ABAQUS software package. The numerical results were compared with experimental results to confirm the FE models’ accuracy. The validated FE test program was used to study the effect of varying the lacing reinforcement ratio, the compressive strength of concrete, and the material types of the tension and lacing reinforcements, such as GFRP and CFRP. The following conclusions can be drawn based on the experimental and FE results: (1) The effectiveness and contribution of the lacing steel reinforcement to the reactivation of the specimen’s capacity were due to the restraining of the tension steel reinforcement and the reduction of the crack width that passed through it. (2) Comparing the ductility factors of static-tested specimens with lacing reinforcement with those of identical specimens tested under repeated loads, the repeated-tested specimens experienced smaller ductility than those of similar static-tested specimens, where the reductions in ductility factor ranged between 8.4% and 22.3%. (3) The slab capacity increased by 85.7% when the lacing-to-flexural reinforcement ratio increased from 0.0 to 3.81 and the concrete compressive strength was 25 MPa. This enhancement in the slab capacity became 119.1% in the case of 50 MPa compressive strength. Enhancing the ratio of lacing reinforcement compared to flexural reinforcement proves to be a more impactful strategy, significantly contributing to the increased capacity of the slab, especially when utilizing concrete with higher compressive strength. (4) During the cyclic loading, the slabs with CFRP and steel rebars exhibited the same cyclic deformation. The permanent cyclic deformations when using GFRP rebars were higher than those with steel and CFRP rebars due to the lower modulus of elasticity of GFRP. (5) Following the cyclic loading, the steel rebars obtained better ductility in comparison to the other materials (CFRP and GFRP), which exhibited better residual performance after repeated loading.
Footnotes
Acknowledgments
The experimental work of this research is part of the PhD. Thesis of Hussain A. Jabir. The authors gratefully appreciate and thank the Structural Laboratory staff of the Department of Civil Engineering at the University of Baghdad, Iraq, for their support in the experimental part of the research. Moreover, the authors would like to express their gratitude to the Consulting Engineering Bureau at the University of Baghdad (CEB-UOB) for their assistance in completing the material test.
Declaration of conflicting interests
The author(s) declared no potential conflicts of interest with respect to the research, authorship, and/or publication of this article.
Funding
The author(s) received no financial support for the research, authorship, and/or publication of this article.