
Abstract
A new type composite dowel shear connector was proposed by introducing folded angles in the steel dowels. Four push-out specimens and two composite beam specimens were designed and experimentally studied. The structural behavior and failure mechanism of the composite folded dowel shear connection were investigated. The concrete failure was observed in both push-out and flexural tests, and the folded steel dowels were capable of yielding development. It is found that the bearing capacity and shear stiffness of the specimens with denser spacing dowels were higher than that of specimens with sparser dowels, but the ductility and deformation performance of the specimens with denser spacing dowels were lower than those with sparser dowels. By means of the finite element model simulation, the influence of strength and thickness of concrete slab, strength, thickness and folded angle of steel dowel on the mechanical properties of folded dowel shear connection were analysed. The folded angle could be determined as 20° because of the larger actual effective shear area and bearing capacity. Based on the bearing capacity analysis in terms of the three likely failure modes, such as steel failure, concrete shear failure and concrete pry-out, calculation formula of the shear bearing capacity of the folded dowel shear connection was put forward and verified. The calculated results by the proposed formula were in good agreement with the test results. For the composite beams, the calculated bending moments derived from the transformed section and the plasticity section methods were also in good agreement with the test values. It is suggested that the shear connection degree should be greater than 1 to enable a full composite beam.
Keywords
Introduction
Steel-concrete composite beams have been widely used in building and bridge structures for years with the various merits such as the good structural performance, economic and effective construction. To enable effective composite action, the shear connection between the steel and concrete plays a vital role. In a conventional T shape composite beam, headed studs are provided at the interface between the top flange of the steel beam and the concrete slab, and depending on the slip deformation capacity, the shear connection can be designed ductile and non-ductile, incorporated with the codified design methods (An and Cederwall, 1996; Johnson, 2000; Okada et al., 2006). In beams with stud shear connection construction, however, a large number of studs have to be welded to the top steel flange on site by using a special welding gun, which is prone leading to residual stress and stress concentration (Lam and El-Lobody, 2005; Xue et al., 2008) in the connection.
To reduce the adverse effects caused by welding and strengthen the connection between steel and concrete, Leonhardt et al. (1987) proposed a perfobond strip connector, which had high bearing capacity and excellent fatigue performance. However, in perfobond strip connections, the assembly of steel rebars through insertion into holes was found troublesome in construction practice. In the 1990s, Wurzer (1998) and Zapfe (2001) developed a new type shear connector with open cut-outs in the steel strip or called composite dowel. The Composite dowels can make full advantage of effective and economic combination of steel and concrete without using top steel flange (Cardoso et al., 2020; Classen et al., 2016; Classen and Gallwoszus, 2016; Seidl et al., 2013a).
For composite dowels, open cut-outs in the steel can be produced by plasma or laser cutting, and common shape of the open cut-outs includes fin (SA), puzzle (PZ), clothoidal (CL) and modified clothoidal (MCL). A large number of studies and references were well documented in literature to explore the mechanical performance of different types of steel dowels and influences of different parameters (Classen and Hegger, 2016; Lorenc, 2020; Lorenc et al., 2010; Rauscher and Hegger, 2008; Yoo et al., 2021). Lorenc et al. (2014a) explored the influence of dowel thickness, dowel size and steel strength on structural behavior of the PZ-shaped connector by means of push-out tests. The results showed that the different dowel thickness will lead to different failure modes, and the dowel size has little effect on the shear bearing capacity unit length. Yang et al. (2021) studied the five kinds of web-embedded shear connectors by push-out tests and bending tests, and proposed design method of shear resistance based on the shear connection degree. Classen et al. (2018) investigated the mechanical properties of the PZ connector under the combined action of tension and shear, and put forward the correlation curve model considering parameters such as reinforcement ratio and reinforcement arrangement position.
This paper presents an extensive programme of tests to identify the behavior of the folded dowels shear connection. The difference between the folded dowel shear connection and the conventional dowel shear connection is that in the folded dowel shear connection, the tooth-shaped dowels are folded with a small side angle staggeringly along the beam axis (Figure 1). It is aimed to investigate the shear bearing capacity of this new composite dowel shear connector and the structural behavior of composite beam with this type connector. Four push-out specimens and two composite beam specimens were designed and tested. The finite element model and parameter analysis of the push-out tests was further conducted. The shear bearing capacity calculation formula of the folded dowel shear connection was proposed. The calculated bending moments of composite beam obtained from transformed section method and plasticity section method were validated by the tests results. Schematic illustration of composite beam with folded dowel shear connection.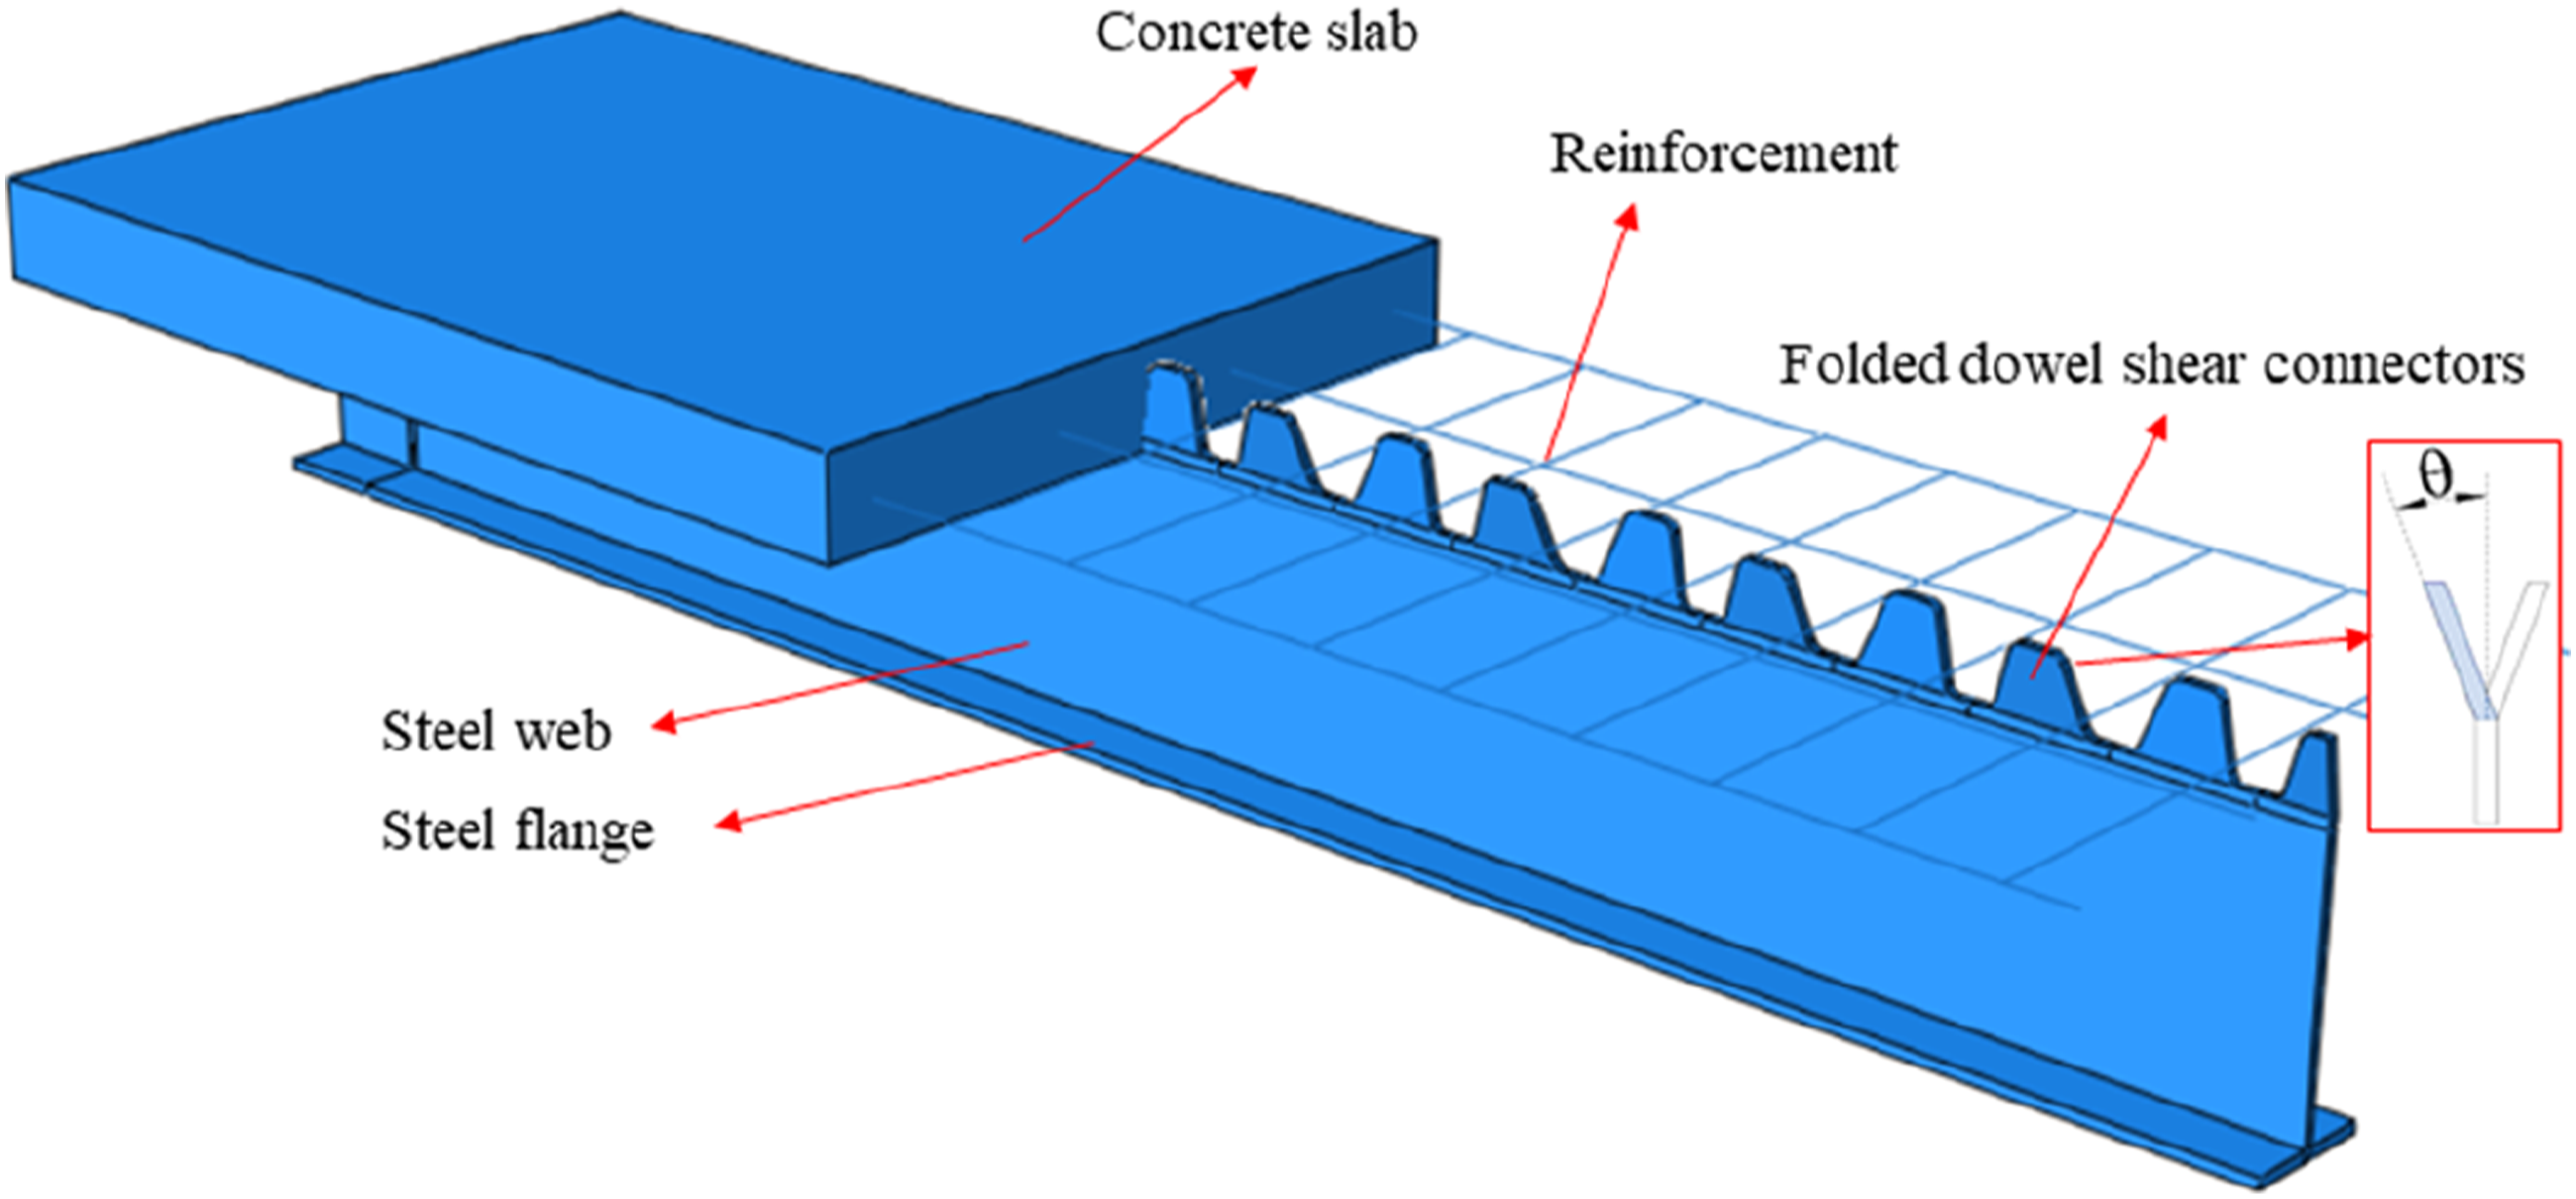
Experimental program
Material properties
The concrete samples for material mechanical property test were poured and cured in the same batch with the test specimens. Cube samples were 150 mm (length) × 150 mm (width) × 150 mm (height) in size for compressive strength and splitting strength tests of concrete. According to the code for design of concrete structures (GB50010-2010, 2015), the elastic modulus can be obtained. The cube compressive strength, axial compressive strength, splitting tensile strength and elastic modulus of concrete at 28 days were 32.7 MPa, 21.9 MPa, 3.63 MPa and 30.7 GPa, respectively.
The steel specimens were made of Q345B; the steel reinforcement was made of HRB335 (the Chinese Industrial Standard). The yield strength, tensile strength, and elastic modulus of Q345B were 345 MPa, 578 MPa, and 206 GPa, respectively. For HRB335, these parameters were 335 MPa, 455 MPa, and 200 GPa, respectively.
Specimen fabrication
Four push-out test specimens labelled as TCA-1, TCA-2, TCB-1, and TCB-2 were designed and constructed. Each specimen consisted of loading plate, folded steel dowel connector, concrete slab and steel reinforcement. The geometric details and dimensions of the push-out test specimens were shown in Figure 2(a) and (b). A loading plate (180 mm × 110 mm × 16 mm) was welded at the top of test specimen. The folded steel dowel connector was a steel rib section with 500 mm in height and 8 mm in thickness. The tooth-shaped dowel rib was folded staggeringly and the folded angle between the two adjacent dowel ribs was 30°. To prevent likely buckling, a 8 mm thick stiffener was welded at the middle of each side of the steel connector section. The differences between the two groups of specimens were the width and spacing of the dowel ribs, being 134 mm wide in dowel tooth and 200 mm spacing for TCA and 94 mm wide dowel tooth and 120 mm spacing for TCB. The concrete slab was 520 mm in height, 500 mm in width and 90 mm in thickness. The longitudinal steel reinforcements were four steel bars of 12 mm in diameter for both TCA and TCB. To ensure basically the same transverse reinforcement ratio in concrete section, the transverse steel reinforcements of TCA were steel bars with a diameter of 12 mm and a spacing of 200 mm, and those of TCB were steel bars with a diameter of 10 mm and a spacing of 120 mm, as shown in Table 1. Dimension and setup of test specimens. Dimensions of test specimens (unit: mm).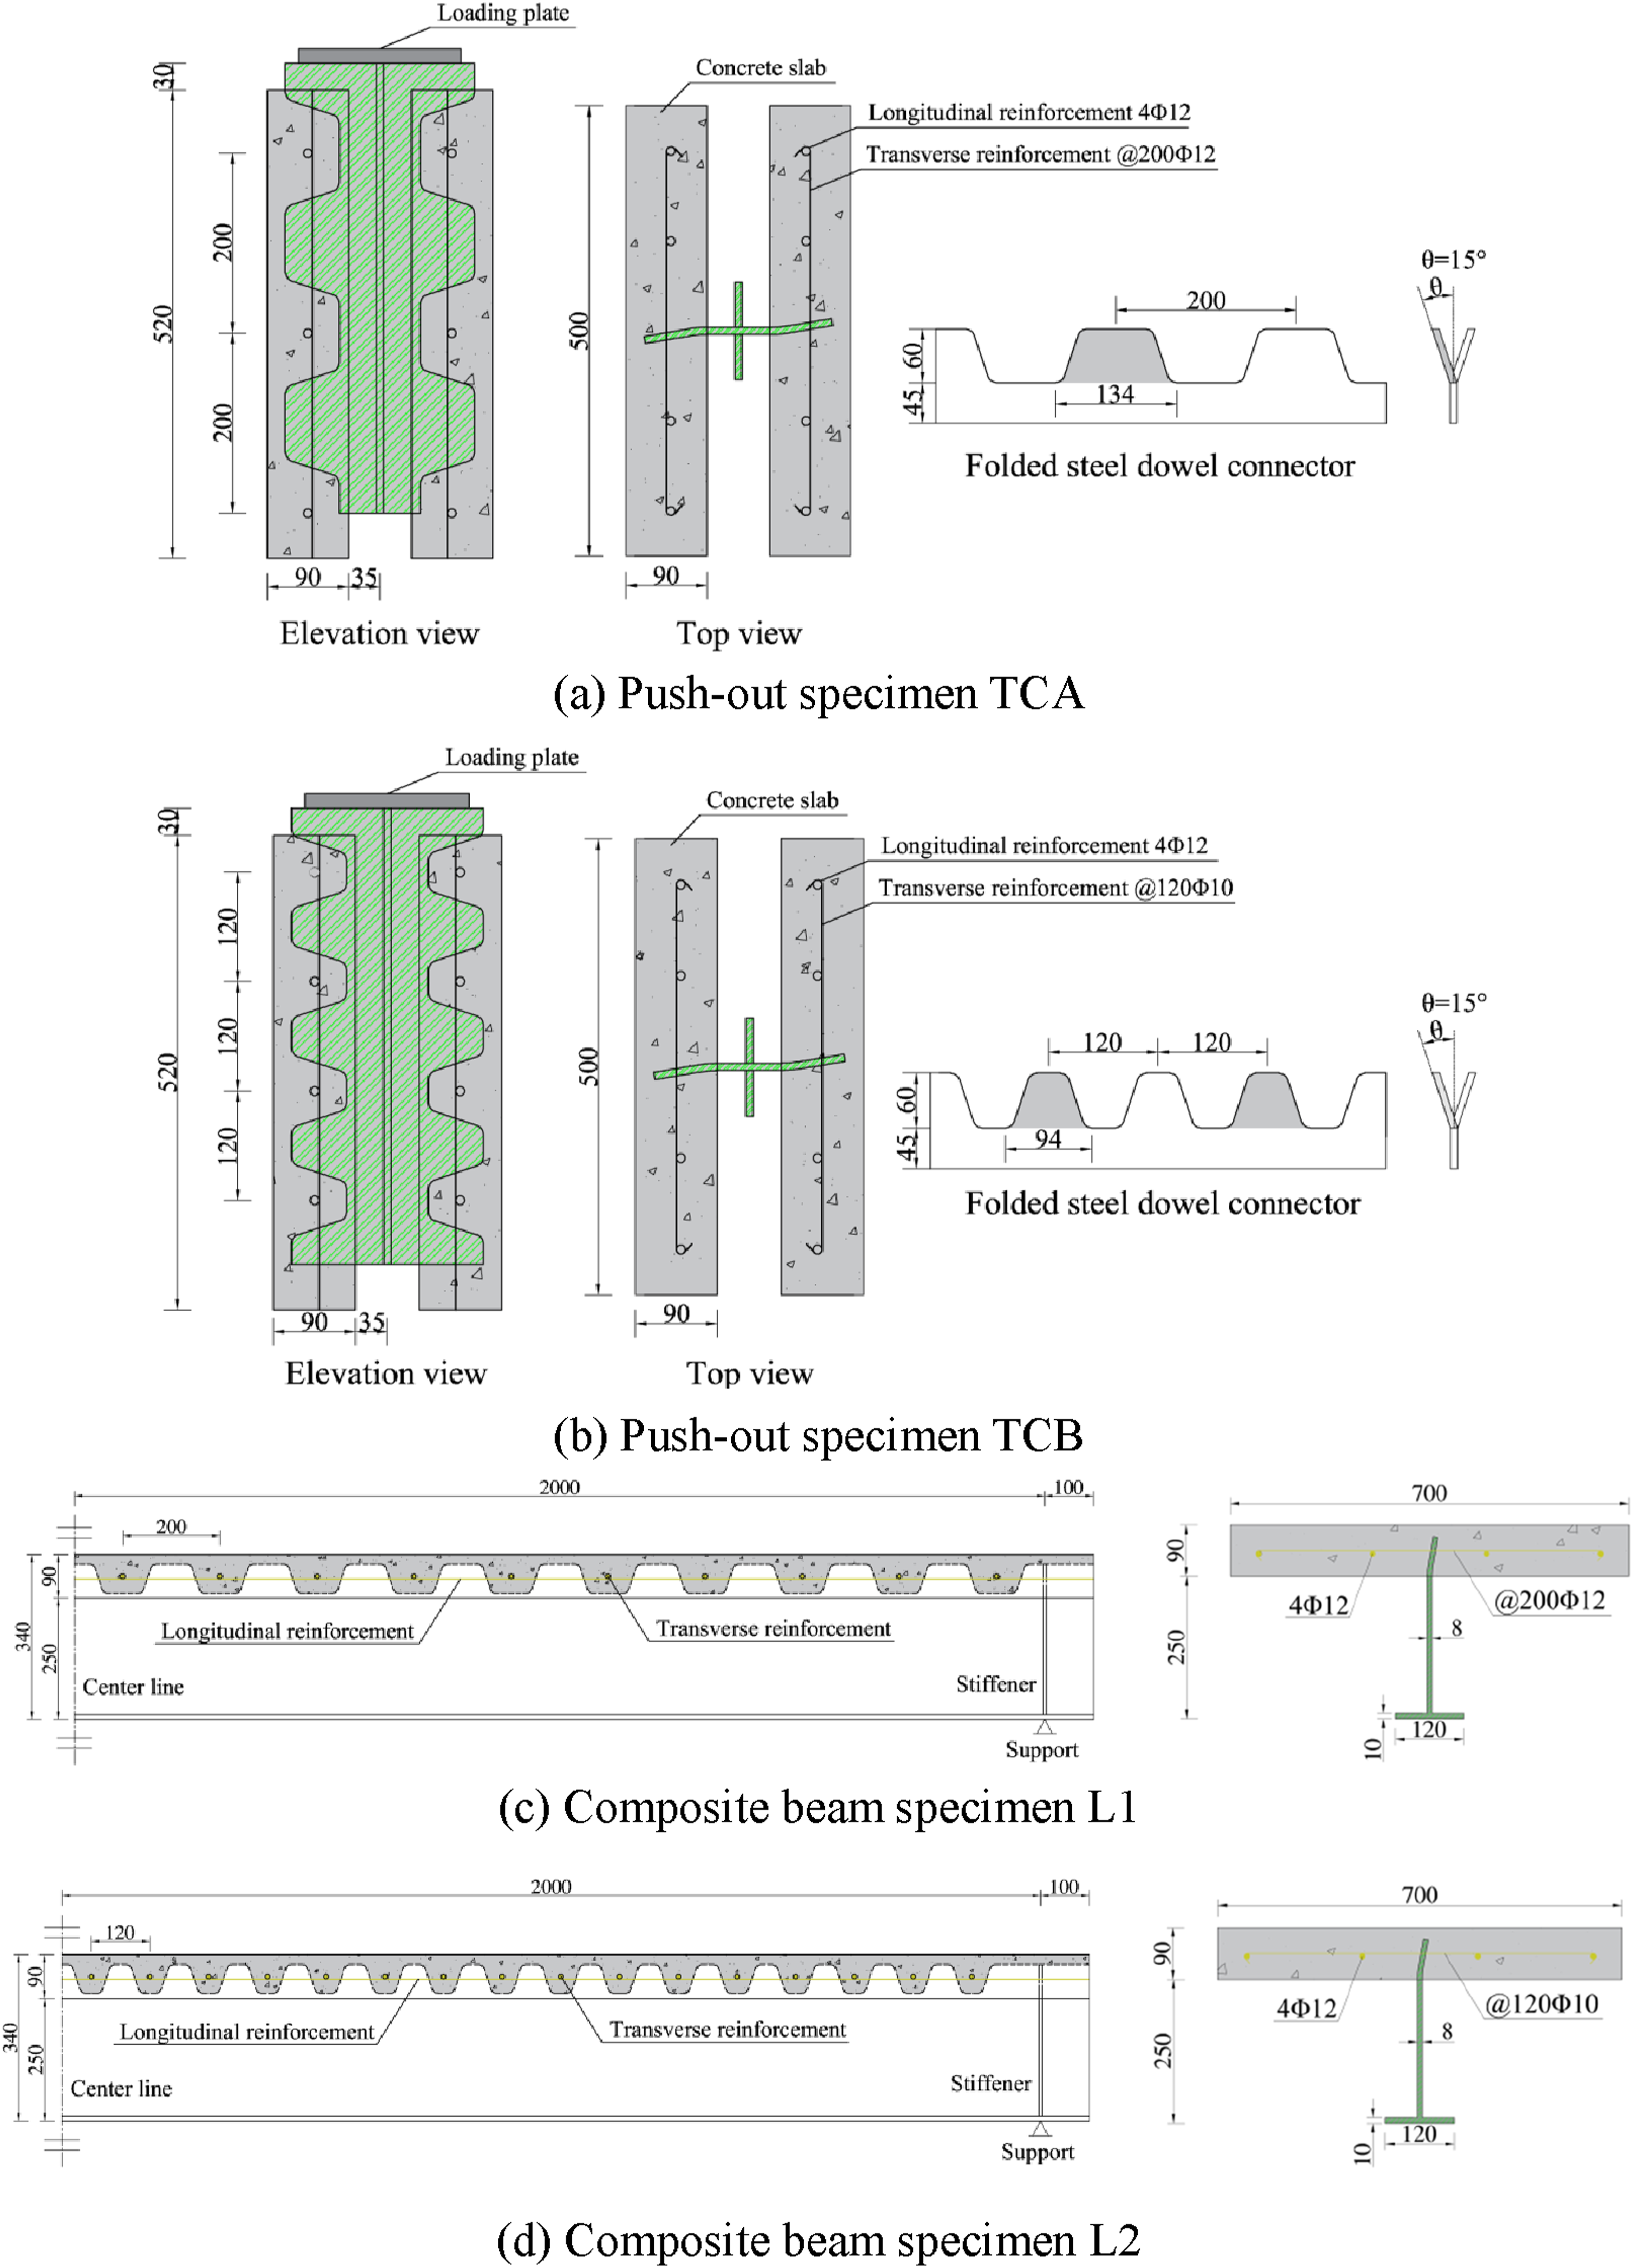
Compared with the push-out test, the composite beam in bending test can demonstrate the shear connection performance of the steel-concrete interface under bending moment. Two full scale composite beams labelled as L1 and L2 were experimentally studied. Each specimen was composed of a T-shaped steel section girder, steel reinforcement and a concrete slab, where the web of the inverted T-shaped section was cut with tooth-shaped dowels and folded staggering along the beam span. The elevation and cross section of the composite beams were shown in Figure 2(c) and (d). The full height (including the concrete slab) of composite beam section was 340 mm, and the beam length was 4200 mm.
The thickness and width of the concrete slab were 90 mm and 700 mm, respectively. Height of the steel T-section was 320 mm, and the thickness of steel web was 8 mm, while the width and thickness of steel bottom flange was 120 mm and 10 mm respectively. In order to prevent local buckling at the support during loading, vertical support stiffeners were welded. The main difference between the two specimens was the width and spacing of the folded dowel shear connector. The specific size and spacing of folded dowels and reinforcement arrangement of the two specimens were consistent with those of the push-out test specimens, as shown in Table 1.
Test setup and loading programs
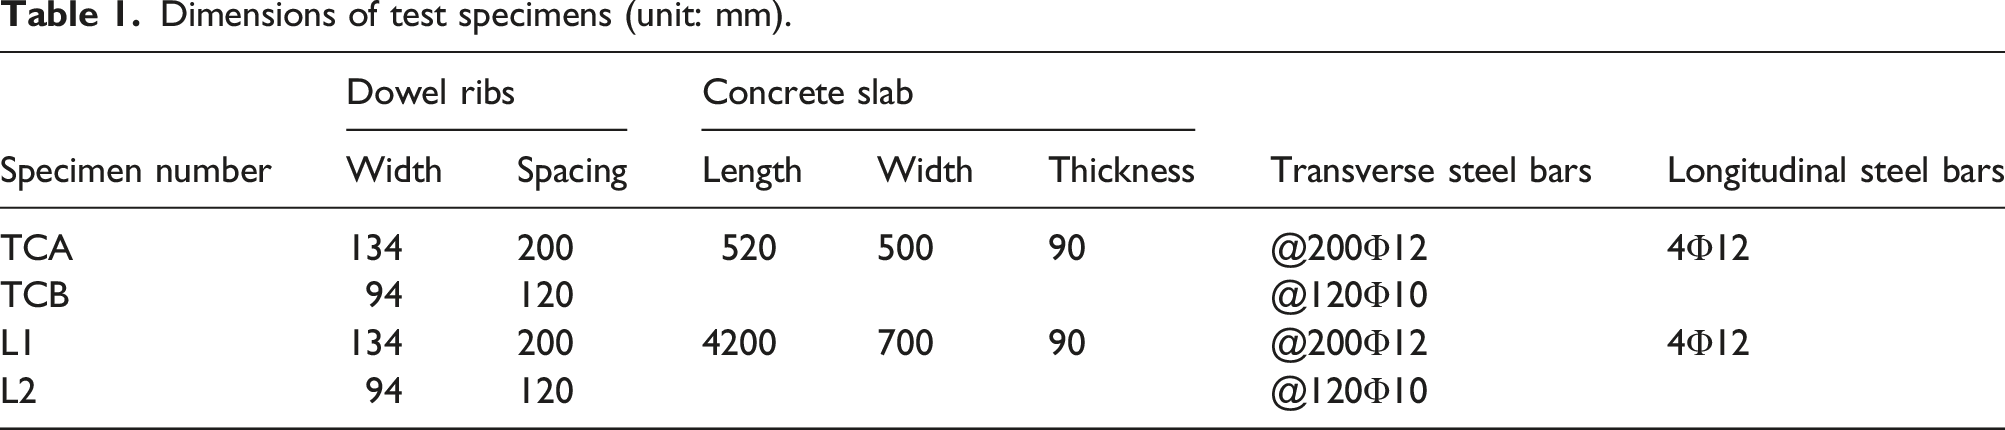
The steel members used for the push-out tests and flexural tests were processed and manufactured in the factory. Steel reinforcement banding, formwork erection, concrete pouring and concrete curing were conducted in the structure laboratory. The test setup of push-out test was shown in Figure 3(a). Four displacement transducers were symmetrically installed to record the relative slip between the concrete and steel, labelled as SP1, SP2, SP3 and SP4, as shown in Figure 3(b). Before the formal test, several preloading cycles were applied with a load of 100 kN to ensure the reliability of the loading device and data acquisition system. Test setup and measuring point arrangement.
The composite beam specimens were loaded symmetrically at two loading points with a spacing of 1500 mm, by the hydraulic jack through a distributing beam. The flexural test setup was shown in Figure 3(c).
The measured contents included vertical deflections, strains of steel beam, steel reinforcement and concrete, crack distribution and relative slip at the interface between the steel beam and concrete slab. In order to measure the vertical deflection of the composite beam, a total of three displacement transducers (LVDT) were arranged in the middle span and at the supports, respectively for each specimen, as shown in Figure 3(d-1). To capture the relative slip at the interface between steel beam and concrete slab along the beam axis, nine slip gauges labelled as SL1-SL9 were arranged longitudinally. For strain measurement, a total of nine strain gauges were arranged, as shown in Figure 3(d-2). Five strain gauges labelled as S1-S5 were distributed over the height in the middle span steel section. Two strain gauges labelled as C1 and C2 were symmetrically distributed on the concrete slab surface. Two strain gauges labelled as G1 and G2 were symmetrically distributed on the steel reinforcement.
In order to explore the stress state of the steel dowels, 45° strain gauge rosettes were arranged at the root of the steel dowels under the two loading points (labelled as YN and YS, respectively) and the middle span section (labelled as YM). Taking the north loading point (YN) as an example, YN-1 represented the vertical direction, YN-2 represented the 45° direction, and YN-3 represented the horizontal direction, as shown in the Figure 3(d-3).
Before the formal loading of flexural test, a preload cycle of 30 kN in three steps was exerted evenly. Monotonic step-by-step loading was adopted in the flexural test. At the initial stage of formal loading, it was loaded according to 1/20 ∼ 1/10 of the estimated failure load, which is predicted by plastic section method based on section properties. In the early stage, the test loading was applied at 20 kN per stage and sustained for 10 min to record and mark the crack development and distribution. After the obvious cracks and yield deformation had been observed in the composite beam, the displacement control loading was used until the specimen reached the ultimate failure.
Test results and analysis
Push-out test
Failure mode and load-slip curves
The ultimate failure of concrete slab was observed in the all push-out specimens. Gradually increasing the load, slight sound at the steel-concrete interface was heard, indicating that the applied load was overcoming the interface adhesion between the steel section and the concrete slab. Continuously increasing the load, fine cracks appeared near the central axis on the surfaces of the concrete slabs, and then extended upward gradually from the lower portion of the concrete slab to the upper part of concrete slab, while width of the cracks also appeared increasing gradually. Finally, cone failure accompanying crushing pattern occurred in the concrete slabs, and the load attained to the maximum value and declined while the interface slip between the steel and concrete still developed. Figure 4(a) shows the ultimate failure patterns of the push-out specimens. After completing all the push-out tests, the concrete slabs of the specimens were manually removed and it was found that the folded steel dowels do not show significant deformation or other failure forms. It can be concluded that because of the low concrete strength of the specimens, the specimens are mainly caused by concrete failure. Failure modes and Load-slip curves of push-out specimens.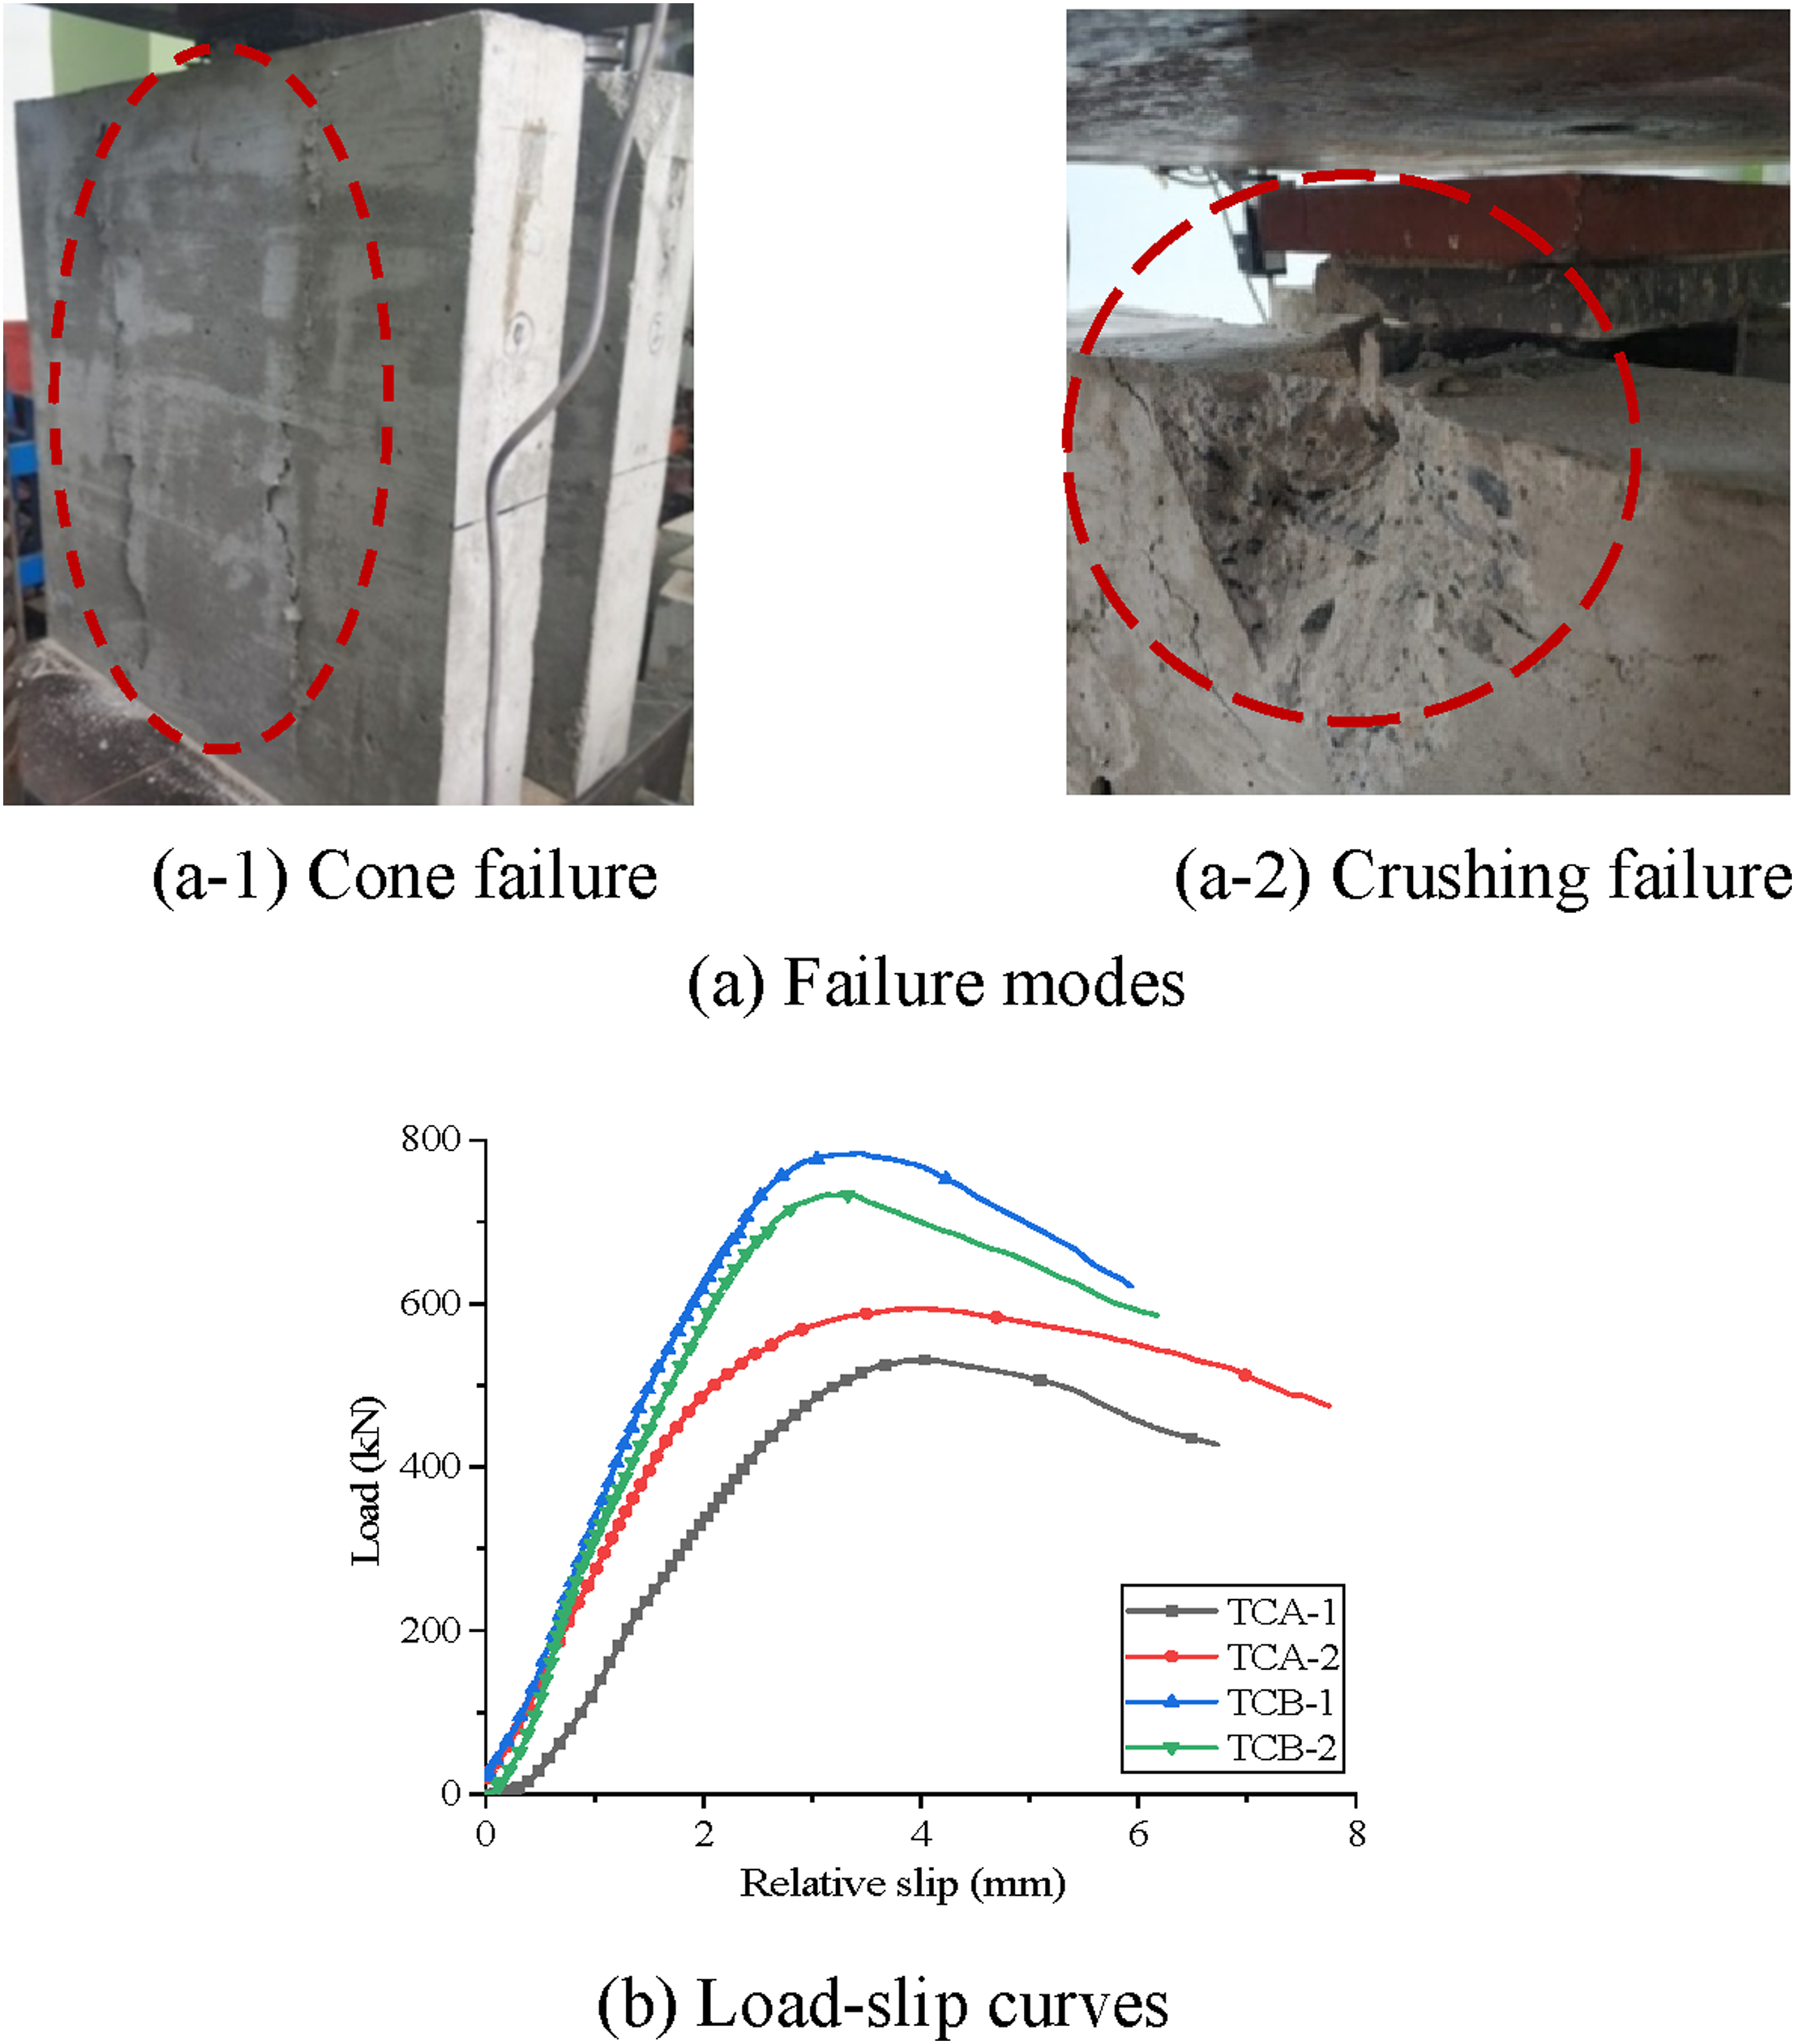
The mean values of displacements of the four measuring points (SP1-SP4) were taken as the relative slip at the interface between steel and concrete. The load-slip curves of the four push-out specimens are show in Figure 4(b). All specimens went through three stages: namely elastic stage, elastic-plastic stage and plastic stage, respectively. Before 65% of the ultimate shear load (Pus), the specimen was in the elastic stage, and the shear stiffness (appearing as the slope of tangent in the load-slip curve) was constant. The relative slip was small, less than 1.5 mm. Between 65%–85% of Pus, the specimen was in the elastic-plastic stage, and the shear stiffness decreased gradually. After 85% of Pus, the specimen was in the plastic stage. The load increased slowly, while the relative slip still increased until the ultimate failure of concrete slab.
Shear bearing capacity and ductility
Shear bearing capacity, stiffness and Relative slip of composite dowel.
Besides the bearing capacity and shear stiffness, ductility is also very important. According to Eurocode-4 (ECS, 2005), 90% of the ultimate load (Pmax) is taken as the characteristic load (PRK). When it reaches the characteristic load PRK for the first time, the relative slip is regarded as the initial slip (δ is ). When it drops to the characteristic load PRK after experiencing the peak load Pmax, the relative slip is regarded as the ultimate slip (δ us ). The initial slip, ultimate slip and the ductility (δ us /δ is ) of all specimens were shown in Table 2. The relative slip ratios (δ us /δ is ) of specimen TCA were higher than that of specimen TCB, indicating that specimens TCA possess better ductility.
Flexural test
Failure mode and load-deflection curves
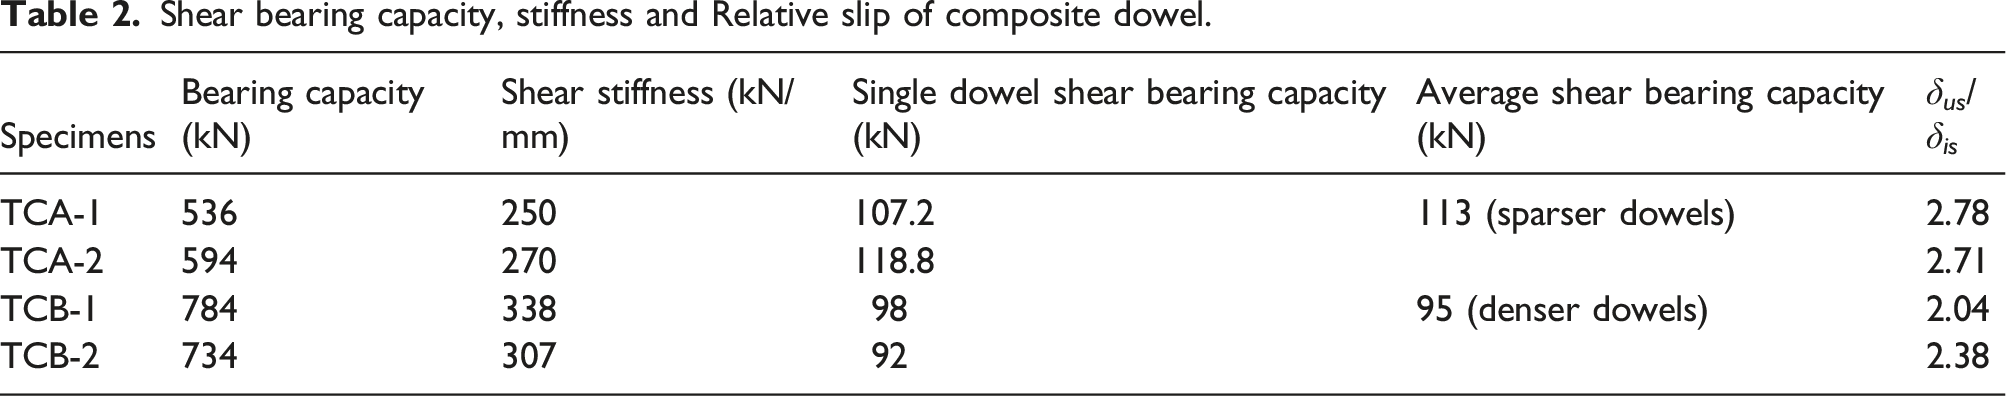
When the load increased to 0.45 times the ultimate flexural load (Puf), small and fine longitudinal cracks were observed on the top of the concrete slab in the bending shear region, while transverse cracks also appeared in the bottom of the concrete slab near the loading point. The longitudinal cracks mainly due to the shear force resisted by the rigid shear connectors appeared parallel and close to the central axis of the concrete slab. It appeared that though the longitudinal cracks initiated early at 0.45Puf, the beam was capable of developing the full flexural bearing capacity, as the transverse reinforcements embedded in the concrete slab were sufficient to transfer the longitudinal shear. Unlike the longitudinal cracks, the first transverse crack occurred in the bottom surface near the loading point. With continuously increasing load, the crack length expanded and widened gradually. When increasing to 0.75 Puf, the longitudinal crack extended from the loading point to the support (Figure 5(a-1)), and spalling of concrete occurred near the loading point (Figure 5(a-3)). Though longitudinal cracks initiated early between 0.45 Puf and 0.75 Puf in the specimens L1 and L2, the ultimate failure was identified as flexural failure for both specimens L1 and L2, featuring with crush of concrete near the mid-span region and full plastic yielding in the bottom steel flange, as shown in Figures 5 and 6. Failure modes and Mid-span Load-deflection curves of specimens L1 and L2. Strain distribution over depth and Load-shear strain curves.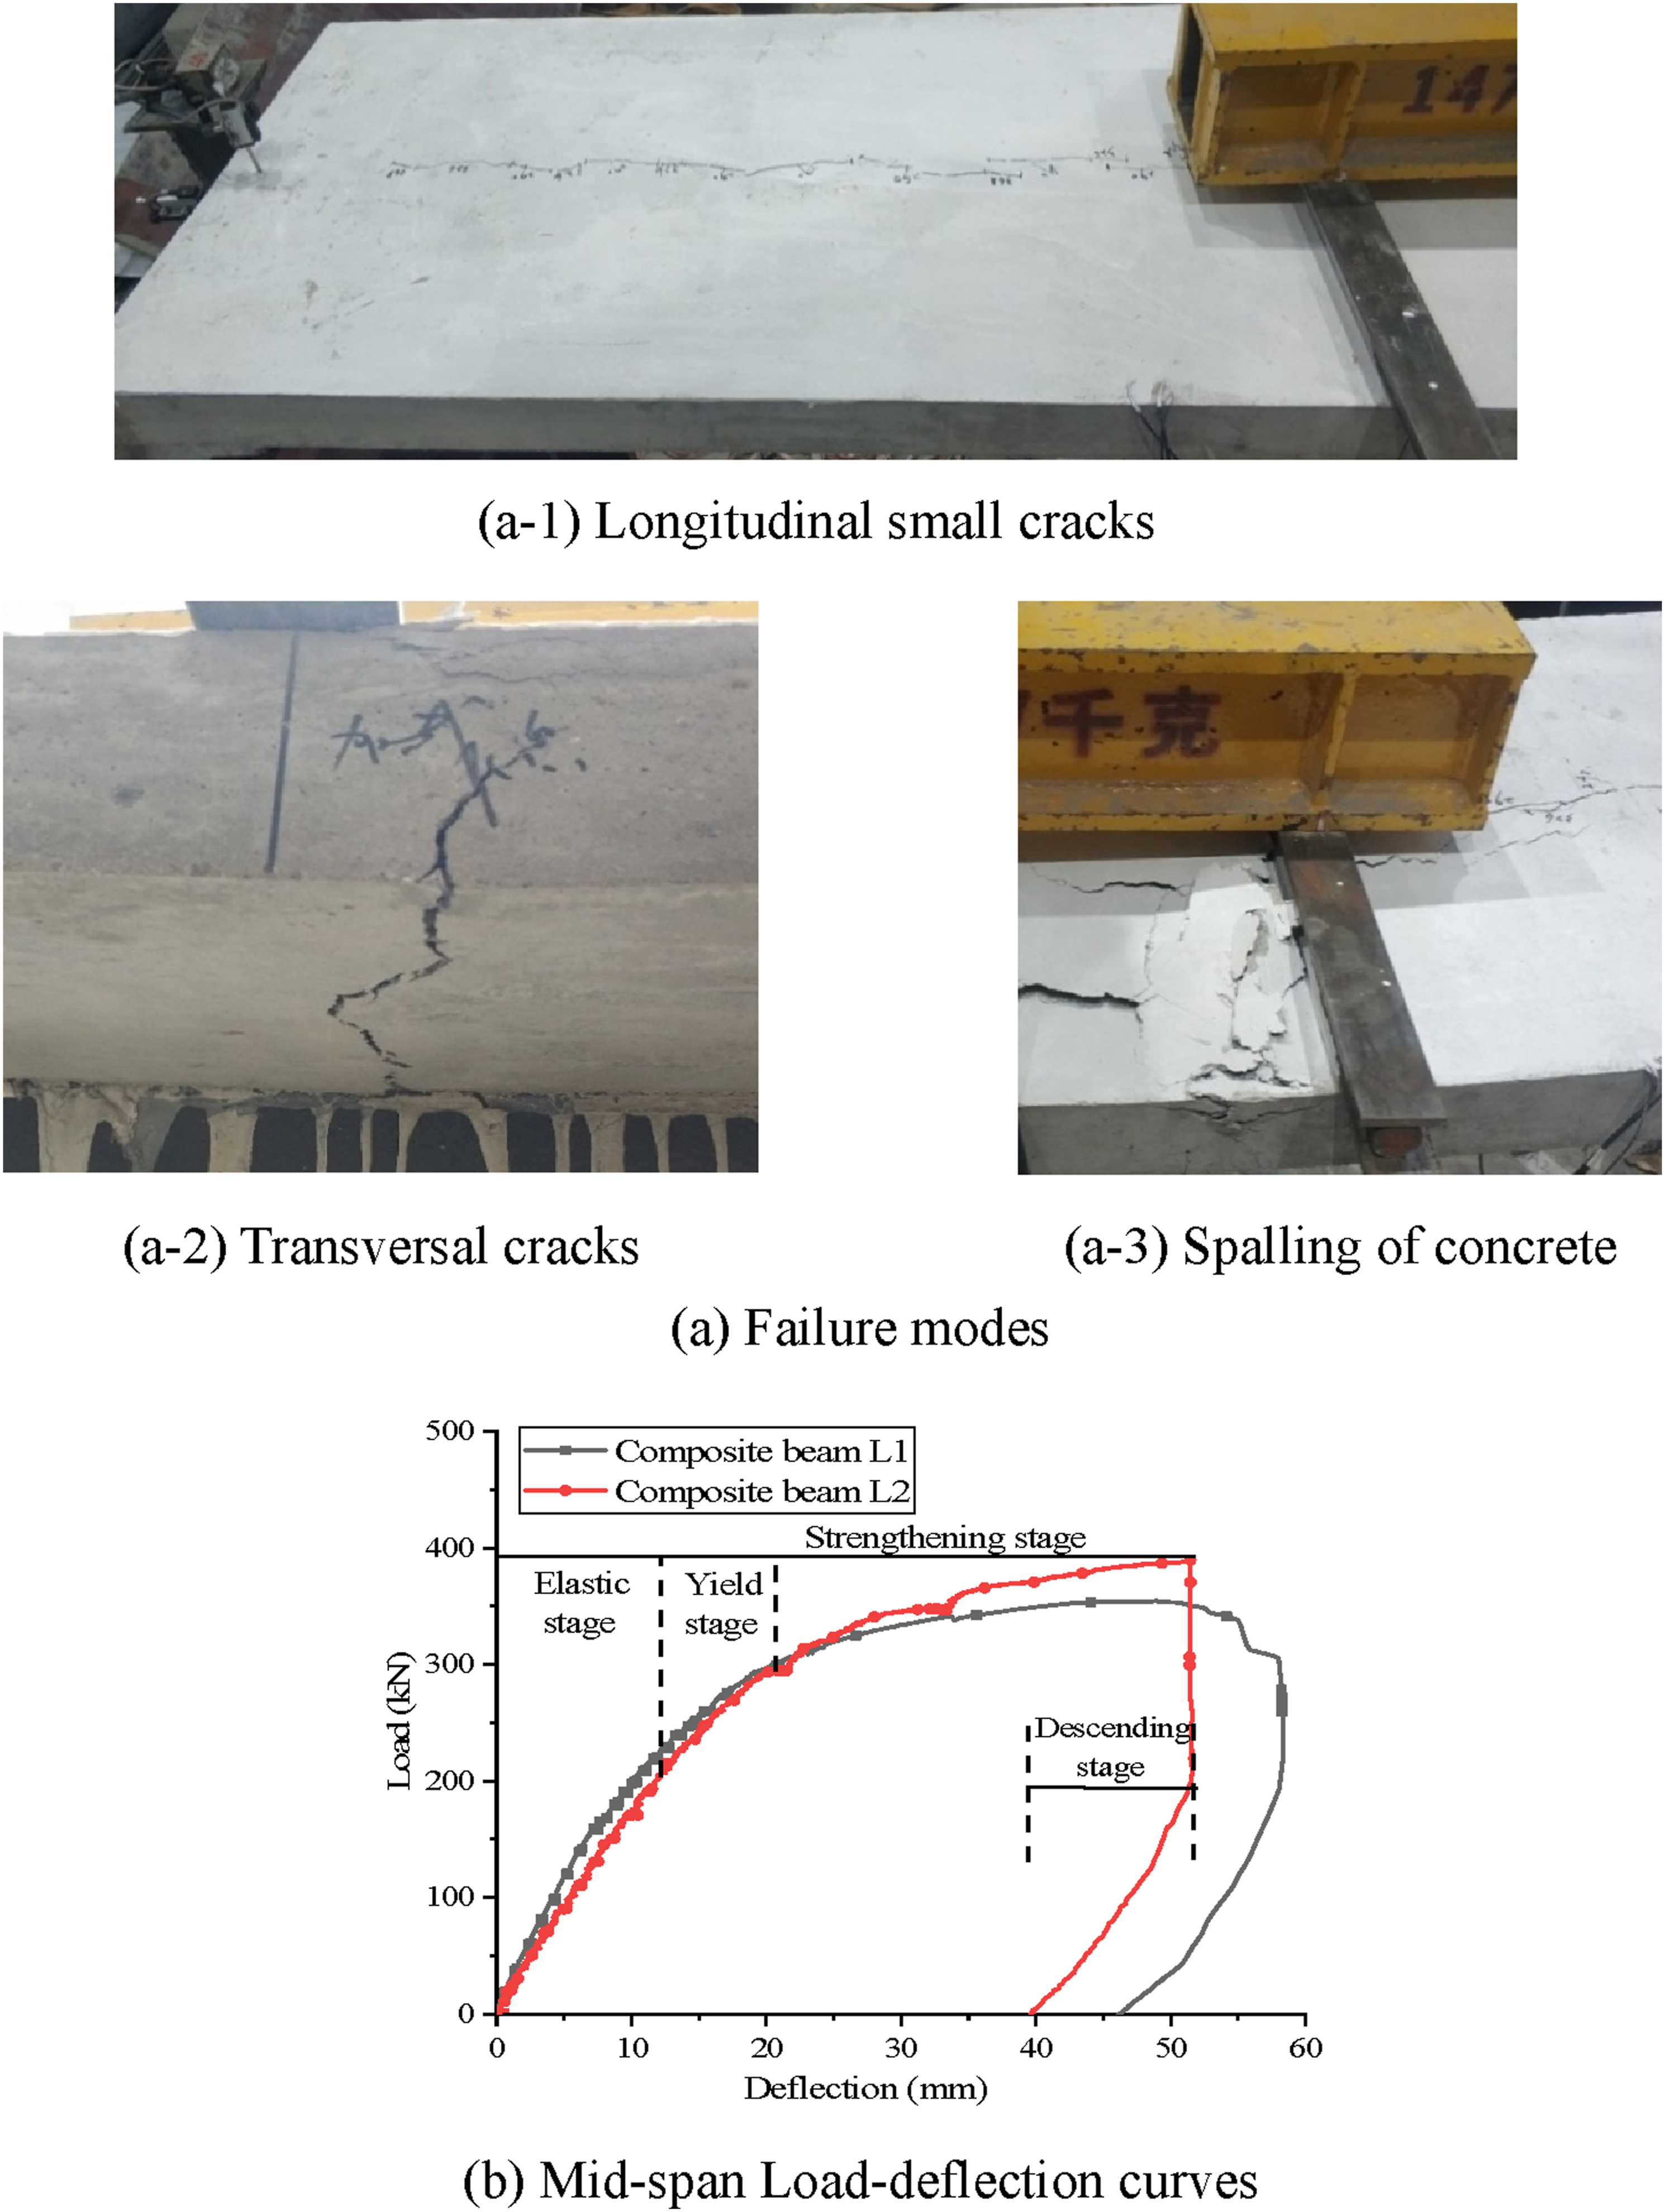
The load-deflection curves of specimens L1 and L2 were shown in Figure 5(b). Taking the specimen L2 as an example, at the elastic stage, the deflection appeared increasing with load in a linear proportion manner. With load continuously increasing, the deflection increased significantly in a nonlinear growth manner, and the specimens reached yield stage. Finally, the flexural specimens developed to the strengthening stage, and then the load-deflection curve entered the descending stage.
The ultimate loads of specimens L1 and L2 were 355 kN and 391 kN, respectively, and the latter was 10% greater than the former. The corresponding maximum vertical deflections were 55.2 mm and 51.1 mm, respectively, and the latter was 8% smaller than the former. It appears that the composite beam with denser spacing dowels has higher ultimate flexural capacity and lower ductility than the composite beam with sparser spacing dowels. Dividing the ultimate deflection (δ u ) by the yield deflection (δ y ) based on the test results, the flexural deflection ductility of specimens L1 and L2 were 2.7 and 2.36, respectively.
Slip at the steel-concrete interface
The relative slip curves at the steel-concrete interface of specimens L1 and L2 along the span were shown in the Figure 7. The abscissa represented the distance from the middle of the span, with the north side as positive and the south side as negative. The relative slip of the middle of the span was zero. Relative slip along the steel-concrete interface.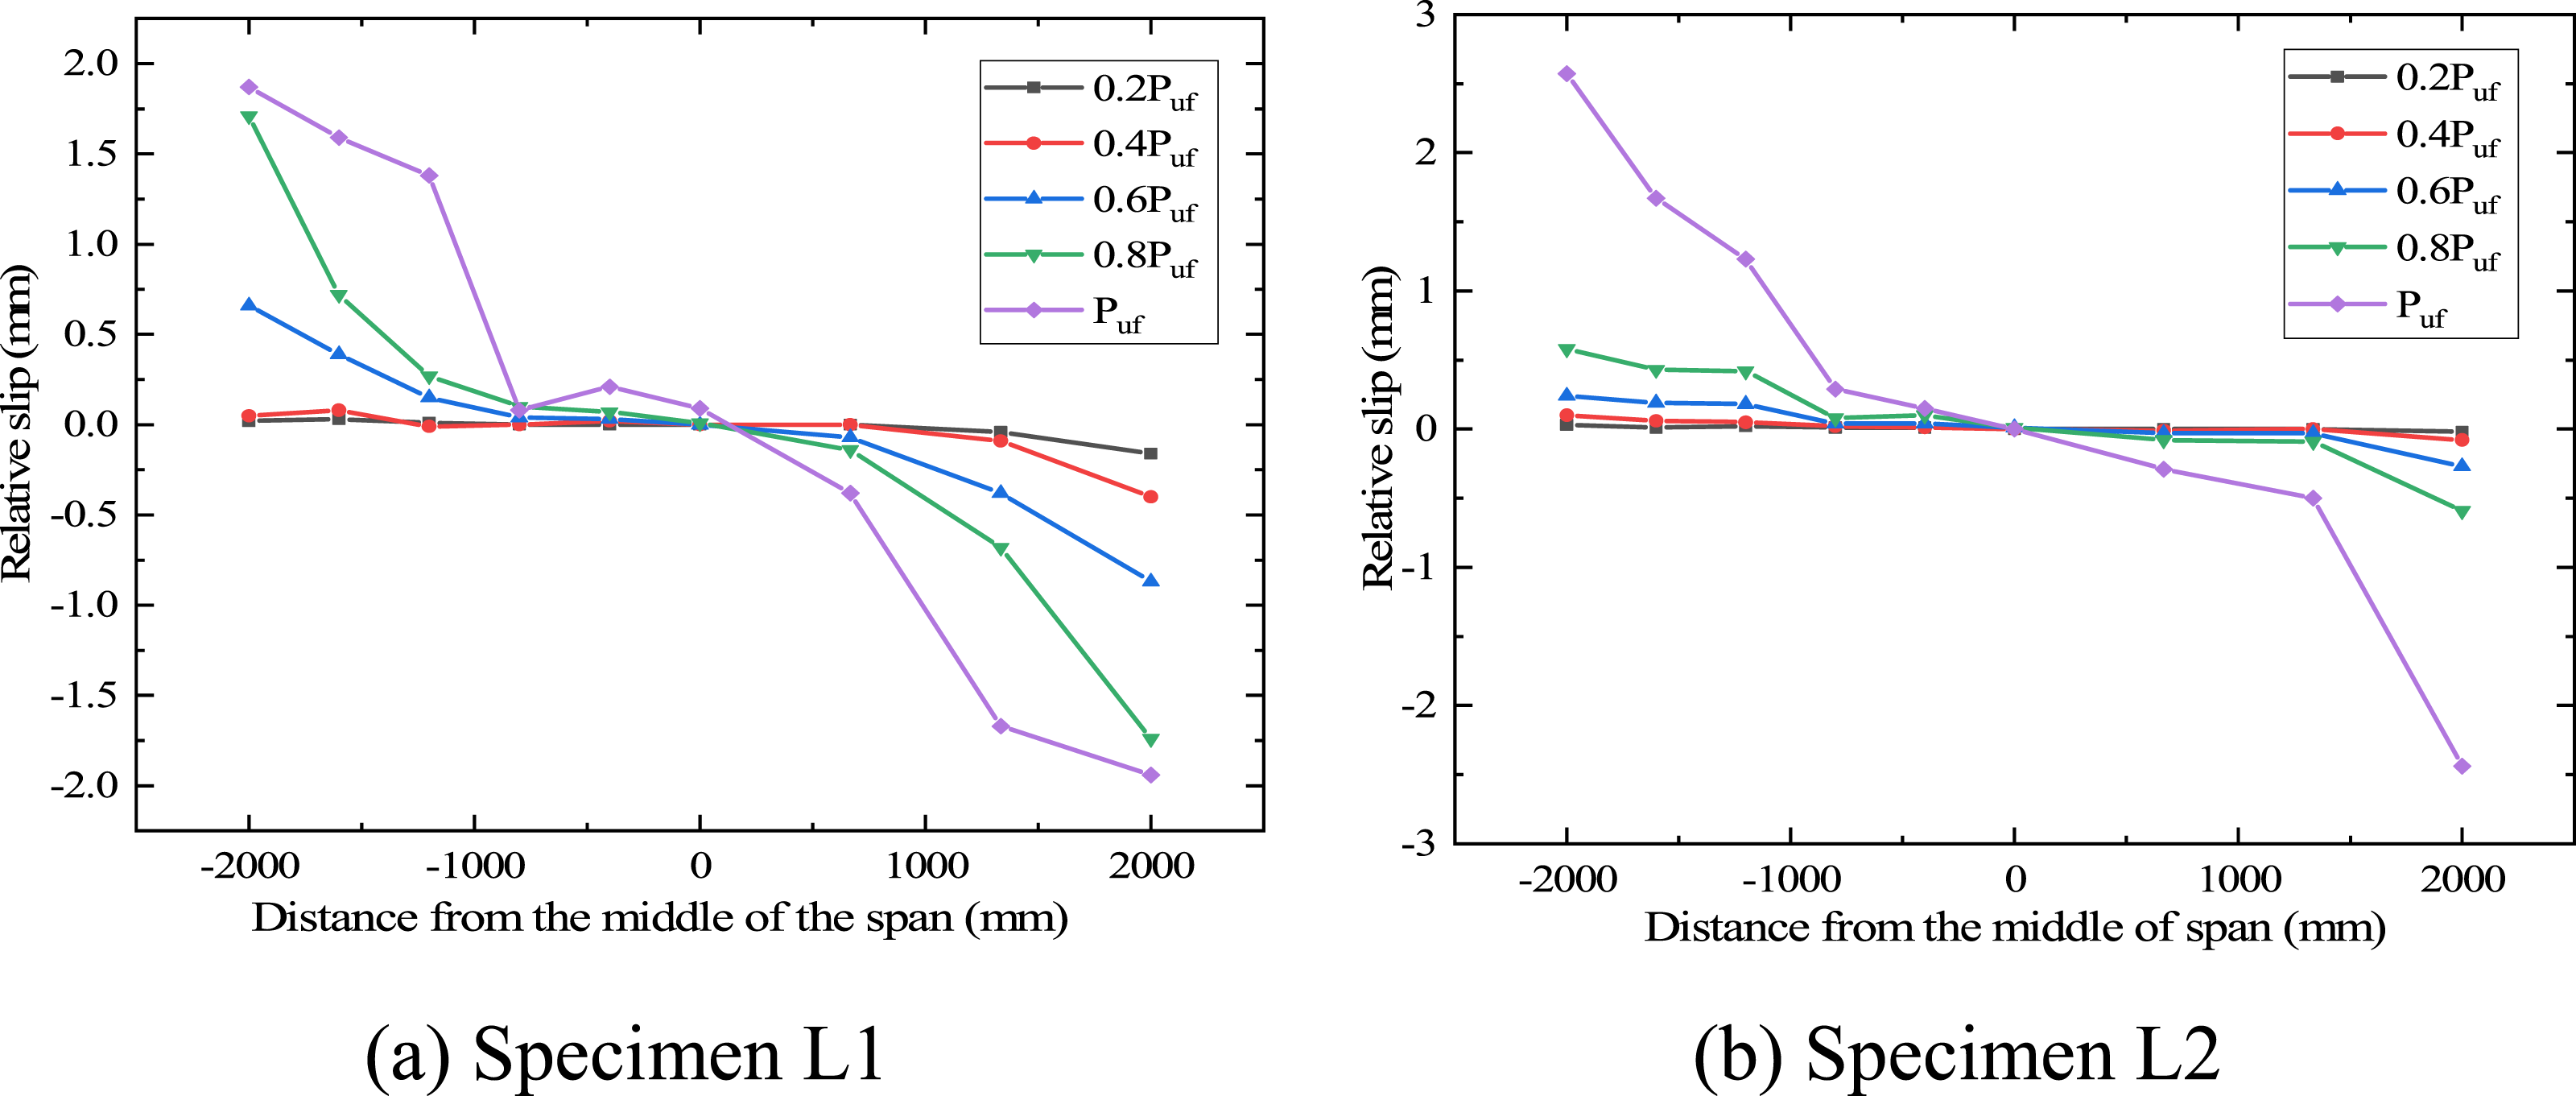
As illustrated in Figure 7(a), when the load was less than 0.4 Puf (the ultimate flexural load), the relative slip of specimen L1 was almost zero. With load increasing gradually, slip along the beam became obvious. At 0.8 Puf, the slip reached 1.74 mm, and then tended to be stable. The maximum relative slip was 1.94 mm, which occurred at the beam end. It appears that slip mainly occurred in the bending shear zone near the support. For the pure bending region in the middle span, the slip maintained a low value, saying less than 0.5 mm.
For specimen L2 as shown in Figure 7(b), when load was less than 0.8 Puf, the slip was small, and the maximum slip at the beam end was 0.59 mm. Compared with specimen L1 at this load level, the slip of specimen L2 was about 34% of that in specimen L1. However, with further increasing load, the obvious slip occurred. At the ultimate load, the maximum slip at the beam end was 2.57 mm, about 32% increase as compared with that occurred in specimen L1.
Strain of composite beam
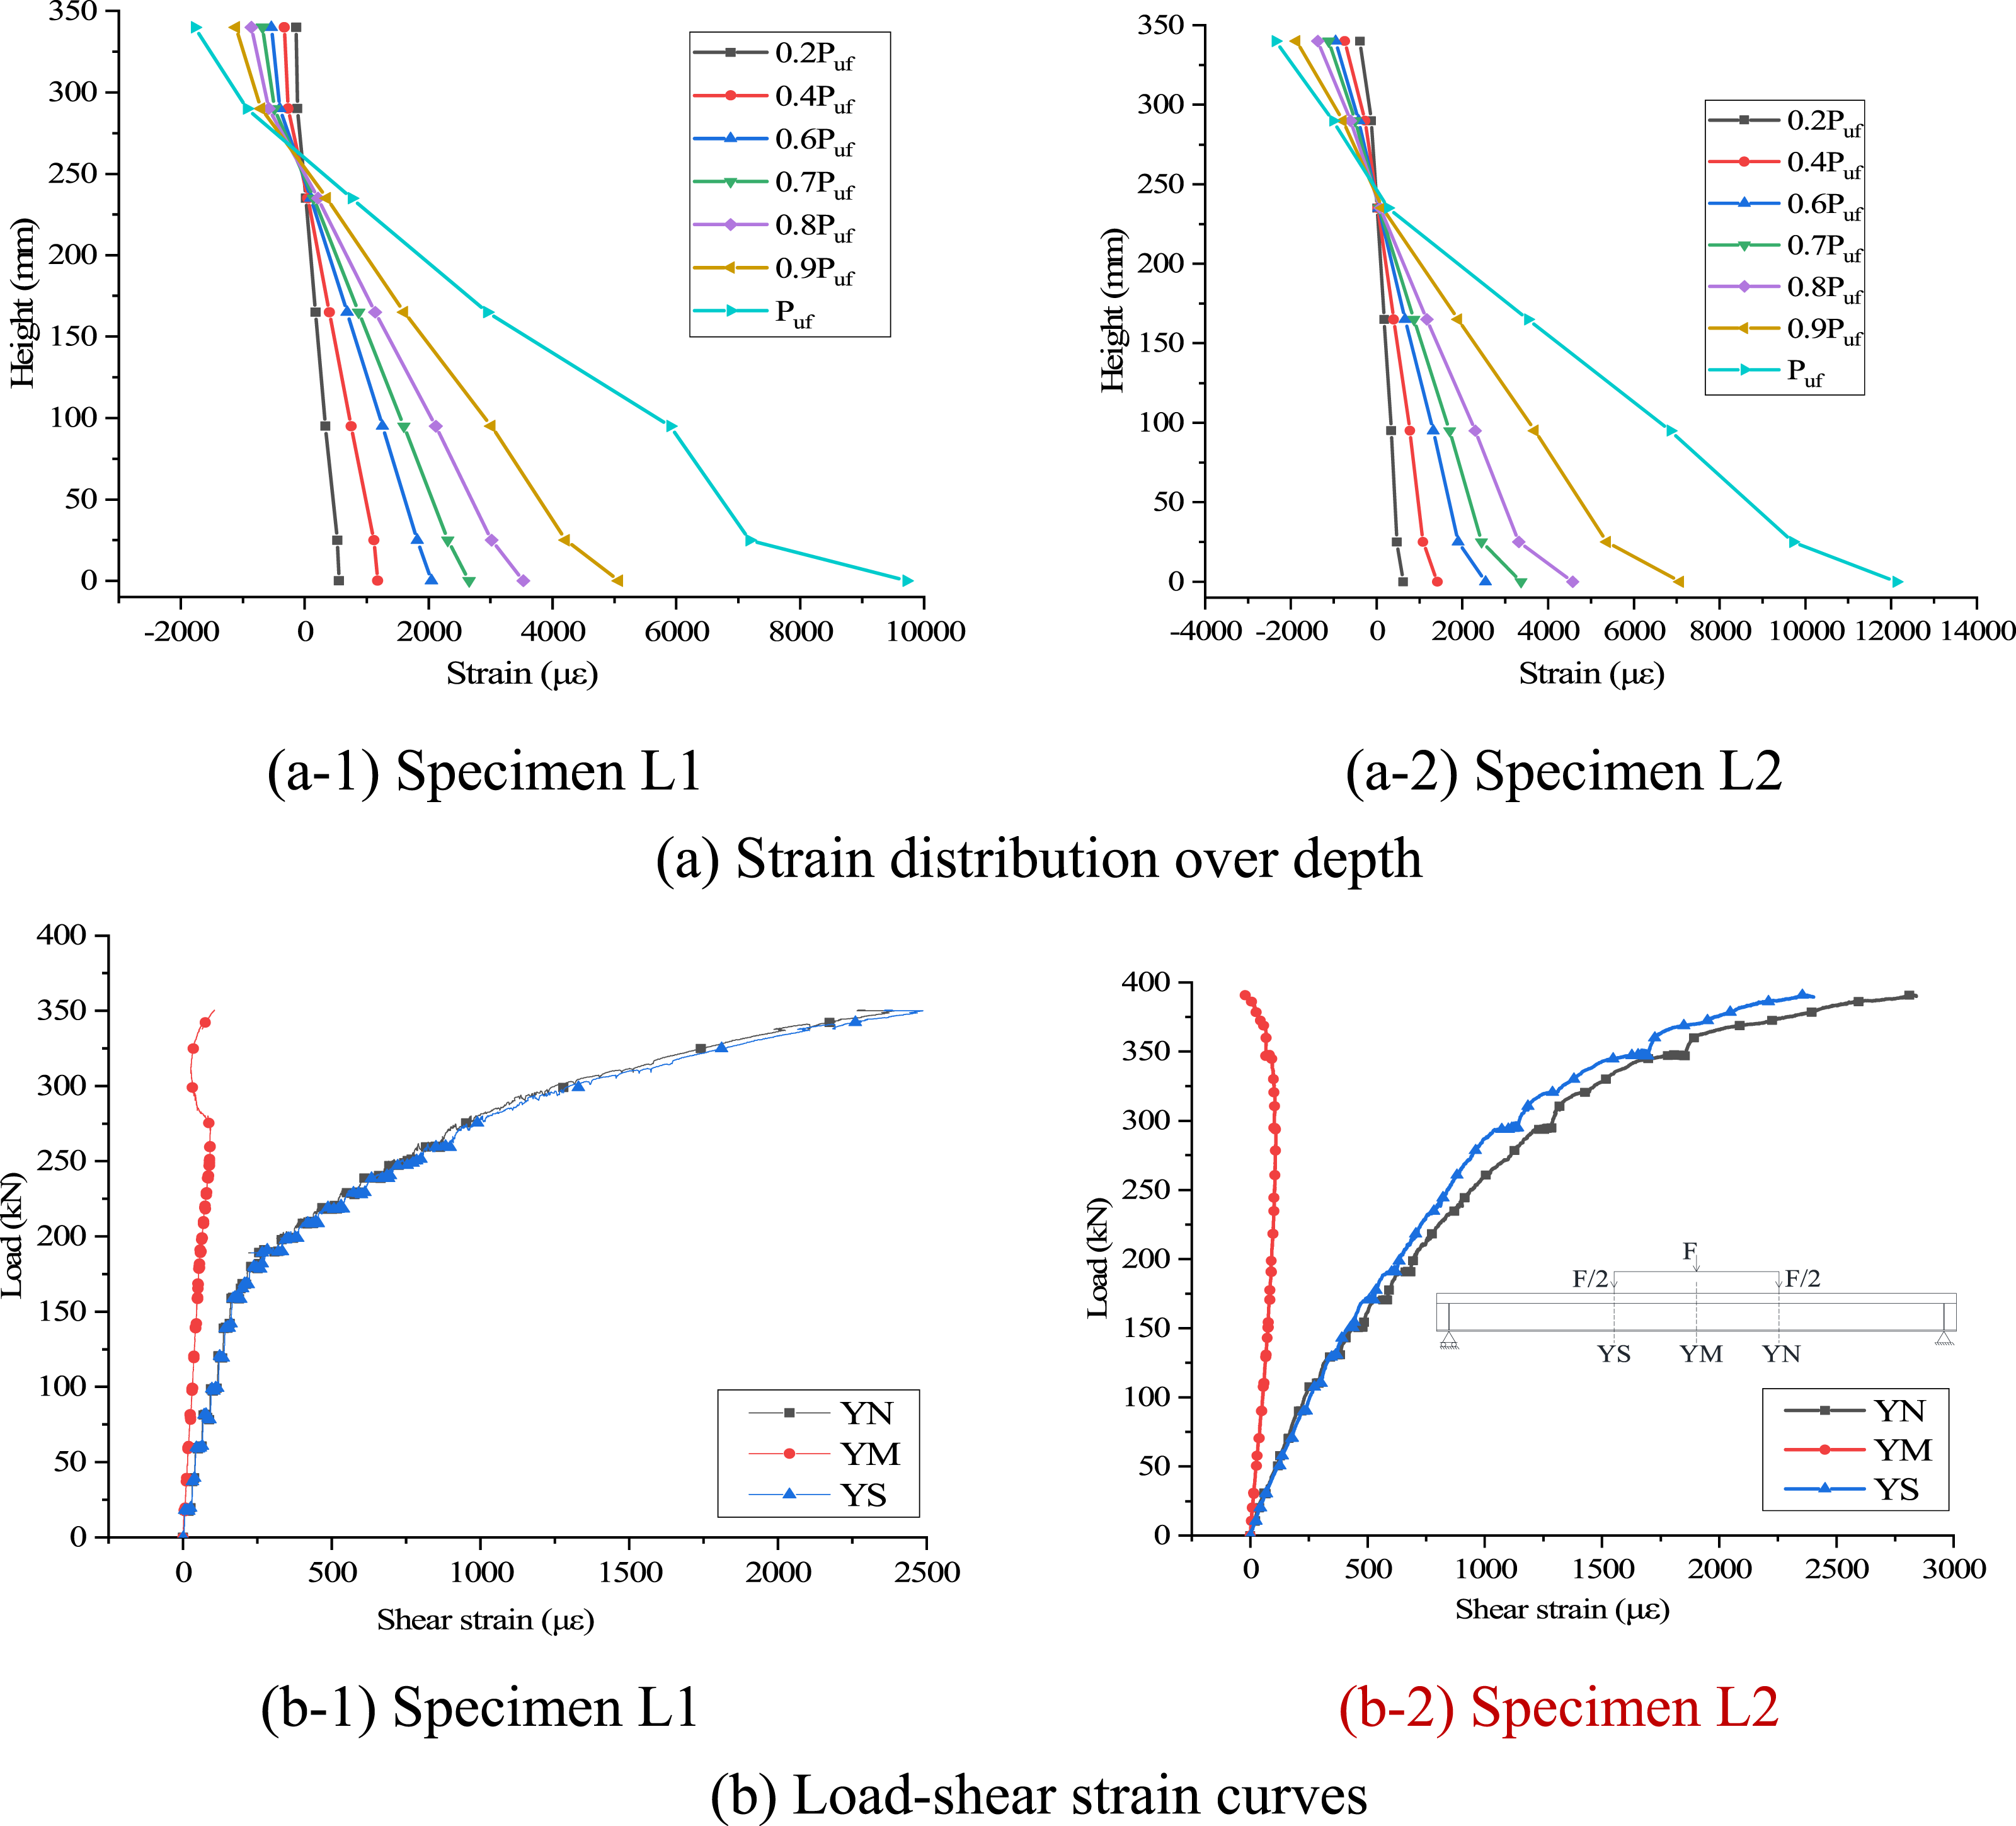
Strains of the steel beams in the middle span section were captured and shown in Figure 6. At early stage of loading, the strains of beams increased linearly with the loading, and over depth of the cross section, strain distribution satisfied the plane section assumption, indicating capable of full composite action between the steel and the concrete. With load gradually increasing, the strain distribution tended to the nonlinear and elastic-plastic characteristics. However, on the whole, it basically met the plane section assumption.
For the folded dowel shear connection, the stress state of the steel dowels was particularly complex, so attention was also paid to capture the strains of the steel dowels. According to the materials mechanics, the shear strain measured by the strain gauge rosette pasted on the steel dowel (position shown in Figure 3(d-3)) can be calculated. The load-shear strain curves were plotted as shown in Figure 6. Since in the mid-span section, the beam was in pure bending, and the shear strain was in a low horizontal fluctuation. Due to existence of shear force, the shear strains of the north loading point and the south loading point showed good consistency. With the increasing load, the growth rate of shear strain increased obviously. It was illustrated that at the ultimate load, yielding also developed in the folded dowels.
Finite element parameter analysis
Finite element models and validation
Based on the push-out test results, the finite element (FE) simulation was further carried out by using ABAQUS software. The validity of the FE model was verified by comparing the test results with the FE analytical results. The influences of strength and thickness of concrete slab, strength, thickness and folded angle of steel dowel on the mechanical properties of the folded dowel shear connection were analysed.
The FE model of the push-out specimen was composed of concrete slab, folded dowel shear connector, steel reinforcement and loading plate. The concrete damage plastic (CDP) model was adopted for the concrete slab, and the constitutive relation referred to the Code for design of concrete structures (GB50010-2010, 2015), as shown in Figure 8(a-1). The plastic parameters of CDP model were determined according to the references (Huang et al., 2021; Kmiecik and Kaminski, 2011). The dilation angle of CDP model is 35°, the eccentricity is 0.1, and K is 0.667. According to the energy equivalence principle, the relationship between damage degree and inelastic strain can be obtained. Since the folded dowel shear connectors had experienced a significant yield stage, the constitutive relationship was modelled by trilinear stress-strain curve, as shown in Figure 8(a-2). The ideal elastic-plastic constitutive model was adopted for steel reinforcement, as shown in Figure 8(a-3). FE model of push-out specimen.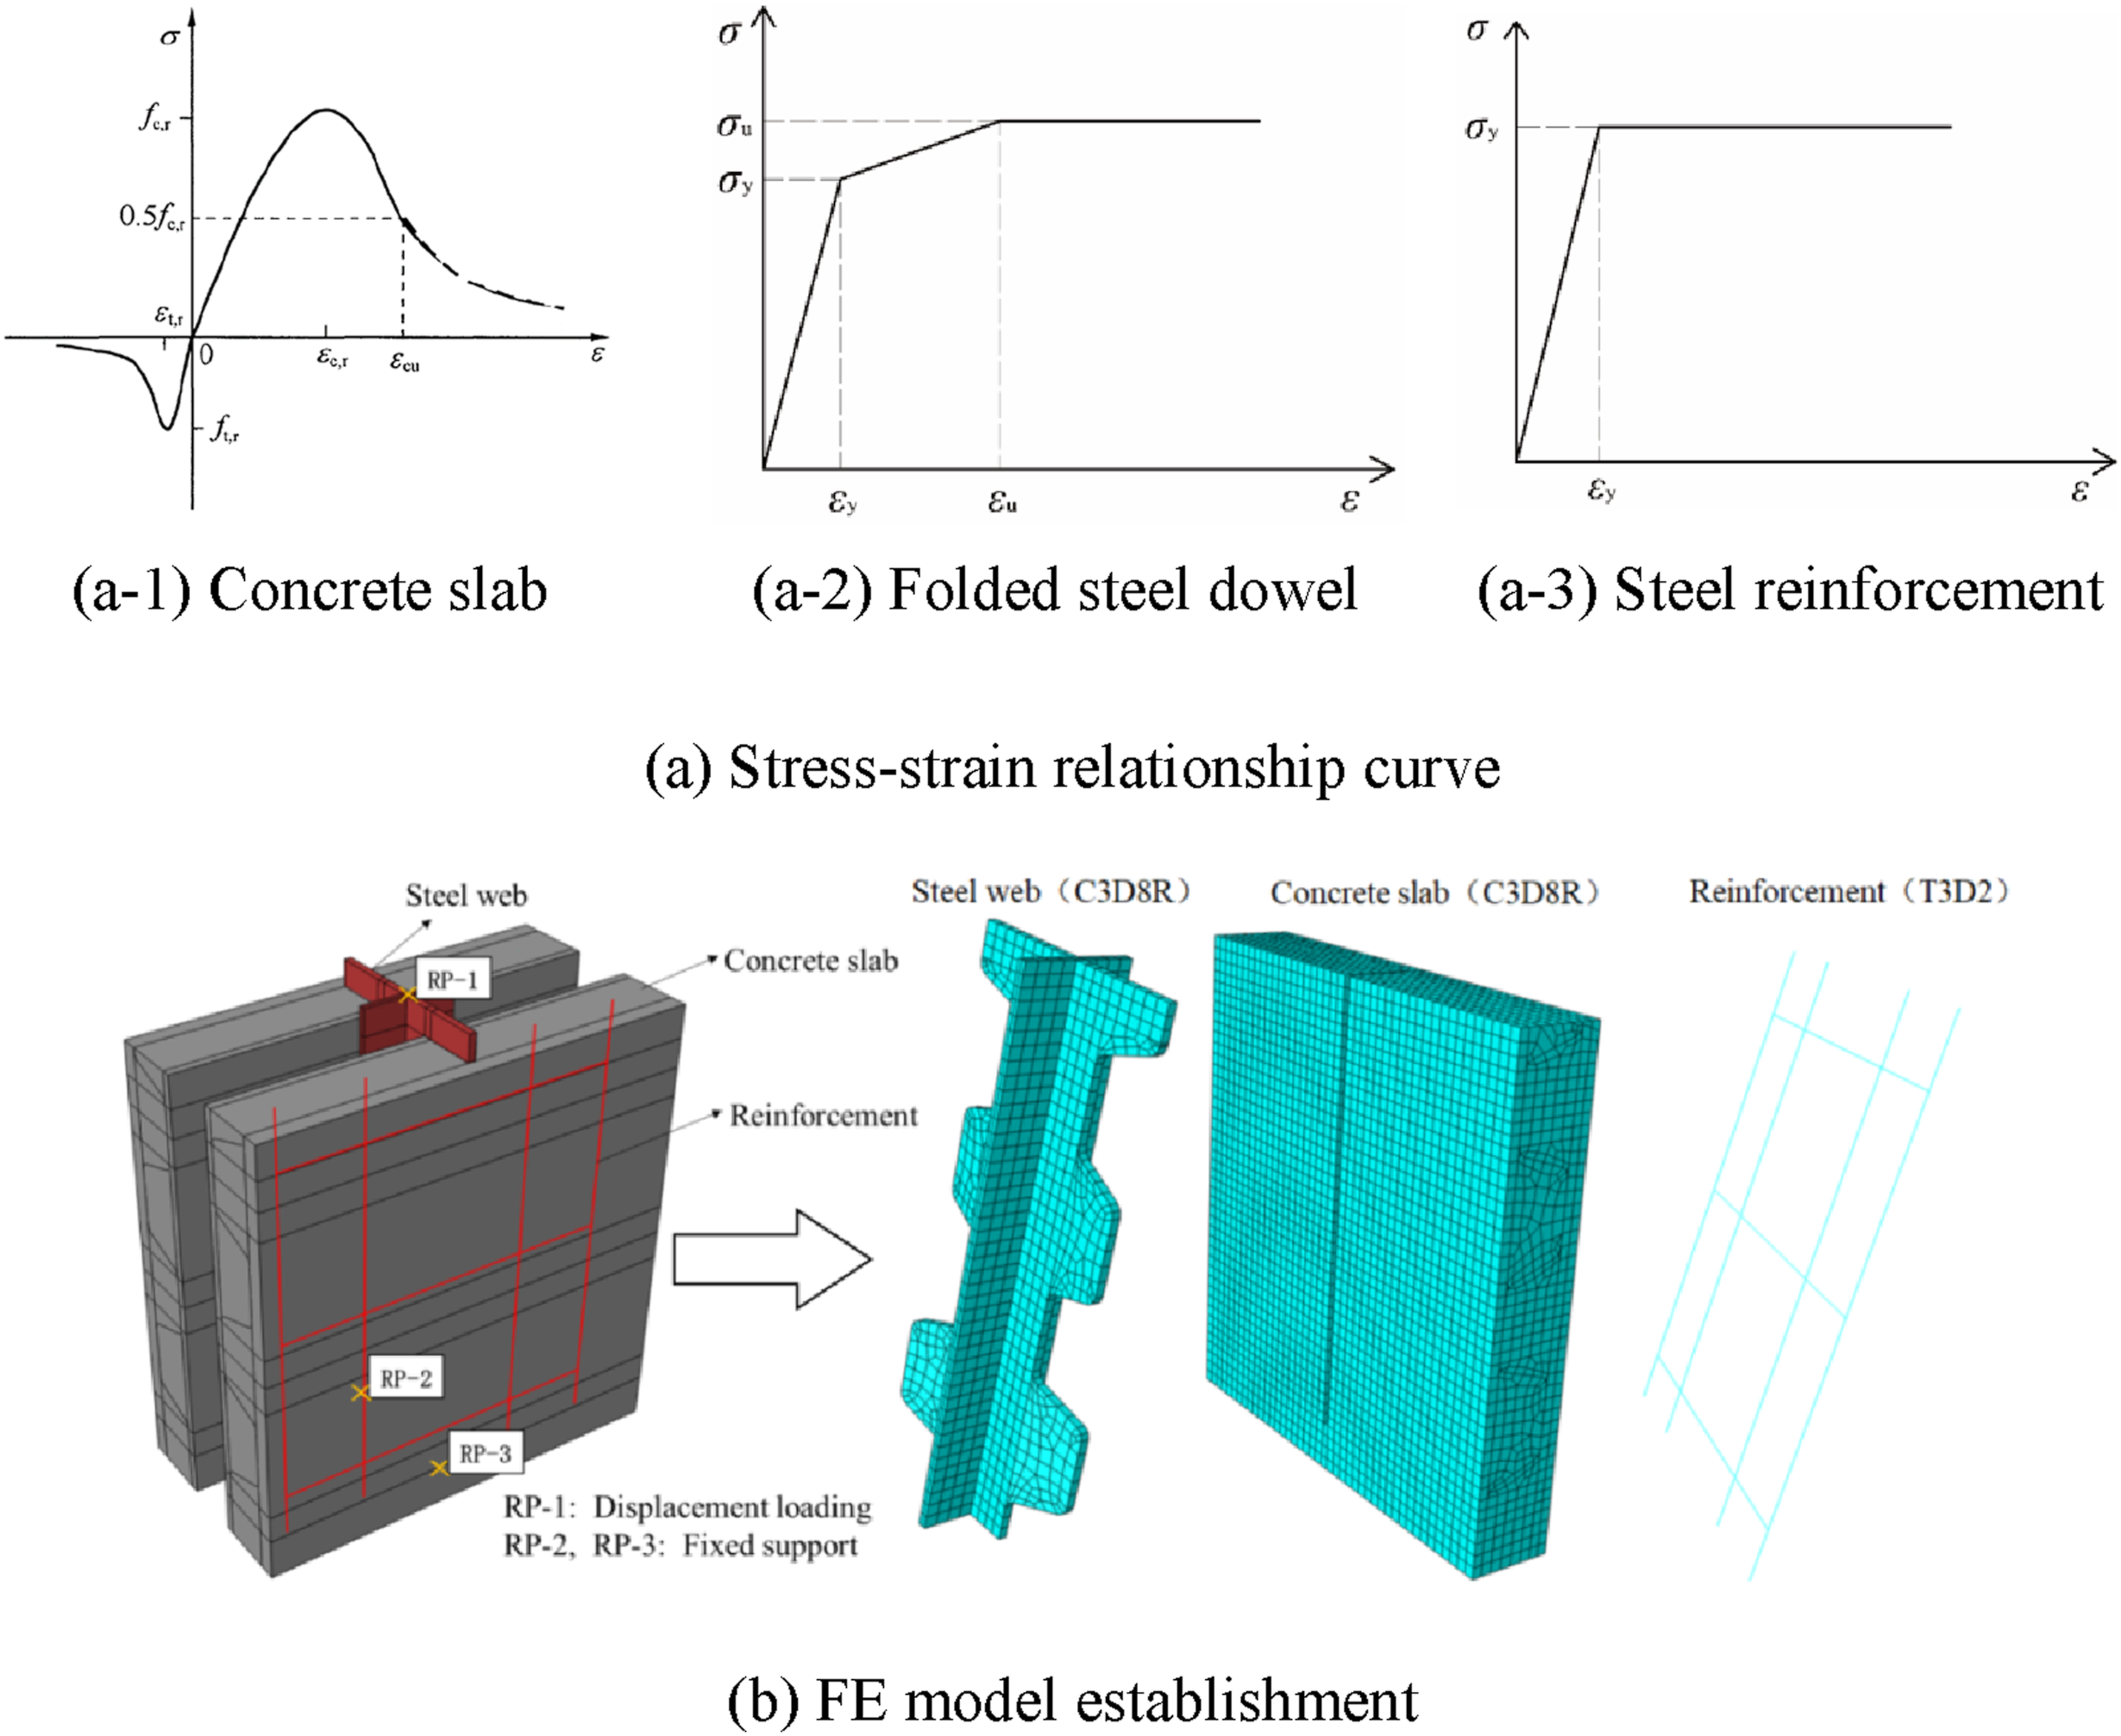
Both steel dowel and concrete slab were simulated by using solid element C3D8R. The steel reinforcement was simulated by truss element T3D2, coupling with the surrounding concrete by embedded region. The surface to surface contact was adopted between concrete slab and steel dowel, and the friction coefficient was 0.3 based on the based on the test results and existing studies (Lorenc et al., 2013, 2014b). In the FE analysis, the reference point 1-3 were set at the top steel dowel and the bottom bearing of the model, respectively, which were bounded with the corresponding targets. The displacement loading was applied to the RP-1, and the fixed boundary conditions were applied to the RP-2 and RP-3. The grid size of the non-concerned region was 12 mm, and the grid size of local stress concentration area was 6 mm, as shown in Figure 8(b).
The load-slip curves obtained from the FE model and the test results are summarized as shown in the Figure 9. Due to the infinite rigidity and fixed support in the finite element, as well as the missing deflection of the test frame, the finite element model has higher stiffness than the test results. The FE model is verified against test results. The ultimate loads obtained from push-out tests are 594 kN and 759 kN, respectively, which are close to the calculated results (583 kN and 754 kN), indicating that the FE model can better reflect the mechanical properties of the push-out specimen. Load-slip curves comparison.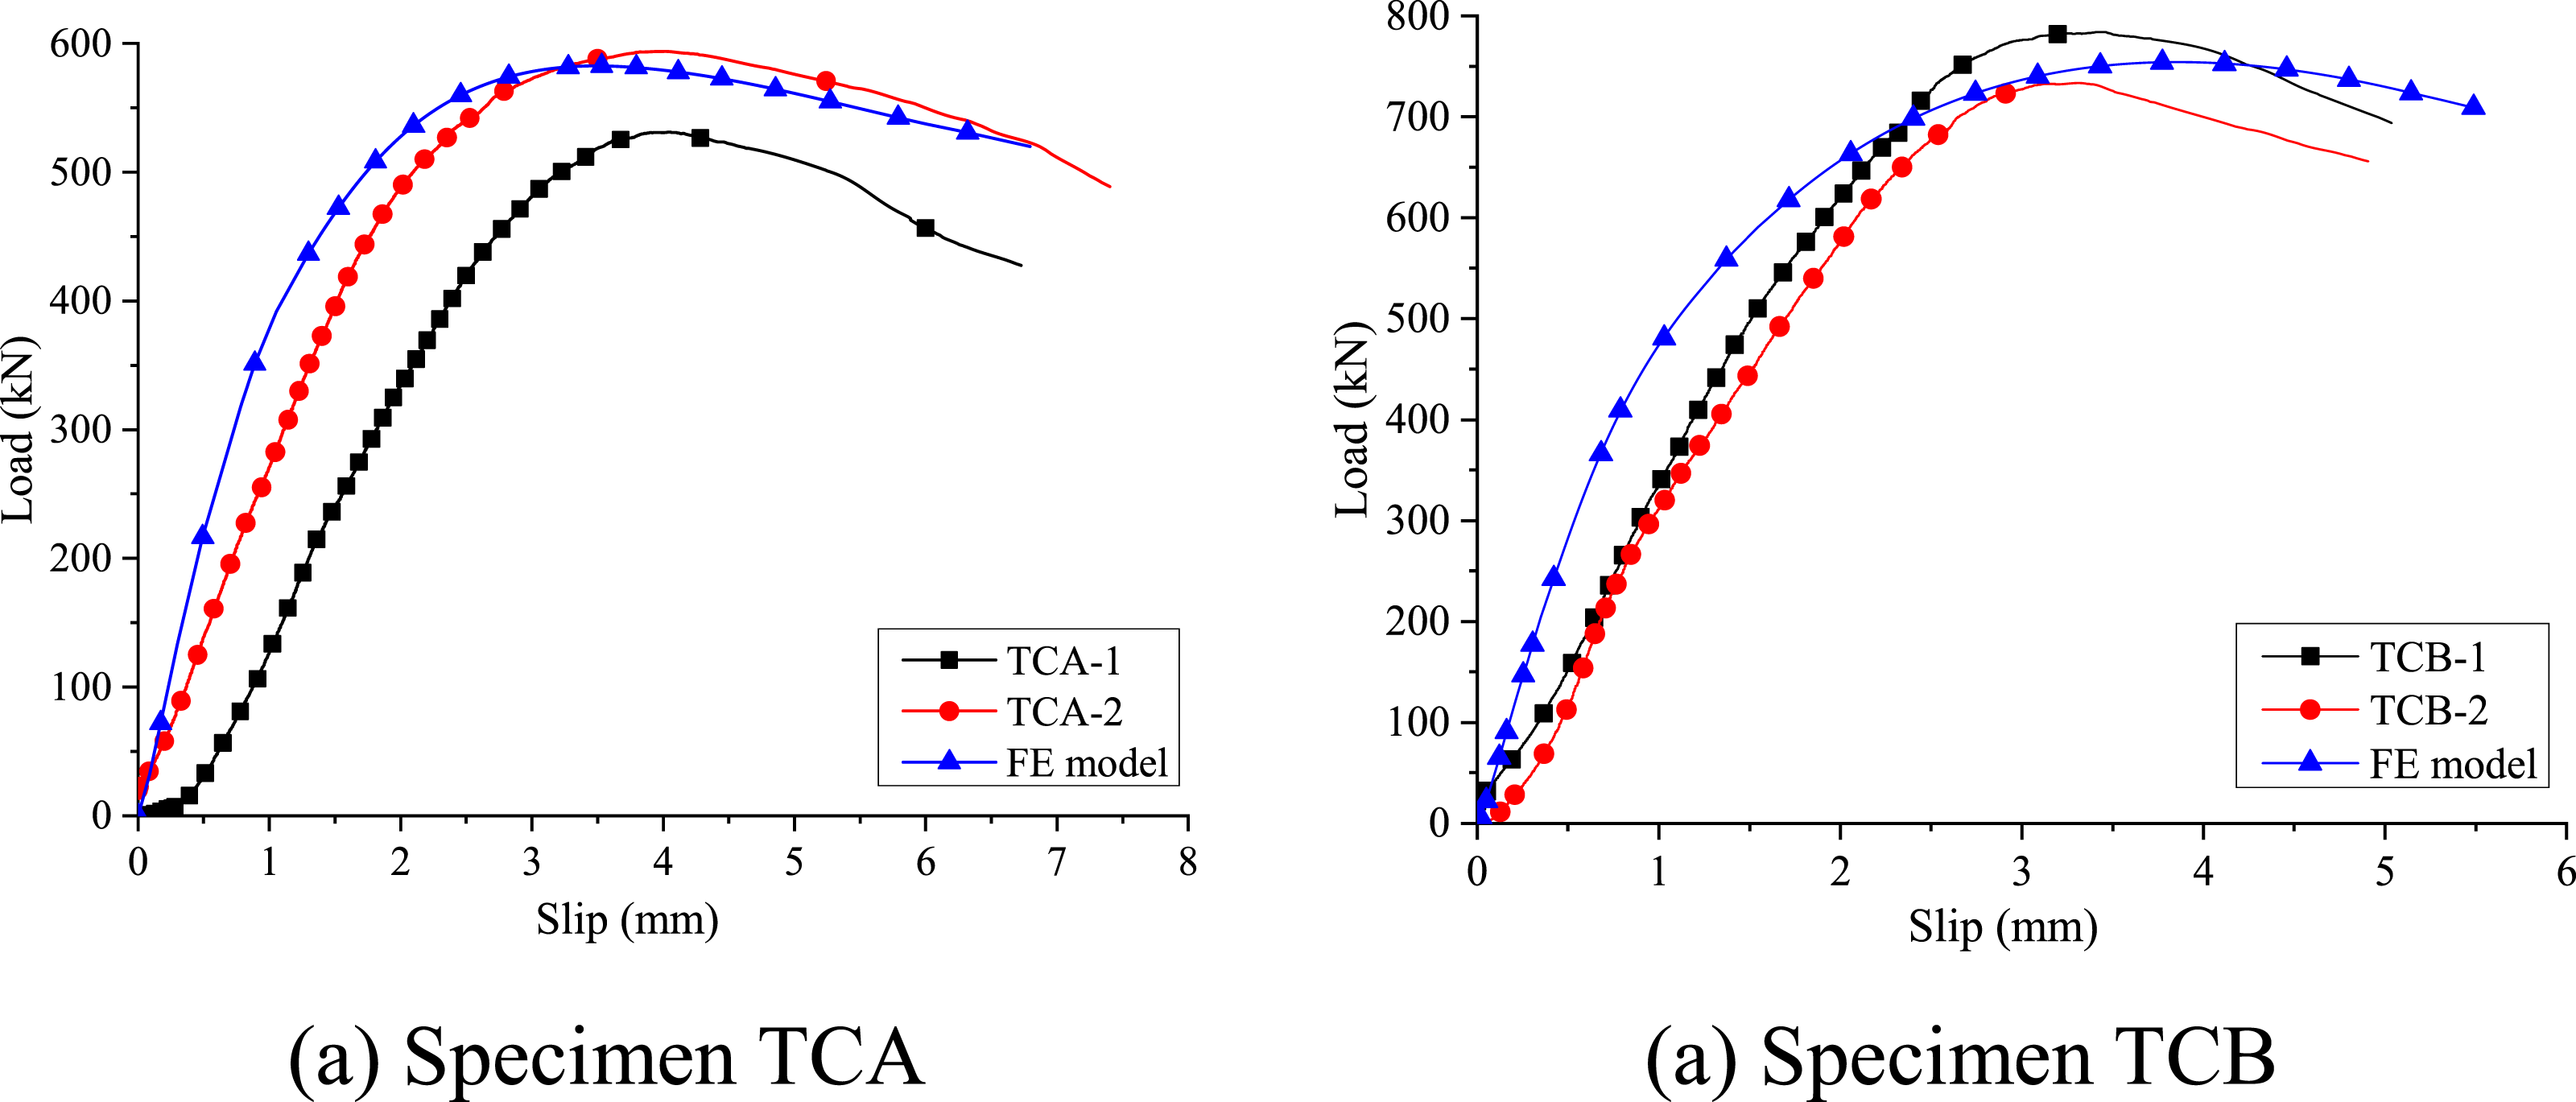
Parameter analysis of push-out test
Concrete strength
Based on the verified FE model, the parameters influencing the mechanical properties of the folded dowel shear connection were further analysed. In the push-out test, the specimens TCA and TCB were mainly dominated by concrete failure, so the influence of concrete strength on the performance of the folded dowel shear connection was explored. With the verified FE model, different grades of concrete were used, including C30, C35, C40, C45, C50, C60 and C70, and other parameters were kept unchanged. For example, C30 represents that the standard value of cubic compressive strength of concrete is 30 MPa.
The load-slip curves of model with different strength grades of concrete were obtained as shown in the Figure 10. As concrete strength increasing from C30 to C70, the bearing capacity of specimens with sparser and denser spacing dowel are greatly increased by 59% and 45%, respectively, and ultimate slip are also significantly improved. However, the elastic shear stiffness has almost no change. In order to maximize the mechanical advantages of folded dowel shear connection, concrete with higher strength grade can be adopted. Load-slip curves comparison of different concrete grades.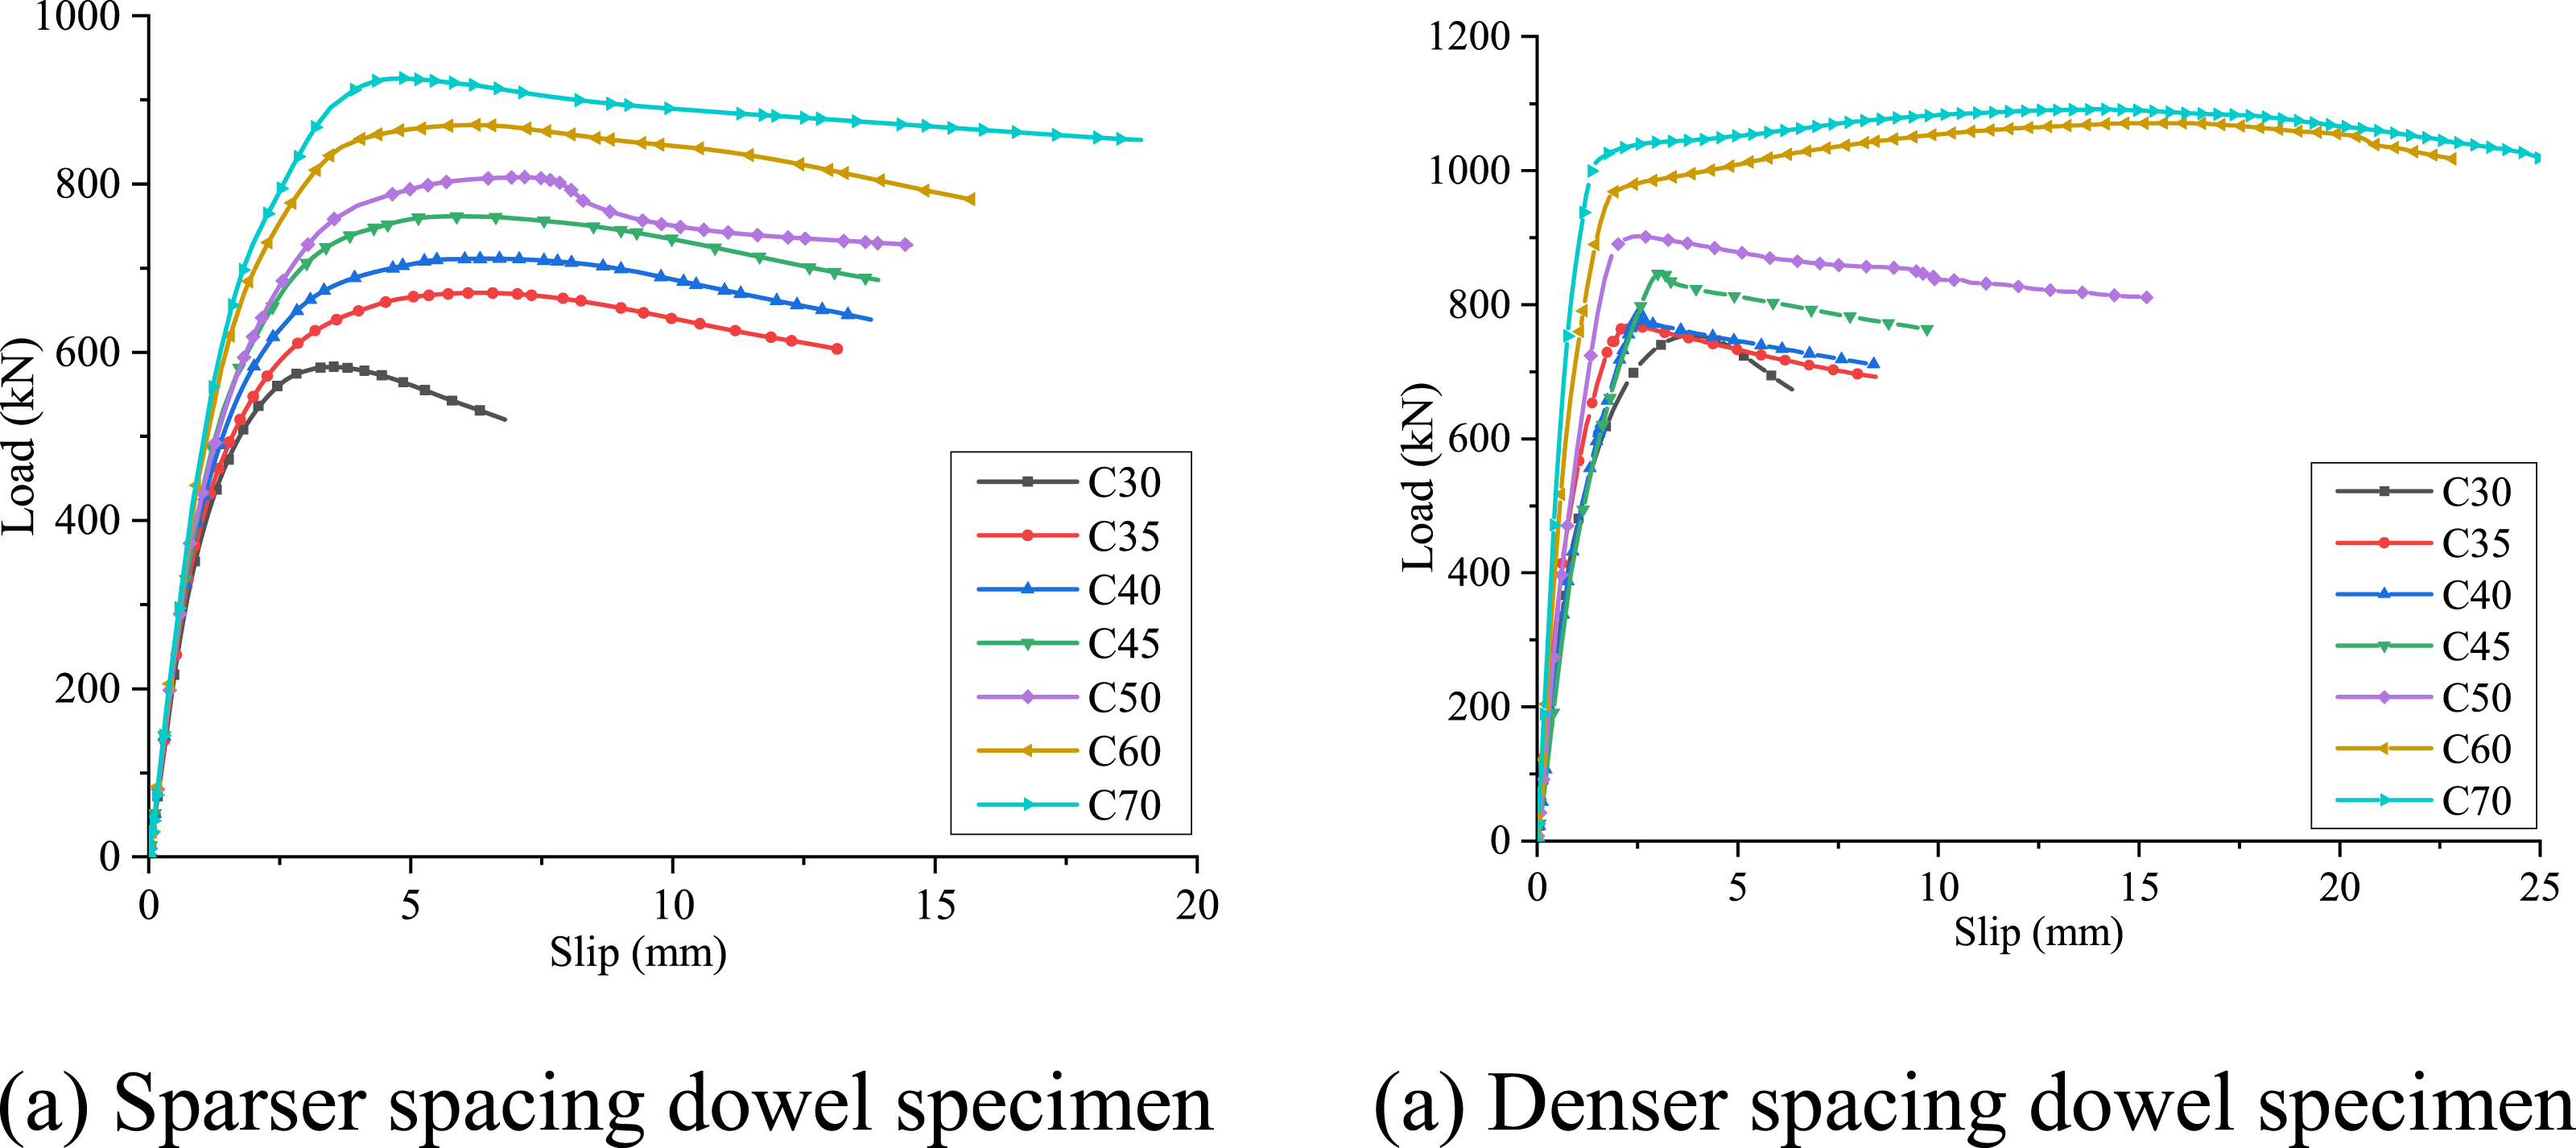
Concrete slab thickness
To explore the influence of concrete slab thickness on the mechanical properties of the folded dowel shear connection, the different thicknesses of concrete slab were used, including 90 mm, 100 mm, 120 mm, 150 mm and 180 mm, while other parameters remained unchanged.
The load-slip curves of specimens with different concrete slab thicknesses were obtained as shown in the Figure 11(a). When the thickness of the concrete slab increases from 90 mm to 180 mm, the bearing capacity and ductility of the sparser spacing dowel specimens are increased by 33.3% and 138.7%, respectively, while for the denser spacing dowel specimens, they are increased by 16% and 230%, respectively. In term of the concrete damage distribution of FE model, as shown in Figure 11(b), increasing concrete slab thickness, the damage value on the outside surface of the concrete slab gradually decreases, while the damage change on the inside surface of the concrete slab is small. Therefore, with the increase of concrete slab thickness, the concrete damage transfers from outside to the inner side of the concrete slab. Load-slip curves comparison and damage distribution.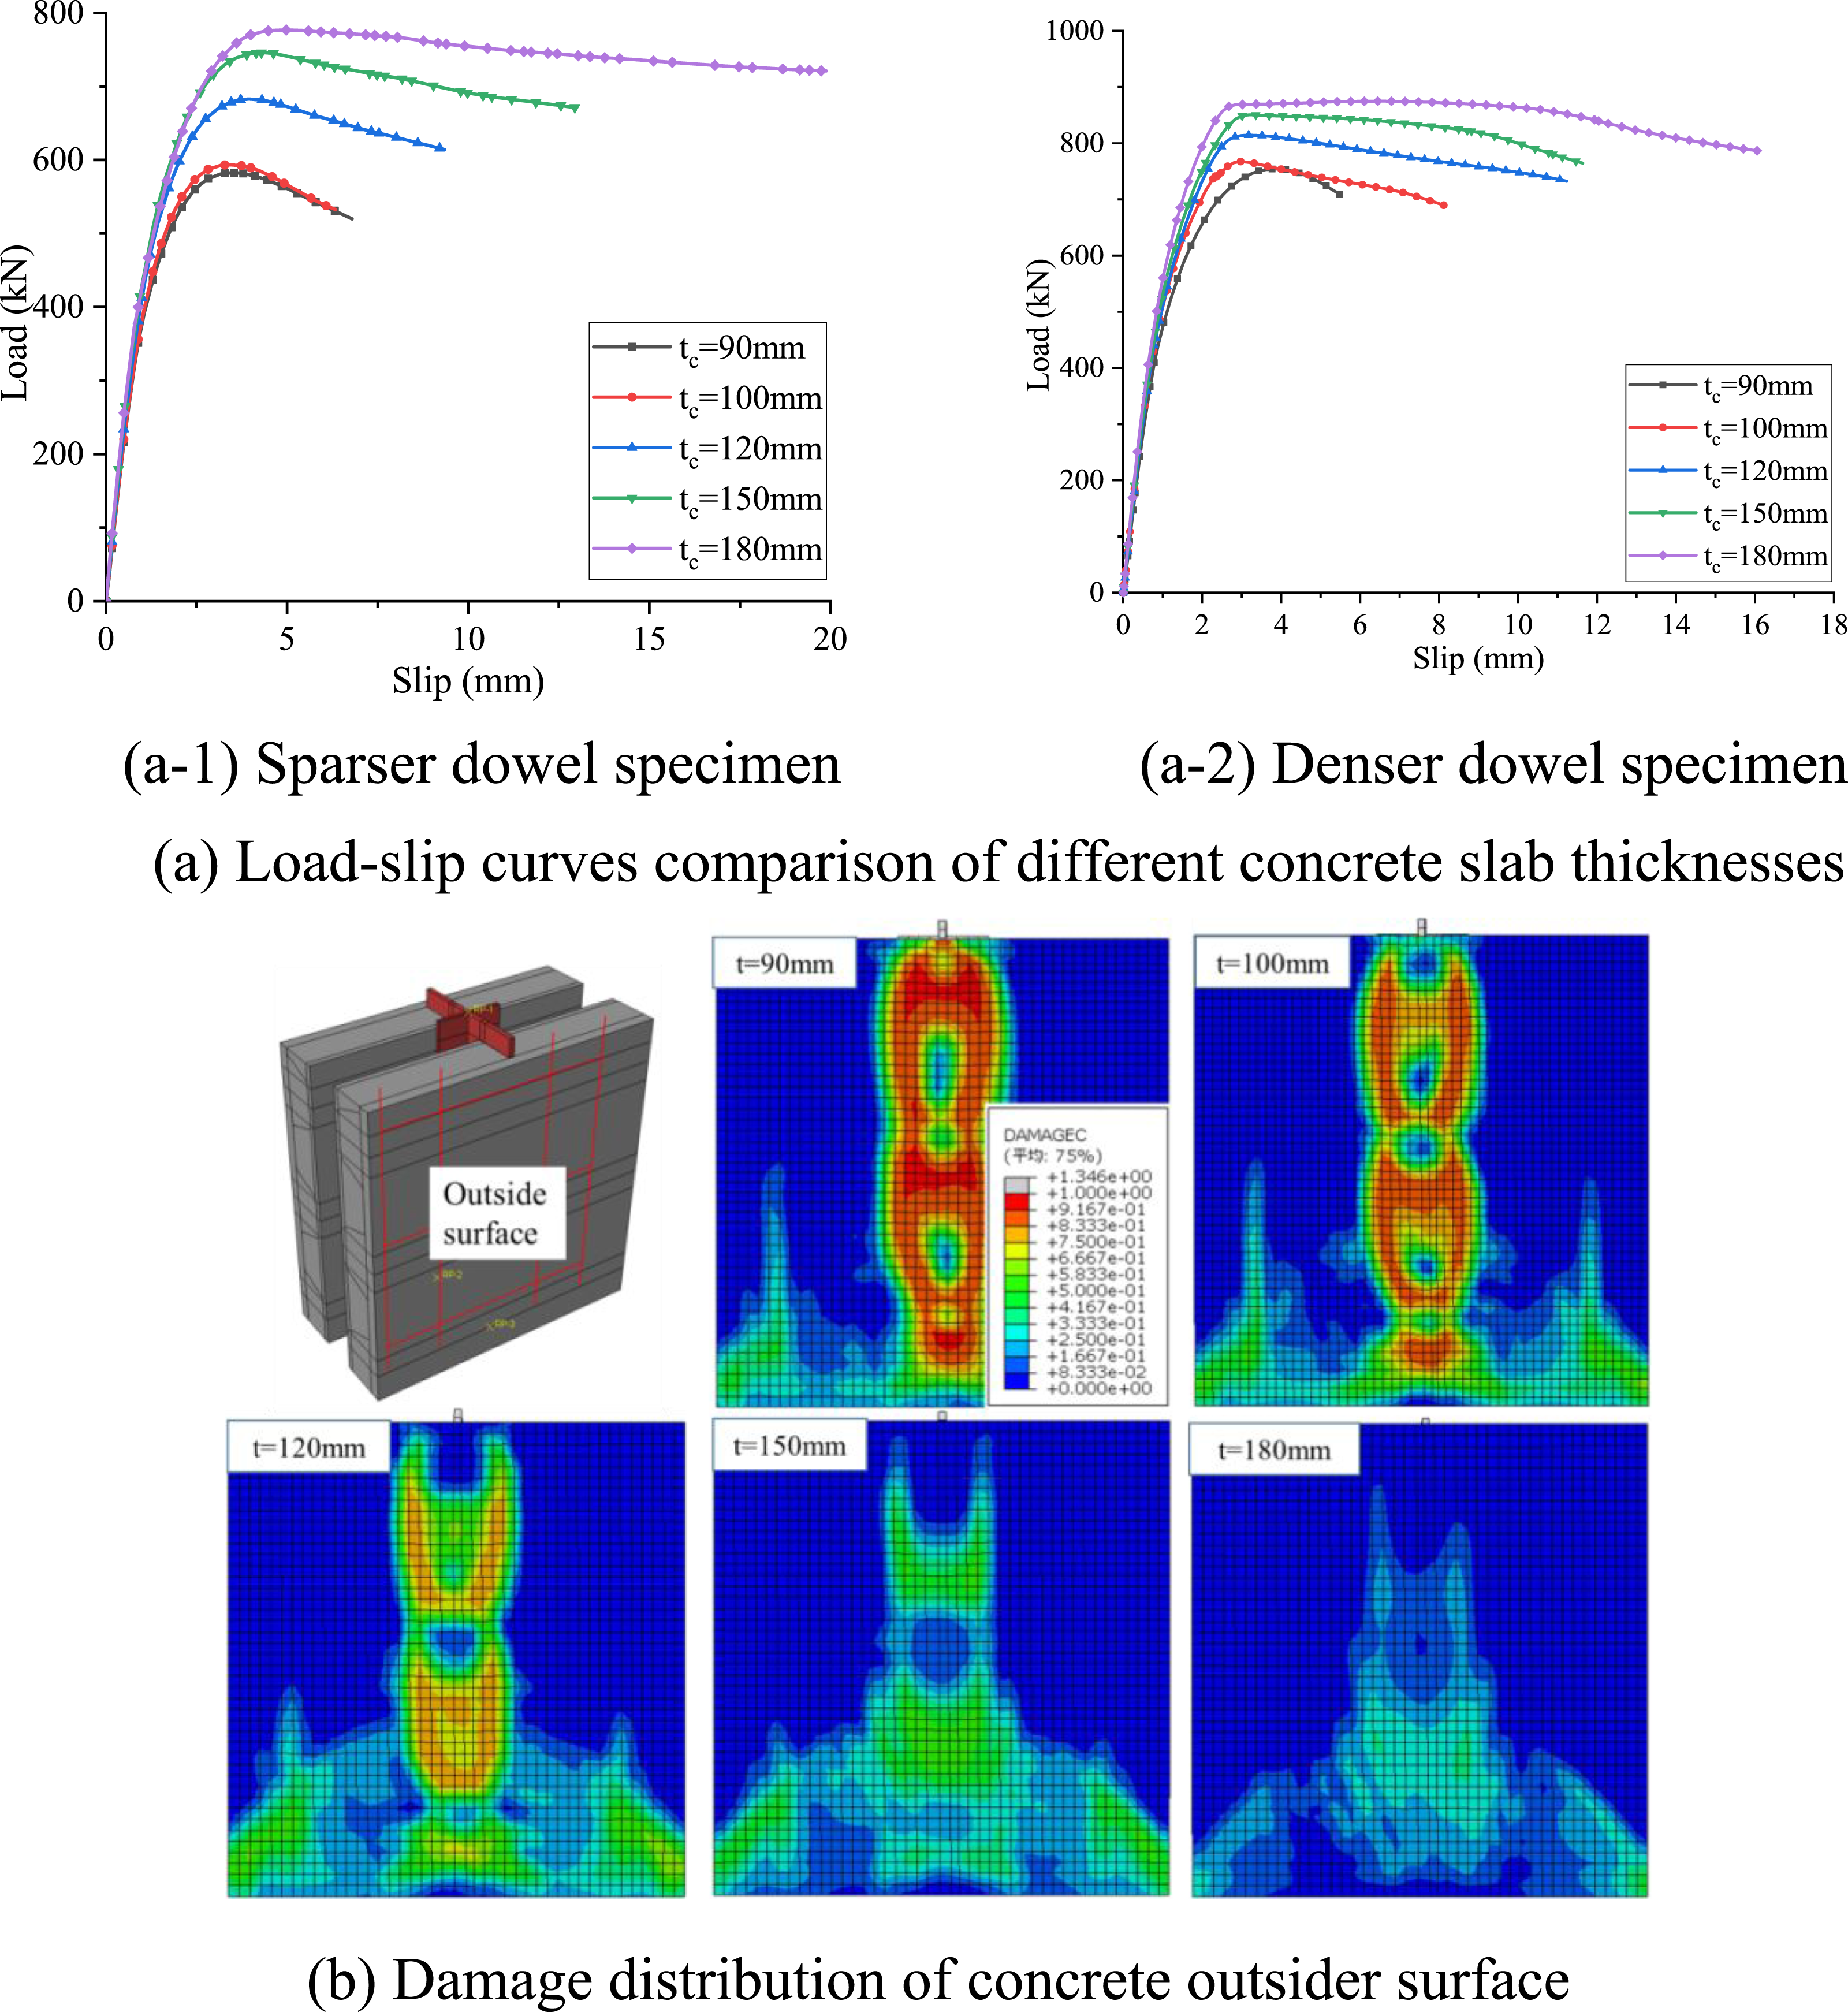
Steel dowel strength
The different yield strengths of steel were used, including 235 MPa, 345 MPa, 390 MPa, 420 MPa and 460 MPa, while other parameters remained unchanged. The load-slip curves of specimens with different yield strengths of steel were obtained as shown in the Figure 12. Load-slip curves comparison of different steel yield strengths.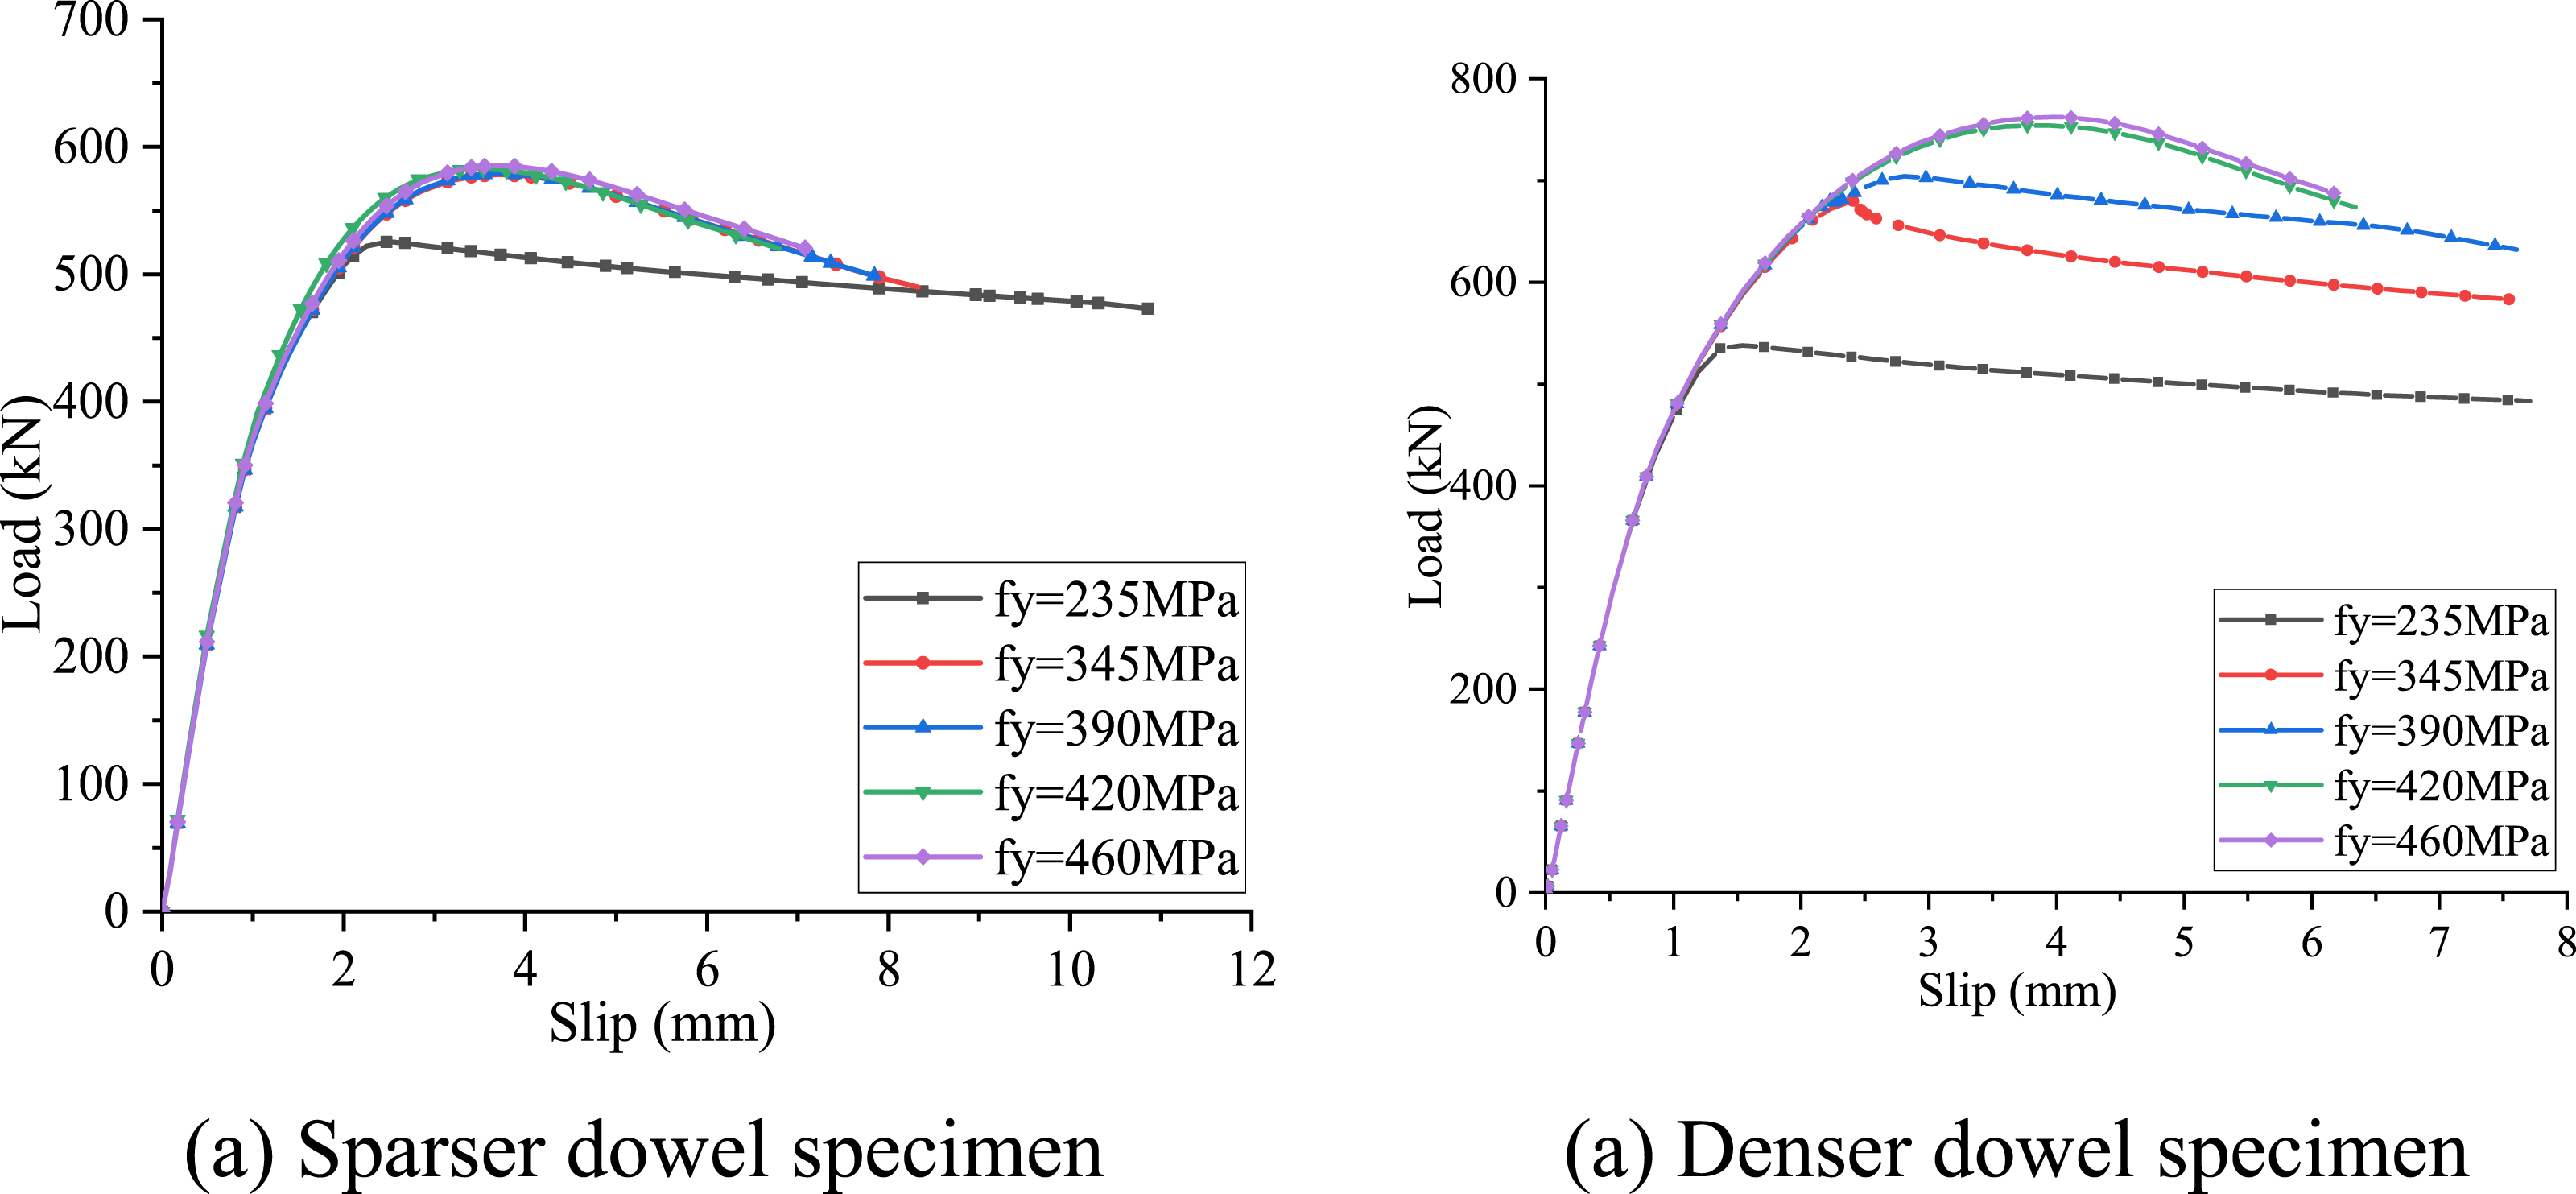
For sparser spacing dowel specimens, as the steel yield strength increases from 235 MPa to 345 MPa, the bearing capacity is significantly increased by about 10.1%. Increasing yield strength, the bearing capacity is almost no longer increased. It is illustrated that the steel yield strength of 345 MPa can ensure that the bearing capacity of the sparser spacing dowel specimen reached the maximum value while keeping other parameters unchanged, and further increase of the steel strength grade cannot improve the bearing capacity. The reason for this phenomenon is that the concrete strength may hinder the development of bearing capacity of push-out specimen, and the failure mode is controlled by concrete strength. For denser spacing dowel specimens, the steel yield strength of 420 MPa can ensure that the bearing capacity reaches the maximum value. It is also noted that the ultimate slip and ductility of specimens decrease significantly with increase of steel yield strength.
Steel dowel thickness
As the folded dowel shear connection transfers shear force through the extrusion between steel dowel and surrounding concrete, the thickness of steel dowel has an impact on the bearing capacity of the specimen. The influence of the steel dowel thickness on performance of the shear connection was investigated by changing thicknesses of the steel dowel, being 6 mm, 8 mm, 10 mm, 12 mm and 15 mm respectively, while other parameters remained unchanged. The load-slip curves under different steel web thicknesses are obtained as shown in the Figure 13. As the thickness of the steel dowel increases from 6 mm to 15 mm, the bearing capacity of the specimens with sparser spacing dowel increases by about 50%, but the growth rate gradually slows down. The specimens with denser and sparser spacing dowel appear a similar varying trend. With increase of the steel dowel thickness, the bearing capacity increases gradually, but the ductility decreases greatly. In order to prevent brittle failure, while keeping other parameters unchanged, the strength of steel dowel should be appropriately selected. Load-slip curves comparison of different steel dowel thicknesses.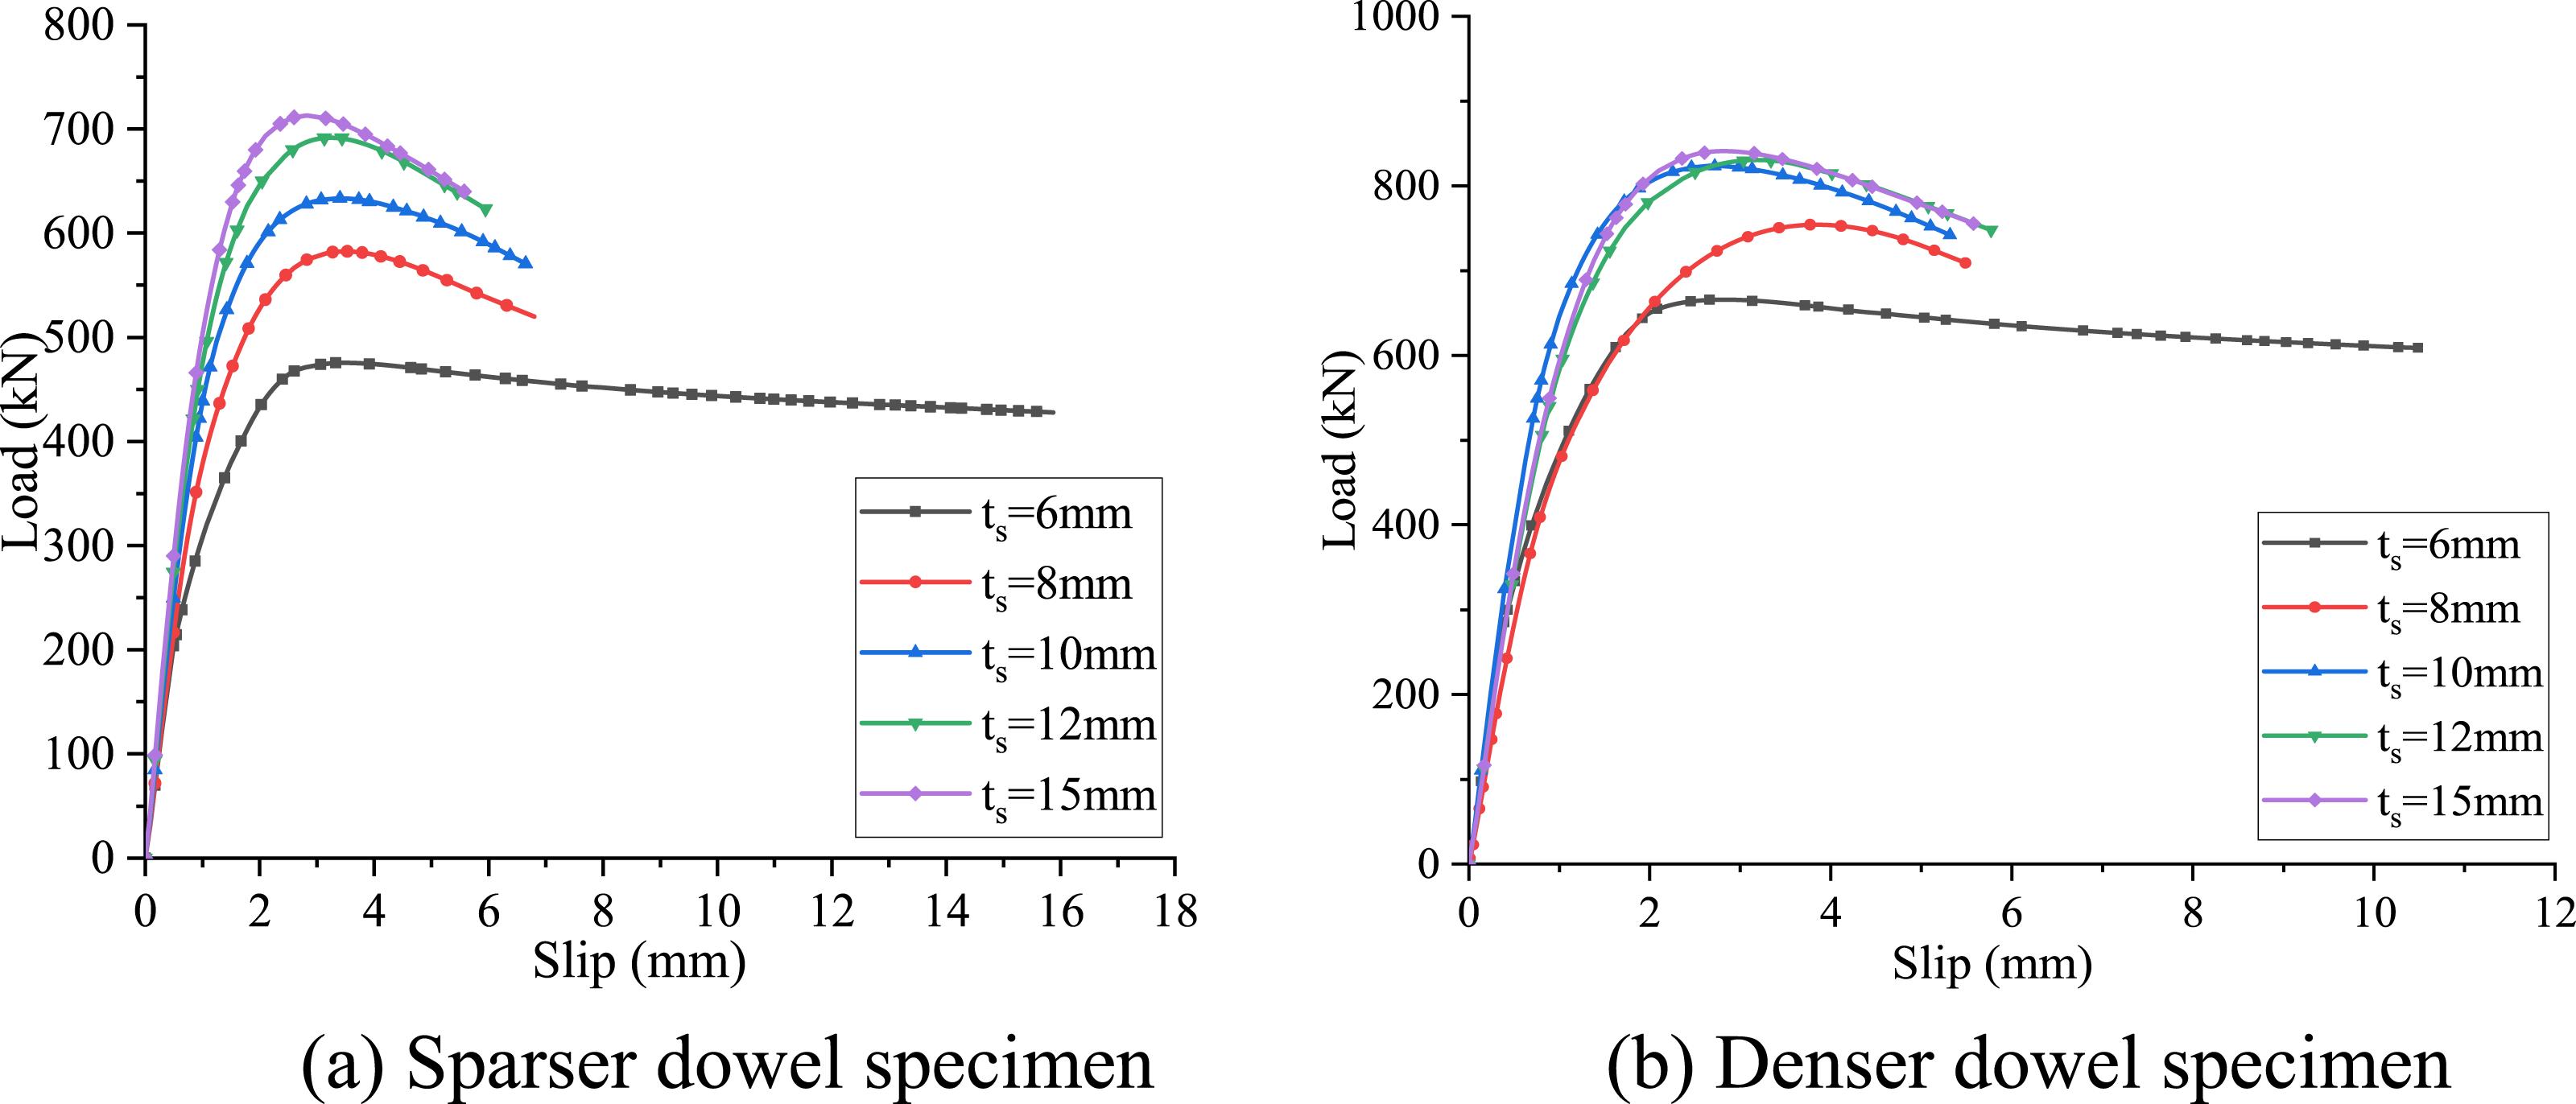
Folded angle
It appears that folding the dowel angle would help to resist the lifting force between steel and concrete. To investigate the influence of the folded angle of dowel on the bearing capacity, the different folded angle (θ) of steel dowel were used in the parametric study, including 0°, 10°, 20°, 30° and 40°, while other parameters remained unchanged. As an illustration, the bearing capacity of the composite connection was plotted against the folded angle of the steel dowel as shown in Figure 14. Increasing the folded angle, the bearing capacity of the connection almost remains unchanged for both with sparser spacing and denser spacing dowels as shown in Figure 14(a). During the push-out tests, the main failure mode of the specimens was the concrete splitting and the pry-out failure of the cone concrete. According to the literature (Seidl et al., 2013b), the bearing capacity of the composite connection would likely governed by the cover thickness concrete over the steel dowels when pry-out failure was occurring. Therefore, to avoid this likely concrete failure mode, the thickness of the concrete slab was increased to 210 mm thick, while other parameters remained unchanged, and the results were shown in Figure 14(b). It appears that increase of the denser spacing dowel specimen is greater than that of the sparser spacing dowel specimen. Increasing the folded angle, the bearing capacity increases first and then decreases, and the maximum value occurs when the folded angle is about 20°. Compared to the case when the folded angle is 0°, it appears that increasing the folded angle, projection area of the folded dowels along the longitudinal direction also increases, which enhance push-out force at the steel-concrete interface, thus would improve the bearing capacity. It is agreed that folding angle might help to prevent uplift at the steel-concrete interface, accordingly. However, when the folded angle continues increasing, likely reducing the integrity between adjacent dowels and the effective shear area occurs, thereby reducing the bearing capacity. Bearing capacity comparison of different folded angles.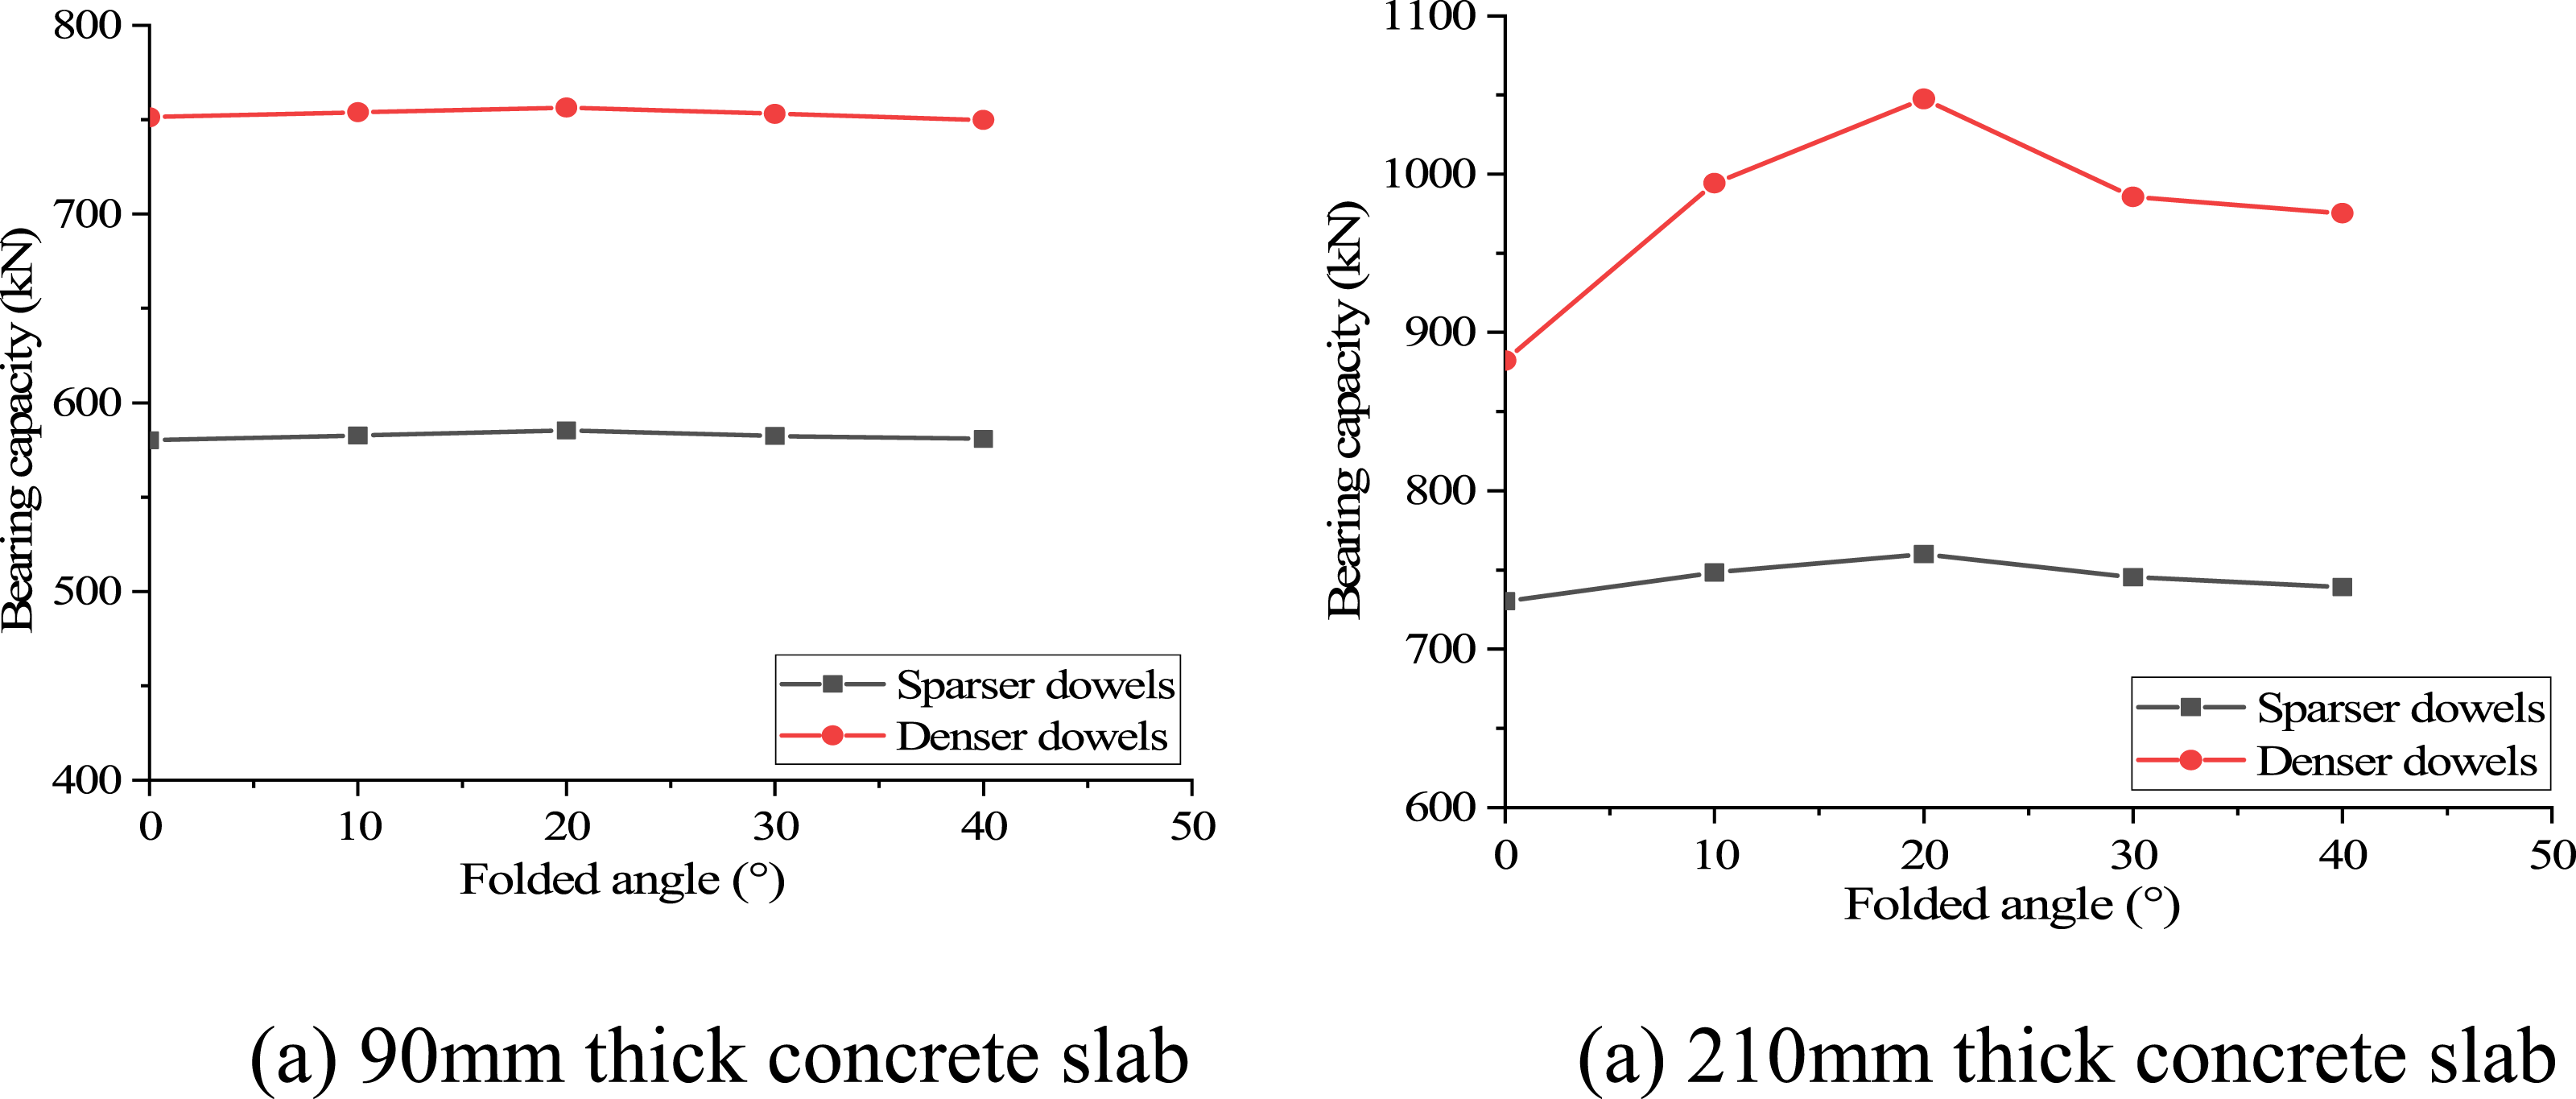
Analysis of bearing capacity calculation
Shear bearing capacity of composite dowel connector
To enable effective shear connection between the concrete slab and the steel section, in principle, the shear force transfer mechanism of the proposed folded composite dowel is similar to the that of the perfobond strip connector like CL and PZ shape connectors. The ultimate strength of the composite dowel connector is governed either by the steel dowel failure or by concrete failures such as concrete shear failure and concrete pry-out failure. For each failure pattern, the ultimate strength capacity is analyzed and derived in the following sections.
Steel failure
Compared with the headed stud, composite dowel shear connection possesses better shear bearing capacity and superior deformation capacity. For ease of the subsequent illustration, the notations of composite dowels are used and shown in the Figure 15 (Markus et al., 2014). Notations of composite dowels.
When thickness of the steel dowels is thinner or the strength is lower, it usually leads to shear failure of the steel dowels. The failure mode is generally controlled by the combination of bending moment and shear force. At present, the shear failure mechanism of steel dowels is based on the Mises stress of the critical section, and the design formula can be shown in formula (1) by using the specific geometrical parameters for the CL and PZ shape (Markus et al., 2014).
The formula (1) for CL and PZ shape dowel connectors is not applicable to the folded dowel shear connectors adopted in the paper. However, the influence parameters of formula (1) can be analysed in the calculation formula of shear bearing capacity caused by steel failure. Based on the above considerations, the following formula (2) is proposed in the paper:
According to the parameter analysis of FE model and current available push-out test results of steel dowels, 58 groups of test data (Feldmann et al., 2013; Heinemeyer, 2011; Ikäheimonen et al., 2013; Lechner et al., 2016; Lorenc et al., 2014a) with steel dowels failure were selected for the formula fitting to obtain the modified calculation formula, as shown in formula (3).
To verify accuracy of the modified formula, formulas (1) and (3) were adopted to calculate the shear bearing capacity, respectively, and compared with the actual capacity obtained from the push-out tests, as shown in Figure 16. The average error and standard deviation were decreased by 25.2% and 17.3%, respectively, and the coefficient of variation was greatly reduced by 43.2%, which indicates that the calculation results of formula (3) proposed in this paper are closer to the actual values obtained from the test.
Concrete shear failure
When thickness of steel dowels is larger or the strength is higher, and the concrete area wrapped between two steel dowels is smaller, concrete shear failure would be usually more likely to occur. According to the stress mechanism, the shear bearing capacity mainly depends on the concrete shear area, concrete shear strength and transverse reinforcement within the opening (Markus et al., 2014), as shown in formula (4).
For the common puzzle (PZ) and clothoid (CL) strip, the values are usually taken as follows.
The limitation of formula (4) is the shape coefficient and the shear area of concrete. The shape coefficient in formula (4) only involves two common dowel profiles (PZ and CL strip), which is not applicable to other dowel profiles. When shear failure of concrete occurs, the shear area of concrete is an important parameter. For the traditional perforated plate, the shear area is the area of circular hole. However, due to the open folded dowel adopted in this paper, the specific shear area range is difficult to be determined, but it is closely related to the distance and height of steel dowel. In addition, for the folded dowel shear connector, the improvement of the shear area caused by the angle θ (as shown in Figure 2(a) and (b)) of the folded dowel should be considered. The shear area of concrete is shown in Figure 17(a). The shear area of concrete after steel dowel bending is 1/cosθ times of that without bending, that is, the shear failure of concrete might have a great correlation with the sine or cosine value of dowel bending angle. Concrete shear area and shear bearing capacity comparison.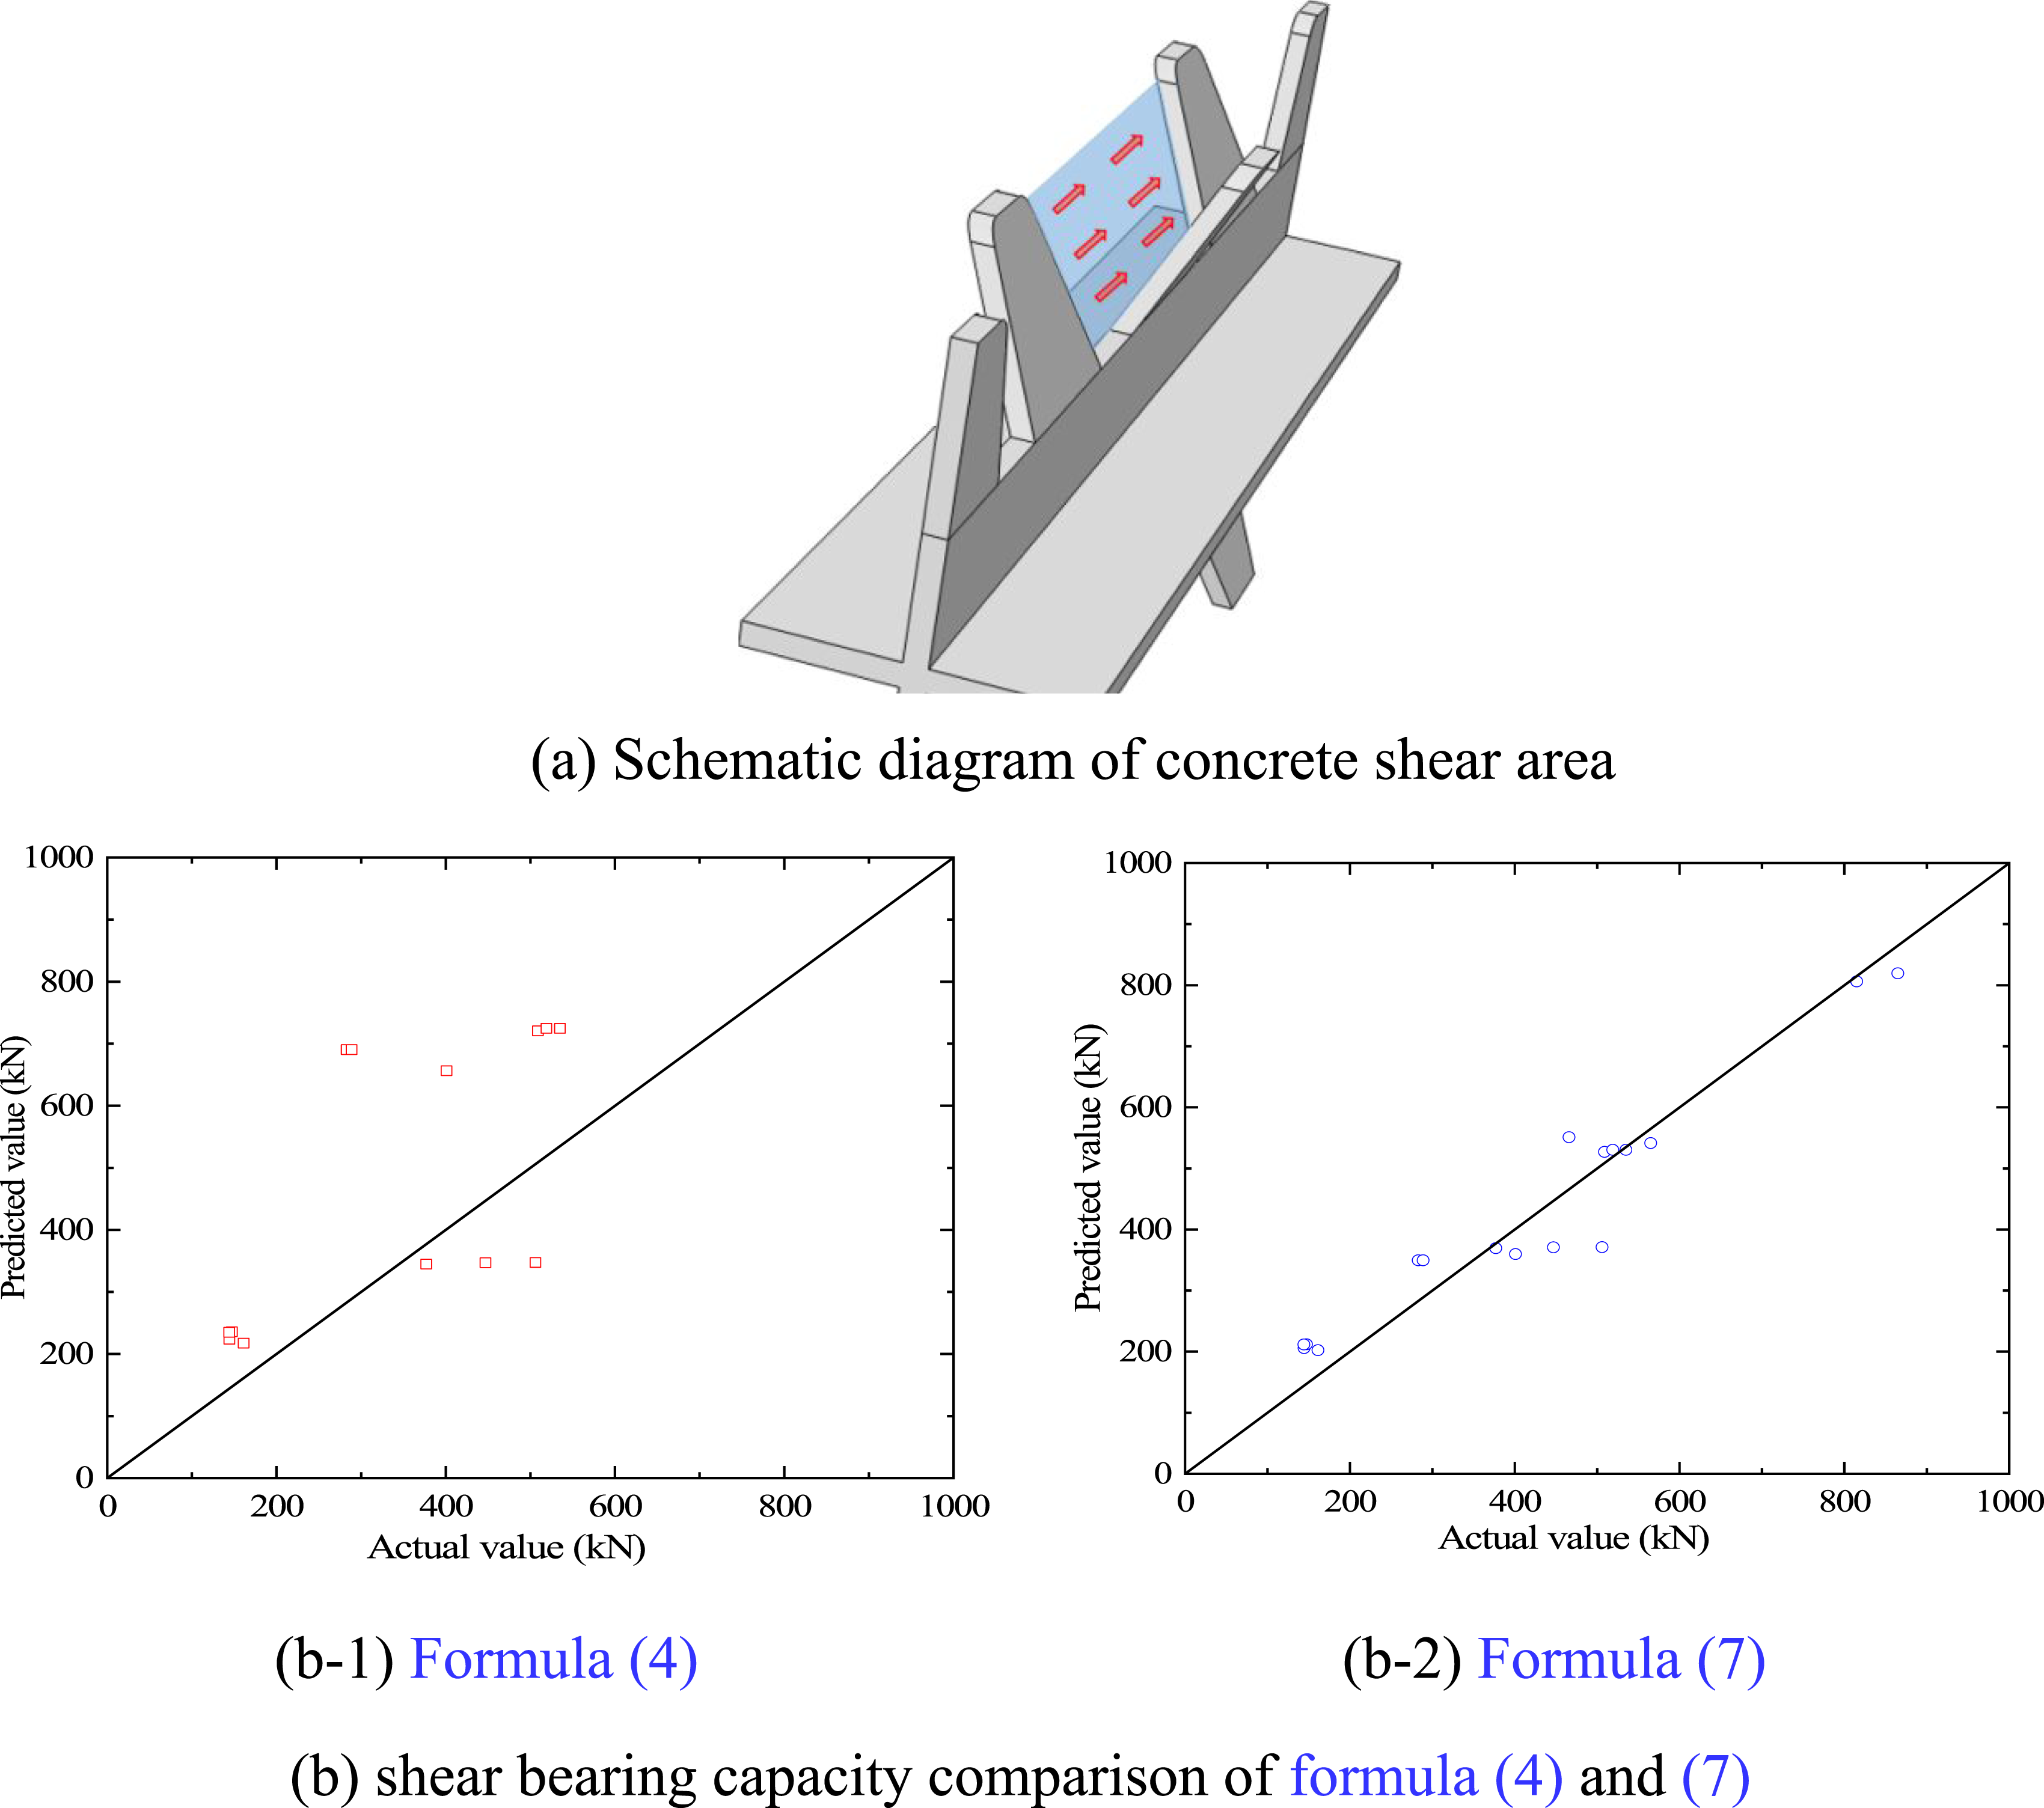
Based on the above contents, the calculation formula of shear bearing capacity governed by concrete shear failure is proposed, as shown in formula (6).
According to the parameter analysis of FE model and current research results, the experimental data (Ikäheimonen et al., 2013; Lechner et al., 2016; SEIDL, 2009) with concrete shear failure were selected for formula fitting to determine the undetermined parameters. The shear bearing capacity formula caused by concrete shear failure was obtained, as shown in the following formula (7).
The calculated values of shear bearing capacity calculated by formulas (4) and (7) were compared with the actual value obtained from the previous experimental results of cited references, as shown in the Figure 17(b). The average error and standard deviation were decreased by 51.42% and 62.3%, respectively, and the coefficient of variation was reduced by 44.6%, which indicates that the calculation results of formula (7) proposed in this paper are in good agreement with the test results.
Concrete pry-out
When the cover layer of concrete was smaller, the concrete pry-out failure might occur. Under the action of load, the concrete slab generates transverse tension forces, for the thin cover layer, which results in a cone-shape pry out failure. Different scholars have put forward different calculation formulas for the failure mode. But the common point was that they focus on the tensile strength of concrete and the pry-out cone area, which is mainly determined by the cone height hpo, as shown in Figure 18(a). The commonly used calculation formula was shown in formula (8) (Markus et al., 2014). Failure mode pry-out and shear capacity comparison.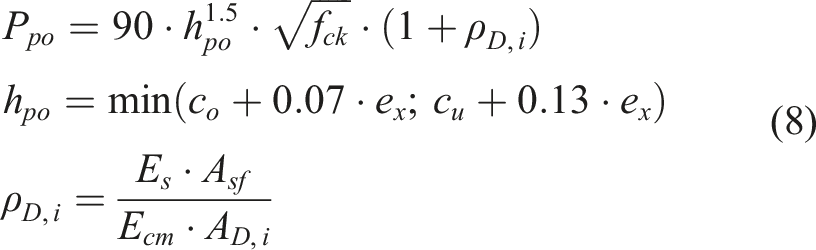
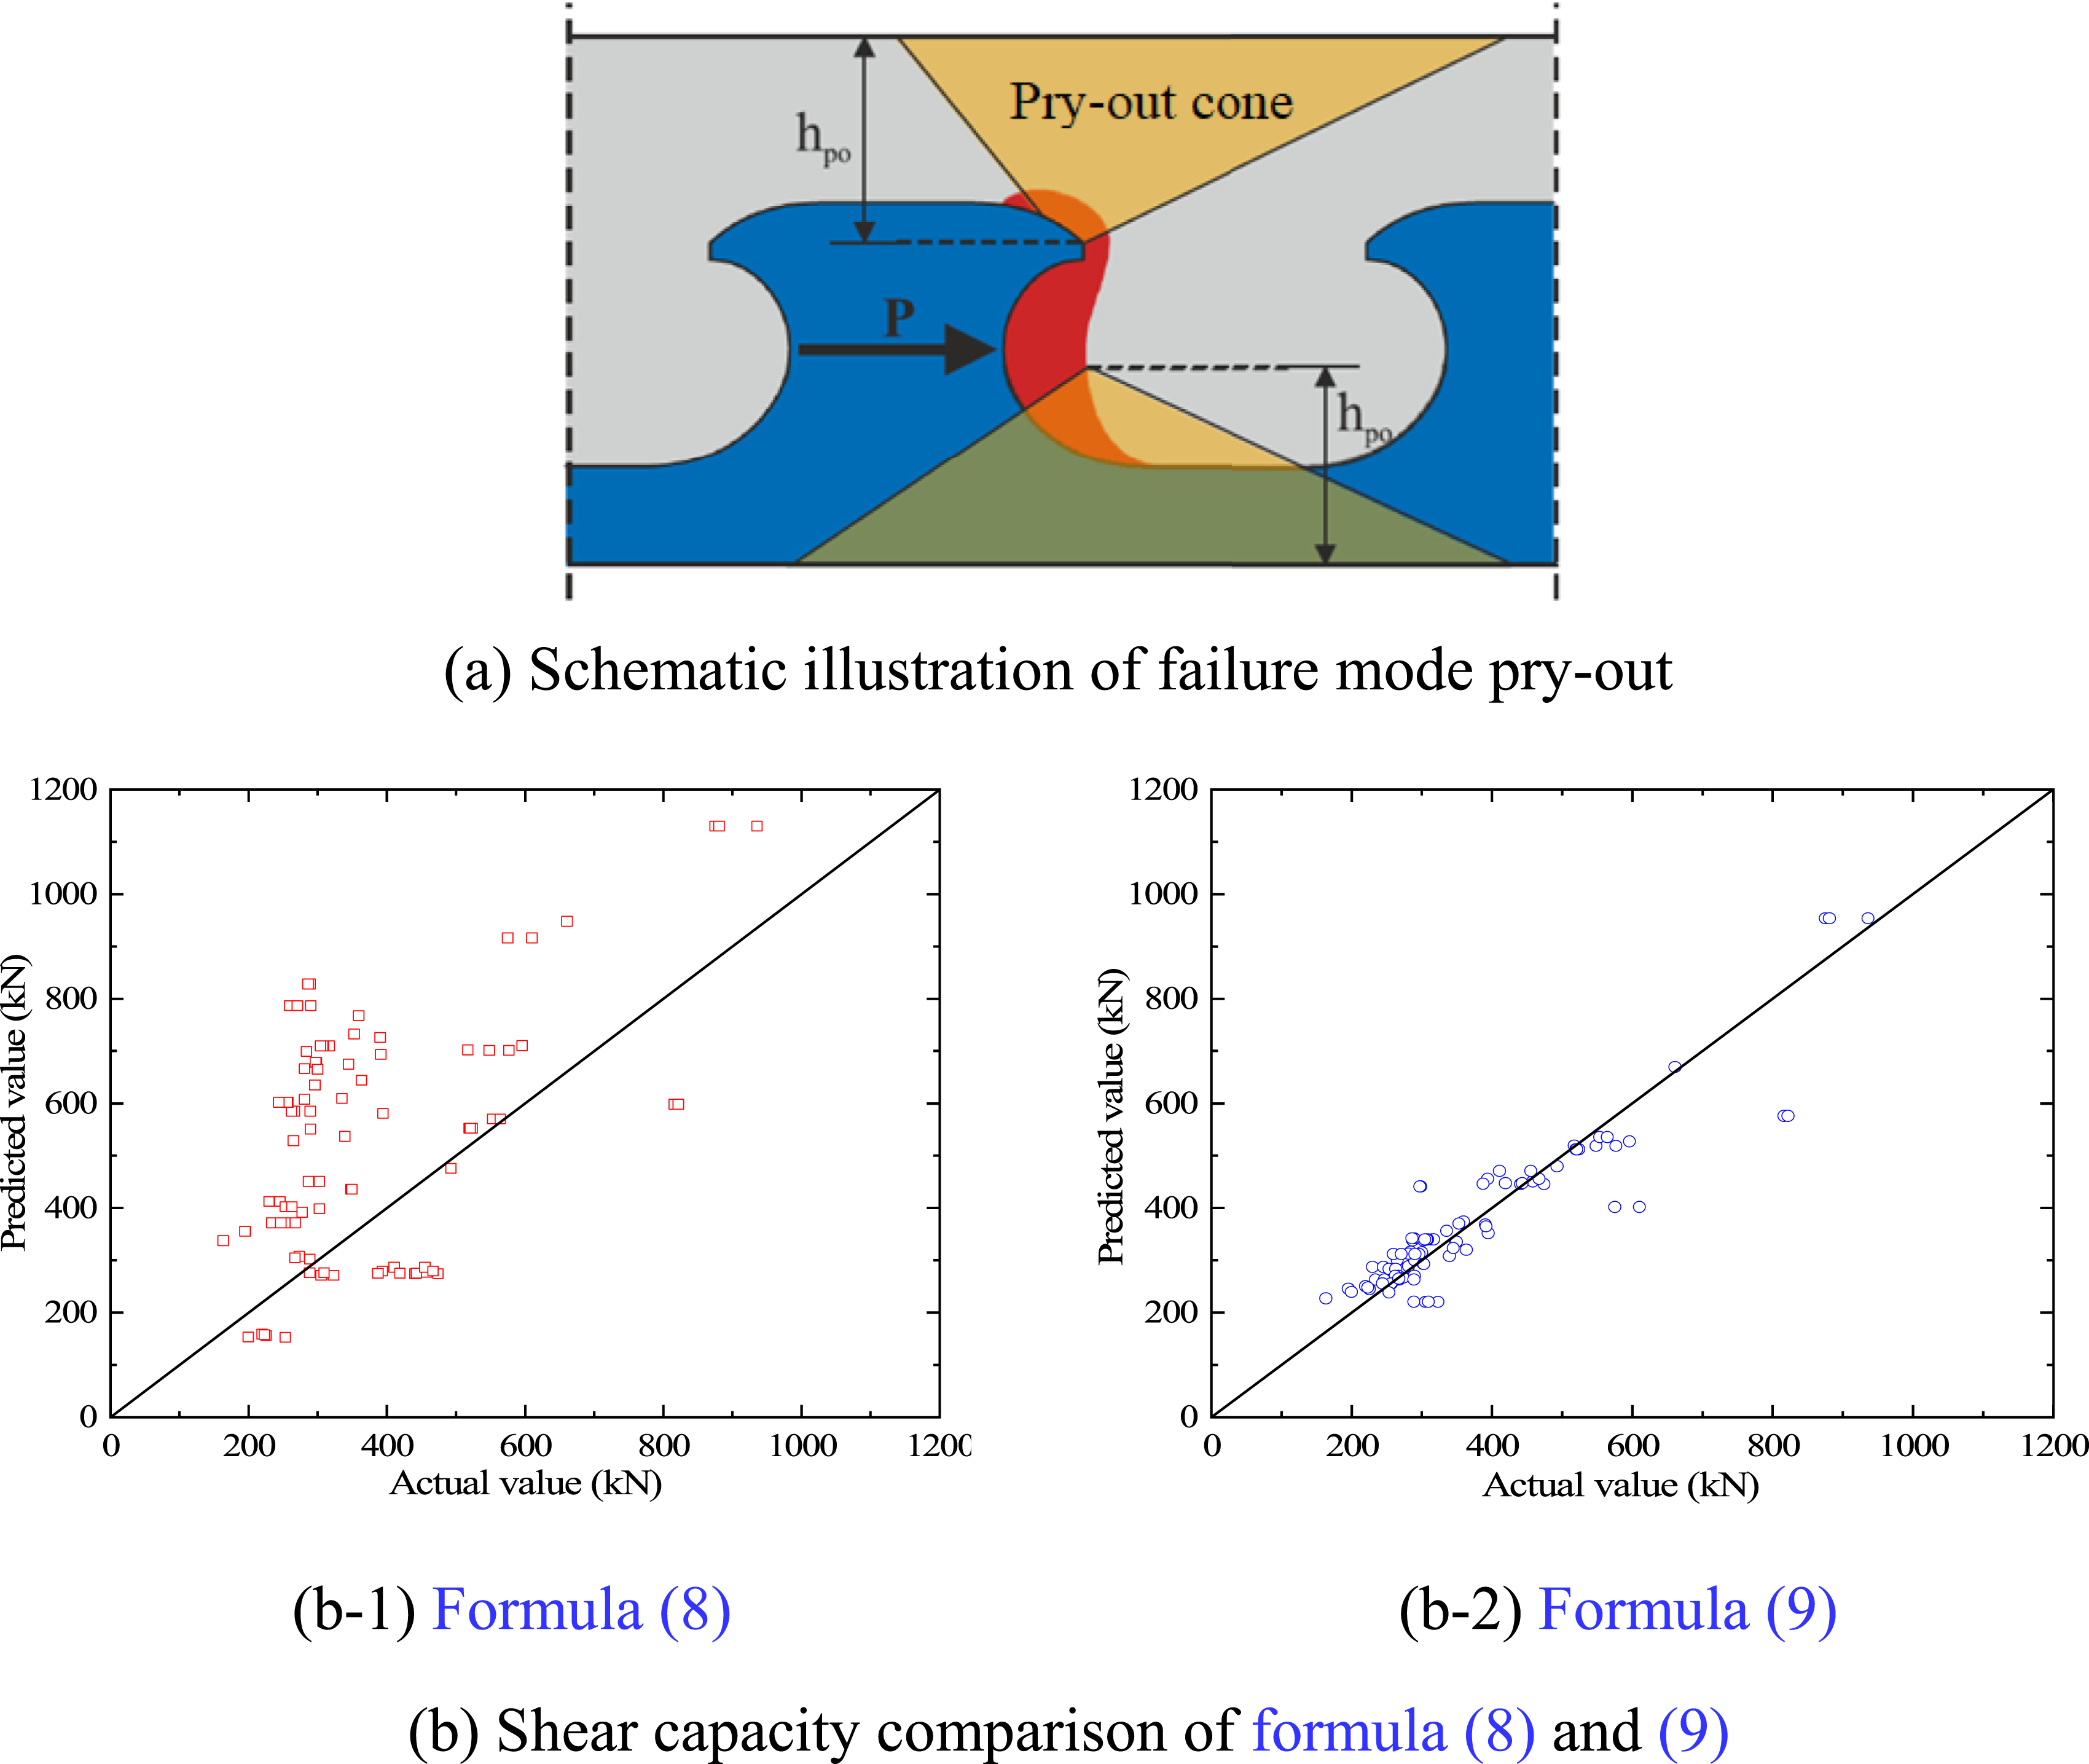
The ρ
D,i
in the formula (8) was the reinforcement ratio within the effective concrete area. In addition to the reinforcement between the two dowels, the reinforcement within the whole pry-out area was also taken into account. In fact, its shear bearing capacity was overestimated, and the reinforcement effect within the pry-out area might need to be reduced appropriately. Based on the above considerations, according to the parameter analysis of FE model and current experimental results, the test data (Heinemeyer, 2011; Ikäheimonen et al., 2013; Lechner et al., 2016; Lorenc et al., 2014a; SEIDL, 2009) were selected for formula fitting. Finally, the formula (9) was proposed as the calculation formula of shear bearing capacity caused by concrete pry-out failure.
Summary of shear capacity calculation formula
According to the shear bearing capacity analysis of the above three different failure modes, calculation formula of the shear bearing capacity of the folded steel dowel shear connection was put forward, as shown in the following formula (10).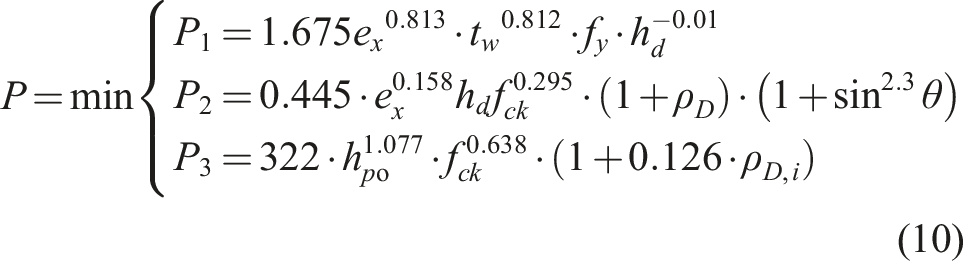
To verify the validity of the formula, experimental results obtained by push-out tests in this paper were compared with the calculated results using formula (10). The calculation results were shown that the failure modes of specimens TCA and TCB are concrete pry-out failure, which are consistent with the test results. The average shear bearing capacity values of specimens TCA and TCB were 113 kN and 95 kN, respectively. The shear bearing capacity values calculated by formula (10) were 115.2 kN and 87.2 kN, respectively. The total error was 5%, which shows that the calculated values are in good agreement with the test values. Due to the limited test data in this paper, the effectiveness of the formula can be further verified by more test data.
Flexural bearing capacity calculation
Transformed section method
The transformed section method is based on elastic theory. It is assumed that both concrete and steel are elastic materials, and the relative slip is ignored. Introducing the elastic modulus ratio of steel to concrete, the sections of two materials are transformed to the sections of one material.
Assuming that the thickness of the concrete slab remains unchanged, width of the concrete slab is reduced according to the elastic modulus ratio of steel to concrete.
Based on the likely yield condition, it can get: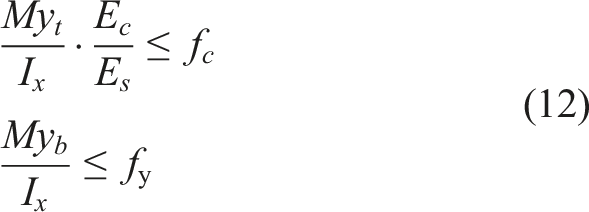
For specimens L1 and L2, the yield moment of the cross section was governed when yielding initiated in the steel bottom flange and My = 190.3 kNm.
The corresponding yield load is derived as:
Plasticity section method
The plastic section method needs to take into account the improvement of bearing capacity brought by the plastic development of steel and concrete, that is, the whole section develops the full yielding.
For specimens L1 and L2, position of the plastic neutral axis (PNA) can be derived as:
Accordingly, putting the relevant parameters of the cross section into equation (13), the position of the PNA (xp) was determined as 82.6 mm, where the concrete is in a compressive state above the PNA and in a tensile state under the PNA. Under the full plastic stress distribution, the plastic bending moment of the composite section was calculated as 233.3 kN˙m and the corresponding ultimate load was 373.3 kN.
Comparison of calculated values and test values.
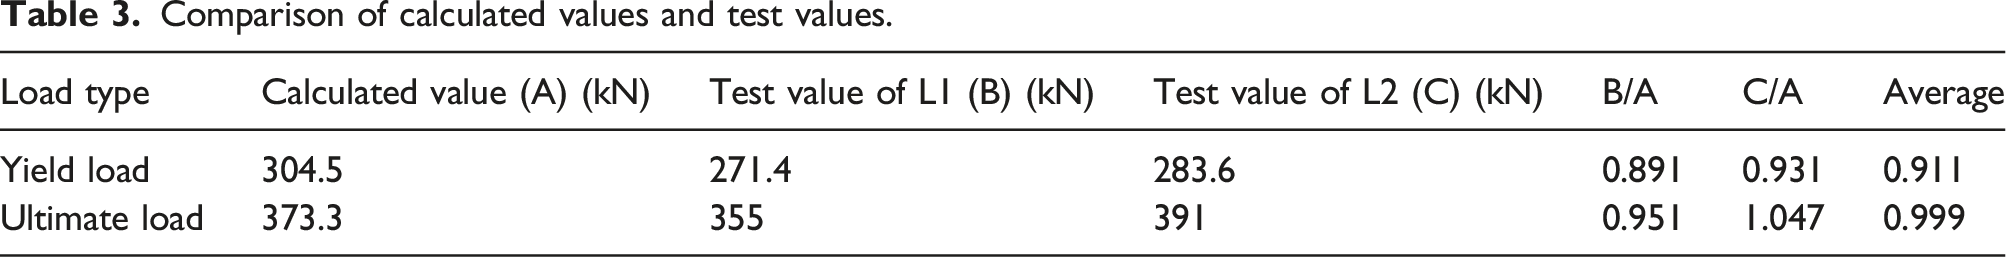
Table 3 shows comparison of the yield load and ultimate load of the two specimen beams. Both beams developed full plastic composite action, however specimen L2 which possessed narrow dowel tooth but denser distributing folded dowel connectors had better shear connection behavior, while specimen L1 with wider dowel tooth but less denser distributing connectors had a slight lower load bearing capacity.
In evaluating the yield and plastic bending moments of the cross section, it was assumed that the steel and concrete are completely connected without relative slip. On average, the calculated yield load was about 8.9% higher than the test value, and the calculated ultimate load was about 0.1% higher than the test value. It was noticed that during test, when the load increases up between 0.45Puf and 0.75Puf, both longitudinal and transverse cracks initiate in the concrete slab, while the slips between the concrete and steel section also occur. The cracks and interface slips would induce a less stiffer concrete slab hence a smaller flexural stiffness of the composite section, and therefore a smaller yield bending moment as compared with the calculated yield moment. In general, the calculated values were in good agreement with the test values.
To enable a full plastic design of composite beam with the folded dowel shear connector, the shear connectors must possess sufficient deformation and shear redistribution capabilities. Accordingly, for both specimen L1 and L2, at the ultimate state, the plastic neutral axis of the cross section lies in the concrete slab, hence the ultimate longitudinal shear force being capable of a full plasticity development over the cross section along the half span of the beam is equal to Asfy (where As and fy are the steel section area and yield strength of steel respectively). The number of folded dowel shear connectors required for a full composite beam along the half span can be determined by:
The calculated number (Nf) of sparser dowels and denser dowels (specimens L1 and L2) was 10 and 13, being required for a full composite beam, respectively, while the available dowel number (N) of specimens L1 and L2 was 10 and 17 in the half span, respectively. The shear connection degree (N/Nf) of flexural specimens was 1.0 and 1.3, respectively. The ratios of test values to calculated values of ultimate load of specimens L1 and L2 were 0.951 and 1.047, respectively. For the specimen L1, the relative slip caused by shear connection deformation also leaded to that the shear connection between the steel and concrete interface fails to work effectively (GB50917-2013, 2013), resulting in the calculated value being greater than the test value. For the specimen L2, the sufficient shear connection can take advantage of the post yield strength of the steel plate, resulting in the test value being greater than the calculated value. In general, it is suggested that the shear connection degree should be greater than 1 to enable a full composite beam.
Conclusions
Four full-scale push out specimens and two composite beam specimens were designed and manufactured. The mechanism and structural performance of folded dowel shear connection were experimentally investigated by the push-out tests and flexural tests. The conclusions were drawn: (1) The pry-out failure of concrete slab was observed for the all labelled specimens of push-out tests. The bearing capacity and shear stiffness of specimen TCB (denser spacing dowels) was higher than that of specimen TCA (sparser spacing dowels). (2) Under the action of ultimate load, the folded dowels developed yielding, and full plasticity was developed over the composite beam section featured with flexural failure mode. The composite beam with denser spacing dowels had higher ultimate flexural capacity and lower ductility than the composite beam with sparser spacing dowels. (3) The FE model of the composite folded dowel shear connection was validated against test results. The influence of strength and thickness of concrete slab, strength, thickness and folded angle of steel dowel on the mechanical properties of folded dowel shear connection were analysed. The increase of concrete strength and thickness could significantly improve the bearing capacity and ultimate slip. The ultimate slip and ductility of specimens decreased significantly with the increase of steel yield strength. In order to prevent brittle failure, the steel dowel thickness should be selected with caution. The folded angle could be determined as 20° because of the larger actual effective shear area and bearing capacity. (4) According to the shear bearing capacity analysis of the three different failure modes (steel failure, concrete shear failure, concrete pry-out), calculation formula of the shear bearing capacity of the folded steel dowel shear connection was put forward and verified by the current research results. The calculated results of proposed formula were more consistent with the experimental results of the paper. (5) The calculated values obtained from transformed section method and plasticity section method were in good agreement with the test values. The sufficient shear connection can take advantage of the post yield strength of the steel plate. It is suggested that the shear connection degree should be greater than 1 to enable a full composite beam.
Nomenclature
area of lower reinforcement
sectional area of concrete slab
concrete dowel area
effective concrete area
sectional area of steel beam under concrete slab
effective reinforcement area
area of upper reinforcement
actual width of the concrete slab
converted section width of the concrete slab
upper concrete cover
lower concrete cover
elastic modulus of concrete
elastic modulus of steel
steel dowel distance
axial compressive strength of concrete
standard value of concrete strength
yield strength of steel
concrete slab height
steel dowel height
cross-sectional moment of inertia of the composite beam
number of folded dowel shear connectors required for a full composite beam along the half span
shear capacity strength of an individual shear connector
ultimate load
characteristic load
ultimate flexural load
ultimate shear load
thickness of steel dowel
ultimate longitudinal shear force
position of the plastic neutral axis (PNA) distant from the top surface of concrete slab
distance from steel bottom flange to the elastic neutral axis of converted section
distance from steel bottom flange to the elastic neutral axis of converted section
geometry depended reduction factor
reinforcement ratio between two steel dowels
reinforcement ratio within the effective concrete area
relative slip when the characteristic load is reached for the first time
ultimate deflection
relative slip when the characteristic load is reached after experiencing the ultimate load
yield deflection
Footnotes
Acknowledgements
The authors thank the laboratory technicians of Tongji University for their assistance in tests and preparing the test specimens.
Declaration of conflicting interests
The author(s) declared no potential conflicts of interest with respect to the research, authorship, and/or publication of this article.
Funding
The author(s) received no financial support for the research, authorship, and/or publication of this article.