
Abstract
The layout of the exterior retaining walls and external thermal insulation demands often introduce an eccentricity between the central axes of the beams and columns, leading to what is termed as an eccentric beam-column joint. Such the beam eccentricity is a key factor in shear failures within the joint region. This study addresses the negative impact of beam eccentricity on the shear capacity of reinforced concrete (RC) eccentric beam-column joints. Current research indicates that in the five prevailing shear capacity formulas of RC eccentric joints, adverse effects are primarily accommodated by either reducing the joint’s effective width (bj) or implementing an eccentricity influence factor. The study challenges the validity of these approaches by dissecting the impact of singular and interactive factors, including. Eccentricity (2e/bc), beam-to-column width ratio (bb/bc), and the column’s aspect ratio (hc/bc). It was observed that while the influence of 2e/bc is generally well-accounted for, the effects of bb/bc and hc/bc are not adequately considered in the Chinese code and ACI-318. Leveraging the softened strut-and-tie model and insights from these examinations, a refined formula for determining the shear capacity of eccentric joints is introduced. This formula incorporates the detrimental effects of beam eccentricity through a newly conceptualized eccentric influence factor, which is a function of both 2e/bc and bb/bc. Compared to existing models, this proposed formula also factors in the beam-to-column depth ratio and the longitudinal reinforcement in the middle of column section. Validation against experimental data from 26 eccentric joints demonstrates that the proposed formula yields predictions with the closest proximity to actual test results and the least variability compared to the five established formulas. This approach to considering the effects of e/bc and bb/bc proves to be slightly more accurate than Zhou’s model, making it a promising alternative for practical applications.
Keywords
Introduction
Reinforced concrete (RC) beam-column joint serve as critical connectors between beams and columns. Their susceptibility to brittle shear failure poses a significant risk of localized damage and even catastrophic collapse of structures (Joh et al., 1991; Liu et al., 1999). Eccentricity between the center axes of beams and columns, often resulting from architectural demands such as external wall layouts or insulation requirements, defines the uniqueness of eccentric beam-column joints, depicted in Figure 1(a). This eccentricity is a known precursor to shear failure within the joint area, compromising the seismic integrity of both individual subassemblies and the structure as a whole (Liu et al., 1999; Ma et al., 2020; Park, 2010; Shin and LaFave, 2004), as illustrated in Figure 1(b). Eccentric beam-column joint. (a) Schematic of eccentric corner beam-column joint. (b) Joint shear failure [1].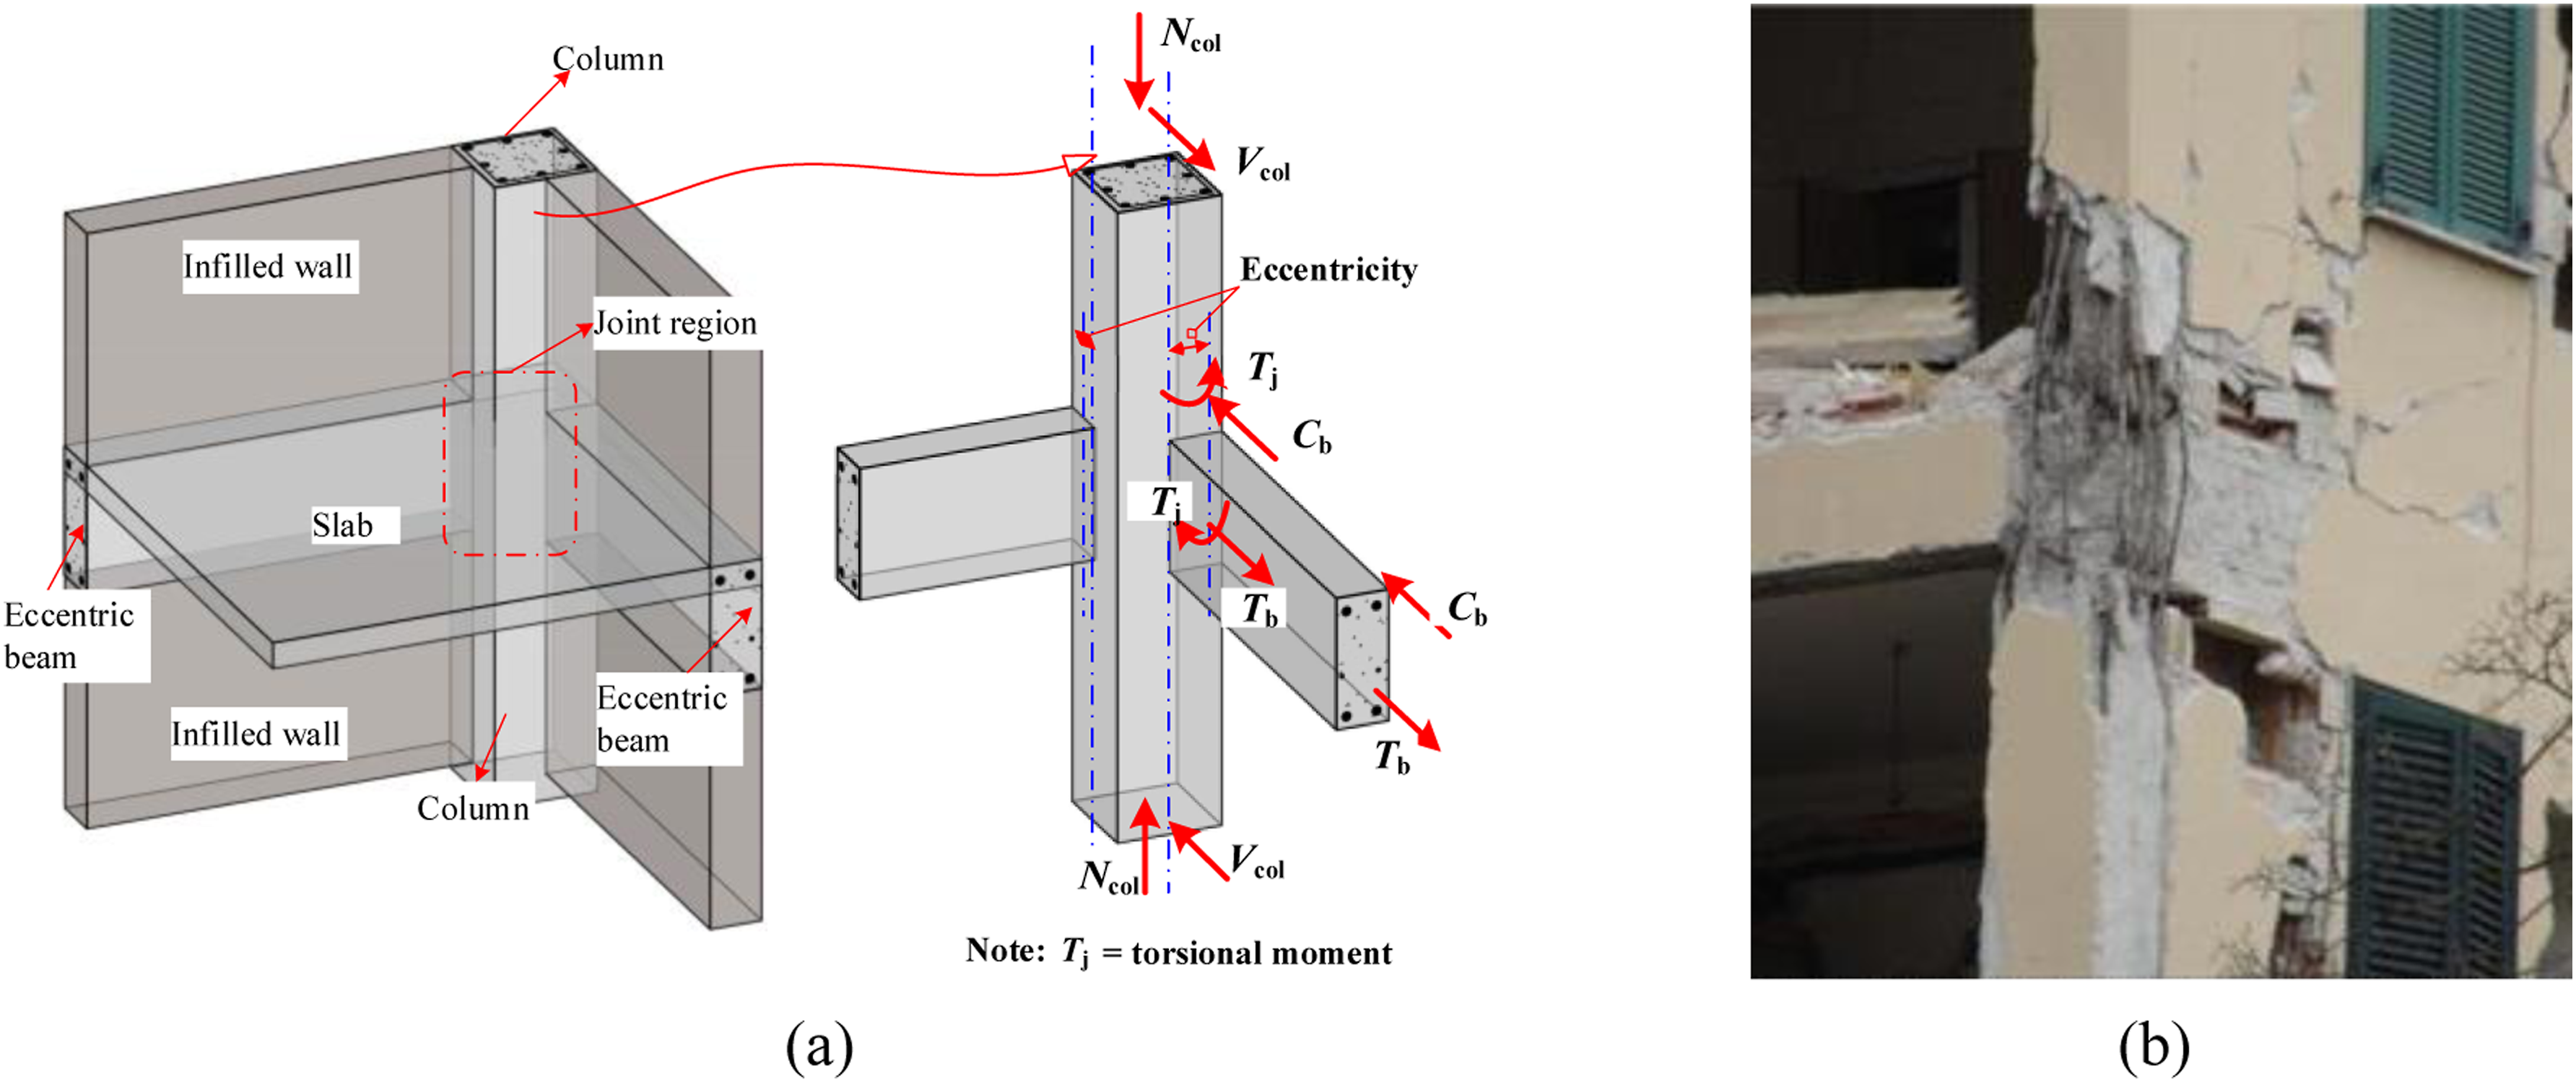
The Joint ACI-ASCE Committee 352 (2022) underscores the necessity for in-depth studies on the impact of such eccentricity on joint behavior (Ma et al., 2020). Despite this, research specifically targeting eccentric joints remains scarce, with a predominant focus on ╋-type joints in existing literature (Liu et al., 1999; Zheng et al., 1999, 2005; Sun et al., 2001; Kusuhara et al., 2004; Goto and Joh, 2004; Yu and Li, 2006; Raffaelle, 1992; Zhou, 2002; Sin, 2004; Burak, 2005; Choi and Lee, 2023), and a notable gap in studies concerning ┣-type eccentric joints (Chen and Chen, 1999; Ma et al., 2020; Ullah et al., 2021). Investigations into the seismic and shear behavior of RC eccentric joints by researchers including Ma et al. (2020), Liu et al. (1999), and others (Burak, 2005; Chen and Chen, 1999; Choi and Lee, 2023; Goto and Joh, 2004; Kusuhara et al., 2004; Liu et al., 1999; Raffaelle, 1992; Sin, 2004; Sun et al., 2001; Yu and Li, 2006; Zheng et al., 1999, 2005; Zhou, 2002) have consistently shown inferior performance compared to concentric counterparts, with a heightened vulnerability to shear failure. Contributing factors include: (1) The skewing of shear stress distribution due to beam eccentricity, causing elevated stress on the eccentric side (Ma et al., 2020) (2) The induction of additional shear stresses from torsion within the joint area (Burak and Wight, 2004; Joh et al., 1991; Liu et al., 1999; Ma et al., 2020; Raffaelle and Wight, 1995; Teng and Zhou, 2003), as indicated in Figure 1 (a); and (3) The diminished structural restraint at the beam ends, weakening the supportive influence on the joint (Li et al., 2009; Ma, 2019; Ma et al., 2020). Addressing the detrimental effects of beam eccentricity is therefore crucial in the design process to prevent shear failure in such joints.
The consideration of eccentricity’s adverse effects in shear capacity formulas for eccentric joints varies across design codes (ACI-ASCE Committee 352, 2002; Ministry of Construction of the People’s Republic of China, 2010; American Concrete Institute Committee 318, 2019; Architectural Institute of Japan, 2010) and scholarly research (Burak, 2005; Liu et al., 1999; Raffaelle, 1992; Zhou, 2002), with some codes (Technical Committee on Reinforced Concrete Design, 2019; Technical Committee CEN/TC 250, 2004) neglecting them entirely. An increase in eccentricity leads to a decrease in the effective width of the joint, significantly impacting shear capacity (Parate and Kumar, 2018). Currently, two primary methods are used to account for the negative impacts of beam eccentricity: (1) reducing the joint’s effective width, and (2) applying an eccentric influence factor to the shear capacity formula for concentric joints. Predominant calculation formulas, including those in the Chinese code (GB 50010-2010), American code (ACI 352R-02, ACI 318-19) (ACI-ASCE Committee 352, 2002; American Concrete Institute Committee 318, 2019), Japanese code (AIJ 2010; Architectural Institute of Japan, 2010), typically adopt the first method. Additionally, scholarly revisions such as those proposed by Liu et al. (1999), Zhou (2002), Raffaelle (1992), Burak (2005) also follow this approach. Zhou’s formula is unique in that it can be interpreted to employ both methods, where the eccentric influence factor is akin to a reduction in either the joint’s effective width or the overall shear capacity. Nonetheless, the justification for reducing the effective width in design codes and studies has not been sufficiently explored. Furthermore, existing shear capacity formulas often overlook crucial factors like axial force, beam-to-column depth ratio, and width ratio, leading to inaccuracies in some instances (Parate and Kumar, 2018; Unal and Burak, 2012). This indicates a need for further research on the shear capacity of RC eccentric joints.
Addressing this gap, the present study examines the negative impact of beam eccentricity on the shear capacity of eccentric joints and introduces an improved formula. Initially, a comparison and discussion of five existing shear capacity formulas for eccentric joints and their methods for addressing beam eccentricity are presented. The study also explores how the eccentric ratio, beam-to-column width ratio, and column depth-to-width ratio influence the joint’s effective width. Subsequently, based on the softened strut-and-tie model and prior research findings (Ma, 2019), an enhanced shear capacity formula for RC eccentric joints is proposed. The performance and reliability of this new formula are then evaluated against an experimental database comprising 26 eccentric joints, comparing its precision and safety to that of the five existing formulas.
Discussion on existing shear capacity formulas of RC eccentric joints
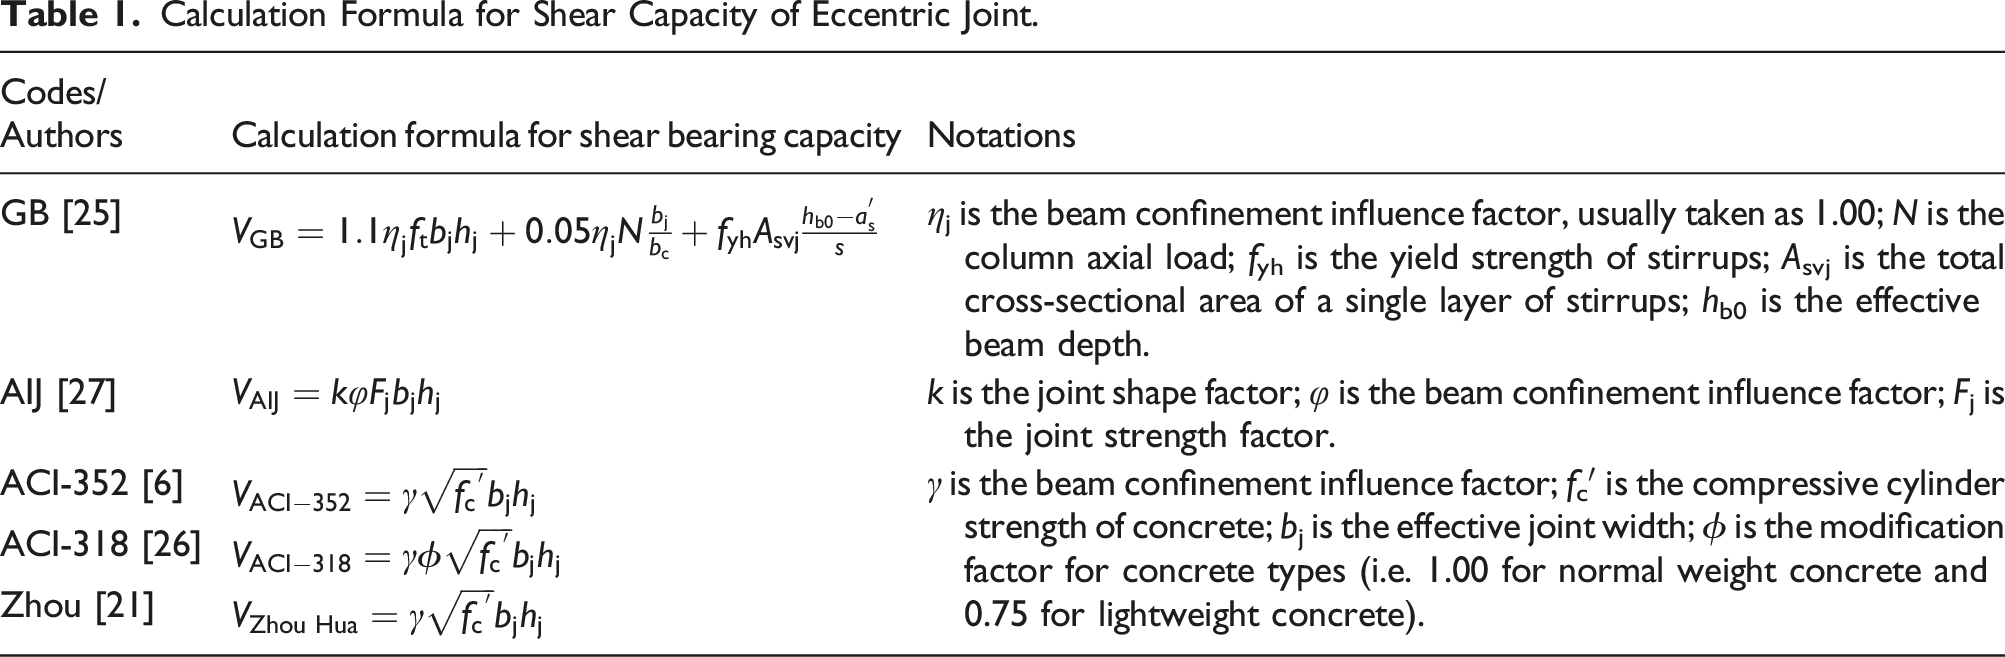
Overview of current shear capacity formulas
Calculation Formula for Shear Capacity of Eccentric Joint.
Effective Joint Width in Five Existing Formulas.
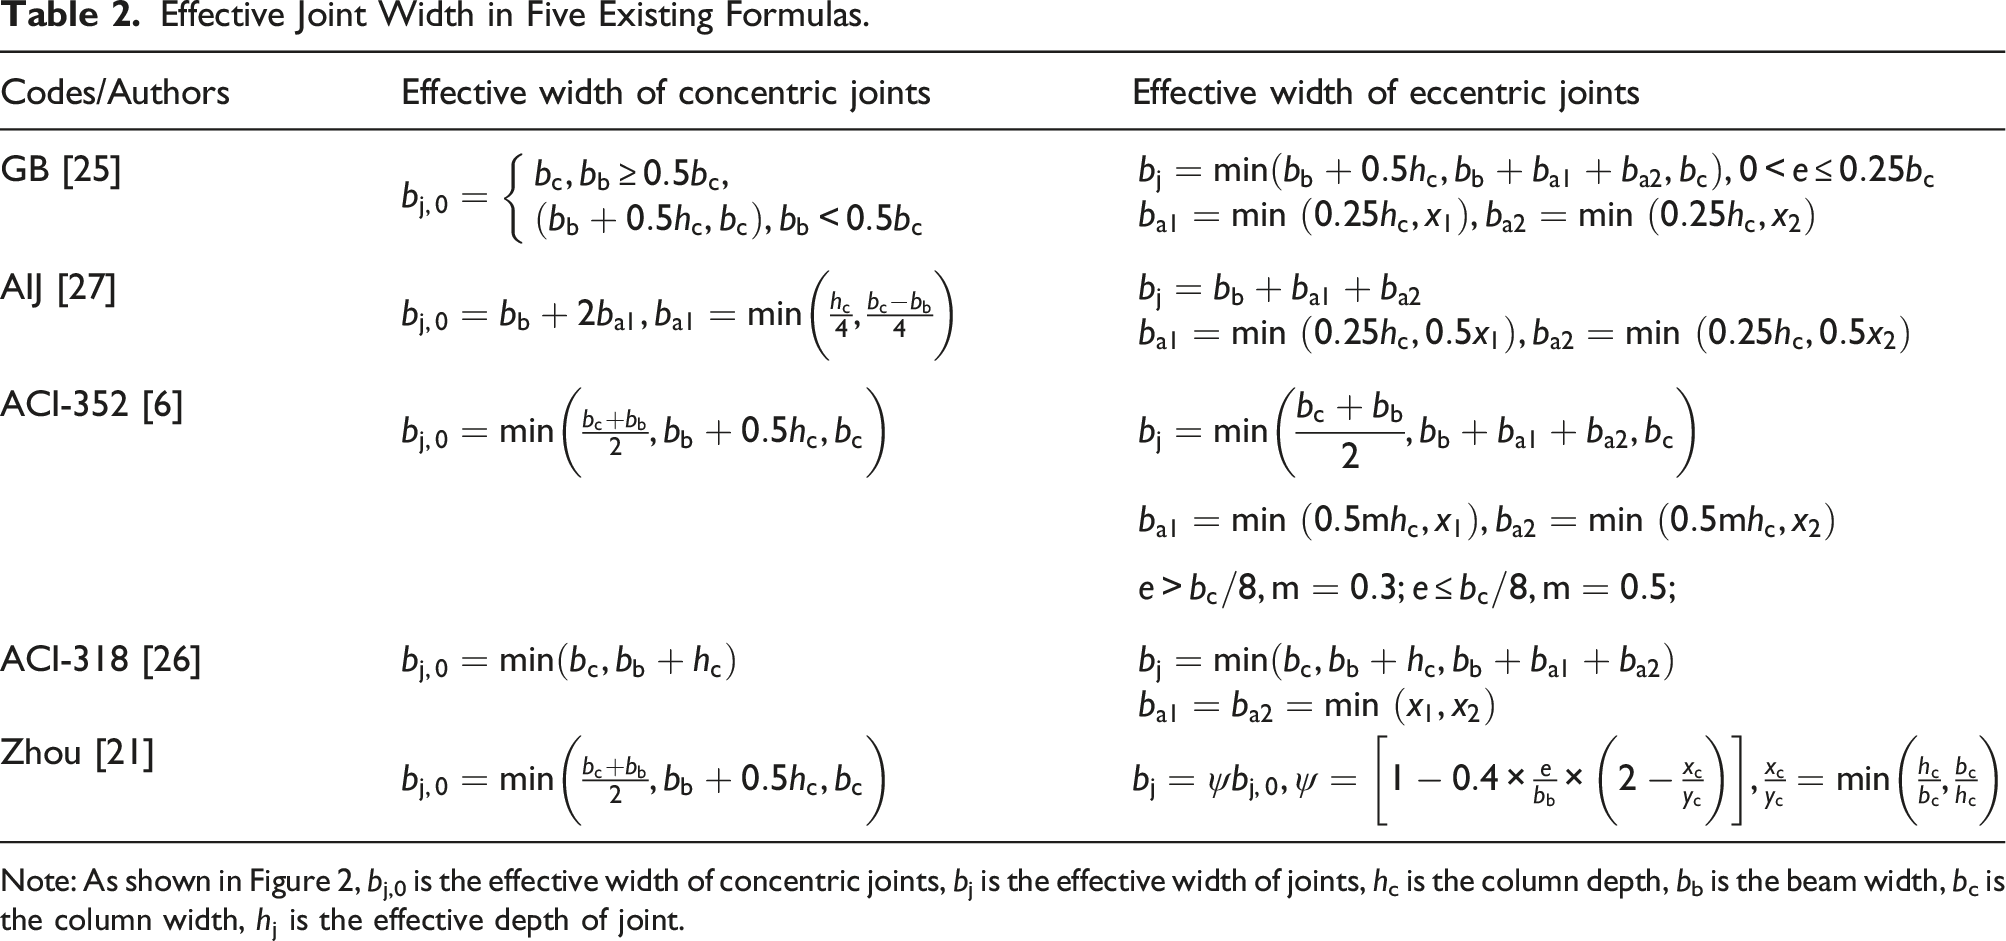
Note: As shown in Figure 2, bj,0 is the effective width of concentric joints, bj is the effective width of joints, hc is the column depth, bb is the beam width, bc is the column width, hj is the effective depth of joint.
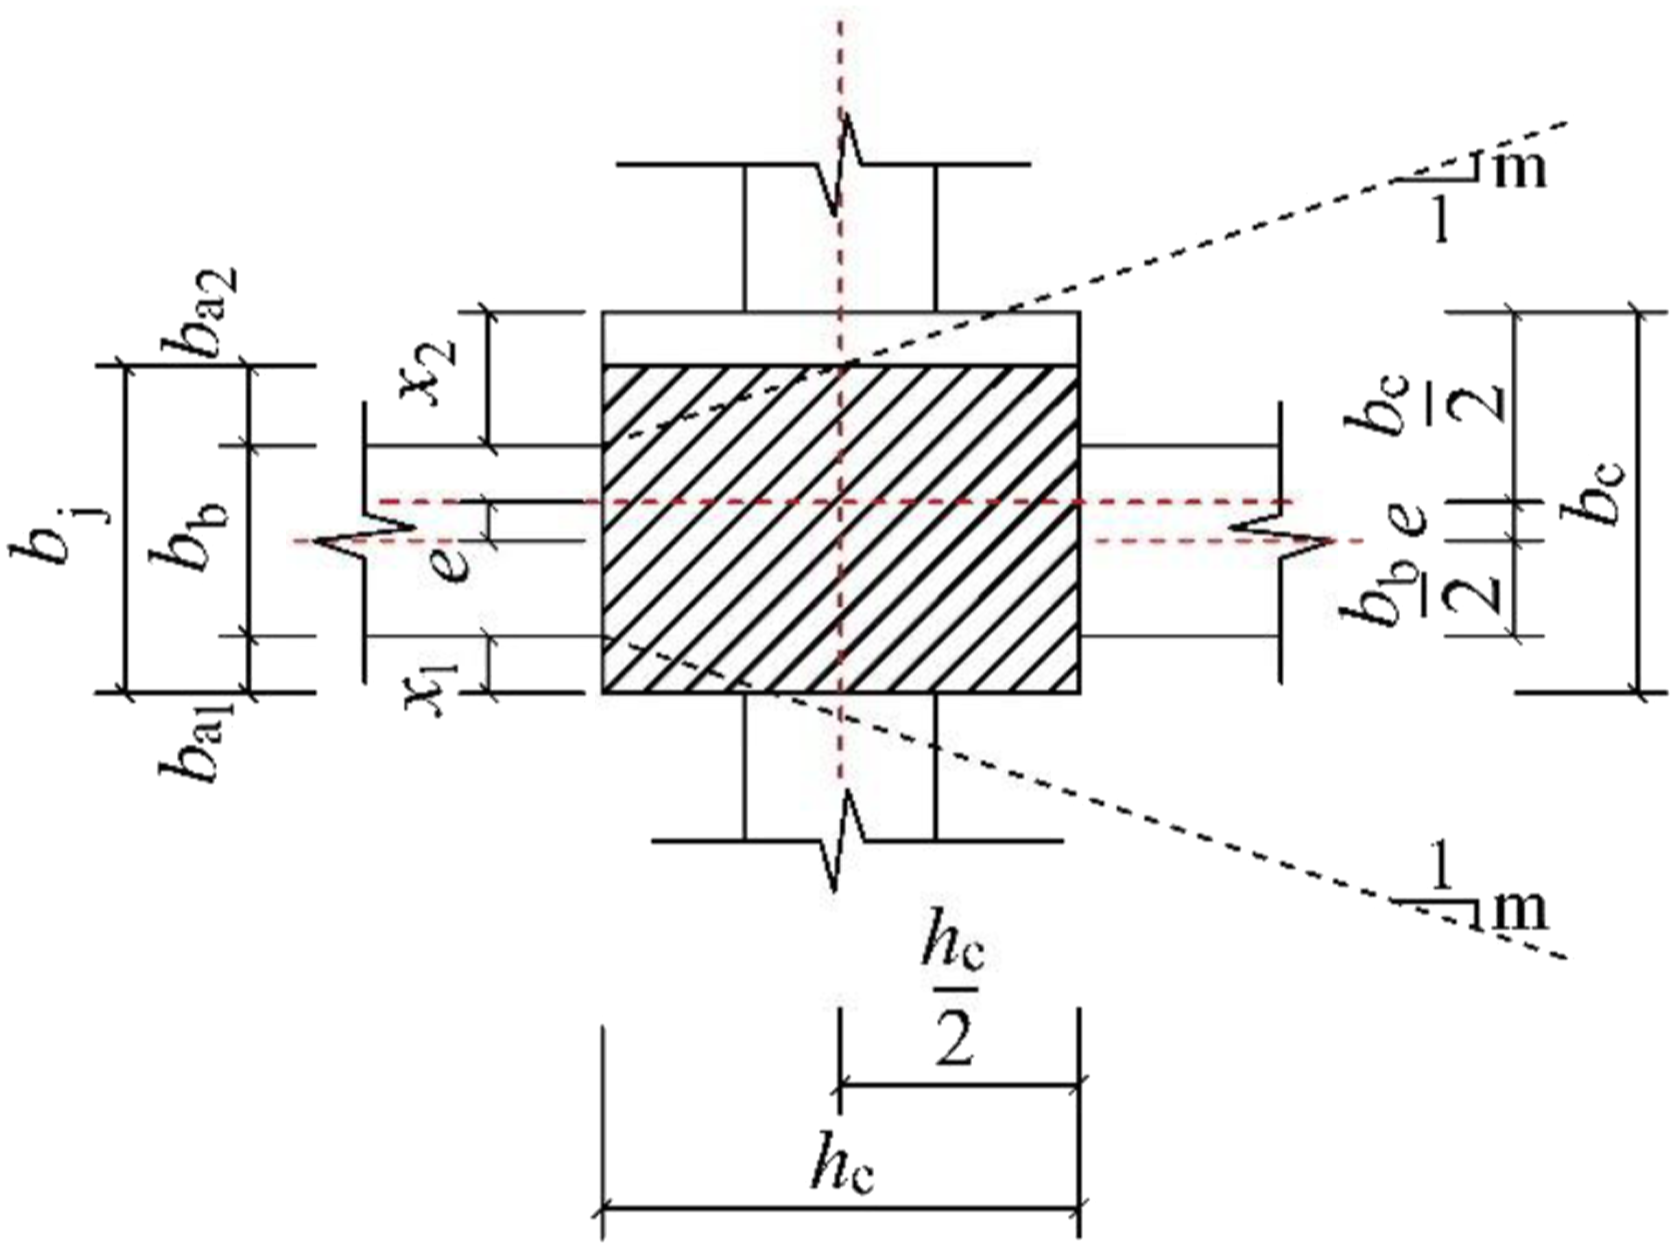
Diagram of effective width of joints.
The calculation methods used by the GB, ACI-352, ACI-318, and AIJ standards all consider the negative impact of beam eccentricity by reducing the effective width of the joint. Although the methodologies for determining the effective width differ, their conceptual frameworks are analogous. As indicated in Table 2 and Figure 2, the effective width is conceptually the aggregation of the beam width plus the influence range on either side of the beam. This influence range, represented as ba1 and ba2 in Figure 2, is dependent on factors such as the eccentricity and the beam-to-column width ratio. This dimension is typically derived from a proportion of the column depth or the distance between the beam and the column surfaces. Consequently, a larger beam or column section width, or a smaller distance to the column surface or eccentricity, results in an increased effective width. Zhou’s formula introduces an eccentric influence factor (ψ), which can be interpreted as a reduction in either the effective width or the total shear capacity, encompassing the effects of eccentricity, beam width, and column width-to-depth ratio. Furthermore, the formulas in the GB, ACI-352, ACI-318, and AIJ standards utilize piece-wise functions, which may not entirely account for the continuous variation of influencing factors. This could lead to discrepancies in the formulas’ application and their ability to accurately reflect the actual impact of variables on the effective width of eccentric joints.
Comparative analysis of effective joint width calculation methods
From the previous discussion, it is crucial to determine a rational approach for reducing the effective width of eccentric joints. A comparative analysis of the joint effective width within five established shear capacity formulas was conducted to examine their differences and soundness and to propose a reasonable reduction method for the joint effective width. The impacts of beam eccentricity ratio (2e/bc), the beam-to-column width ratio (bb/bc), and the column section’s height-to-width ratio (hc/bc) on the effective joint width (bj) were evaluated across these formulas. Particularly, the beam eccentricity was examined through the eccentric ratio (2e/bc), and the effective width of eccentric joints was normalized as the joint effective width ratio (bj/bj,0), where bj,0 is the effective width for concentric joints, defined as bj,0 = min (bc, 0.5bb+0.5bc, bb+0.5hc).
The analyses of individual factors and their combined effects are depicted in Figures 3–6. As shown in Figure 3(a) shows that the bj/bj,0 ratio in each formula decreases as 2e/bc increases. Notably, the ACI-352 and AIJ standards disregard the eccentric effect for 2e/bc≤0.2. Zhou’s formula suggests a more gradual reduction in bj, resulting in a lower bj/bj,0 ratio under various eccentric ratios, while the GB code implies a minimal reduction in bj, indicating a potentially larger effective width. Effect of single factor on effective width of joints. Effect of eccentric ratio and beam-to-column width ratio on effective width of joints. Effect of eccentric ratio and column depth-to-width ratio on joint effective width. Effect of beam-to-column width ratio and column depth-to-width ratio on joint effective width.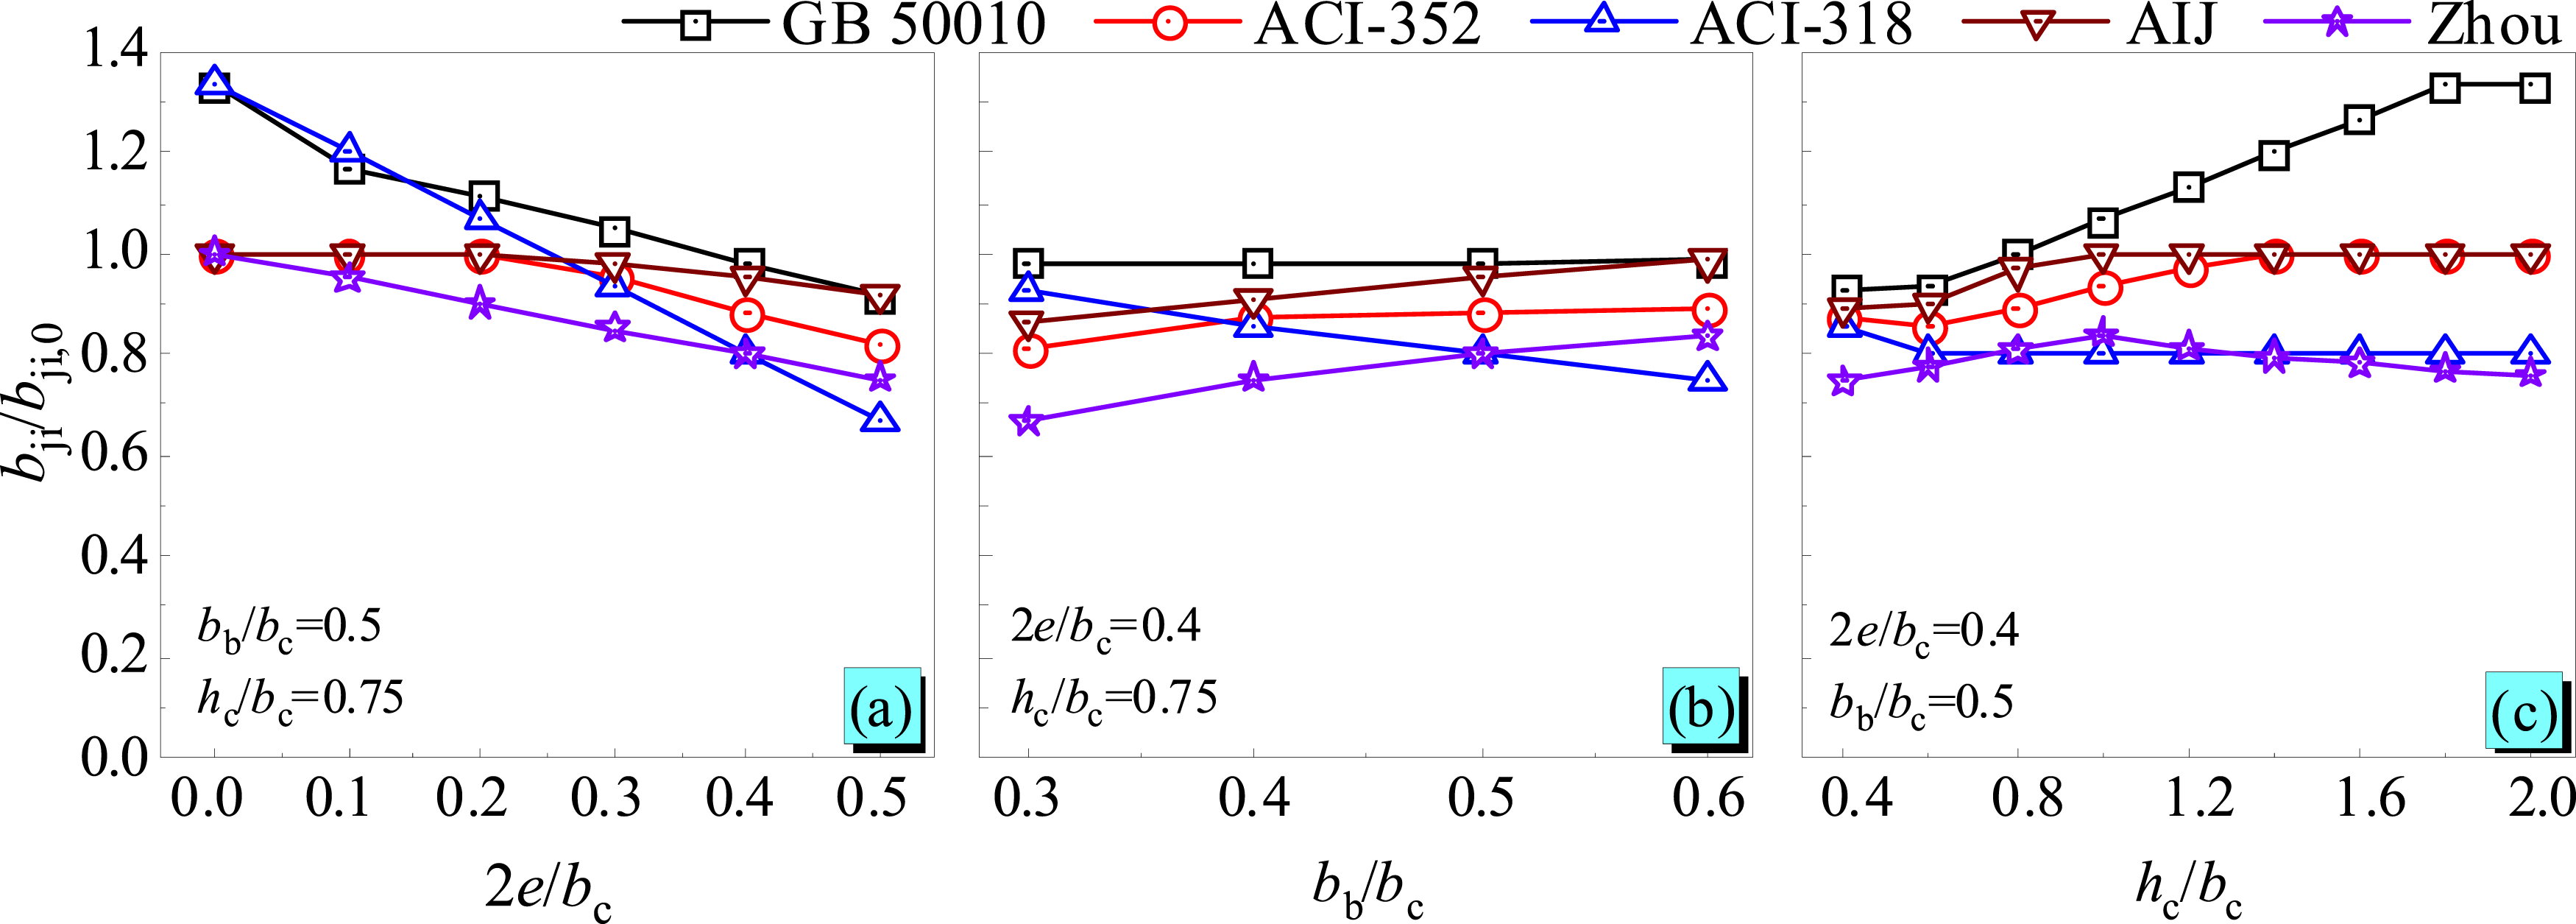
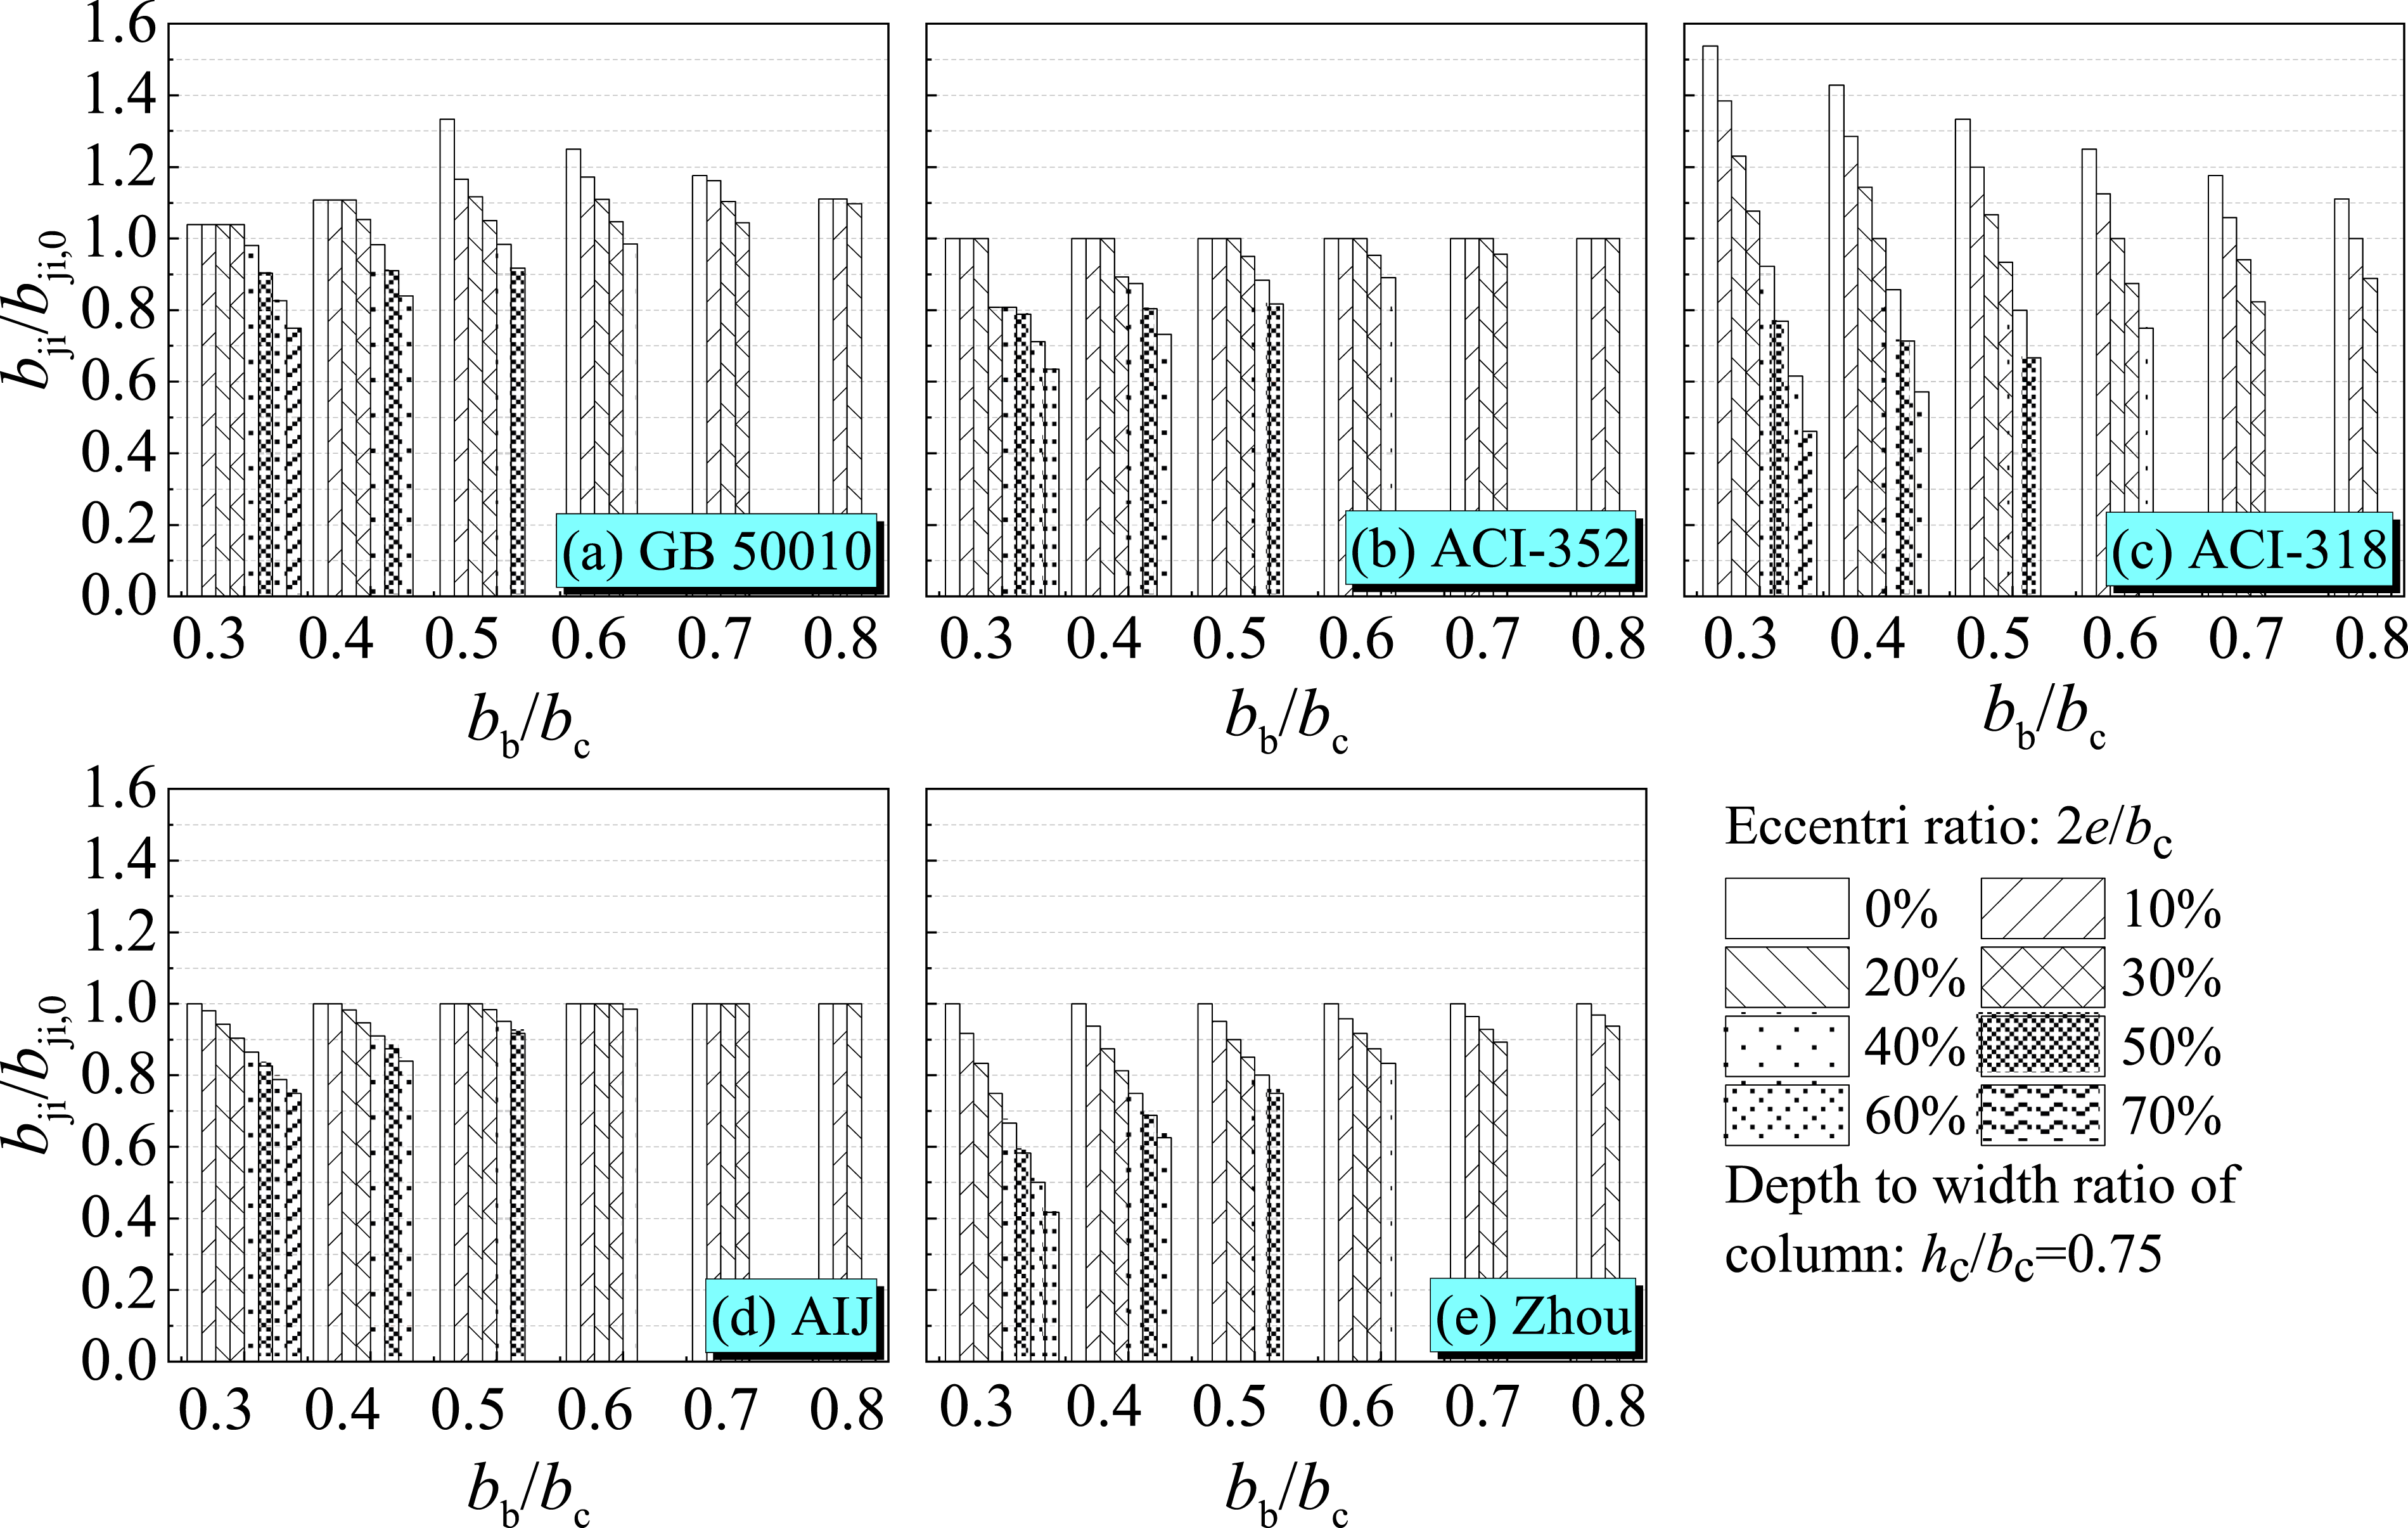
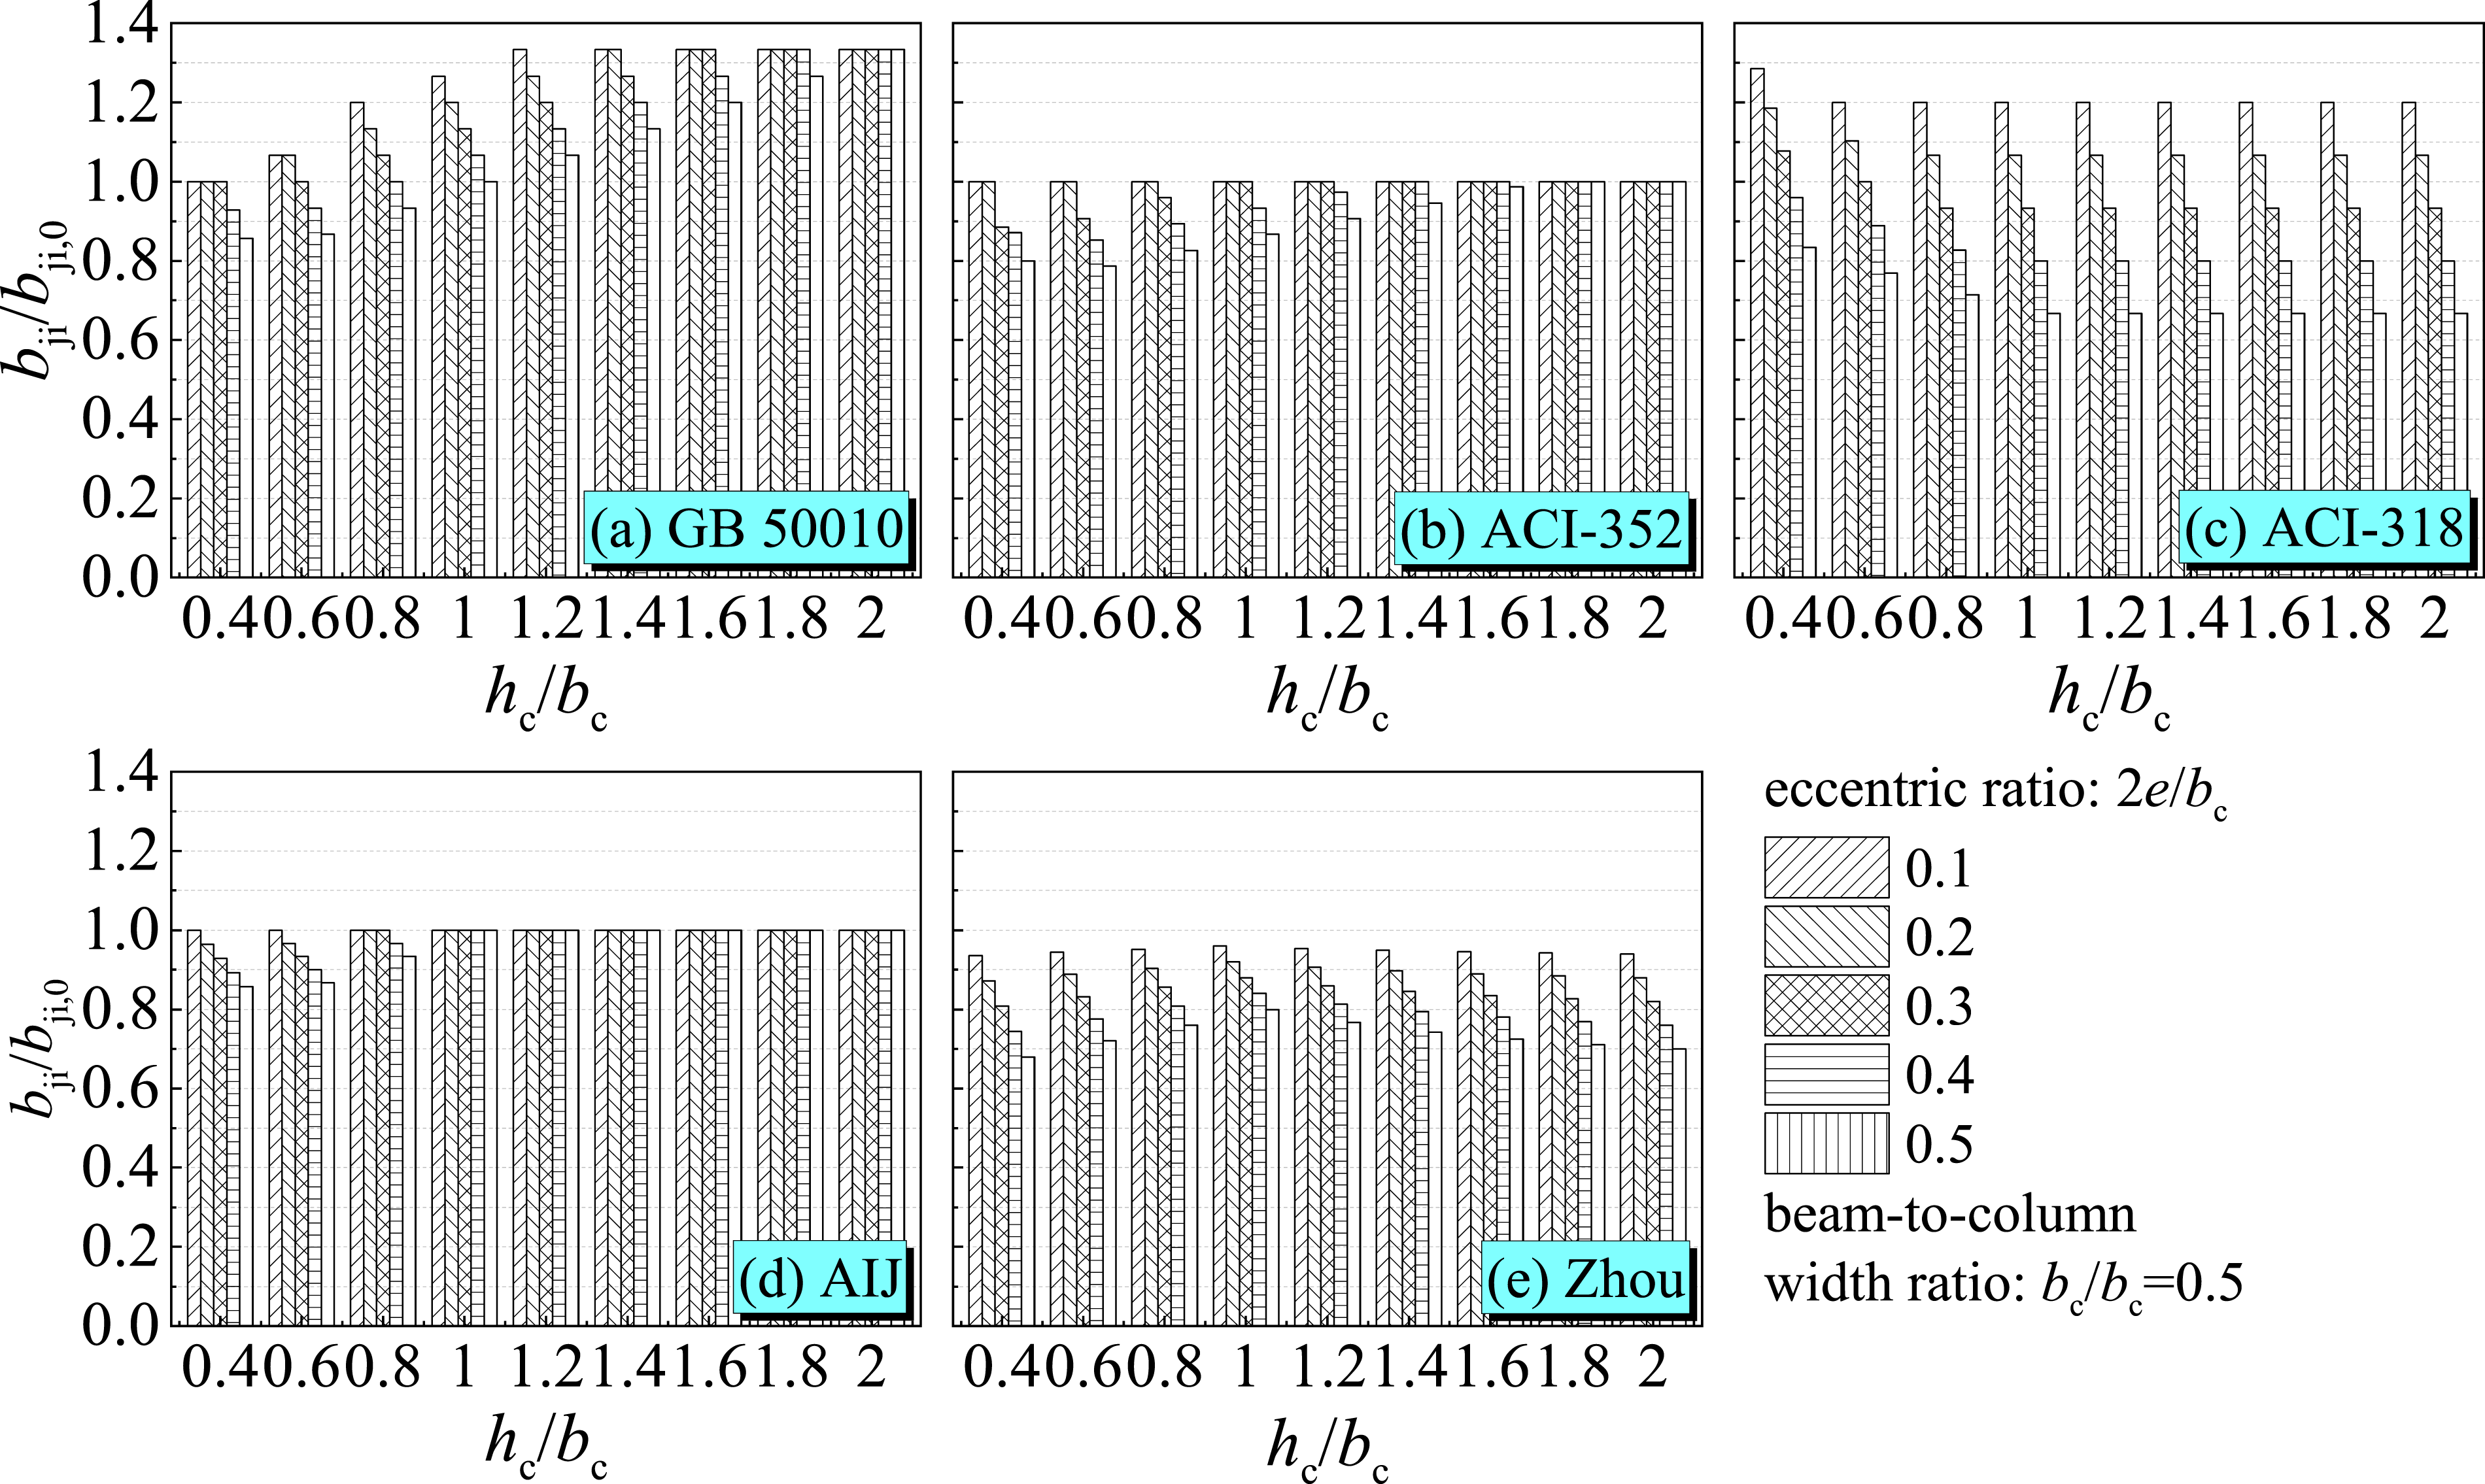
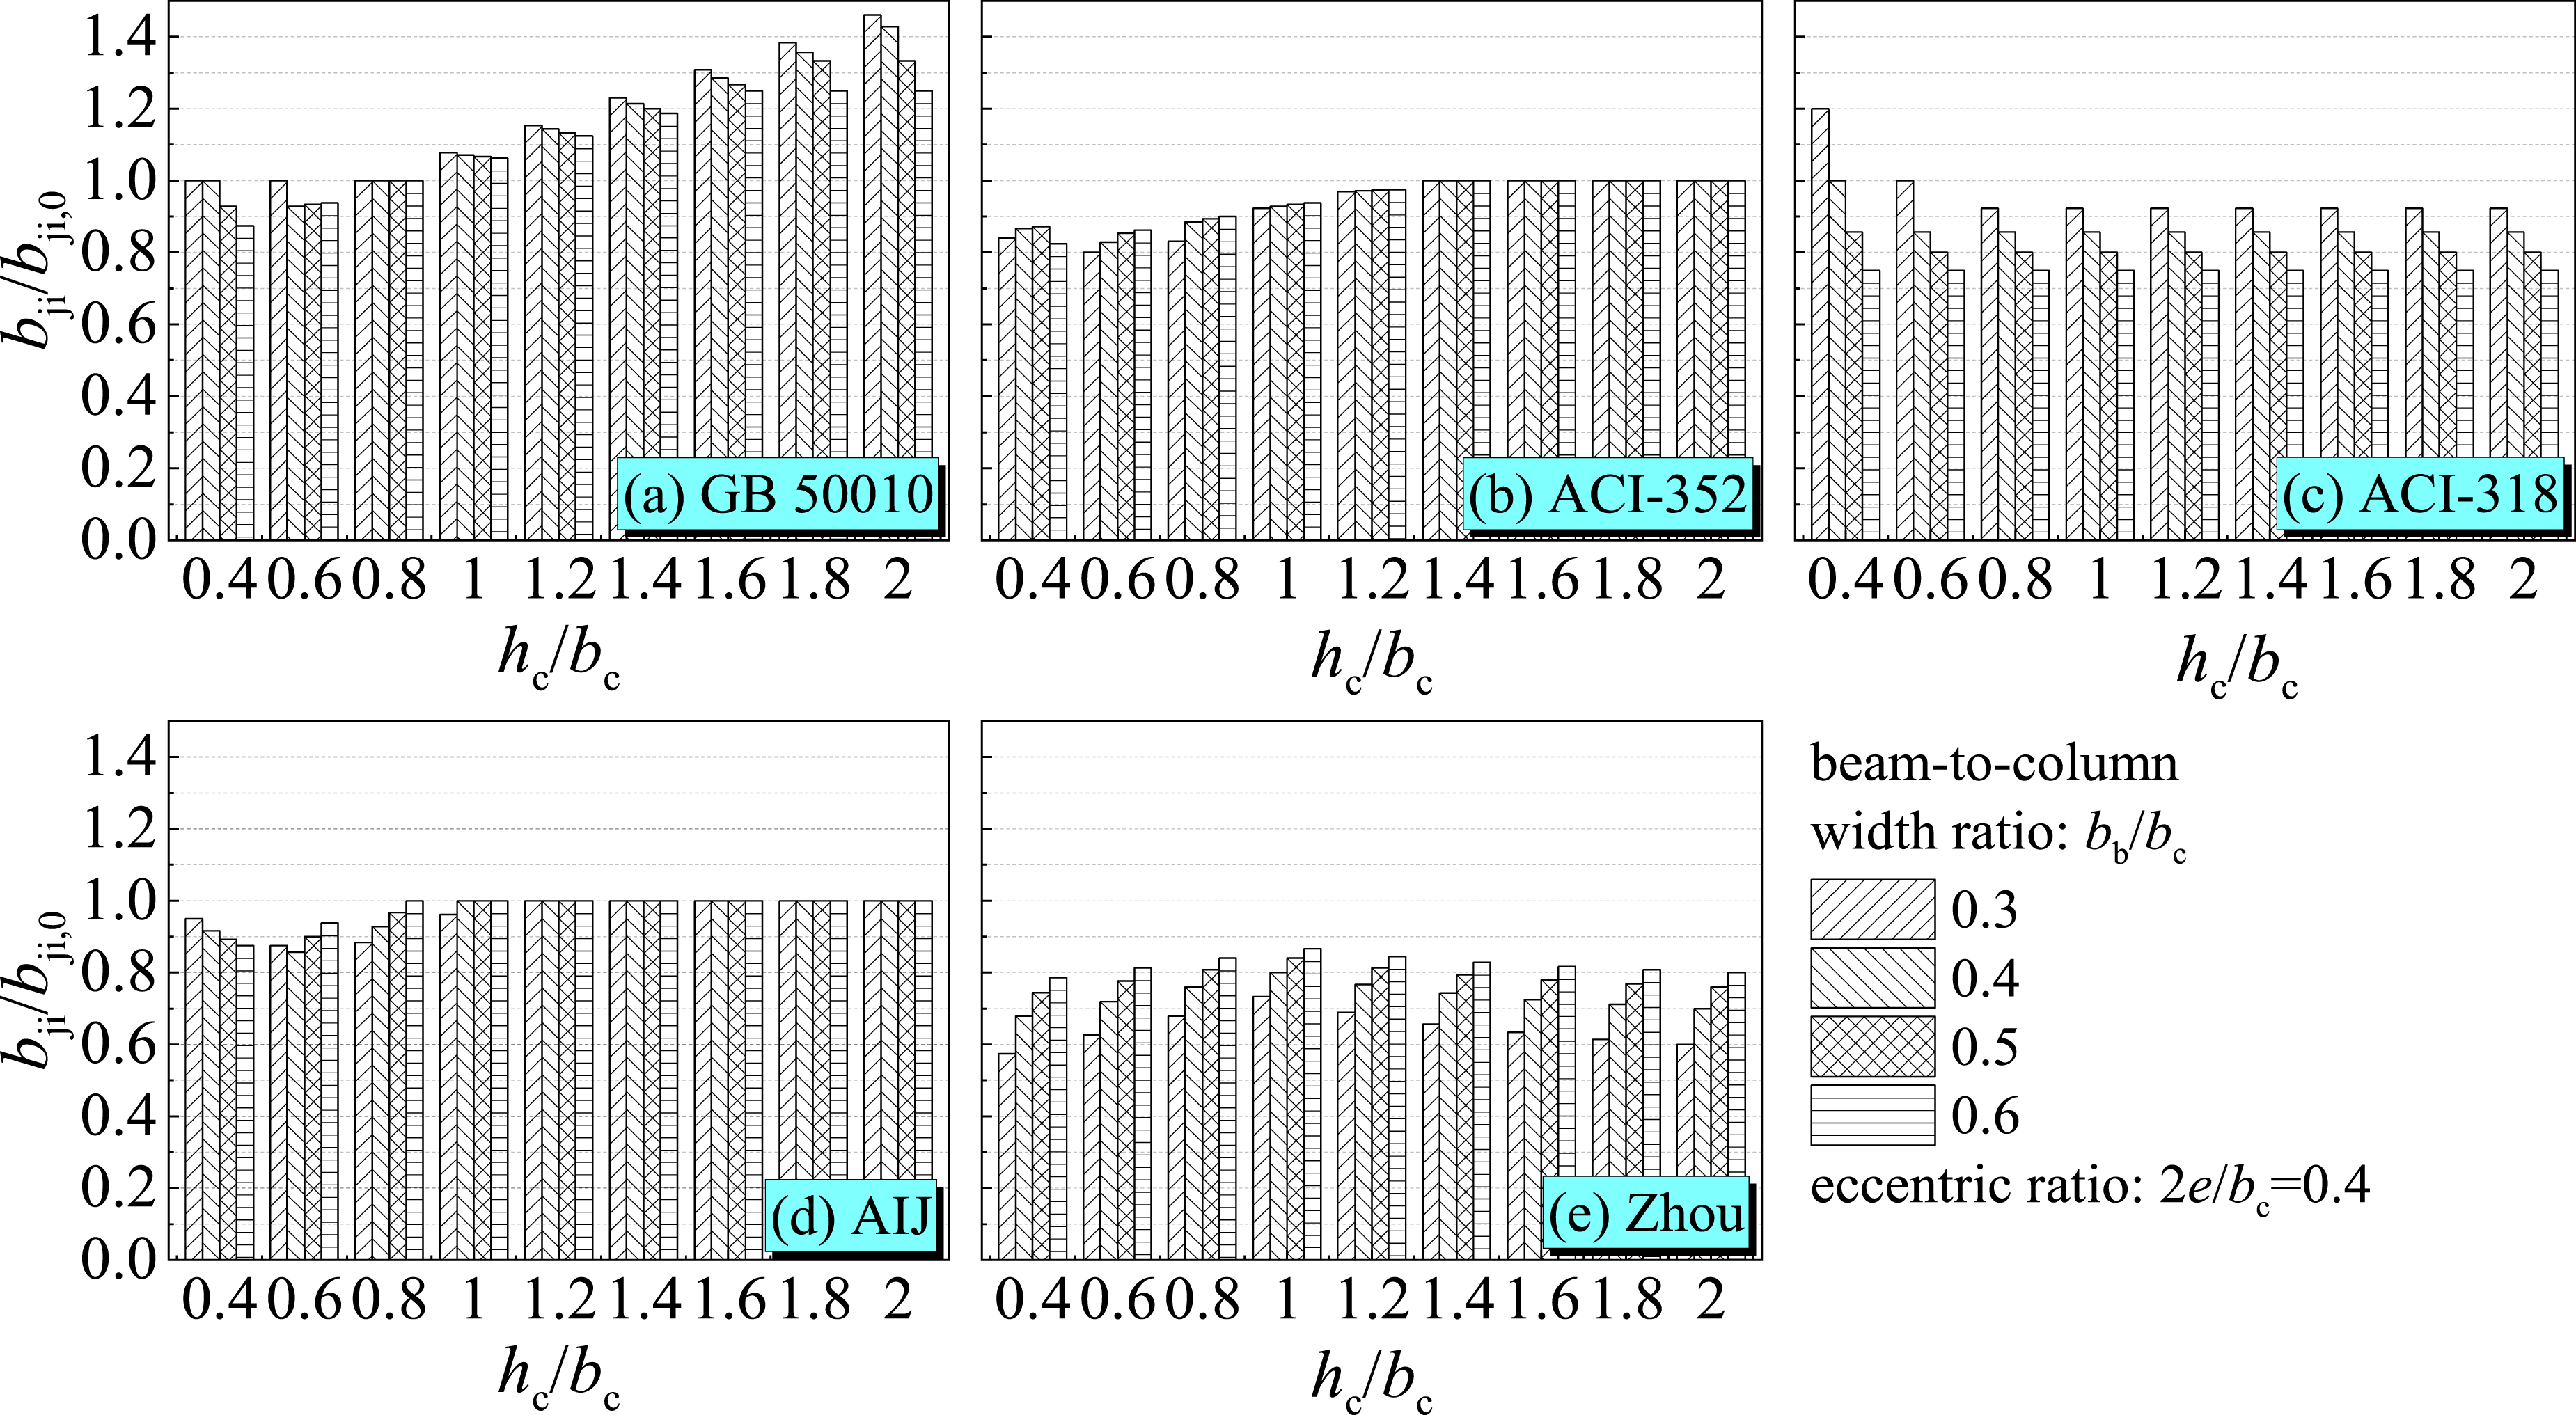
Figure 3(b) illustrates the impact of the bb/bc ratio on the bj/bj,0 values for various formula. The bj/bj,0 ratio in the ACI-318 code decreases linearly with an increase in bb/bc. This trend might be considered unreasonable since bj represents twice the distance from the beam’s centerline to the eccentric side column’s surface, which is independent of the bb/bc ratio. In contrast, for the other four formulas, the bj/bj,0 values increase with rising bb/bc. Specifically, the GB code displays the highest bj/bj,0 across different bb/bc ratios, but with minimal fluctuation. The bj/bj,0 ratios for Zhou’s formula, ACI-352, and AIJ exhibit notable increases as bb/bc, rises, with bj/bj,0 values ascending in that order.
Figure 3(c) shows that the influence of the hc/bc ratio on bj/bj,0 varies significantly among different formulas. For the ACI-318 code, bj/bj,0 is marginally higher at an hc/bc of 0.4, but remains constant and lower for other ratios. The bj/bi,0 values for AIJ, ACI-352, and GB code increase with the hc/bc ratio. Notably, the bj/bj,0 value reaches 1.0 for AIJ and ACI-352 codes at hc/bc ratios of 1.0 and 1.4, respectively. The GB code shows a more pronounced effect of hc/bc on bj/bj,0 compared to other codes, which may suggest an irrational trend. Zhou’s formula indicates a rise in bj/bj,0 with increasing hc/bc, peaking at hc/bc = 1, and then diminishing, though the overall range of change is relatively small. Since bj/bj,0 equals the reduction factor (ψ), calculated by the lesser of hc/bc and bc/hc, the bj/bj,0 value is naturally higher when the hc/bc ratio equals 1.0.
This study explores the combined effects of two factors, bb/bc and 2e/bc, on the bj/bj,0 ratio for each formula, as shown in in Figure 4. It is observed that with a constant bb/bc ratio, the bj/bj,0 values for the five formulas demonstrate a decreasing trend as the 2e/bc ratio increases. This decline is attributed to the increasing beam eccentricity, which leads to a reduction in the effective joint width extension. However, it’s noteworthy that the ACI-352 and the AIJ codes show a different pattern: their bj/bj,0 values do not significantly reflect the influence of eccentricity for 2e/bc ratios of ≤20% and ≤10%, respectively, exhibiting a similar trend in both cases. When the 2e/bc ratio is held constant, the bj/bj,0 ratio for the ACI-352, AIJ, and Zhou formulas generally increase with an increase the bb/bc, peaking at 1.0. In contrast, the bj/bj,0 ratio of the ACI-318 code exhibits a downward trend as bb/bc increases. This trend is questionable since the bj value in ACI-318, defined as twice the distance from the beam’s center line to the eccentric side column’s surface, does not consider the bb/bc effect. The GB code’s bj/bj,0 ratio displays a unique pattern: it initially increases and then decreases with rising bb/bc, reaching a maximum at approximately 0.5-0.6. This change occurs because the increase in bj value diminishes significantly when the bb/bc ratio is relatively large. Additionally, Figure 4 reveals that the bj/bj,0 values of the ACI-318 code exhibit the most significant variation among the formulas. The bj/bj,0 values for the GB code are notably high, typically exceeding 1.0 for 2e/bc ratios of ≤30%.
Figure 5 presents the results on the combined influence of hc/bc and 2e/bc on the bj/bj,0 ratio for each formula. When hc/bc is fixed, the bj/bj,0 values for all formulas exhibit a decreasing trend as 2e/bc increases, mirroring the observations from Figure 4. The underlying reasons for this trend have been previously discussed. Keeping the 2e/bc value constant, the bj/bj0 ratios of the GB, ACI-352, and AIJ codes generally increase with the increase in hc/bc. However, for the GB code, bj/bj0 increases with hc/bc up to a certain point and then plateaus, which raises questions about its rationality. Additionally, for the GB code, bj/bj0 is consistently greater than or equal to 1.0 for either 2e/bc≤30% or hc/bc≥1. The ACI-318 code shows a different pattern; its bj/bj0values are larger than 1.0 for 2e/bc≤20%. The bj/bj0 values of the ACI-318 code decrease slightly with an increase in hc/bc, a stabilizing once hc/bc reaches 1.0, indicating a minor influence of hc/bc on bj/bj0. Zhou’s formula exhibits an initial increase and then a decrease in bj/bj,0 with increasing hc/bc, peaking at a ratio of of 1.0, consistent with the single-factor analysis discussed earlier. Compared to other formulas, Zhou’s shows less variation in bj/bi,0 with changes in hc/bc.
Figure 6 focuses on the interplay between hc/bc and bb/bc on bj/bi,0 for each formula. With a fixed hc/bc, both GB and ACI-318 codes show a decline in bj/bj,0 as bb/bc increases, attributed to the significant rise in bj,0, which lessens the impact on bj. For bb/bc≤0.3 or hc/bc≥0.8, the bj/bj,0 values of the GB code remain at or above 1.0. The bj/bj,0 values for the other three formulas generally show an increasing trend. The ACI-352 and AIJ codes display similar changes in bj/bj,0, maintaining a constant value for hc/bc≥1.4 and ≥1.2, respectively. When hc/bc is low, the influence of bb/bc on bj and bj,0 varies and does not always increase or decrease consistently. For hc/bc>0.6, the bj/bj,0 values increase until reaching 1.0, indicating a reasonable approach in these codes. With a fixed bb/bc, the bj/bj,0 values for the GB, ACI-352, and AIJ codes generally increase with an increase in hc/bc, except for a slight decrease between 0.6 and 0.8, due to the greater impact of bb/bc on bj,0, and the strong influence of hc/bc on bj. For high hc/bc values, the bj/bj,0 value of GB code is relatively large, raising questions about its rationality even with significant eccentricity. In contrast, the bj/bj,0 of the ACI-318 code generally decreases, reaching a stable value when hc/bc≥0.8 or bb/bc≥0.6. The Zhou’s formula again shows an increase followed by a decrease in bj/bj,0 with increasing hc/bc, peaking at hc/bc of 1.0, aligning with the earlier discussion.
The analysis and discussion of five existing formulas reveal that an increase of the eccentricity tends to decrease the effective joint width. The width shows an increasing trend with the rise in both the beam-to-column width ratio and column depth-to-width ratio. This pattern holds true under the combined effect of any two factors (2e/bc, bb/bc, hc/bc). The same trend is also reflected. However, due to the complexity of these factors, the degree of variation in the effective joint width varies. In summary, the treatment of bj/bj,0 ratio in the ACI-352, AIJ, and Zhou Hua’s formulas appears relatively reasonable. In contrast, the bj/bj,0 value in the GB formula is significantly larger than in other formulas. Notably, the bj/bj,0 value in the ACI-318 code is not influenced by the bb/bc ratio, which may be considered unreasonable and warrants further analysis. Moreover, both 2e/bc and bb/bc directly affect the effective joint width, and this influence is generally consistent across various formulas. It is advisable to incorporate considerations of 2e/bc and bb/bc in calculating the shear capacity calculation formula of RC eccentric joints. However, the influence of the hc/bc on the effective joint width is more complex, with considerable variations in its treatment across different formulas. Thus, a more detailed analysis of the influence of hc/bc on the shear capacity of joints is necessary.
Proposed shear capacity formula of RC eccentric joints
Description of the experimental database
In this study, a comprehensive database was established, comprising 26 experimental specimens of RC eccentric joints sourced from nine earlier studies (Burak, 2005; Chen and Chen, 1999; Choi and Lee, 2023; Kusuhara et al., 2004; Liu et al., 1999; Ma, 2019; Raffaelle, 1992; Sin, 2004; Yu and Li, 2006; Zhou, 2002). These specimens are classified into two types based on the number of beams connected to the joint: (1) Type ╋, where the joint is connected by effective confinement beams on two opposite sides; and (2) Type ┣, where the joint is connected by effective confinement beams on either one side or two adjacent sides. There are 22 specimens of Type ╋ and 4 specimens of Type ┣. All collected specimens represent ordinary RC eccentric joints, primarily failing due to shear in the joint region, and the failure modes are specifically joint shear failure (JS) and beam bar yielding followed by joint shear failure (BY-JS).
Several factors influencing shear capacity were identified from extensive experimental and theoretical research. These factors include: (1) section dimensions of beam and column (bb, hb, bc, and hc); (2) axial compression ratio (n: 0∼0.2); (3) beam eccentric ratio (2e/bc: 18.9%∼61.3%); (4) joint stirrup characteristic value (λsh: 0∼2.911%); (5) Characteristic value of longitudinal reinforcement in the middle of the column section (λsv,mid: 0∼1.558%); (6) compressive strength of concrete axis (fc: 18.56 MPa∼36.38 MPa) and (7) experimental value of shear capacity of joint (Vexp: 249 kN∼772 kN). Detailed information on these factors is summarized in Appendix Table 1. Using this database, the study aims to compare various shear capacity formulas of RC eccentric joints and examine the influence of critical factors, such as beam eccentric ratio, axial load, joint stirrup characteristic value, on the shear capacity.
Construction of the proposed formula
Due to limited experimental data on eccentric joints, this paper develops a formula to calculate their shear capacity. The proposed formula is an adaptation of the shear capacity formula for concentric joints, modified by including an eccentric reduction factor. This factor accounts for the adverse effects of beam eccentricity, as delineated in equation (1). The base formula for the shear capacity of concentric joints (Vcal,0), drawn from the authors’ previous research (Ma, 2019), is expressed in in equation (2). Its formulation is based on the softened strut-and-tie model (Hwang and Lee, 2000, 2002). In this model, the concrete within the joint region functions as a diagonal compression strut, countering horizontal shear force. The stirrups, apart from directly resisting the joint shear force, also confine the concrete, limiting crack width and thereby indirectly boosting the shear capacity of the concrete strut. The longitudinal reinforcement bars in the middle of column section act as vertical ties, aiding the vertical shear resistance of joints and postponing the failure of the concrete strut, which, in turn, indirectly increases the joint’s shear capacity. Moreover, the axial load on the column enhances the confinement of the concrete in the joint region, indirectly strengthening the concrete strut’s shear capacity and delaying its deterioration.
Equation (2) incorporates both the direct contribution of the concrete strut and stirrups, and the indirect contribution of the column’s longitudinal reinforcement and axial load. The indirect contribution of column’s longitudinal reinforcement is considered as a coefficient that increases the effectiveness of the concrete term.
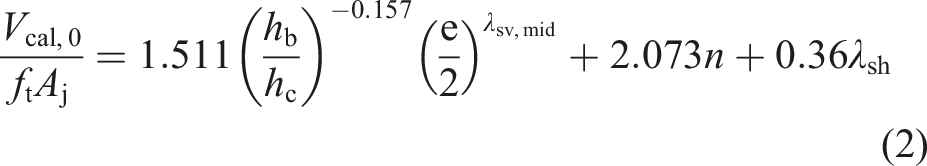
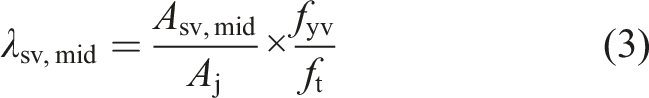
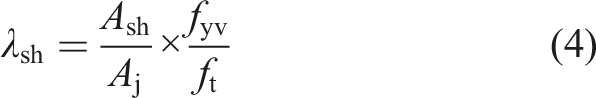
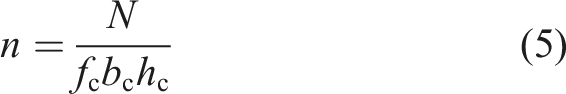
Equation (2) calculates the shear capacity Vcal of eccentric joints. The formula incorporates the eccentric influence factor ψ and the calculated shear capacity of concentric joints Vcal,0. The concrete term is determined by multiplying the tensile strength (ft) and the effective area of joints (Aj = bj,0hj). Here, hb or hc represents the depth of the beam or column, respectively, while (hb/hc)−0.157 serves as the influence coefficient for the beam-to-column depth ratio. The term λsv,mid denotes the characteristic value of longitudinal reinforcement in the middle of column section. Asv,mid represents the area of this reinforcement, and fyv is its yield strength. It’s crucial to note that the longitudinal reinforcement refers to the one situated in the middle of the column section, aligned with the direction of parallel loading. Additionally, N signifies the column axial load. The formula also includes λsh, the characteristic value of stirrups in joint region, along with Ash, the total stirrup area, and fyh, their yield strength.
In frame structures subjected to horizontal loading, the joint region experiences shear stresses due to internal forces transmitted by adjacent members. Research has shown that the shear stress in joint region concentrates within the beam width range and diminishes towards the edges (Goto and Joh, 2004; Zheng et al., 1999, 2005). Beam eccentricity introduces additional torque in joint region (Burak and Wight, 2004; Joh et al., 1991; Liu et al., 1999; Raffaelle and Wight, 1995; Teng and Zhou, 2003), and diminishes the beam’s lateral restraint ()on the joint (Joh et al., 1991; Ma, 2019). Furthermore, an increase in the 2e/bc ratio significantly heightens the shear stress on the eccentric side of the joint, potentially causing premature shear failure and reducing the joint’s shear capacity (Liu et al., 1999; Joh et al., 1991; Yu and Li, 2006; Ministry of Construction of the People’s Republic of China, 2010). Conversely, a higher bb/bc ratio, indicating a larger beam-column contact area, enables the beam to provide stronger lateral confinement for the joint region. This effect enhances the concrete’s shear strength in the joint region and mitigates the impact of beam eccentricity. As explored in Section 2.2, the ratios 2e/bc and bb/bc substantially influence the effective joint width. An increase in 2e/bc reduces bj, while an increase in bb/bc augments it bj. Consequently, these ratios are crucial in assessing the effect of beam eccentricity on joint shear capacity. The influence factor for beam eccentricity is constructed considering these aspects: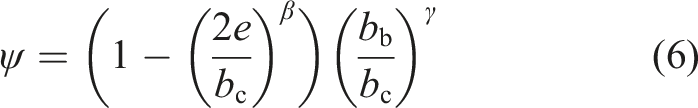
In equation (6), e signifies the eccentric distance between the center axis of the beam and the column. The terms bb or bc represent the widths of the beam and the column, respectively. The ratio 2e/bc is defined as the eccentric ratio, while bb/bc is the beam-to-column width ratio. Coefficients β and γ quantify the influence of eccentricity and beam-to-column width ratio reduction term, respectively.
Using a comprehensive database of eccentric beam-column joints and the corresponding calculation formulas from equations (1)–(3), we determine the coefficients β and γ through regression analysis. By applying the calculated values for the eccentricity coefficient (β = 2.962) and the beam width ratio coefficient (γ = 0.148) to equation (6), we derive the formula for calculating the shear capacity of RC eccentric joints: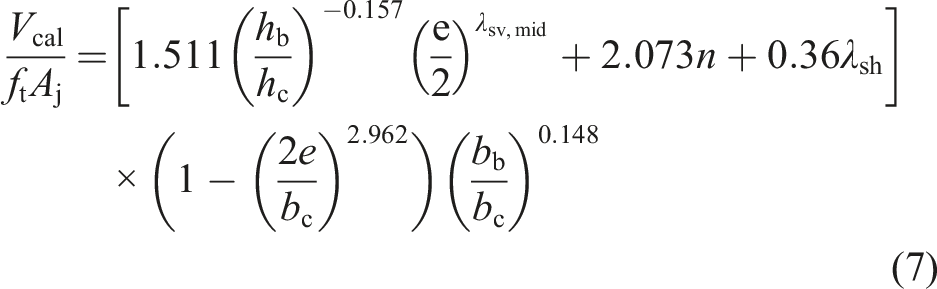
Figure 7 illustrates the variation of the Vcal/Vexp ratio with respect to parameters 2e/bc, λsh, λsv, hc/bc, bb/bc and hb/hc, thereby facilitating an evaluation of the appropriateness of each parameter in the proposed formula. For the ratios of 2e/bc, hc/bc and bb/bc, the Vcal/Vexp values are evenly distributed around the line where Vcal/Vexp equals 1, indicating no significant upward or downward trends. This suggests a balanced consideration of these parameters in the formula. For λsh and λsv, the Vcal/Vexp values are uniformly distributed both above and below the Vcal/Vexp = 1 line when these parameters are small. However, there is a notable increase in Vcal/Vexp values when λsh exceeds 1.5 and λsv surpasses 1.2, implying that larger values of these parameters may impact the formula’s accuracy. Furthermore, the, Vcal/Vexp values conform more closely to the ideal line at hb/hc values less than 1.5. Beyond this threshold, the Vcal/Vexp values tend to be significantly higher, suggesting that the formula may overestimate in these scenarios. Overall, the proposed formula demonstrates effective predictive performance and logical parameter integration. Nonetheless, additional experimental data is necessary to further validate its reliability and accuracy. Predicted results of proposed formula.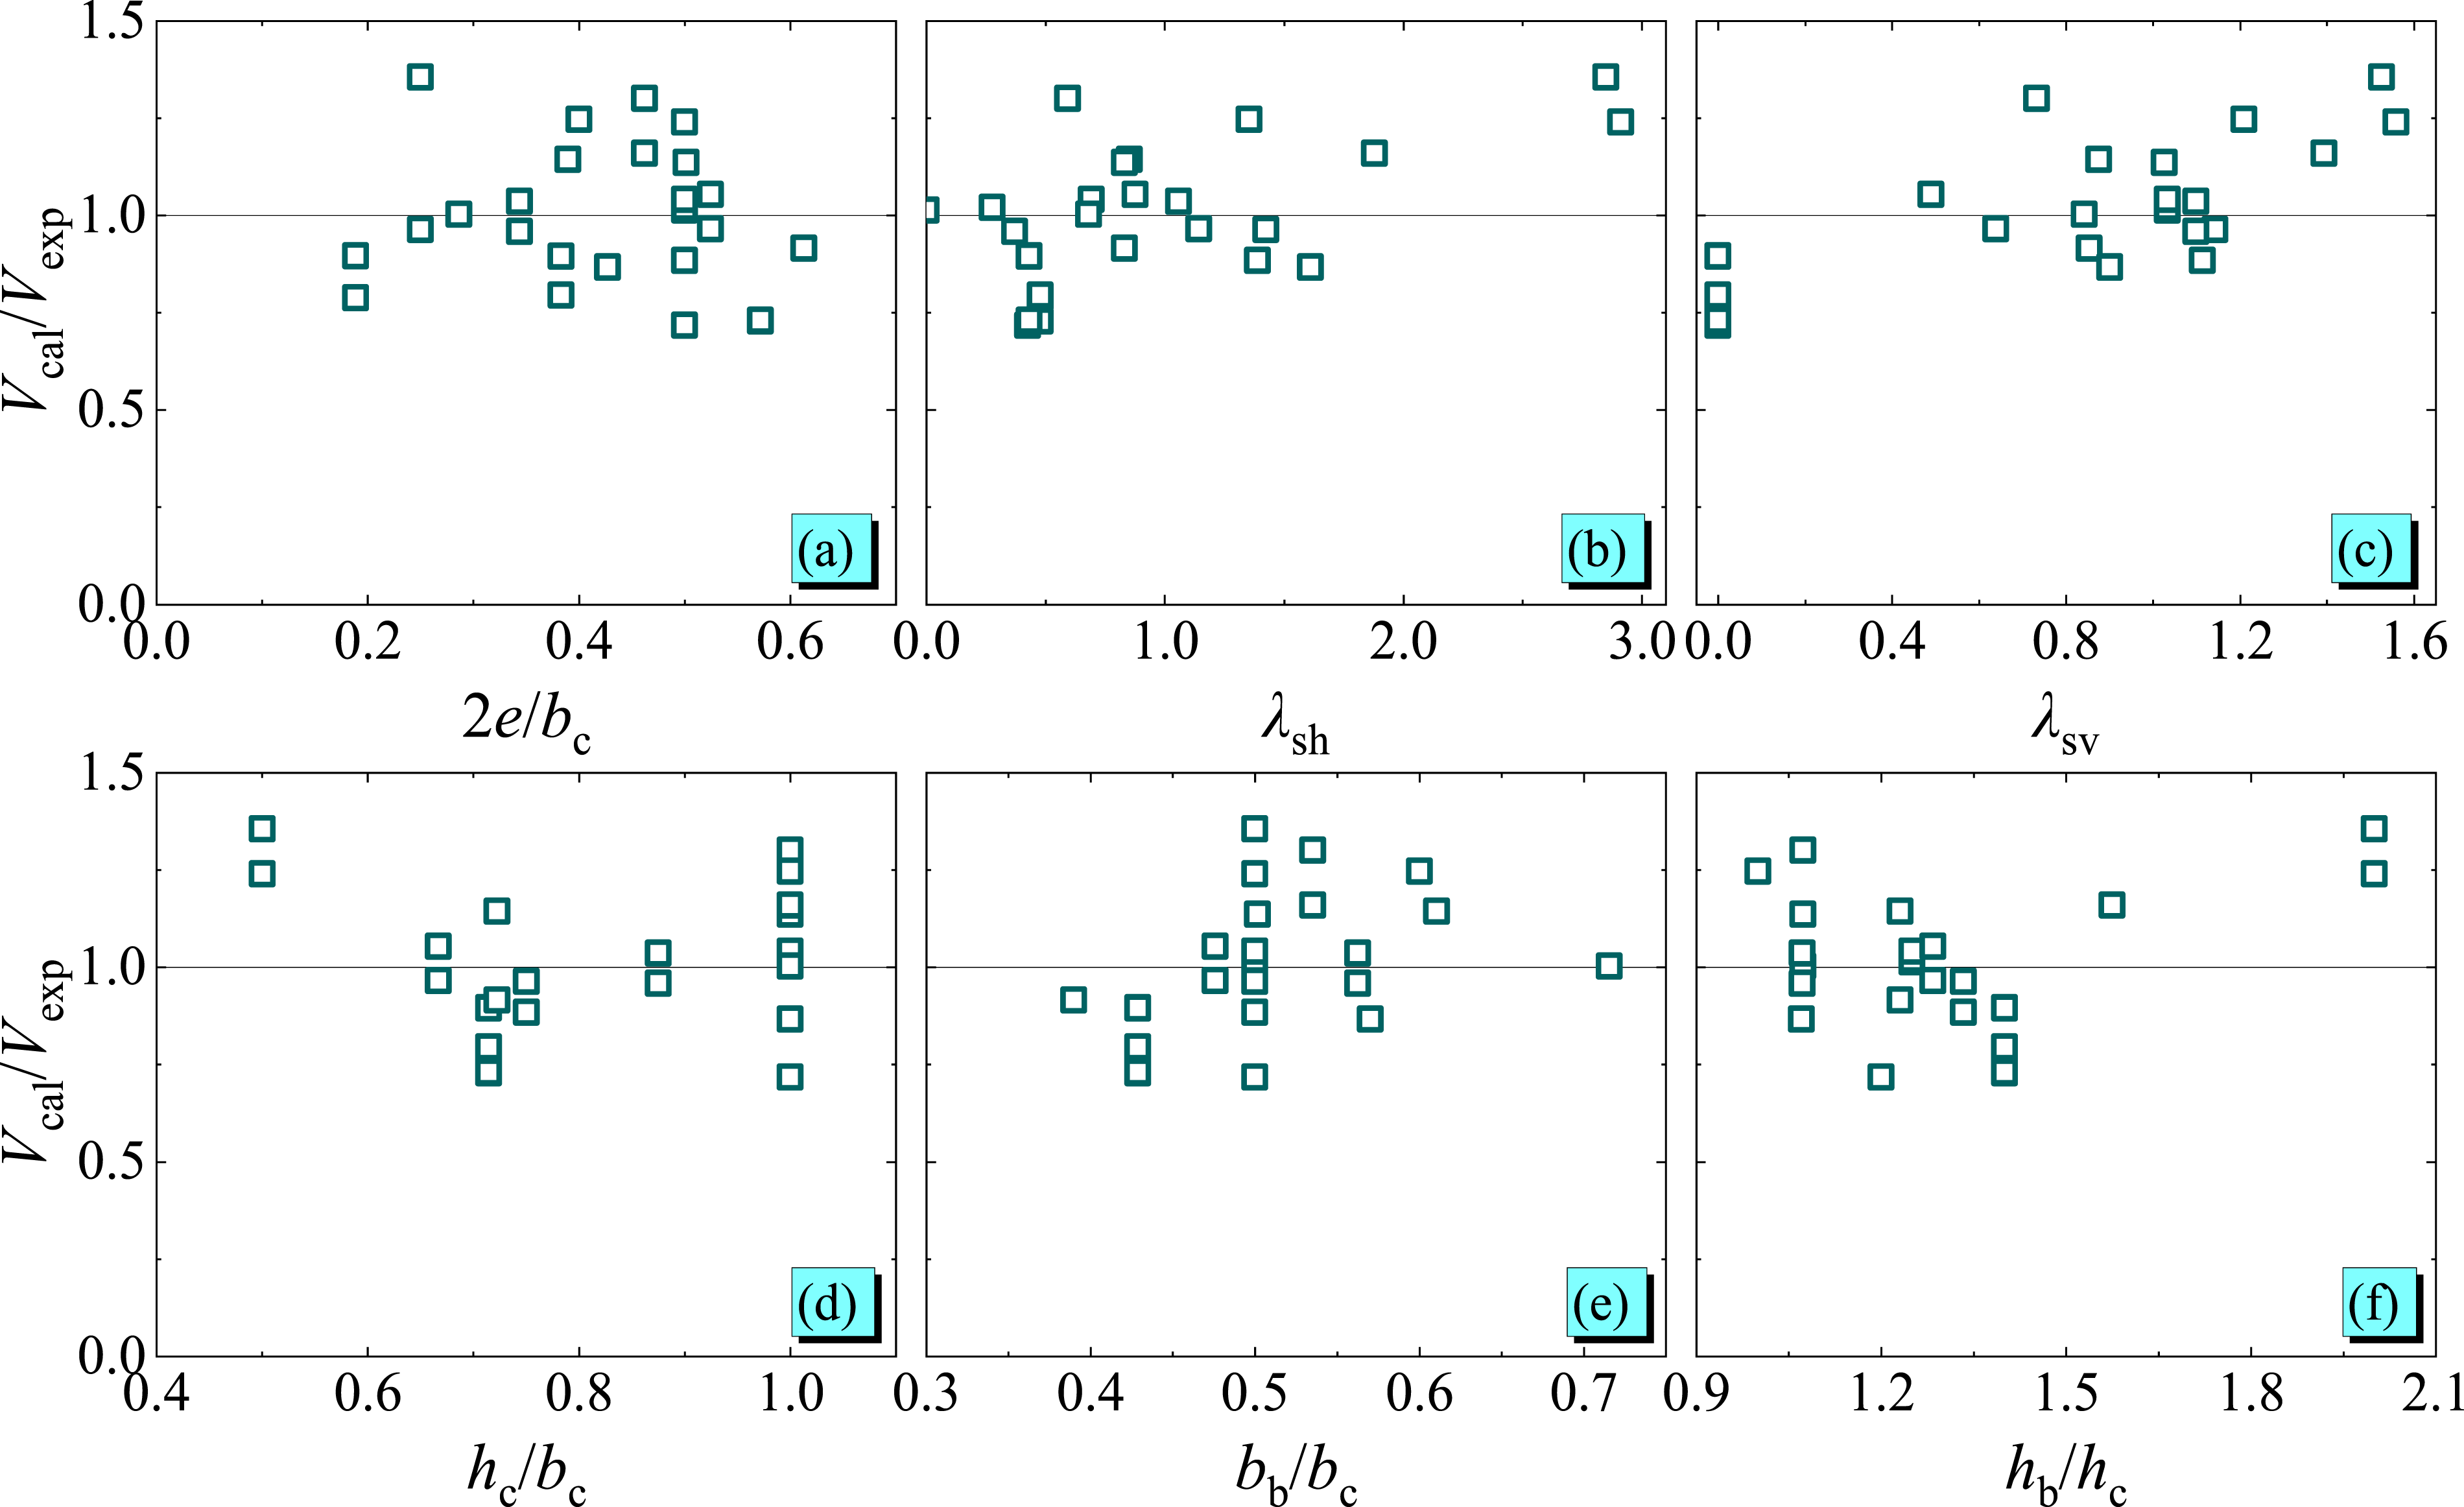
Comparisons and discussions
This section compares and evaluates the proposed formula against those from four existing codes (GB, ACI-352, ACI-318, AIJ) and Zhou’s revised formula, based on a database of RC eccentric joints established in this paper. A notable observation from the literature is that stirrup quantity, a key factor in the application conditions for these codes, is often overlooked. When the stirrup quantity does not meet code requirements, the formulas from these codes should not be directly applied. Instead, adjustments such as reducing the joint strength coefficient or calculation results are necessary. This issue is addressed in the study: for ACI-318, ACI-352, AIJ and Zhou’s revised formula, the strength factor values from Table 10-12 of ASCE/SEI 41-13 (American Society of Civil Engineers (ASCE), 2013) are utilized when the hoop reinforcement amount is below the code requirements. In contrast, the GB and the proposed formula consider the shear contribution of stirrups separately, eliminating the need for reduction in calculation results.
The evaluation of the formulas is based on three main indices: average (Avg), standard deviation (s) and the probability P (Vcal/Vexp≤1), as depicted in Figure 8. The horizontal axis in the figure represents the different formulas, while the vertical axis shows the ratio of the calculated to experimental values of the shear capacity of the eccentric joint (Vcal/Vexp). Avg and s represent the mean values and standard deviation of Vcal/Vexp, respectively. The brackets [χ0, χ100%] indicate the full distribution range of Vcal/Vexp values, while [χ25%, χ75%] and [χ2.5%, χ97.5%] represent the 50% and 95% distribution ranges, respectively. The prediction accuracy of each formula is compared based on these indices. P(Vcal/Vexp≤1) measures the frequency at which Vcal/Vexp does not exceed 1, providing a basis for assessing the safety of the formula in conjunction with the mean. Comparation of calculation results of different formulas.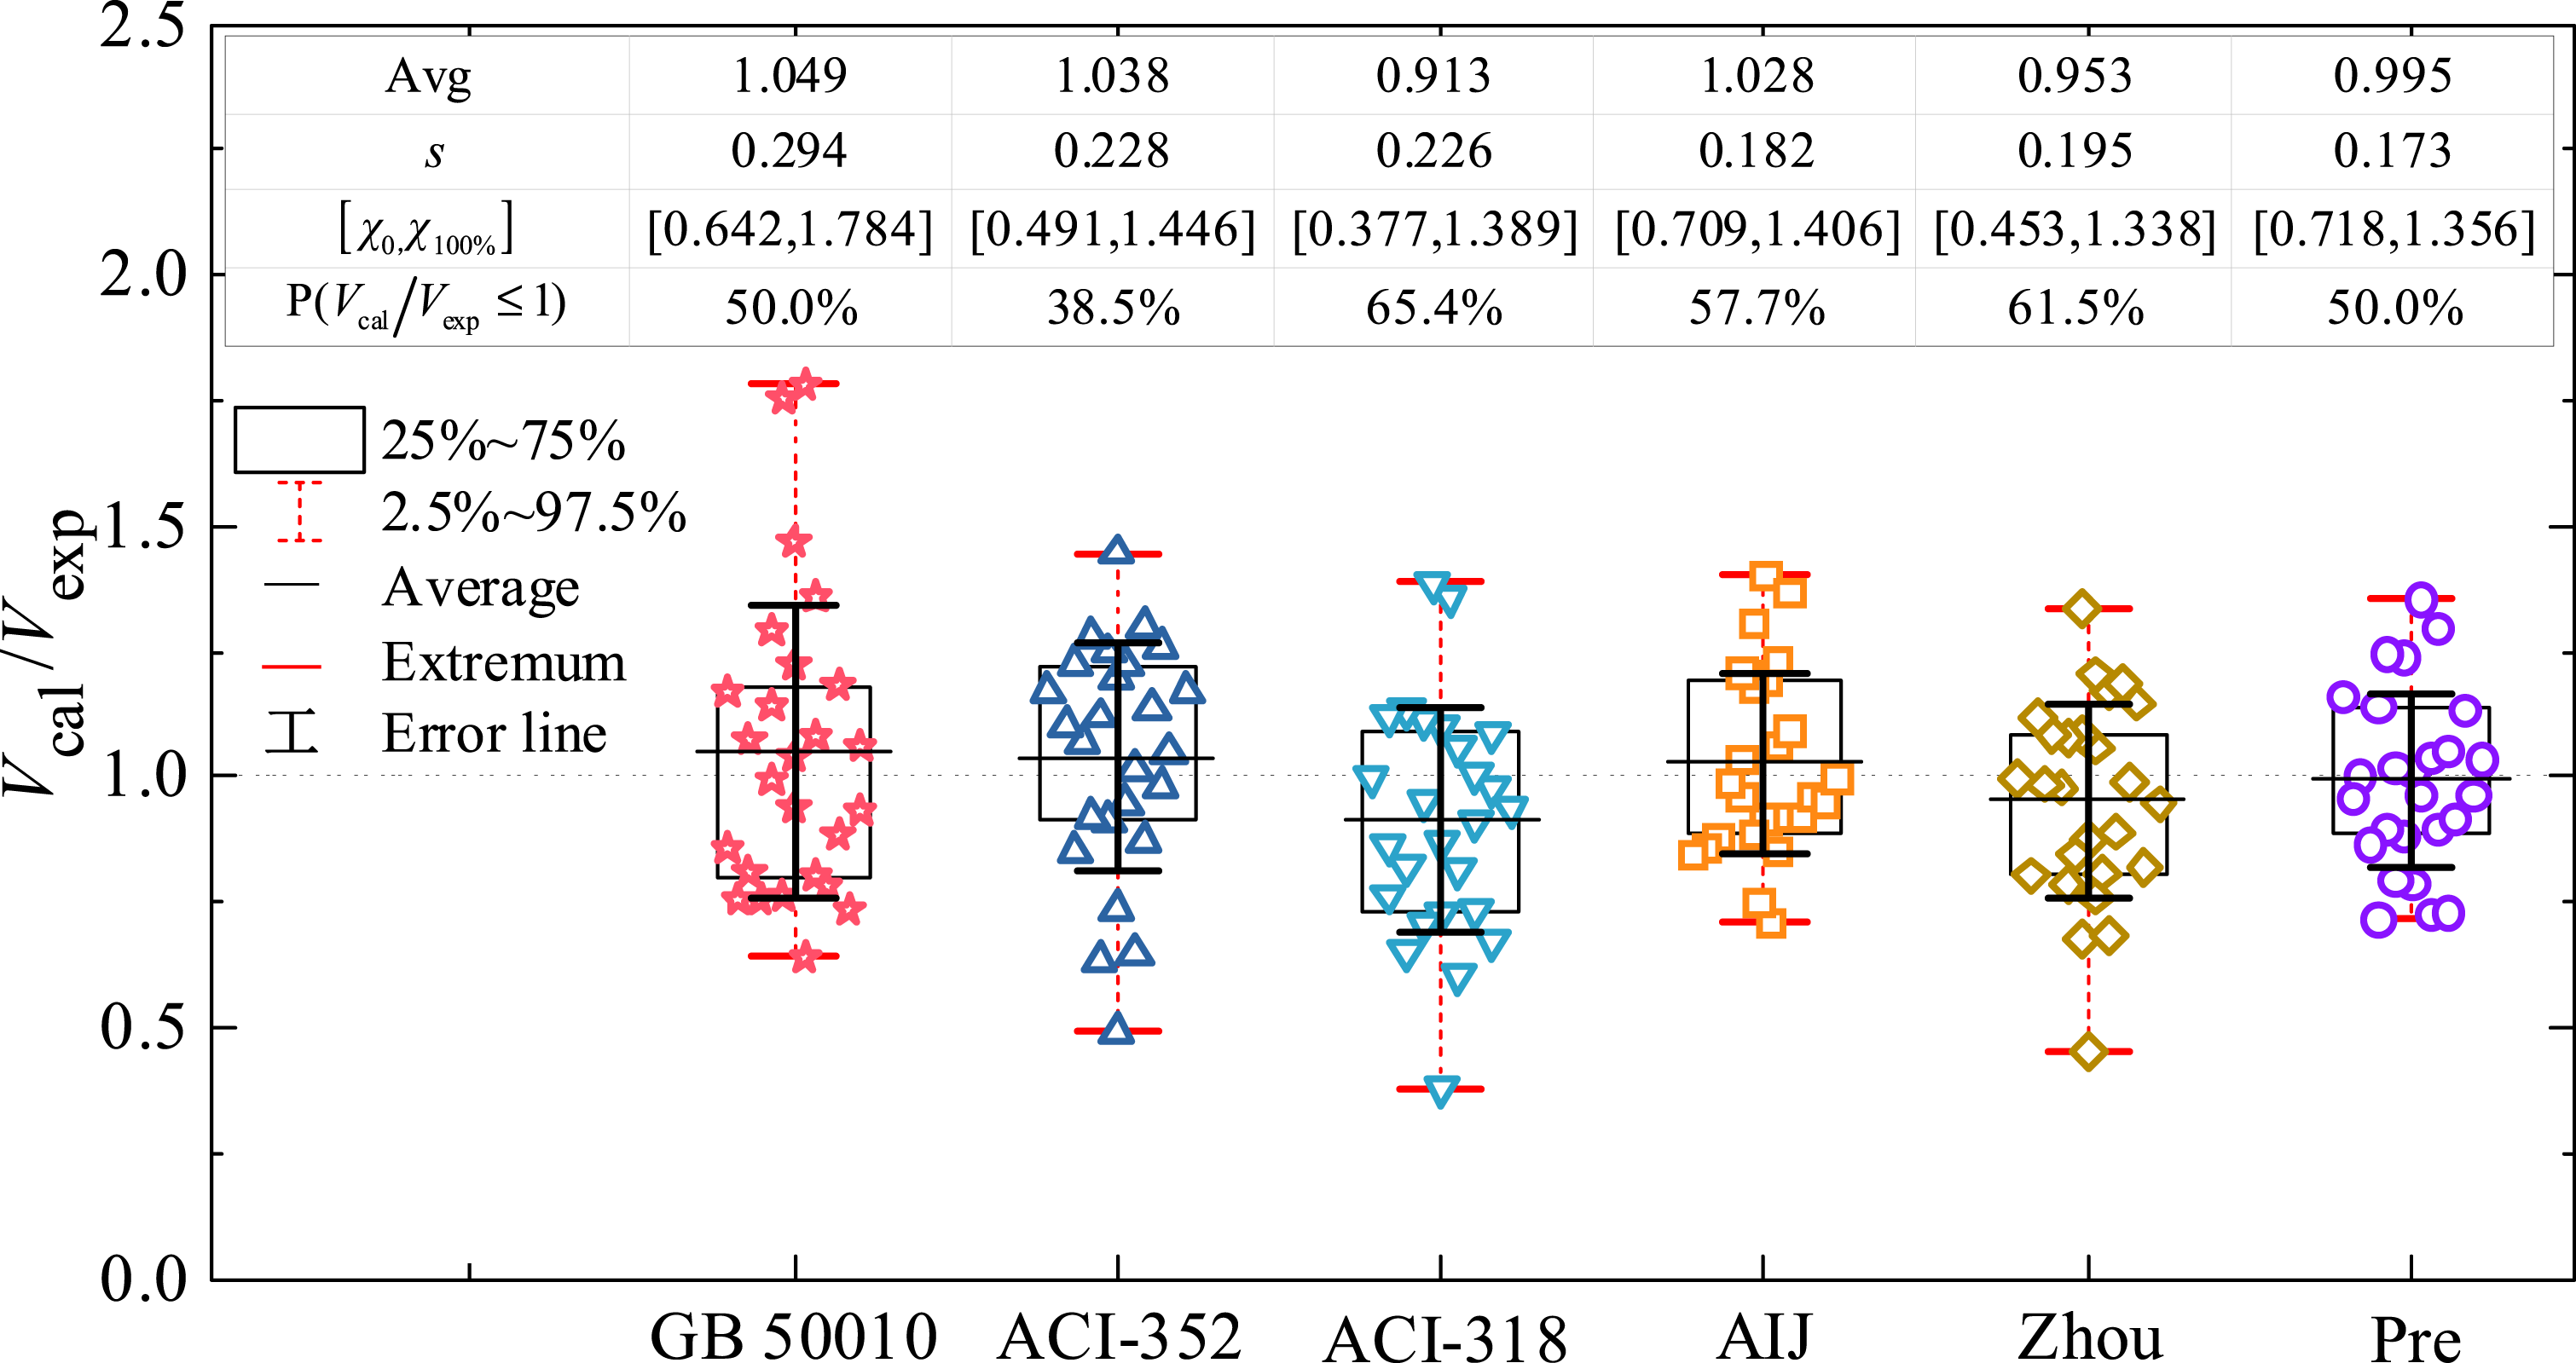
Figure 8 reveals that the average values of Vcal/Vexp ratios for all six formulas are approximately 1, with a variation range from −8.7% to 4.9%. Notably, the proposed formula demonstrates the closest average to 1 and exhibits the smallest standard deviation, indicating its high accuracy. When examining the distribution of Vcal/Vexp within the [χ25%, χ75%] interval, it is evident that the ACI-352, AIJ, Zhou, and proposed formulas yield more concentrated results. Among these, the proposed formula shows the least dispersion, suggesting a more consistent prediction performance. In contrast, the GB and ACI-318 formulas display a wider dispersion in their calculation results, indicating less consistent predictive accuracy. Consequently, the AIJ, Zhou, and proposed formulas demonstrate superior prediction performance, with the proposed formula marginally outperforming the others.
Further analysis based on the frequency P (Vcal/Vexp≤1) allows for a comparative assessment of the formulas. The ACI-352 formula shows the lowest frequency of Vcal/Vexp values being less than 1, at only 38.5%, while the other five formulas exceed 50%. Additionally, the average Vcal/Vexp ratios for ACI-318, Zhou and the proposed formula are below 1, suggesting that their predictions err on the side of safety. In contrast, the average Vcal/Vexp values for the other formulas are above 1, with the GB formula having the highest average. This analysis underscores the proposed formula’s superior prediction accuracy and safety margin.
Figure 9 presents a comparative analysis of the proposed formula and Zhou’s formula in relation to the eccentric ratio. The x-axis in Figure 9 displays the eccentricity, while the y-axes in Figure 9(a) and Figure 9(b) represent the eccentricity influence factor and Vcal/Vexp values for Zhou’s formula, respectively. Zhou’s formula incorporates the adverse effects of beam eccentricity through the eccentricity influence factor, making it a relevant point of comparison to the prediction formula in this study. Comparison of calculation results of Zhou formula. (a) Eccentric influence factor. (b) Results of the Zhou’s formula.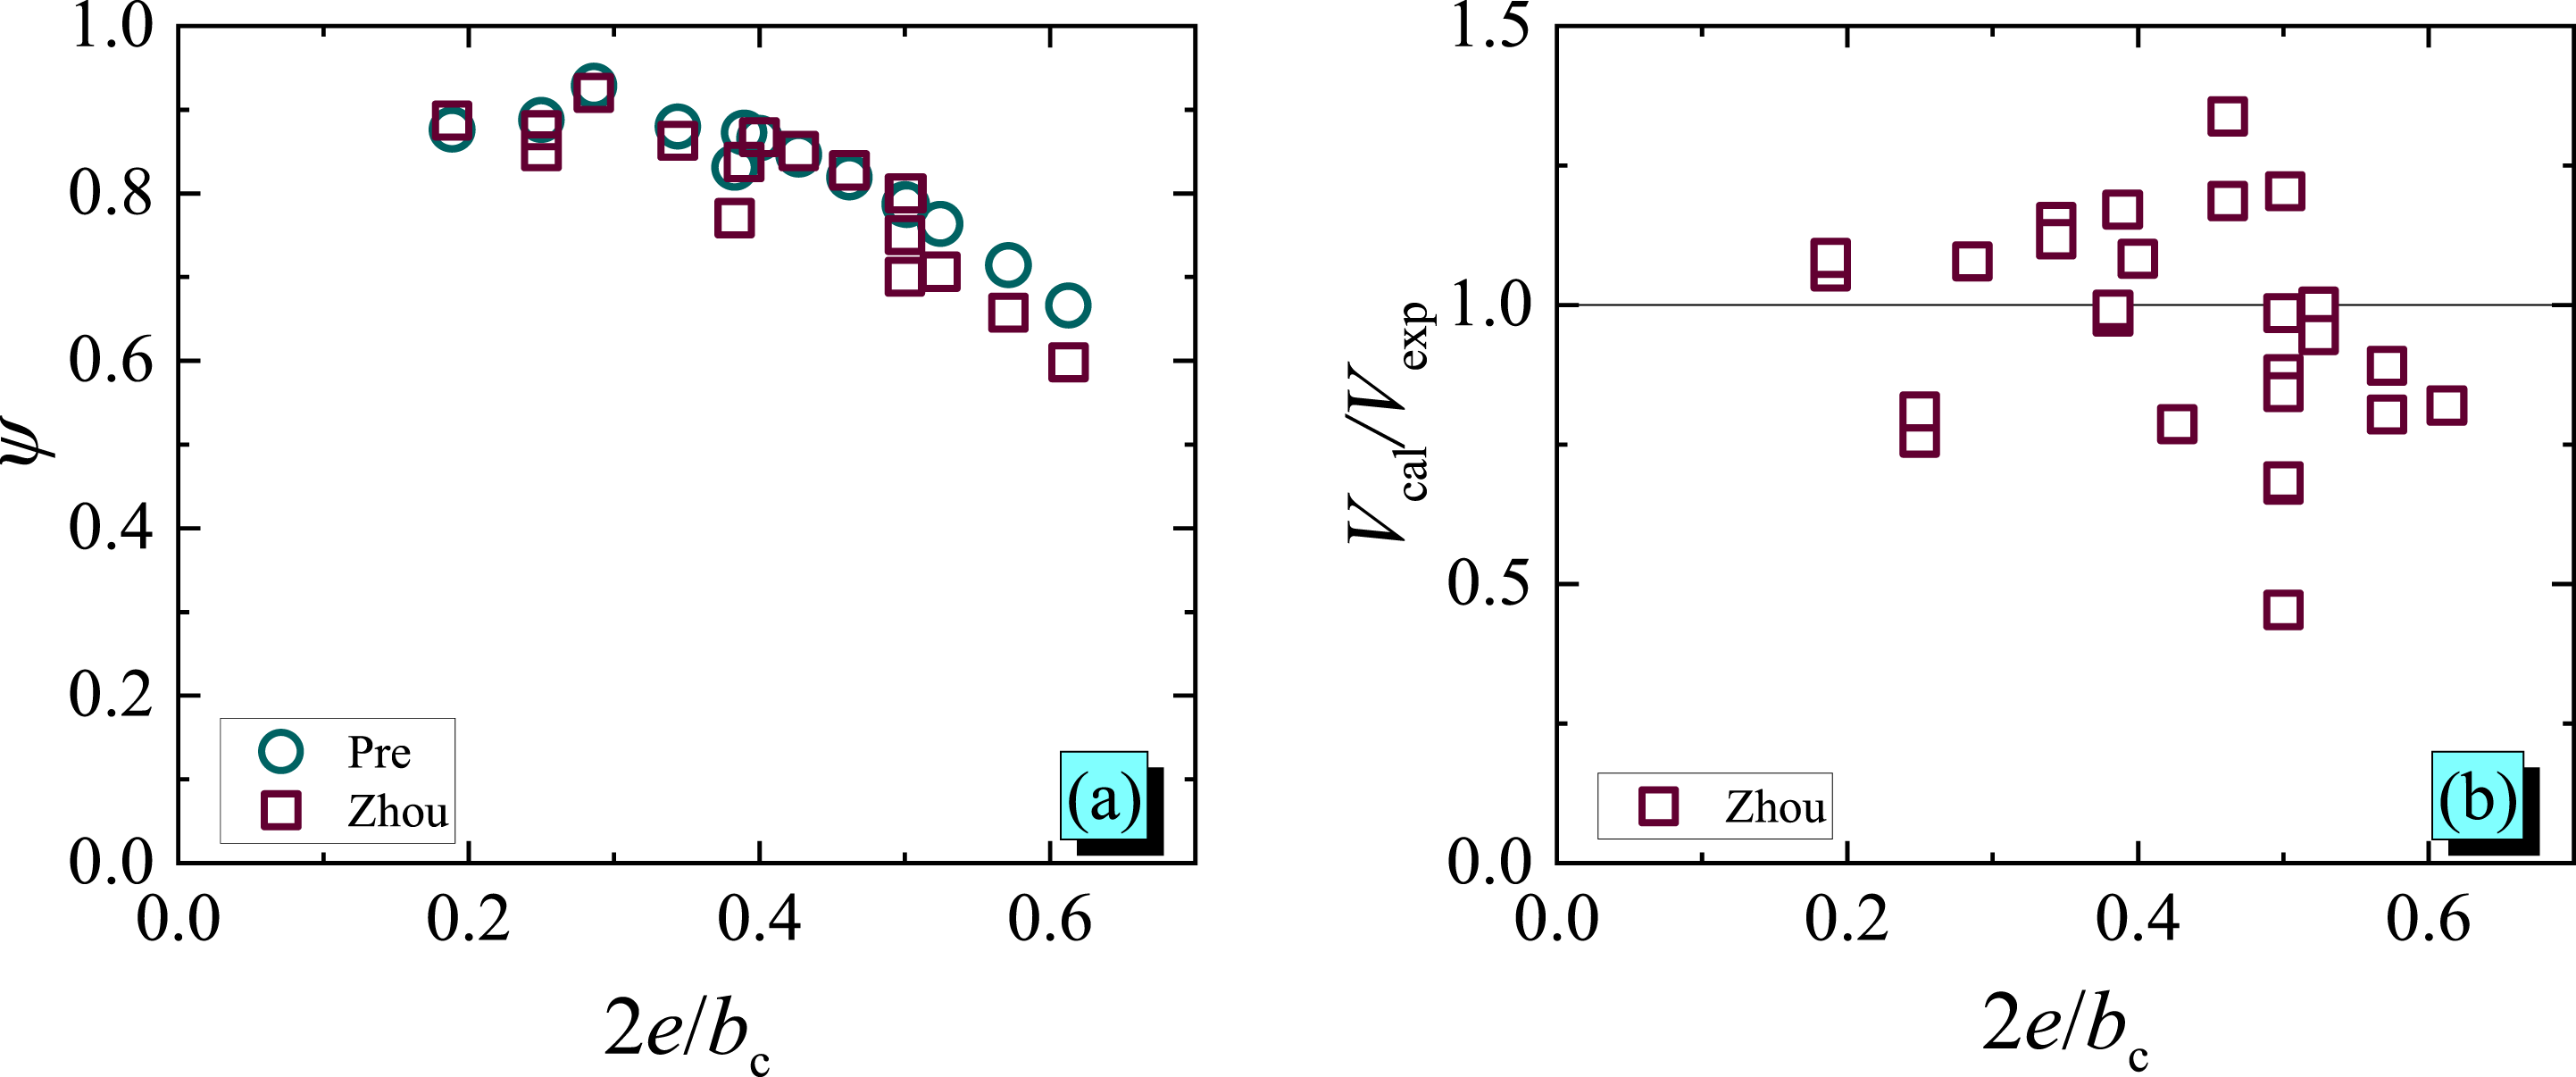
As depicted in Figure 9(a), for an eccentricity ratio of 2e/bc<0.5, the ψ values of both Zhou’s formula and the proposed formula are quite similar. However, for 2e/bc≥0.5, the ψ values of the proposed formula are marginally higher. The distribution of ψ values for the proposed formula approximates a smooth curve, suggesting that the bb/bc ratio has minimal impact on ψ. In contrast, the ψ values in Zhou’s formula are heavily influenced by the minimum of hc/bc and bc/hc, resulting in greater variability in ψ for the same eccentric ratio. This observation indicates that the proposed formula in this study more effectively accounts for the impact of beam eccentricity on the shear capacity of RC frame joints. Moreover, according to Figure 7(a) and Figure 9(b), the proposed formula shows less fluctuation in Vcal/Vexp values, especially when 2e/bc≥0.5. At similar eccentricity, the calculations from both formulas show notable differences. These discrepancies stem from the distinct shear mechanisms on which each formula is based and the varying considerations of influential factors, such as axial forces and stirrup consumption in the joint area.
Conclusions
This paper examines the negative impact of beam eccentricity on the shear capacity of the joint region and compare five existing shear calculation formulas. The effectiveness of the joint width in these five formulas was analyzed in terms of both single-factor influence and the combined effects of two factors. We introduced an enhanced formula for calculating the shear capacity of eccentric joints and evaluated it against five existing formulas using experimental data from 26 eccentric joints. Based on the discussions and analyses conducted, the following conclusions can be drawn: (1) The detrimental effects of the beam eccentricity on shear capacity formulas for eccentric joints are manifested in two ways: (a) by reducing the effective width of joint region, and (b) by applying the shear capacity formula of concentric joints, adjusted with an eccentric influence factor. The current formulas predominantly utilize the first approach, considering factors such as eccentric ratio, column depth, and beam-to-column surface distance. However, it is noted that the direct influence of the beam-to-column width ratio on the joint’s effective width is not addressed in these existing formulas. (2) The analysis of the influence of individual factors reveals that the effective width of the joint notably decreases as 2e/bc increases. Conversely, the effective width increases with rising values of bb/bc and hc/bc. When considering the combined effects of these factors, it is observed that the reductions in the effective width of the joint as per ACI-352, AIJ and Zhou’s formula are reasonably well-aligned. However, for hc/bc ratios greater than 1, the effective width according to the Chinese code is 10% to 30% higher than other formulas, potentially leading to unsafe designs. In the ACI-318 formula, the impact of bb/bc on the joint’s effective width is overlooked, resulting in an unduly conservative estimation, particularly for larger eccentricities. (3) To enhance the prediction of shear capacity in eccentric joints, an improved formula is proposed. This formula is derived by multiplying the shear capacity of a concentric joint with an eccentric influence factor, which incorporates both 2e/bc and bb/bc ratios. Additionally, the formula takes into account the beam-to-column depth ratio and the characteristic value of longitudinal reinforcement at the midsection of the column. (4) When compared to five existing shear calculation formulas, the proposed formula exhibits a high level of accuracy with a ratio of the predicted to experimental value at 0.995 and the smallest standard deviation. It offers superior predictive precision and lower variability. The formula effectively accounts for the influences of e/bc and bb/bc; however, it tends to overestimate for λsh > 1.5 and λsv > 1.2. The eccentric influence factor in the proposed formula aligns more closely with Zhou’s formula when 2e/bc<0.5, demonstrating better stability. The dispersion in the ratio of Vcal/Vexp is also reduced. Nonetheless, due to limitations in the experimental data, there remains scope for further verification and enhancement of the proposed formula.
Footnotes
Declaration of conflicting interests
The author(s) declared no potential conflicts of interest with respect to the research, authorship, and/or publication of this article.
Funding
The author(s) disclosed receipt of the following financial support for the research, authorship, and/or publication of this article: This study was financially supported by the National Natural Science Foundation of China (Grant No. 52268036), the NSF of Xinjiang Province (Grant No. 2022E02095) and and Tianshan Talent Training Program of Xinjiang Province (Grant No. 2023TSYCCX0110).
Appendix
Experimental database of eccentric joints. “C” and “NC” are abbreviations for conforming and nonconforming joint stirrups. Joint stirrup is conforming if hoops are spaced at ≤hc/2 within the joint.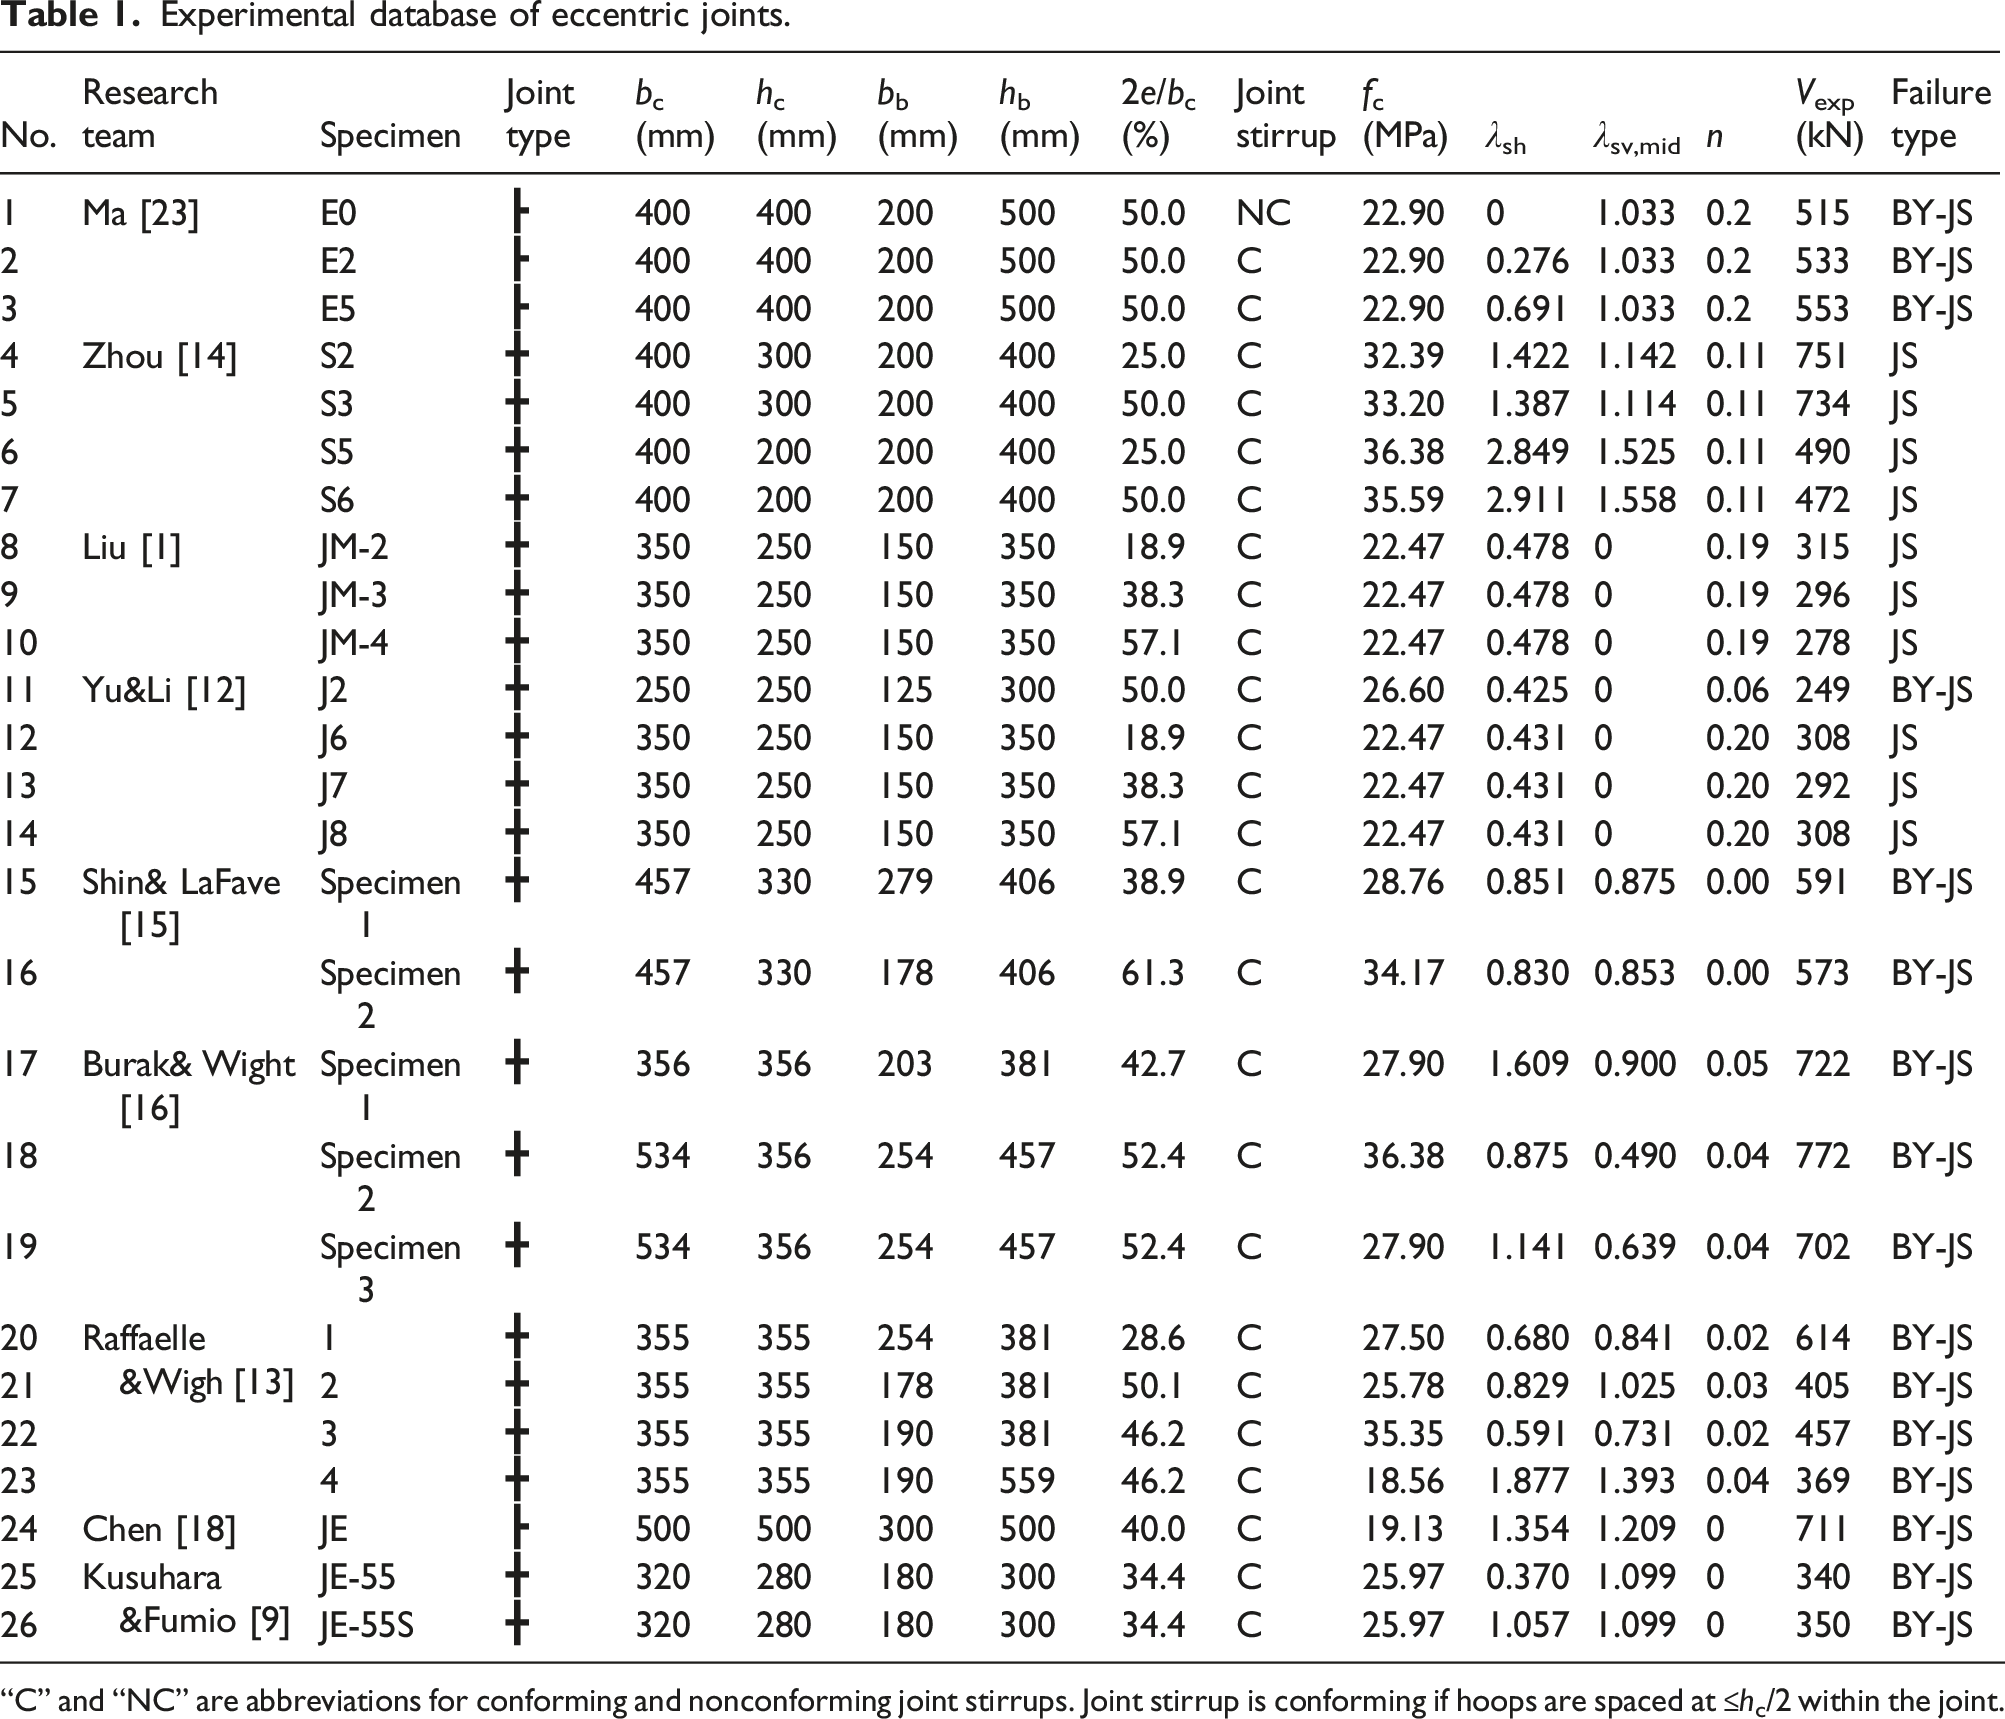
No.
Research team
Specimen
Joint type
bc (mm)
hc (mm)
bb (mm)
hb (mm)
2e/bc (%)
Joint stirrup
fc (MPa)
λ
sh
λ
sv,mid
n
Vexp (kN)
Failure type
1
Ma [23]
E0
┣
400
400
200
500
50.0
NC
22.90
0
1.033
0.2
515
BY-JS
2
E2
┣
400
400
200
500
50.0
C
22.90
0.276
1.033
0.2
533
BY-JS
3
E5
┣
400
400
200
500
50.0
C
22.90
0.691
1.033
0.2
553
BY-JS
4
Zhou [14]
S2
╋
400
300
200
400
25.0
C
32.39
1.422
1.142
0.11
751
JS
5
S3
╋
400
300
200
400
50.0
C
33.20
1.387
1.114
0.11
734
JS
6
S5
╋
400
200
200
400
25.0
C
36.38
2.849
1.525
0.11
490
JS
7
S6
╋
400
200
200
400
50.0
C
35.59
2.911
1.558
0.11
472
JS
8
Liu [1]
JM-2
╋
350
250
150
350
18.9
C
22.47
0.478
0
0.19
315
JS
9
JM-3
╋
350
250
150
350
38.3
C
22.47
0.478
0
0.19
296
JS
10
JM-4
╋
350
250
150
350
57.1
C
22.47
0.478
0
0.19
278
JS
11
Yu&Li [12]
J2
╋
250
250
125
300
50.0
C
26.60
0.425
0
0.06
249
BY-JS
12
J6
╋
350
250
150
350
18.9
C
22.47
0.431
0
0.20
308
JS
13
J7
╋
350
250
150
350
38.3
C
22.47
0.431
0
0.20
292
JS
14
J8
╋
350
250
150
350
57.1
C
22.47
0.431
0
0.20
308
JS
15
Shin& LaFave [15]
Specimen 1
╋
457
330
279
406
38.9
C
28.76
0.851
0.875
0.00
591
BY-JS
16
Specimen 2
╋
457
330
178
406
61.3
C
34.17
0.830
0.853
0.00
573
BY-JS
17
Burak& Wight [16]
Specimen 1
╋
356
356
203
381
42.7
C
27.90
1.609
0.900
0.05
722
BY-JS
18
Specimen 2
╋
534
356
254
457
52.4
C
36.38
0.875
0.490
0.04
772
BY-JS
19
Specimen 3
╋
534
356
254
457
52.4
C
27.90
1.141
0.639
0.04
702
BY-JS
20
Raffaelle &Wigh [13]
1
╋
355
355
254
381
28.6
C
27.50
0.680
0.841
0.02
614
BY-JS
21
2
╋
355
355
178
381
50.1
C
25.78
0.829
1.025
0.03
405
BY-JS
22
3
╋
355
355
190
381
46.2
C
35.35
0.591
0.731
0.02
457
BY-JS
23
4
╋
355
355
190
559
46.2
C
18.56
1.877
1.393
0.04
369
BY-JS
24
Chen [18]
JE
┣
500
500
300
500
40.0
C
19.13
1.354
1.209
0
711
BY-JS
25
Kusuhara &Fumio [9]
JE-55
╋
320
280
180
300
34.4
C
25.97
0.370
1.099
0
340
BY-JS
26
JE-55S
╋
320
280
180
300
34.4
C
25.97
1.057
1.099
0
350
BY-JS