
Abstract
The composite column, which consists of an external engineered cementitious composite (ECC) jacket and internal normal concrete, is a promising approach improving seismic performance. However, the cyclic behavior and design methodology have not been investigated extensively. This study experimentally investigates the cyclic performance of the composite column, focusing on variables such as the ECC jacket thickness, axial load ratio, etc. The cracking pattern, hysteretic response, and failure modes are observed and analyzed. The composite column exhibits improving cracking control and damage tolerance capabilities, with peak force and deformability 1.15 and 1.25 times higher than those of the RC column, respectively. Using a thicker ECC jacket may not obviously enhance the bearing capacity and may potentially diminish the ductility. A numerical model was developed and validated, followed by a comprehensive parametric analysis to elucidate the underlying impact mechanisms. A formula for determining the optimal thickness of the ECC jacket is proposed to balance the bearing capacity and ductility of composite columns. Typically, when the compressive strength of ECC is within the range of 2.0 to 3.0 times the concrete, the thickness of the ECC jacket decreases linearly from 0.25 to 0.15 times the side length of the column.
Introduction
Reinforced concrete columns are critical components in RC frames, designed to resist axial loads under service conditions and lateral forces during earthquakes. However, post-earthquake investigations reveal that conventional RC columns are prone to severe damage, including concrete spalling, crushing, and collapse, under strong seismic events (Wang, 2008; Zhao et al., 2009). The repair of such damaged columns is often technically difficult and time-consuming, leading to prolonged disruption and considerable economic loss.
New materials are beneficial for damage control during seismic events and rapid post-earthquake rehabilitation (Ji et al., 2023; Li, 2003; Said and Razak, 2016). Specifically, the engineered cementitious composite (ECC) is distinguished for its tensile hardening, superior ultimate tensile and compressive strain compared with normal concrete (NC) (Tian et al., 2022a, 2024a, 2024b; Wu et al., 2023). These distinctive features have attracted much attention from researchers (Cao et al., 2024; Cheng et al., 2025; Tian et al., 2022b; Ye et al., 2019; Zhu et al., 2025). Cyclic tests have demonstrated that ECC columns exhibit improved damage tolerance and deformability over conventional reinforced concrete columns, due largely to ECC’s inherent ductility and its compatibility with embedded reinforcement (Fischer and Li, 2002). Further experimental studies confirm that ECC columns achieve notable enhancements in damage control and deformation capacity (Jia et al., 2020; Wu et al., 2017; Zhang et al., 2019a). Nevertheless, fabricating entire columns from ECC does not fully utilize its material advantages in a cost-effective manner. The high material expense also limits the practical adoption of fully ECC-based columns.
To optimize the use of ECC, a composite column system combining ECC with conventional concrete has been proposed. One common strategy is to place ECC in the plastic hinge region, creating an ECC–RC composite column (Xu et al., 2017). Experimental studies (Xu et al., 2021; Zhang et al., 2019b) have demonstrated that this configuration improves the column’s mechanical performance and enhances material efficiency. However, a stiffness discontinuity at the concrete-ECC interface can increase the risk of local cracking.
A promising alternative is the ECC–NC composite column, which features an external ECC jacket surrounding a conventional concrete core. This configuration allows full utilization of ECC’s superior properties while providing effective confinement to the inner concrete. Research on such composite columns has demonstrated their mechanical advantages. Li et al. (2019) reported that under uniaxial loading, confinement from the ECC jacket, rather than stirrups, was the dominant factor enhancing peak strength by up to 21%, and proposed a corresponding strength prediction model. Deng et al. (2018) tested short composite columns, shear span ratio = 1.66, under cyclic loading, observing shear-dominated failure with distinct diagonal cracking, and developed a method for estimating shear capacity. Pan et al. (2020) further examined the effects of axial load ratio and stirrup spacing on short columns, shear span ratio = 1.75, noting that composite columns showed improved shear capacity, energy dissipation, and ductility compared to RC columns, with greater ductility and energy dissipation achieved at lower axial load ratios and larger stirrup spacings.
However, existing research on ECC–NC composite columns has focused mainly on short columns under cyclic loading, with slender columns receiving limited attention. Moreover, prior studies have typically employed ECC with compressive strengths around 30 MPa, similar to conventional concrete. With material advancements now enabling ECC strengths exceeding 70 MPa, the use of such high-performance ECC in composite columns remains largely unexplored. Key design parameters, particularly the ECC jacket thickness, also lack systematic investigation. Currently, jacket thickness and ECC properties are often determined empirically, hindering practical application. There is therefore a clear need for experimental studies to evaluate the cyclic performance of ECC–NC composite columns and support the development of rational design methods.
This study conducted experiments to investigate the damage mechanism and design methodology of the ECC–NC composite column. In total, five columns, comprising four composite columns and one RC column, were designed and tested. The experimental focus is on variables such as the thickness of the ECC jacket, axial load ratio, and concrete removal. The cracking patterns, cyclic responses, and failure modes were observed to gain insights into the damage mechanism of composite columns with a high compressive strength of ECC. Based on the test results, a numerical model was developed using OpenSees, which can effectively replicate the hysteretic responses of all columns. Subsequently, parametric analysis was conducted based on this verified model. The optimal formula for the ECC jacket was derived, leveraging the superior properties of ECC to balance the bearing capacity and ductility of composite columns.
Experimental program
Specimen design
Design parameters of tested specimens.
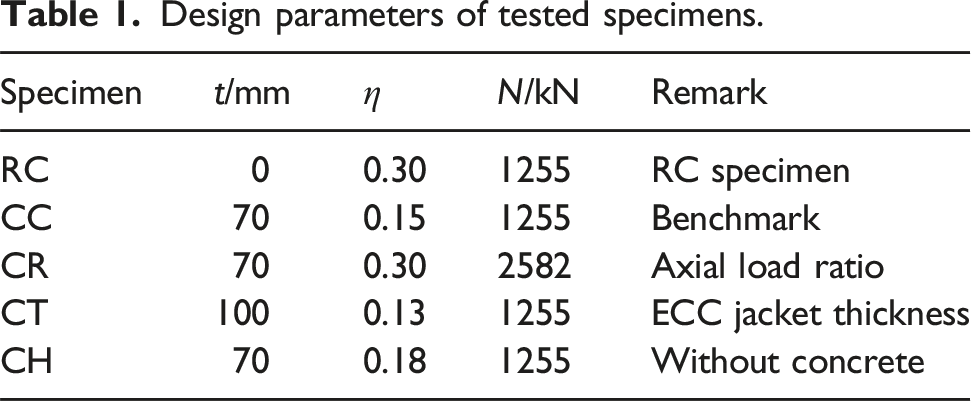
To design the specimen, a common real RC square column was considered as the prototype (He, 2023). This reference column had a side length of 600 mm, shear span ratio of 4.0, reinforcement ratio of 1.6%, and actual axial load ratio η of 0.3. According to the capacity of the test setup, the scale factor of 2/3 was determined. The test RC specimen, denoted as RC, had a side length of 400 mm, with the same reinforcement ratio, shear span ratio, and η as the prototype. The benchmark composite specimen, labeled as CC, had the same dimensions, reinforcement ratio, and axial load as RC. An ECC jacket with a thickness of 70 mm was selected to accommodate the reinforcements and stirrups. The other composite specimens were named based on the designed parameters. For example, CR had a test axial load ratio of 0.3, CT had an ECC with a jacket thickness of 100 mm, and CH employed a hollow jacket configuration.
Notably, except for CR, all specimens withstood the same axial load. The value of η can be calculated using equation (1), where N is the test axial load, fc,c and fc,e are the cylinder compressive strength of NC and ECC, and Ac and Ae are the areas of NC and ECC, respectively. Even under the same axial load, specimens with different areas of NC or ECC have different η values.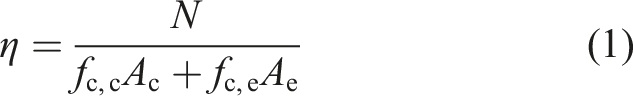
Figure 1 shows the details of the specimens. All specimens had the same side length of 400 mm and a clear height of 1600 mm, corresponding to a shear span ratio of 4.0. Eight longitudinal reinforcements with a diameter of 20 mm were adopted with the same reinforcement ratio as the reference column, and 8-mm-diameter stirrups were used with a spacing of 100 mm. The clear cover layer of all specimens was 25 mm. The footing had a size of 1400 mm × 600 mm × 700 mm, and the footing top was furnished with an ECC layer of 100 mm to prevent any potential damage during the test. During construction, the prefabricated ECC jacket was placed within the rebar cage of the footing, followed by the pouring of the footing and the column’s NC. Diagram of specimen (mm).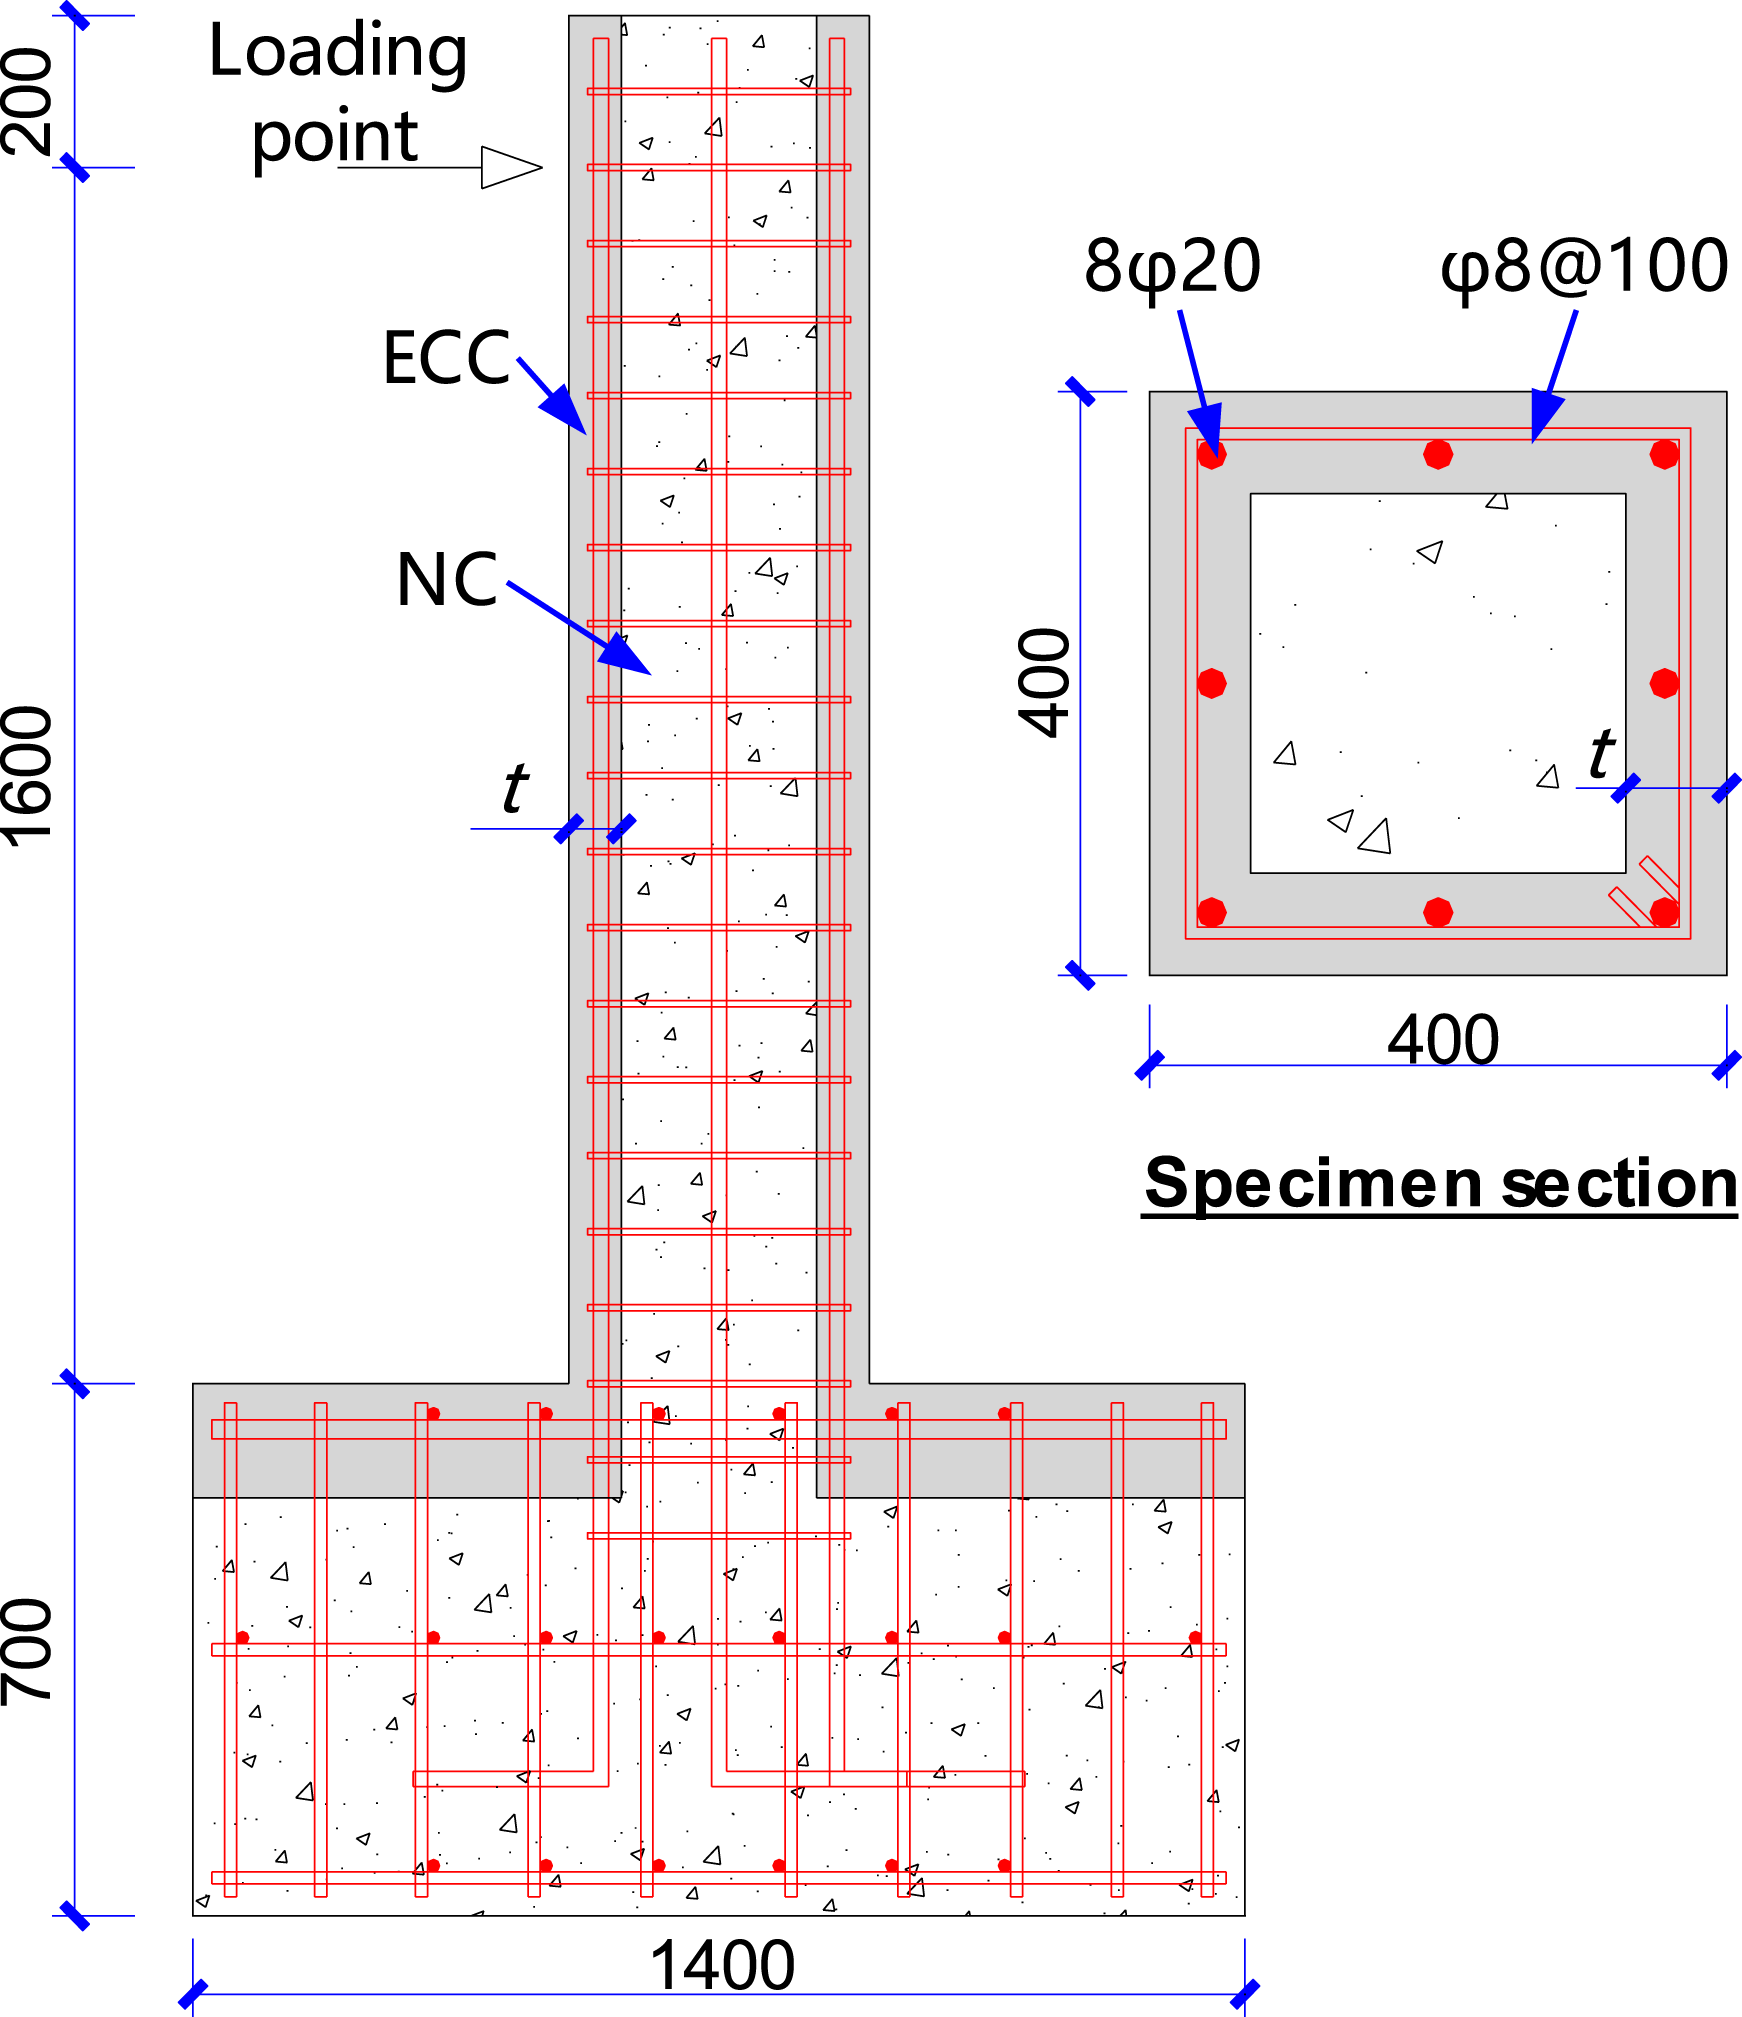
Mix proportions of ECC [kg/m3].
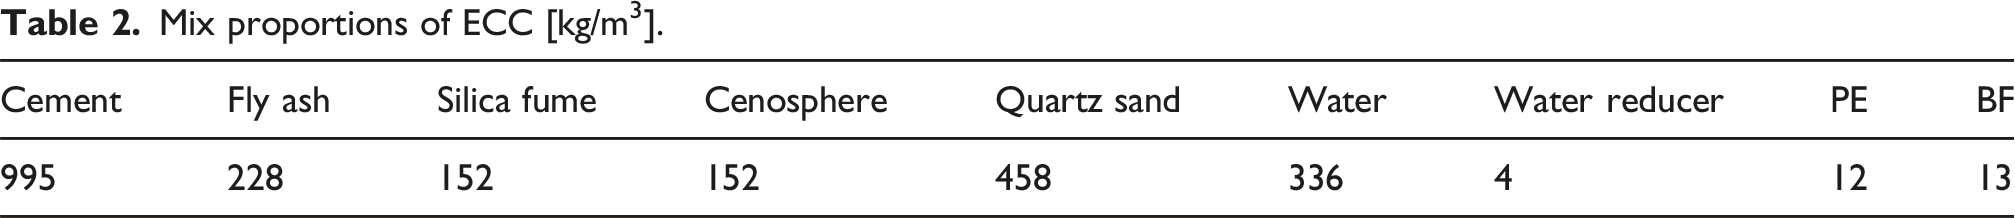
The ECC material exhibits inherent property variability, especially in terms of tensile strength and peak tensile strain. To ensure consistent quality, the following standardized procedures were implemented. A high-speed mixer was employed during ECC preparation. First, the dry ingredients were mixed slowly until uniform. Fibers were then added and mixed thoroughly within 2 min. Subsequently, water and water reducer were introduced, and the rotational speed was increased to approximately 5000 r/min. Mixing continued for 5 min to ensure complete fiber dispersion and to prevent clumping. The fresh mixture was cast immediately after mixing. During casting, a high-frequency vibrating rod was used to ensure proper compactness. Finally, the specimens were cured under moist conditions for at least 7 days to prevent surface drying and cracking.
Material properties.
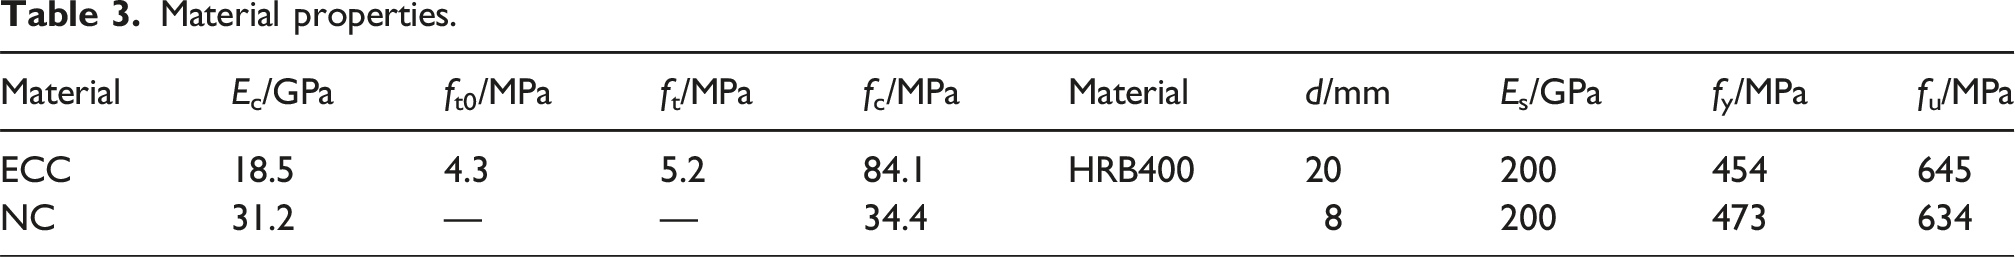
Tensile material test of ECC.
Loading and measurement system
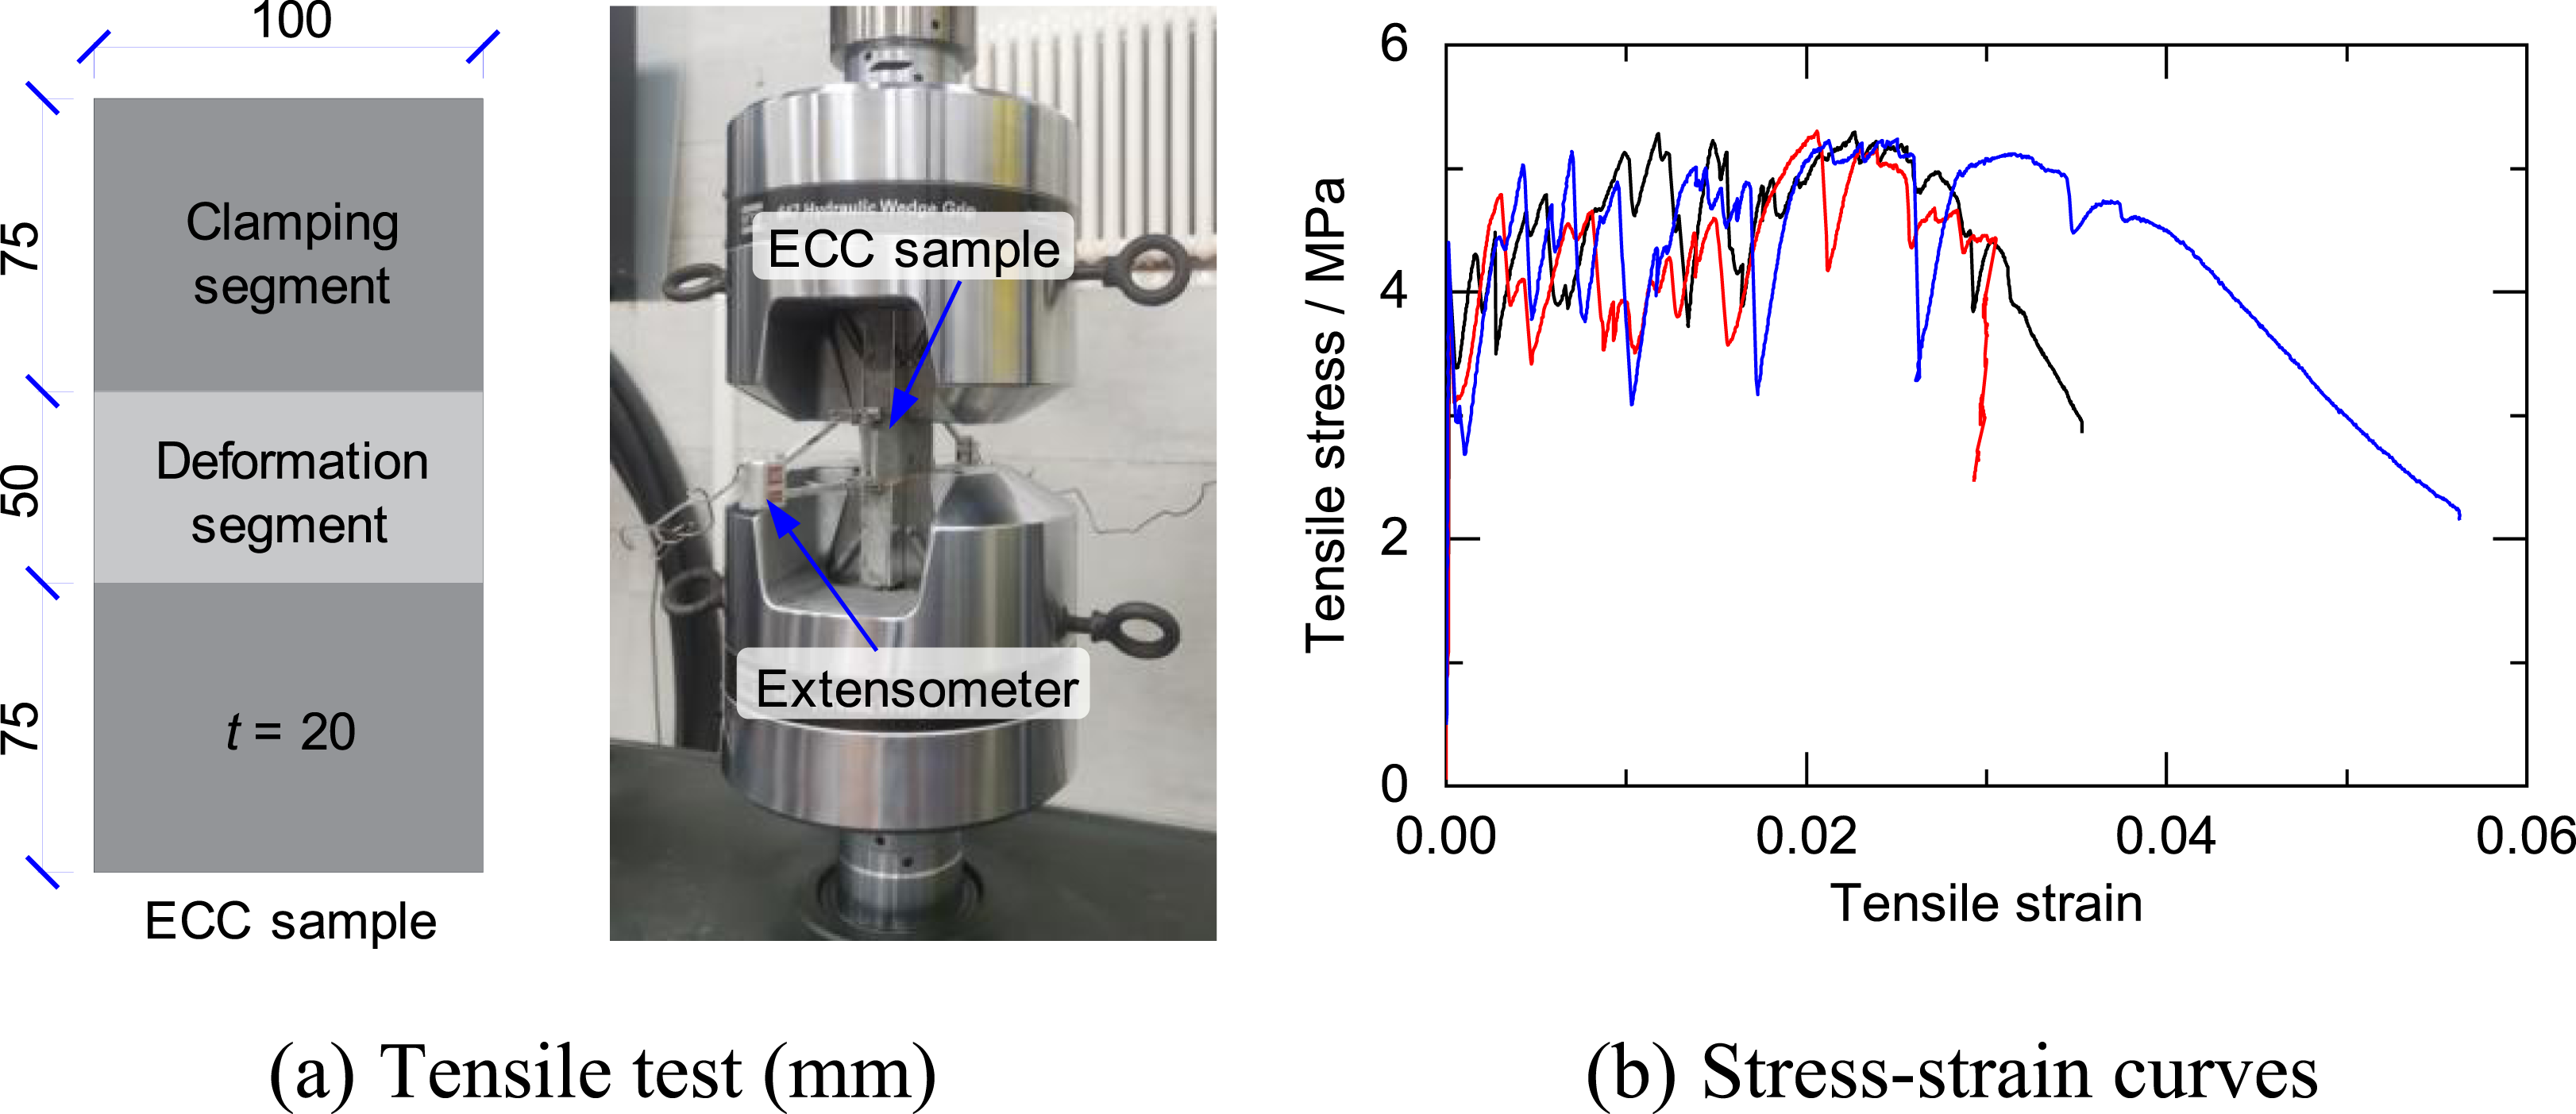
Figure 3(a) shows a photograph of the test setup. Four vertical high strength bolts and two lateral restrainers were used to fix the footing on the reaction floor. A vertical 500-t jack was used to apply the design axial load on the specimen top, and a lateral 100-t actuator was adopted to impose the cyclic displacement at the clear height. The lateral displacement protocol is presented in Figure 3(b). The drift ratio (DR), defined as the lateral displacement divided by the clear height, was used in the test. The DR amplitudes changed from 1/2000 to 1/20, including the limit values of elastic story DR of 1/550 and elastic-plastic story DR of 1/50 in RC frames (MOHURD, 2010b), and each DR cycled three times. To ensure clarity and facilitate graphical presentation of the test results, drift ratios were expressed as percentages in the subsequent analyses and figures. The applied drift levels increased incrementally from 0.05% to 0.5%. The adopted protocol can accurately capture structural behaviors such as cracking and yielding (Deng et al., 2017). When the lateral force dropped to 0.85 times the peak force, the test was terminated for safety reasons. Loading setup and protocol.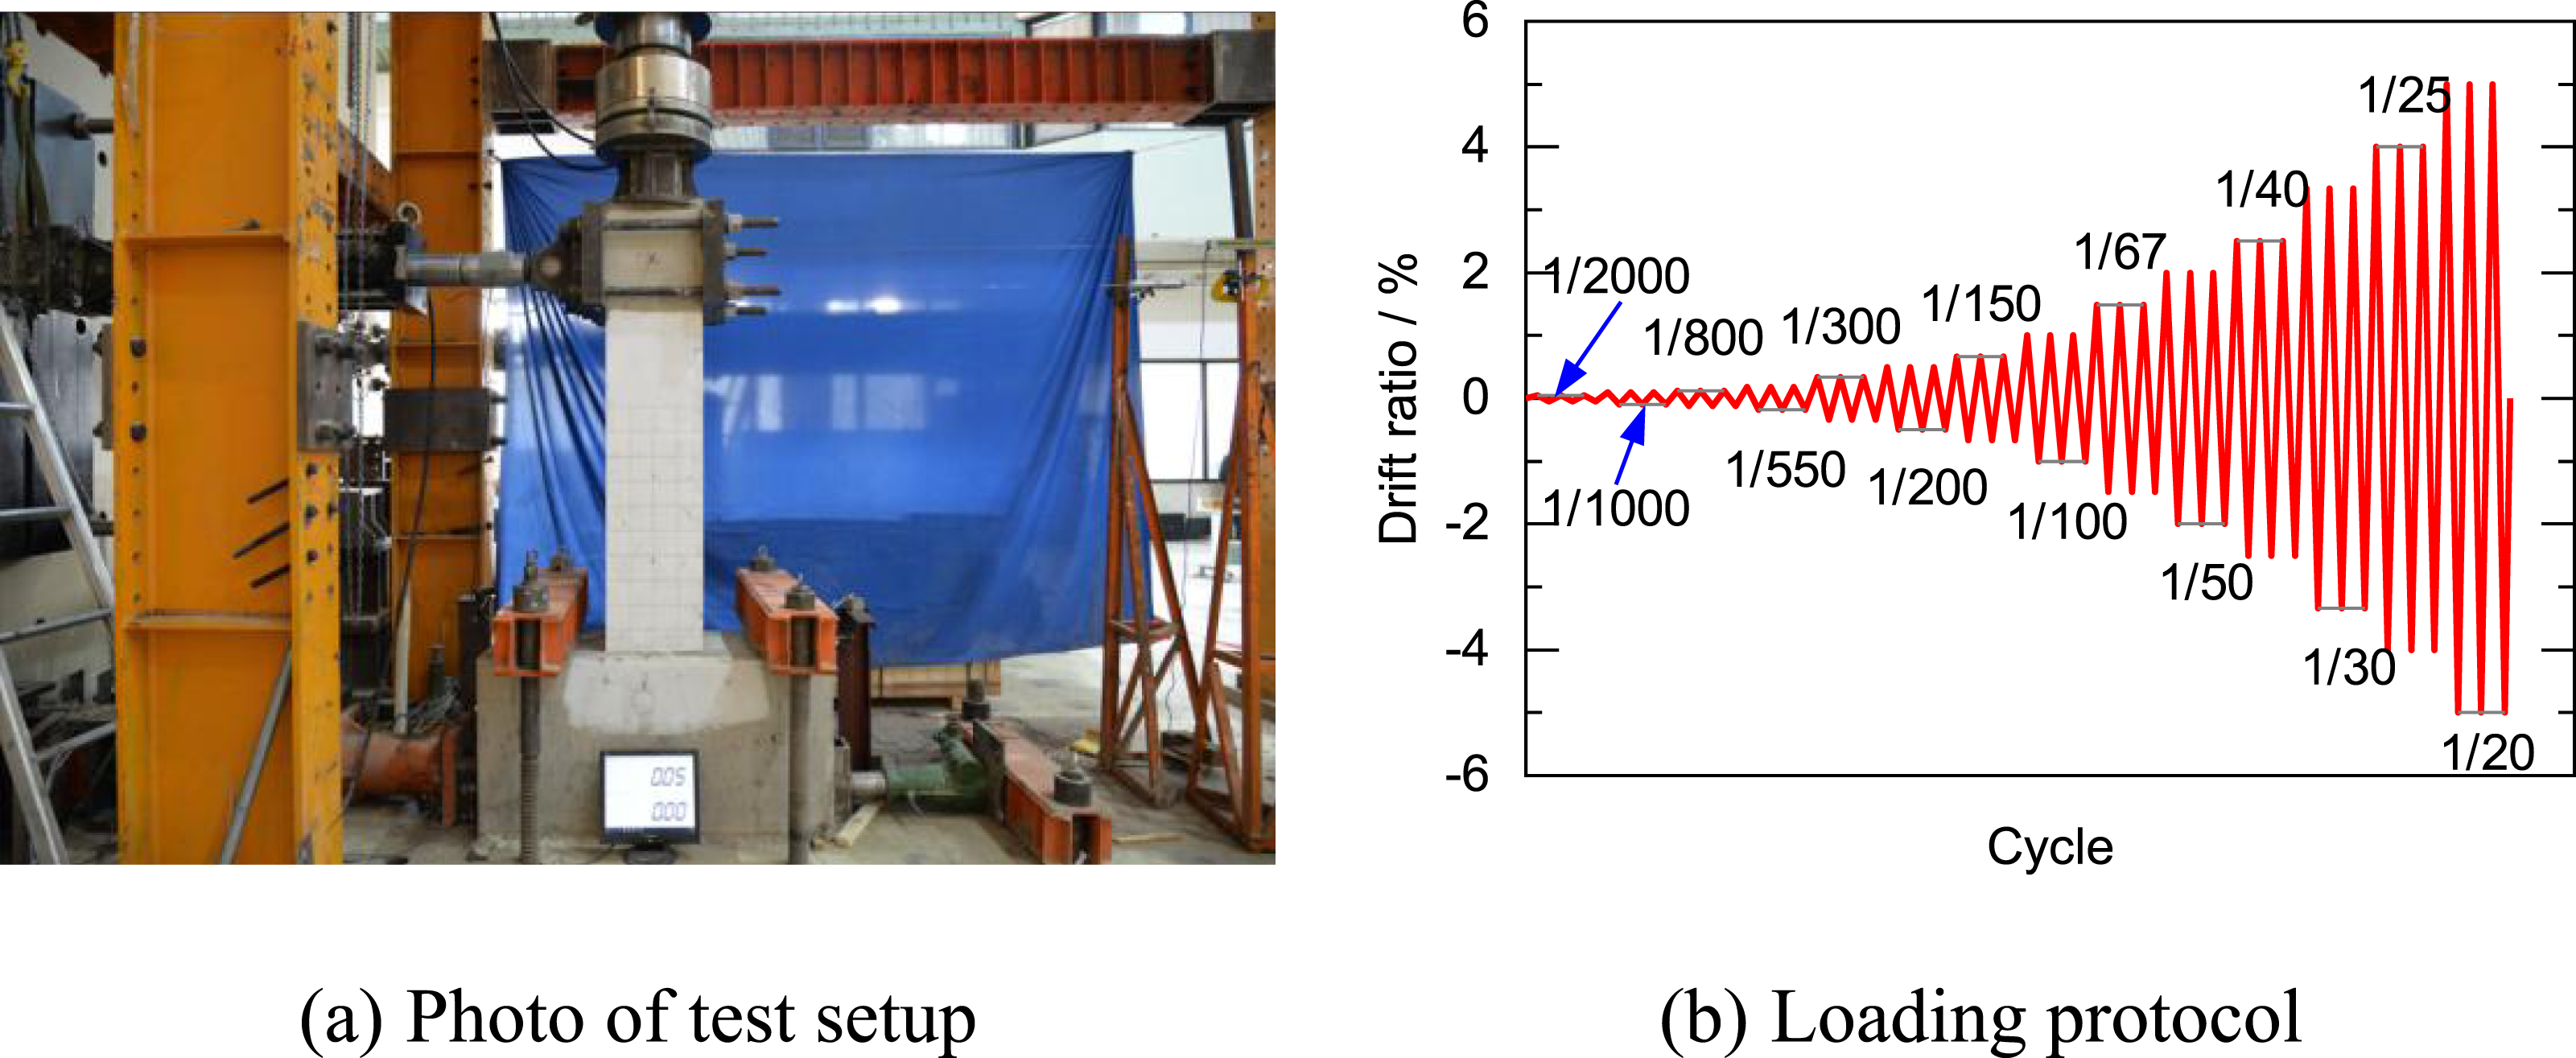
The measurement system is presented in Figure 4. One linear variable differential transformer (LVDT) was attached at the clear height to record the lateral displacement, which was also the controlling displacement during the test. Four strain gauges were stuck on the reinforcements at the specimen bottom, and another four gauges were affixed to the stirrups to monitor the strain changes. Measurement system.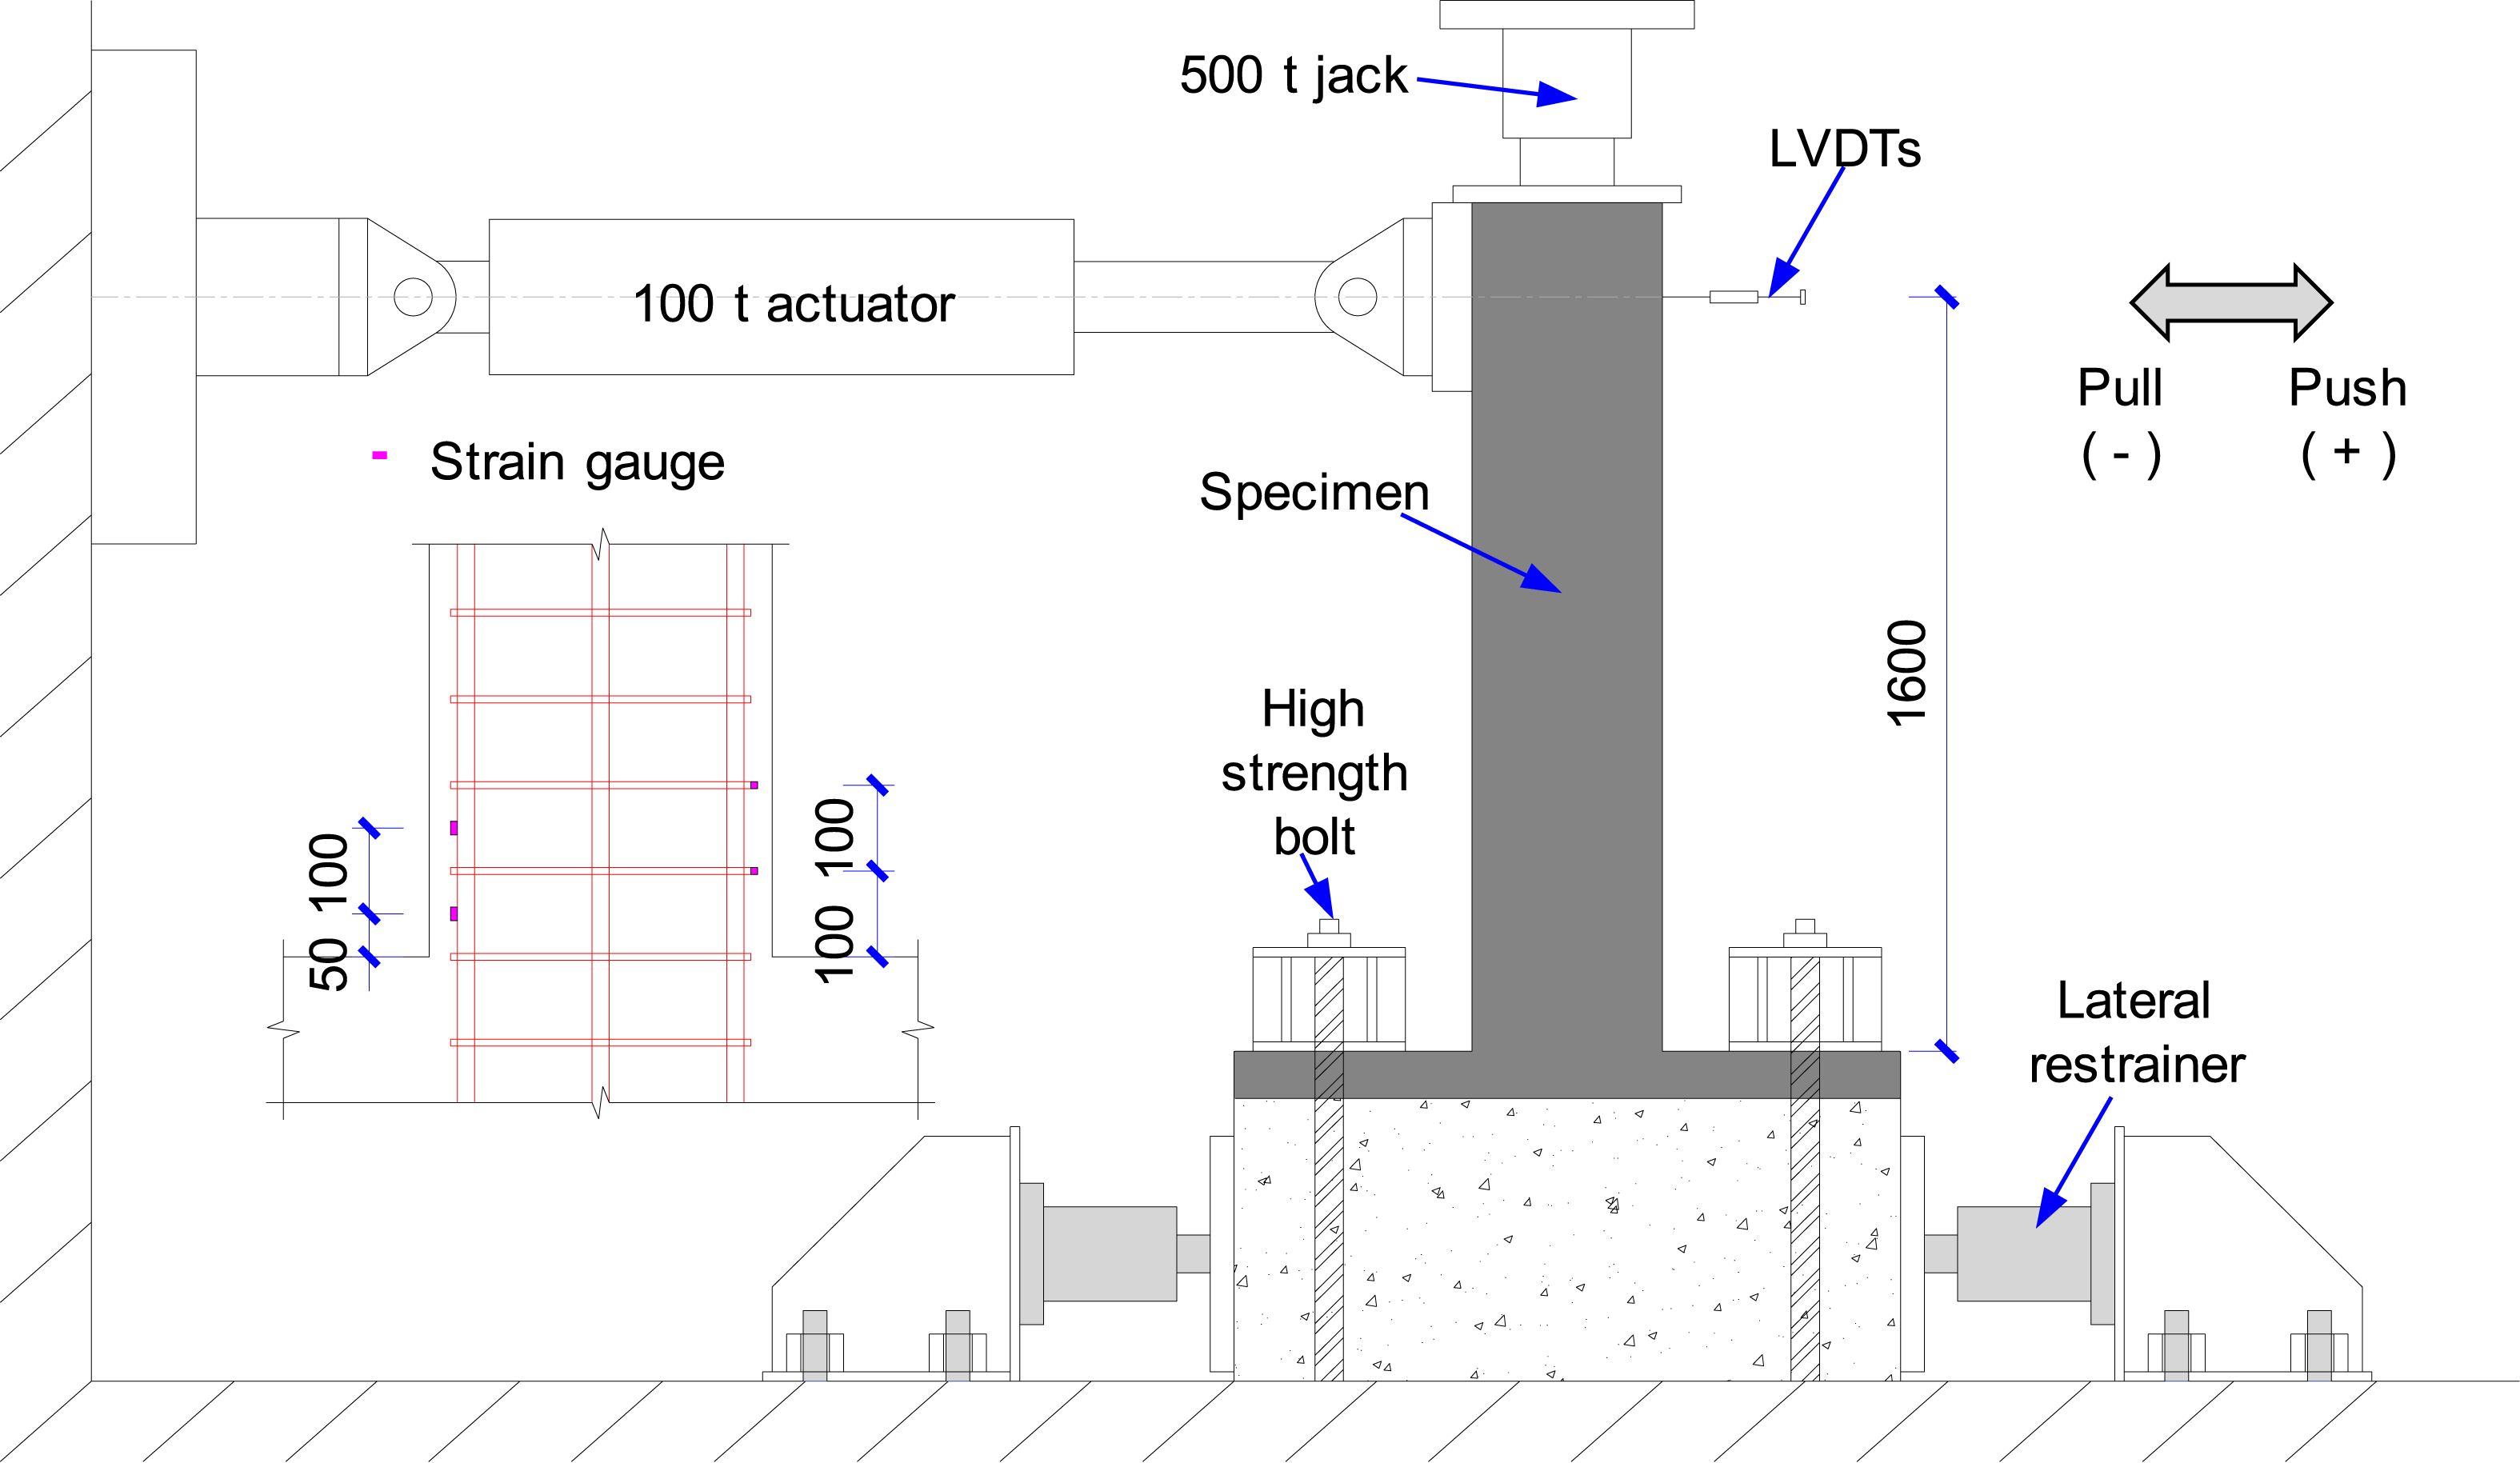
Experimental results
Damage and failure modes
Figure 5 exhibits the damage and failure modes of all specimens, including the initial cracking, crack distribution, and final failure modes. The RC specimen initially cracked at the bottom corner of the column when the DR reached 1/550, corresponding to the elastic story DR limitation in the Chinese code (MOHURD, 2010b). As the DR increased, the initial crack extended horizontally and new cracks appeared simultaneously. Cracks developed diagonally in a gradual manner at the DR of 1/200. Some vertical cracks at the corner were observed at the DR of 1/50, and the cavitation and spalling of the concrete cover layer occurred subsequently. Eventually, the RC failed owing to stirrup fracture and the crushing of the core concrete in the first cycle of loading to 1/20 DR. Damage and failure modes.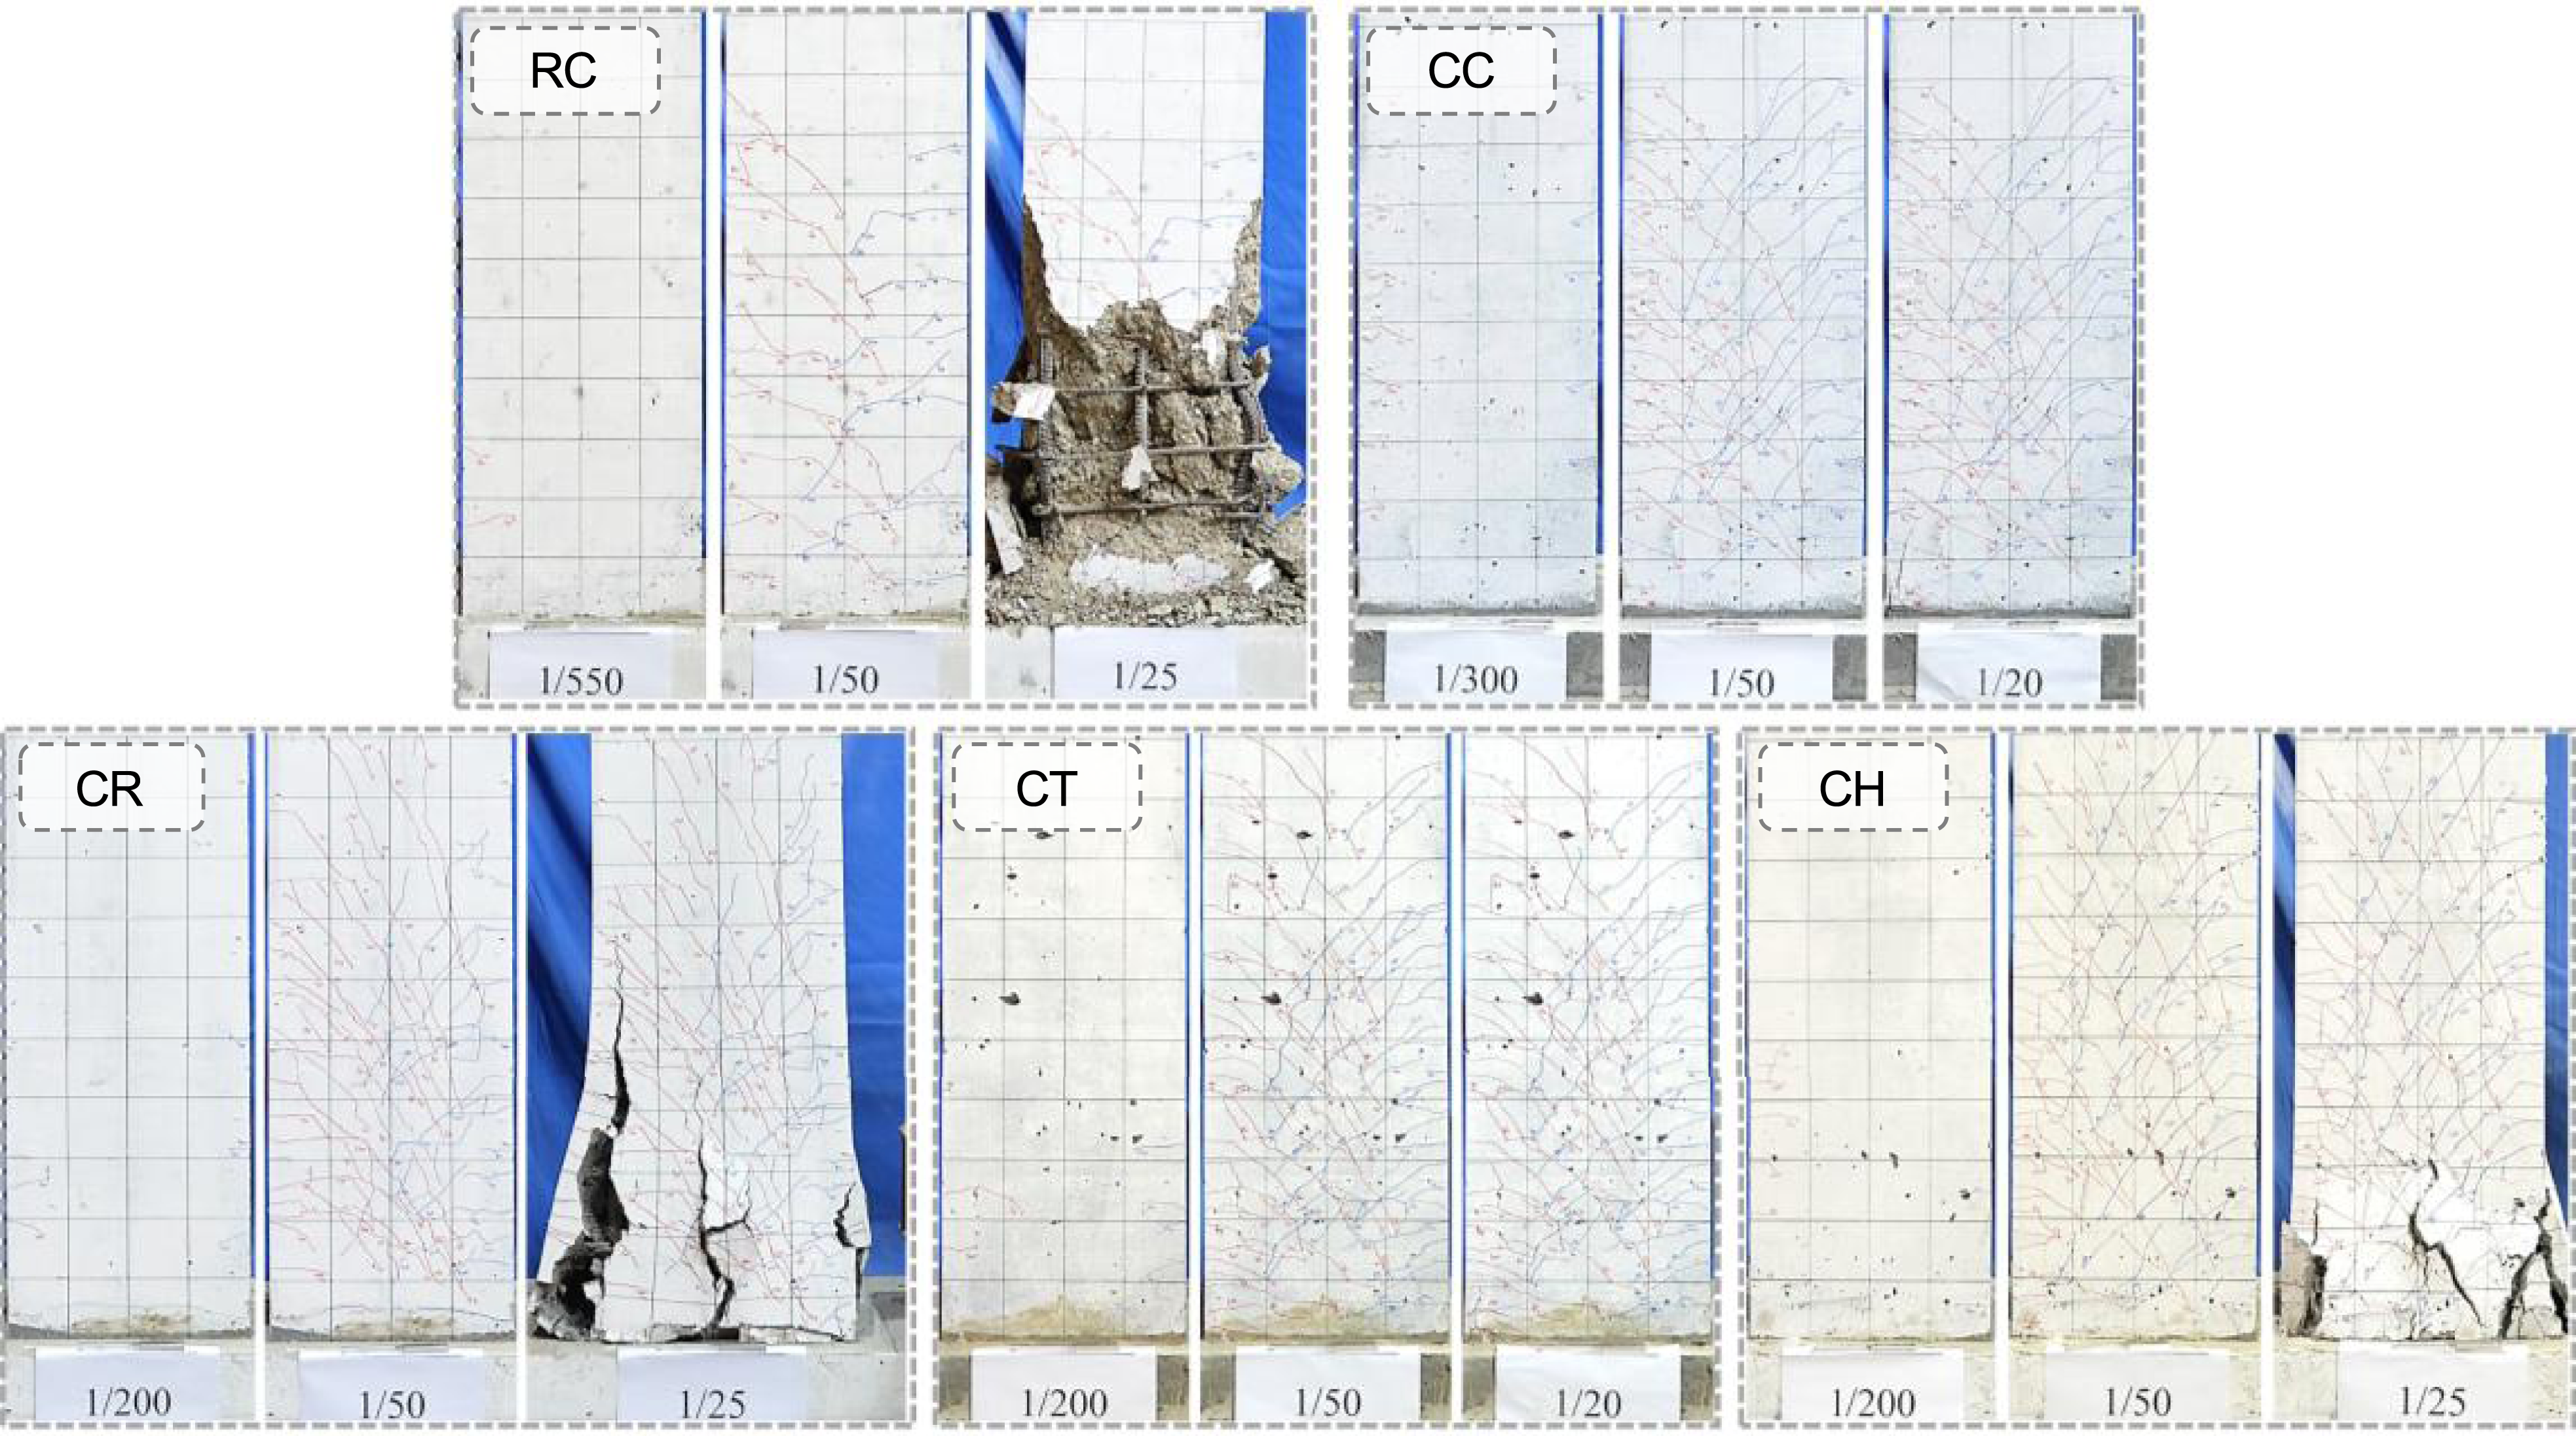
For the benchmark composite column, labelled as CC, the initial crack occurred at 1/300 DR. Compared with RC, the higher initial cracking strength of ECC contributed to a delayed cracking DR. Many refined cracks developed as the DR increased, particularly at 1/67 DR. The tensile strain hardening of ECC facilitated the multiple cracking distribution of the composite column. Only a few vertical cracks appeared when the DR reached 1/30, and no spalling occurred in the ECC jacket after the test, indicating that the use of the ECC is beneficial for the reduction of compression damage.
Other specimens exhibited initial cracking at the DR of 1/200, which is larger than that of CC. Specimens CR and CH had large η, leading to an increase in the height of the sectional compressive zone. The development of tensile strain was slow, and the initial cracking DR was large. The CT had a thick ECC jacket, and thus possessed better cracking resistance. For CH, diagonal cracks appeared earlier compared with other specimens at 1/150, owing to the weakened shear capacity caused by the lack of inner concrete. Vertical cracks could be observed at the DRs of 1/50 and 1/40 for CT and CR, respectively, and both experienced compressive failure at 1/25 DR owing to the extensive spalling of the ECC cover layer, resulting in insufficient axial bearing capacity. The failure modes of CT were similar to those of CC. In summary, increasing η or removing concrete led to the deterioration of the compressive damage of columns, while the effect of enhancing the ECC jacket thickness was not obvious.
Figure 6 compares the maximum cracking widths. Specimen RC showed an early initial cracking and the maximum cracking width. Especially at 1.5% DR, the cracking width exceeded 1.0 mm, which severely impacted the durability and safety of the structure. According to the Chinese code, urgent repair measures are required (MOHURD, 2016). All composite specimens exhibited smaller cracking widths compared to RC, indicating that the use of the ECC jacket effectively delayed and controlled crack formation. The maximum cracking width of CC was less than 0.4 mm at 1.5% DR, demonstrating a reduced level of tensile damage. The increase rate of the cracking width for the composite columns slowed down as DR increased owing to the multiple and refined cracking properties during the test. Specimens CR, CT, and CH exhibited small cracking widths compared with CC. As mentioned above, a larger η or thicker ECC jacket could delay the development of cracks. Maximum cracking widths.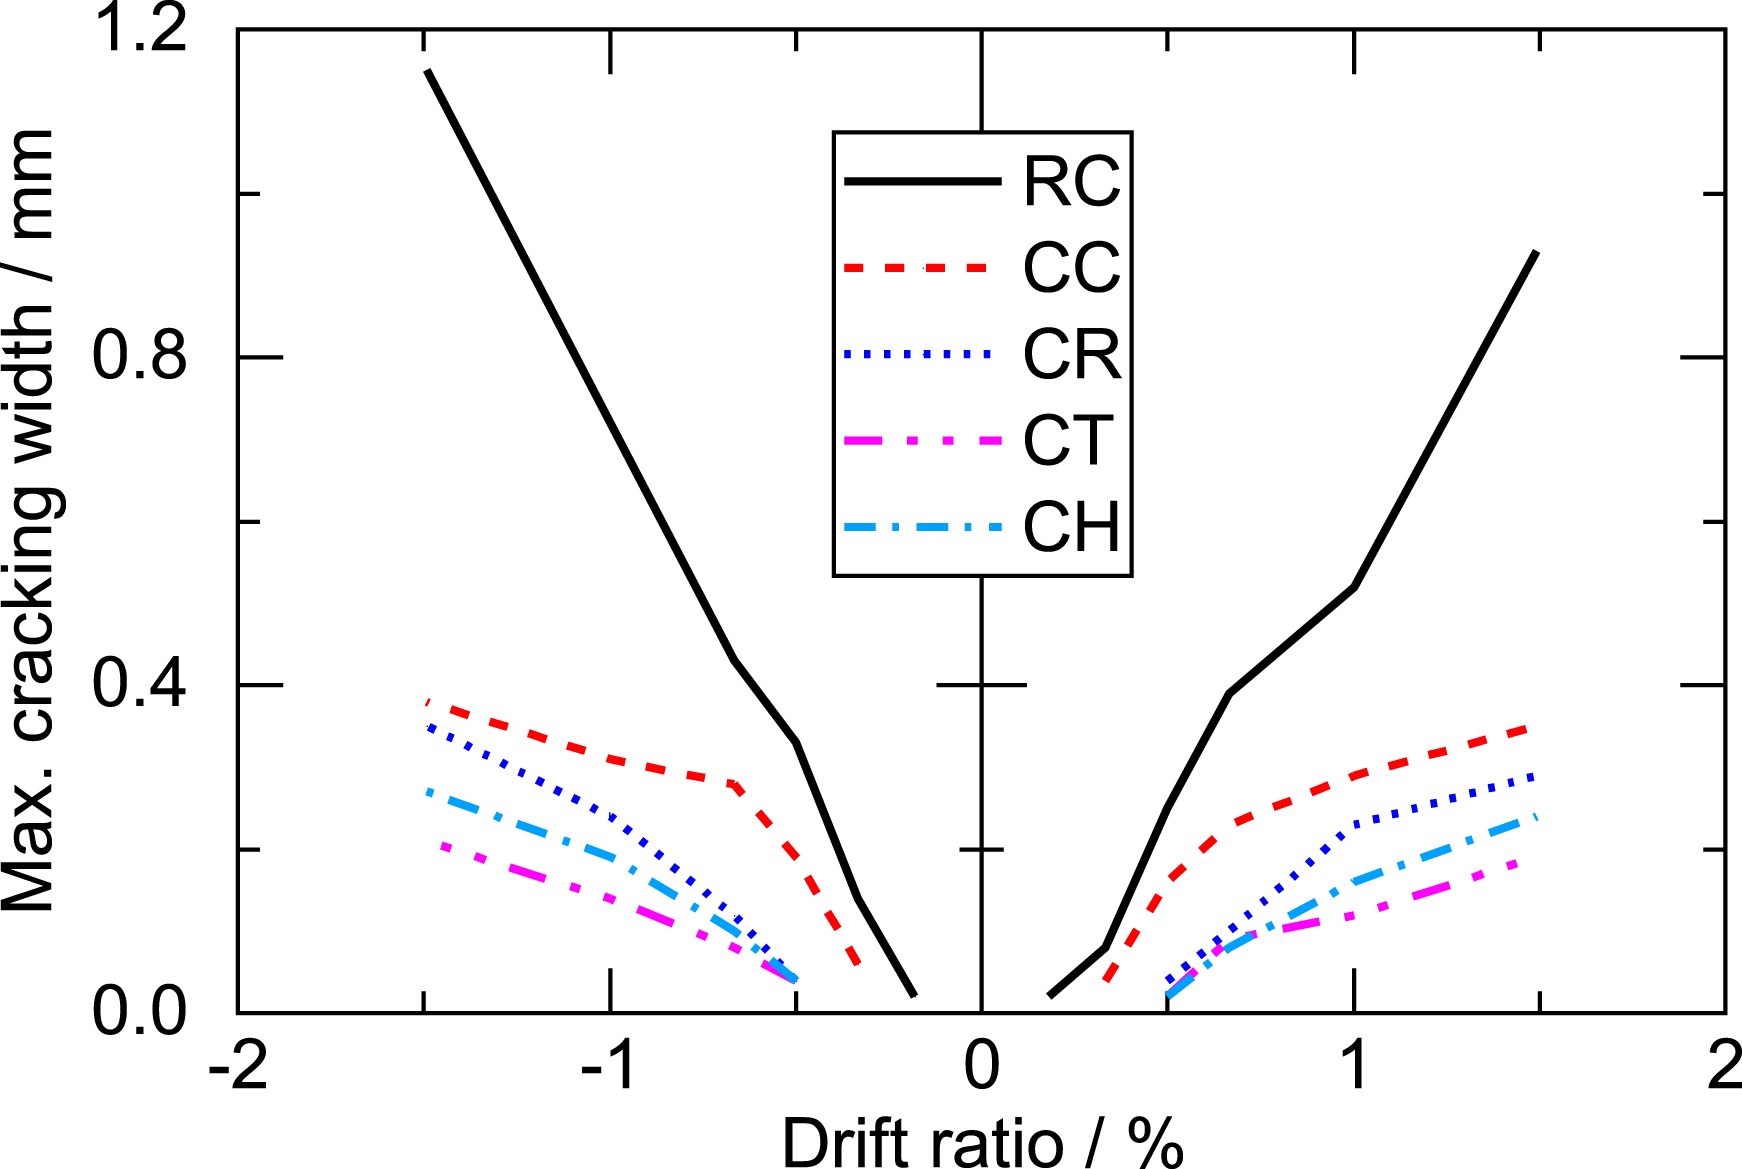
Hysteretic performance
Figure 7(a)–(e) show the hysteretic curves of all specimens. The composite specimens exhibited a hysteretic response similar to that of RC. When DR was very small, the specimens exhibited an approximately linear elastic response. As the DR increased, cracking and reinforcement yield were generated gradually, and the area of the hysteresis loop expanded. When the peak DR was exceeded, vertical cracks emerged, the bearing capacity decreased, and the pinch effect became pronounced. Hysteretic curves and skeleton curves.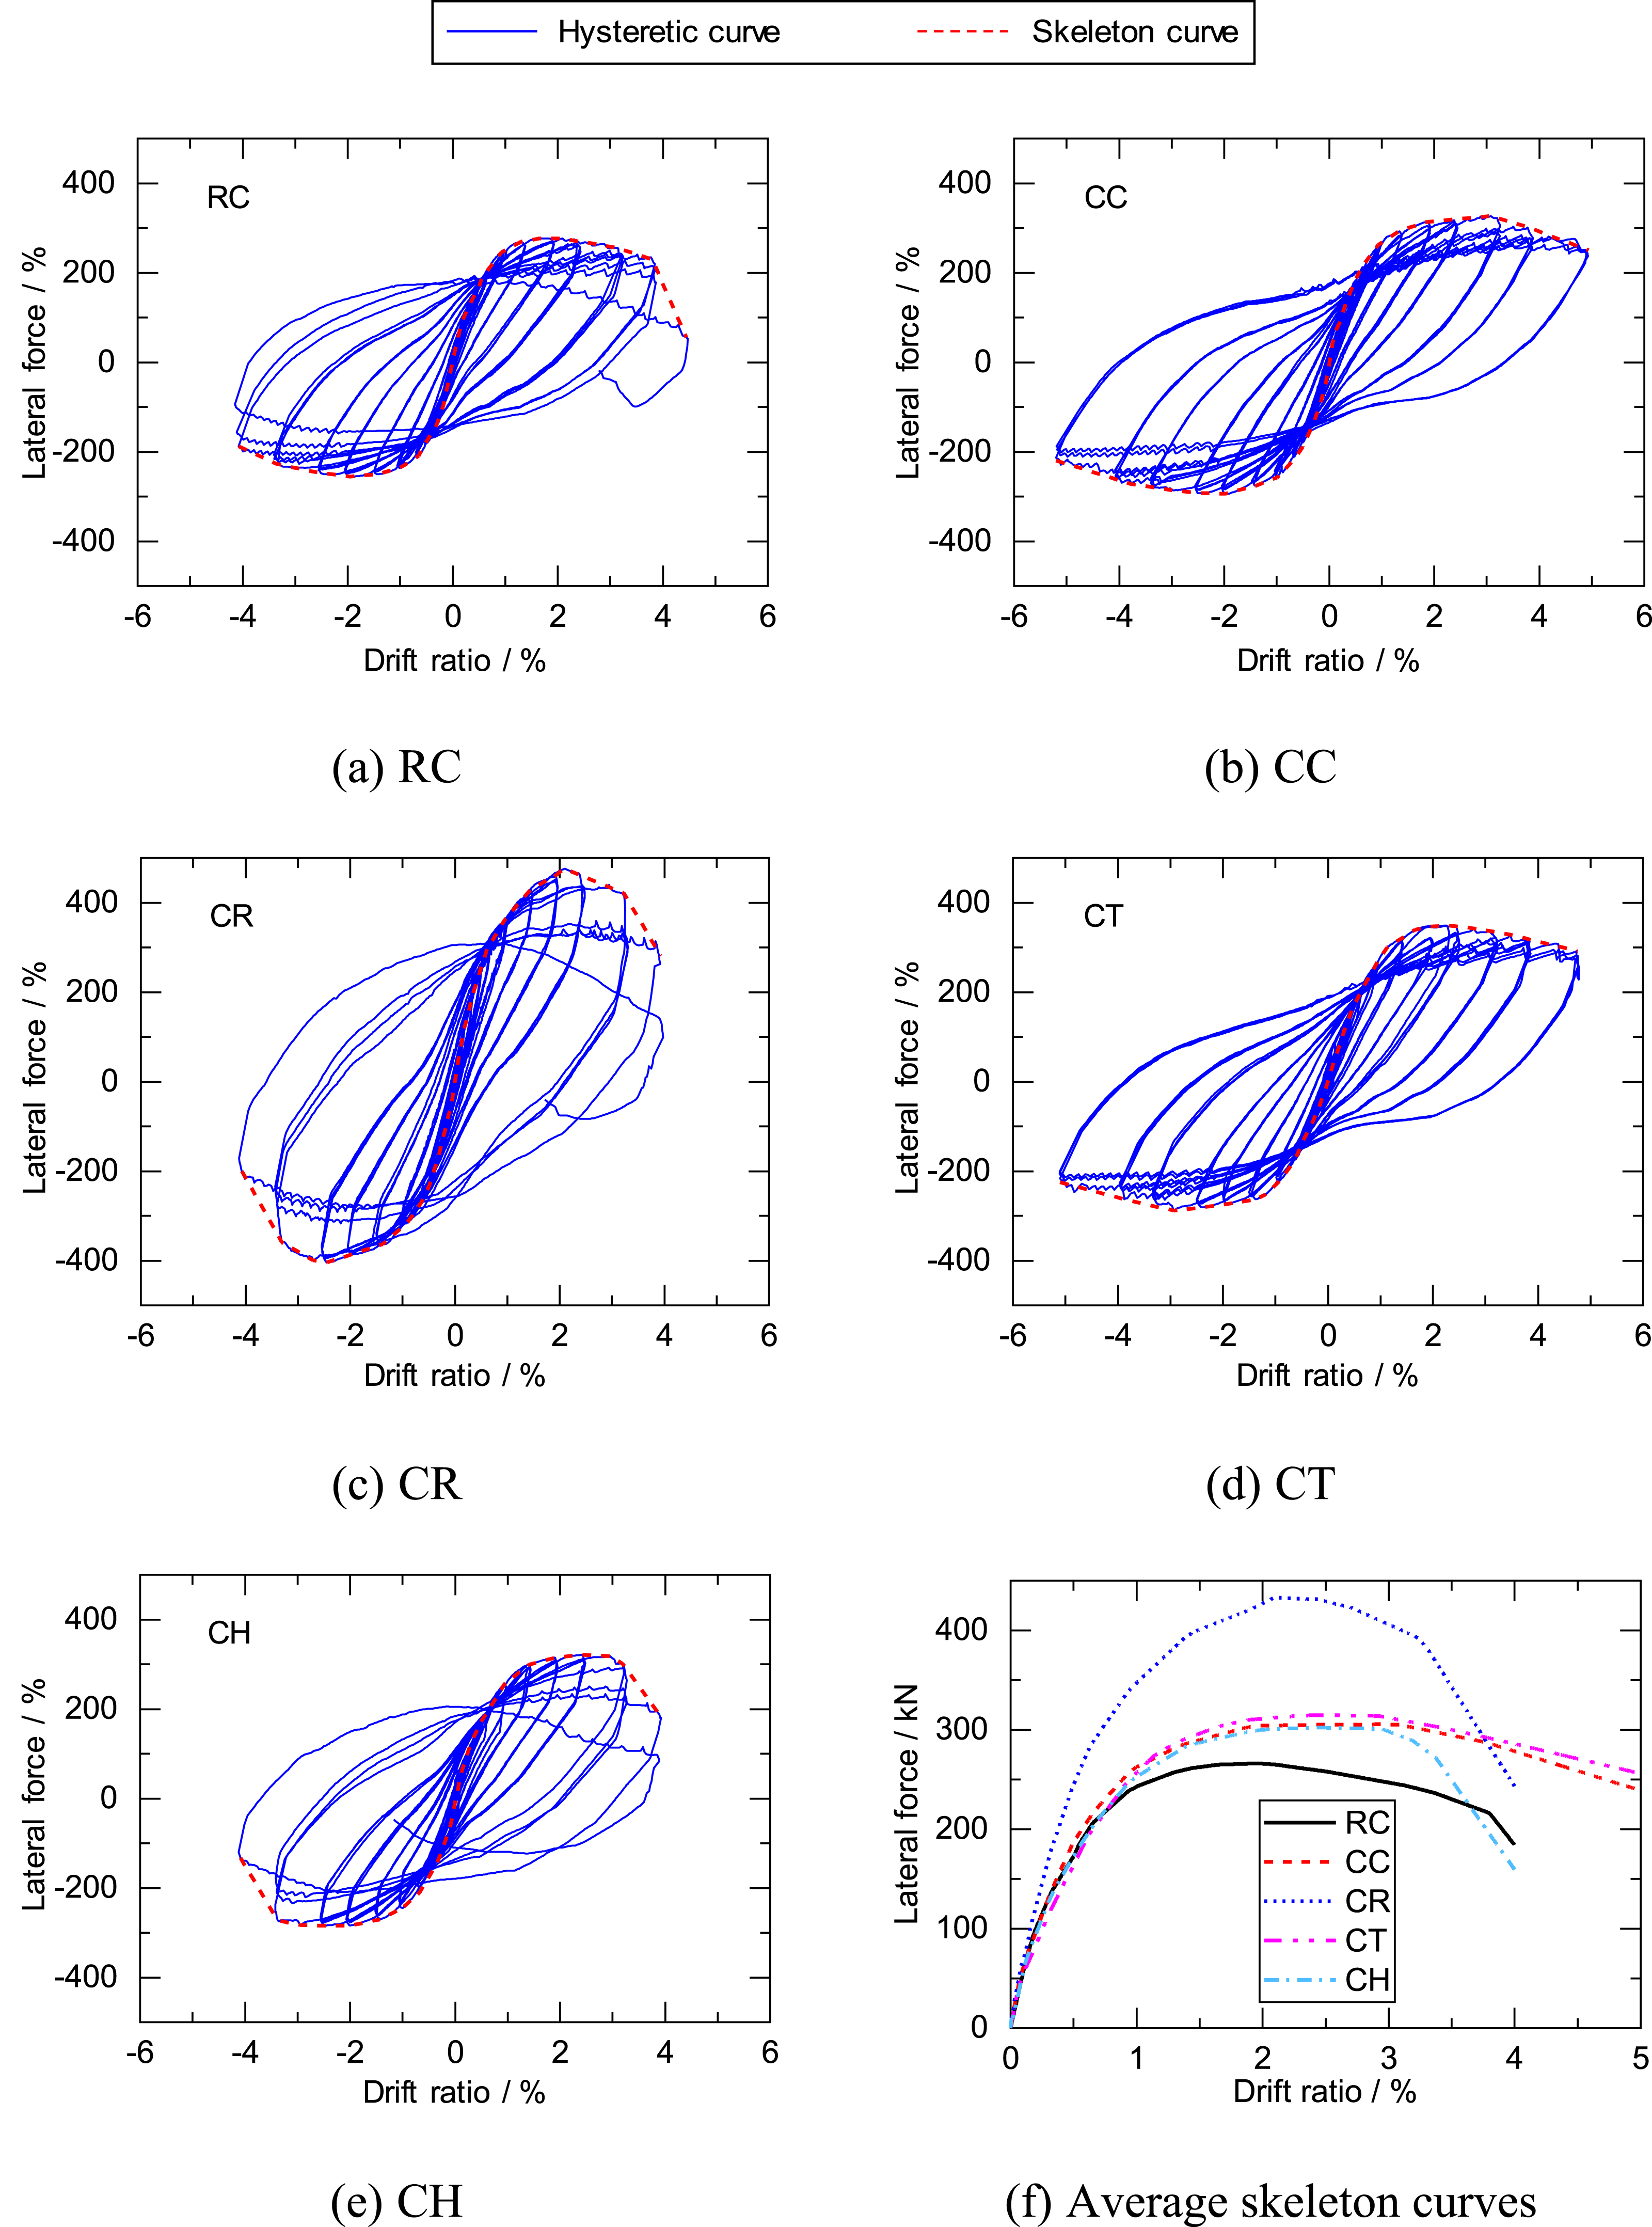
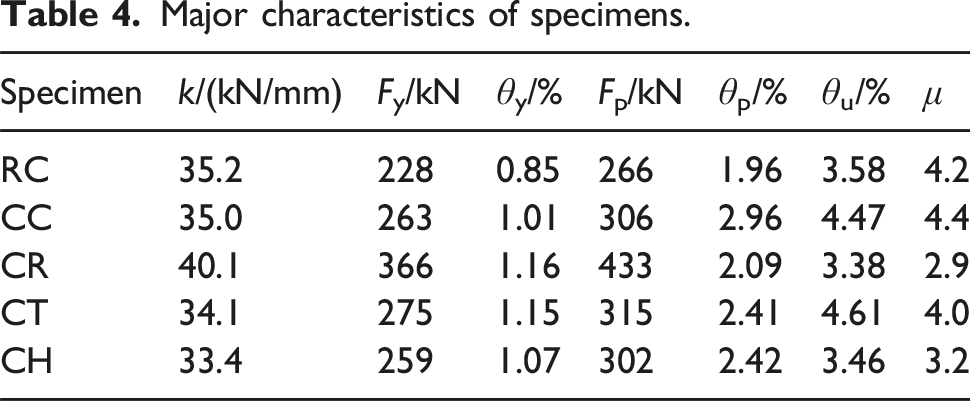
Major characteristics of specimens.
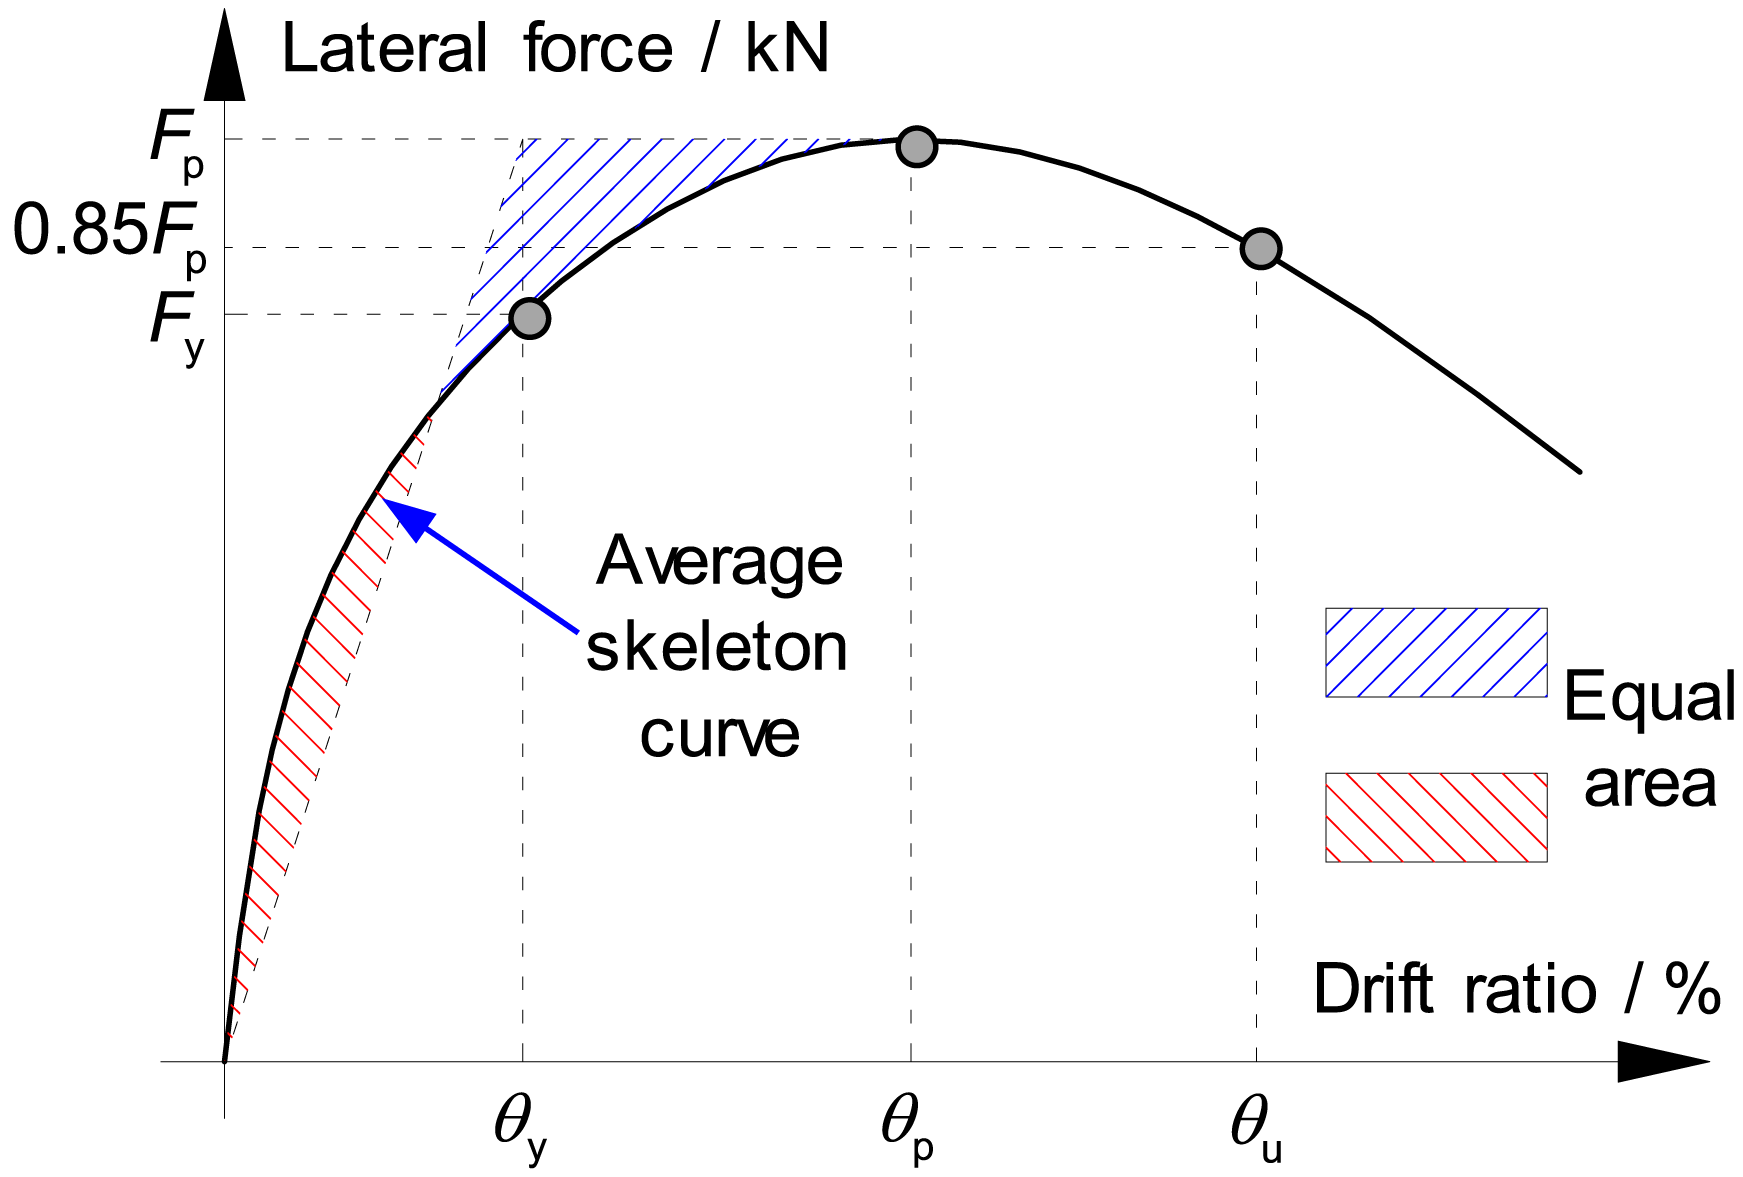
Definition of key performance characteristics.
Specimen CC had a larger yield DR (θy) equal to approximately 1.19 times that of RC. Because the tensile strain hardening ensured that the ECC cover layer could continuously withstand tension, the development of tensile strain in the reinforcement of CC was slower. CR, CT, and CH had a larger θy compared with CC. As mentioned previously, in the cracking width comparison, the increase of η, removal of concrete, and increase of the ECC jacket thickness could effectively control cracks and delay the strain development of the reinforcement.
The peak force of CC was 1.15 times that of RC. There are two main reasons for the improvement. First, the high compressive strength of ECC can enable the column to withstand the same axial load with a small compressive zone height, further improving the contribution of reinforcement and ECC to the bending moment. Second, the high tensile stress and strain hardening of ECC resulted in the direct enhancement of the bearing capacity. The CR had the largest peak force, which was approximately 1.42 times that of CC. Consistent with the classical theory of concrete structures, the bearing capacity increased with η within an appropriate range. Specimens CT and CH exhibited a peak force similar to that of CC. Therefore, under the same axial load, further increasing the thickness of the ECC jacket no longer resulted in a significant improvement in the bearing capacity, and the contribution of the inner concrete to the bearing capacity was very small.
The ductility factor μ of CC was slightly enhanced compared with RC, although its ultimate deformability was approximately 1.25 times that of RC. This is attributed to the small yield DR of RC. The ductility and ultimate DR of both CR and CH were markedly lower compared with CC. Increasing η and eliminating concrete aggravated the development of the compressive strain of the ECC jacket, resulting in a significant reduction in the deformation capacity. Compared with CC, the ductility of CT decreased while the ultimate DR exhibited a limited increase. The excessive thickness of the ECC jacket did not increase the ultimate DR significantly. Additionally, an increase in the yield DR resulted in reduced ductility. Based on the peak force and ductility results, it is concluded that there is an optimal thickness that can effectively enhance these properties concurrently.
Figure 9 compares the residual drift ratio (RDR). All specimens had a similar RDR before 1/67 DR. Subsequently, the RDR of RC markedly increased owing to the earlier reinforcement yield and compressive damage of the concrete cover layer. The CC and CT had similar RDR, which was lower than that of other specimens. Therefore, the outstanding property of ECC contributed to lower plasticity and RDR with a larger DR. When the DR exceeded 1/40, the RDRs of CR and CH were significantly exacerbated owing to the obvious compressive damage of the ECC cover layer. Comparison of residual drift ratios.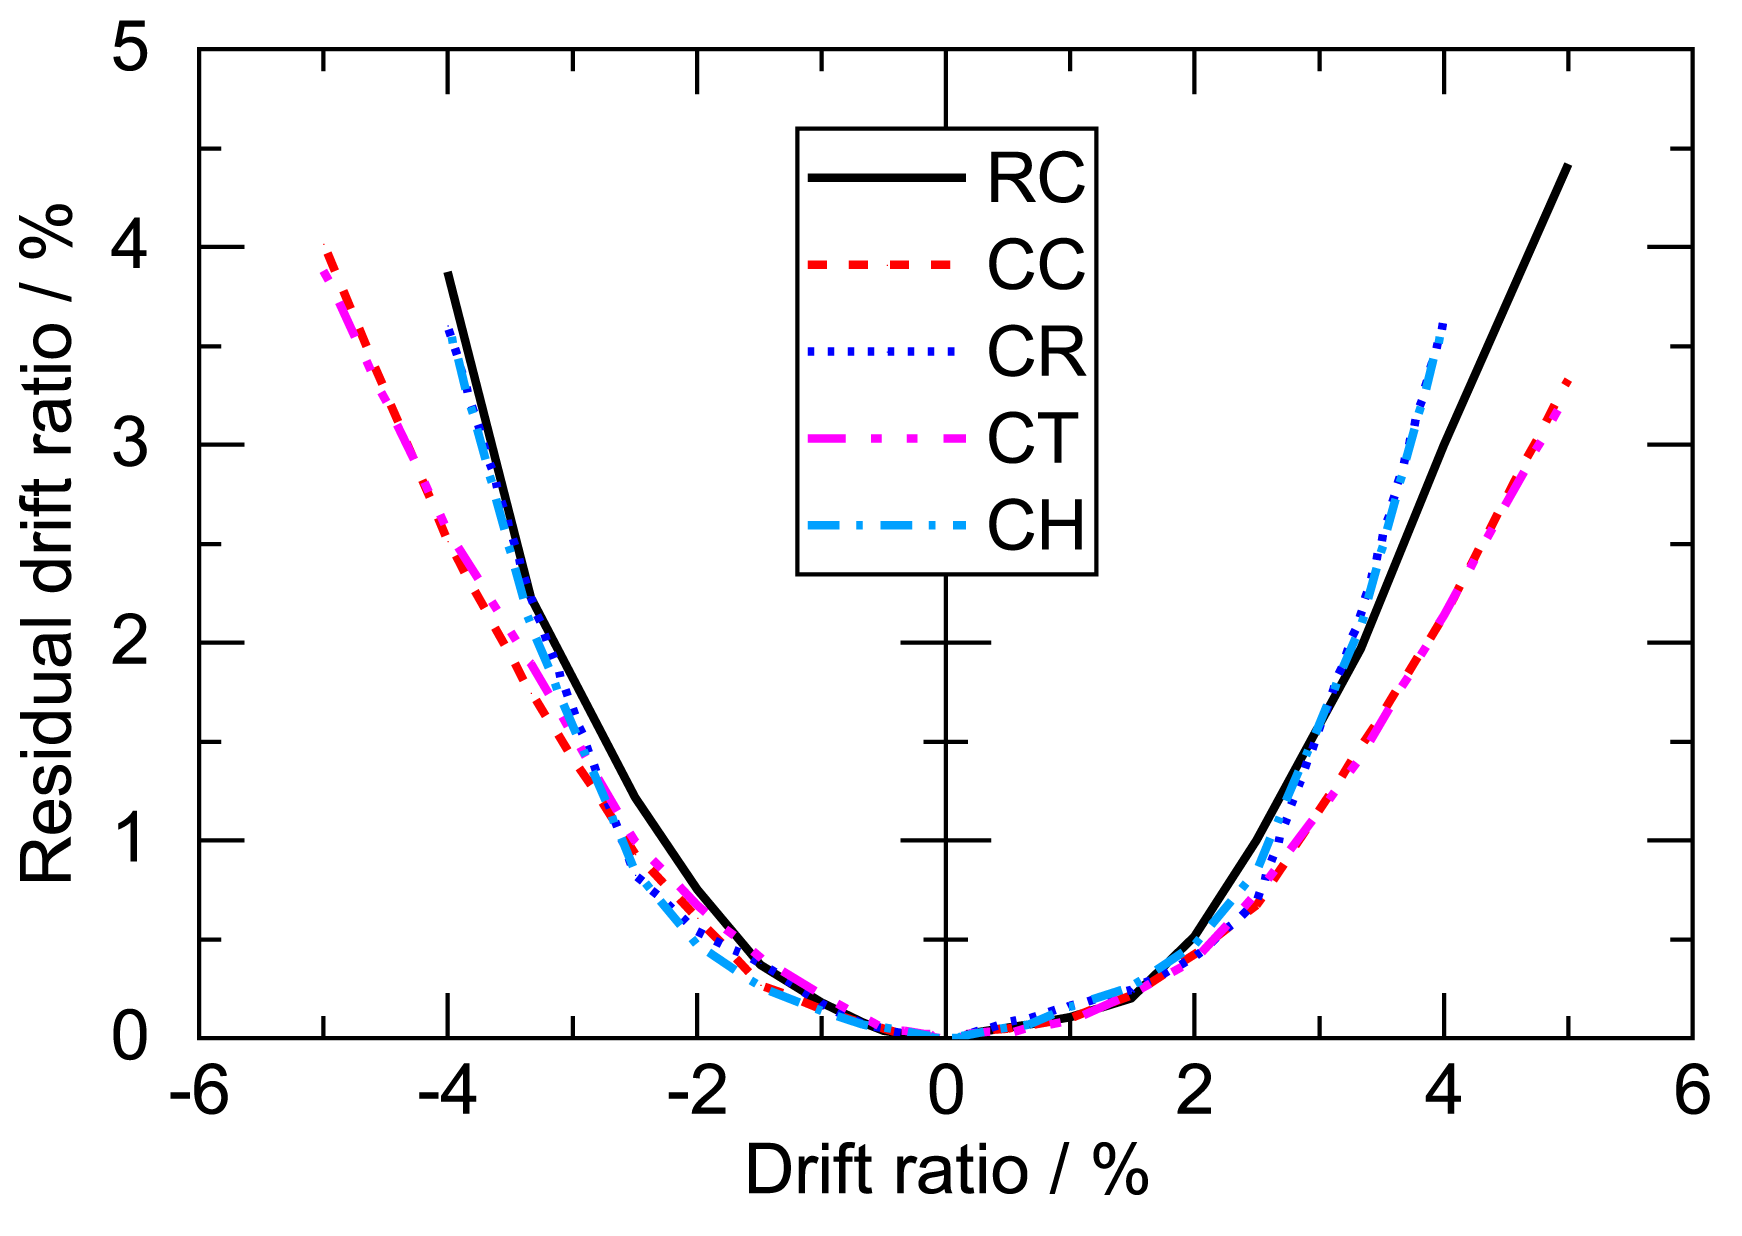
Figure 10 shows the cumulative energy dissipation (CED) under different DRs. The CED of all specimens increased slowly before a DR of 1.5%, but accelerated obviously after the DR. The RC had the lowest CED, while CR had the largest one owing to the highest degree of nonlinearity and bearing capacity. Other specimens exhibited similar CED before 1/30 DR, indicating that the increase of the ECC jacket and removal of concrete had almost no effect on CED within the limited DR. Notably, only CC and CT maintained a steady energy dissipation capacity at the DR of 1/20, while other specimens had already ceased energy dissipation due to severe damage. Comparison of cumulative energy dissipation.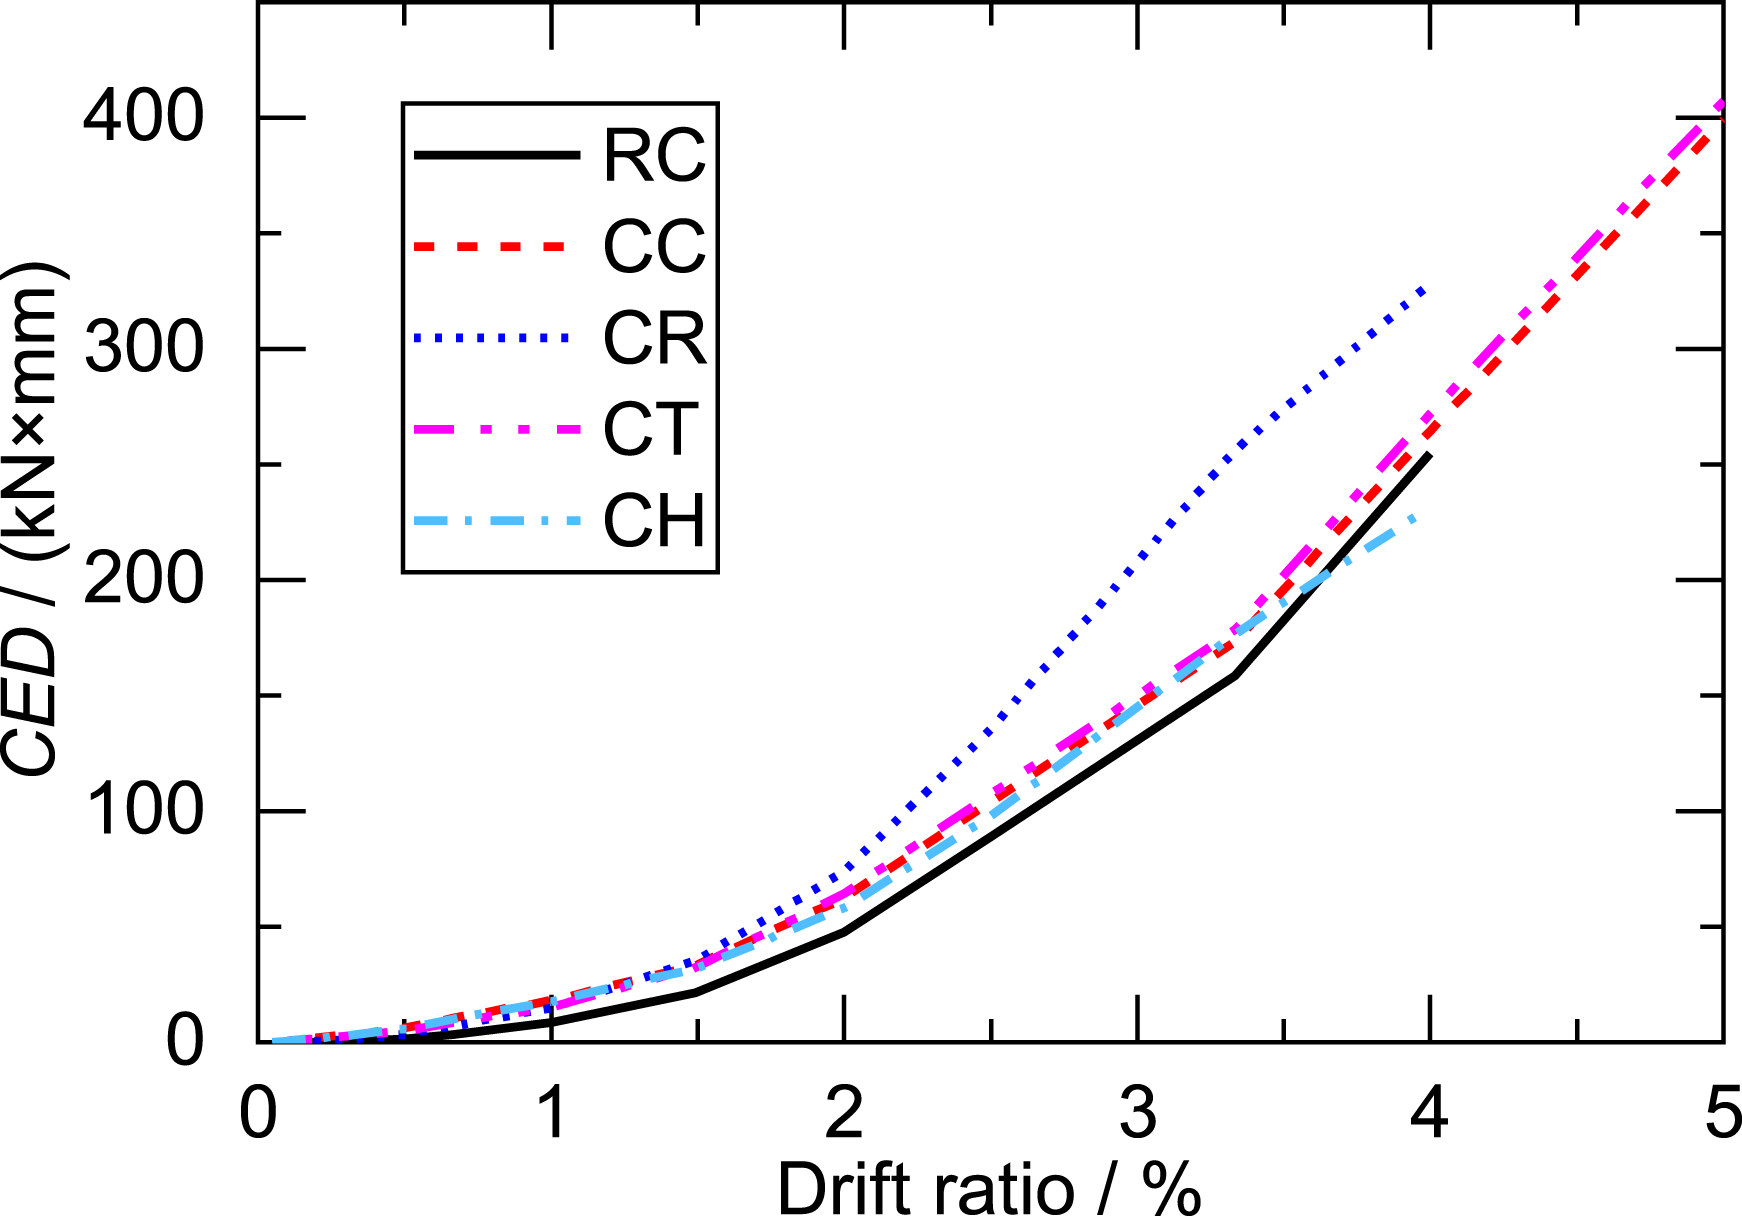
Numerical analysis
Numerical modeling and verification
The test results revealed that the excessive thickness of the ECC jacket did not noticeably improve the bearing capacity, but did lead to a decrease in ductility. A numerical model was developed to investigate the impact mechanism, which was built using the Open System for Earthquake Engineering Simulation (OpenSees) software (Mazzoni et al., 2006). The column was simulated using the displacement-based beam-column element, and was uniformly divided into four elements. The length of each element equaled the one-time side length, and five G integration points were set in each element. The nonlinear fiber section was adopted for simulating the ECC, NC, and reinforcement, and the mesh size ranged from 15 mm to 20 mm, as shown in Figure 11. The adopted mesh method could effectively ensure the calculation accuracy and efficiency (Ni et al., 2022). Numerical model.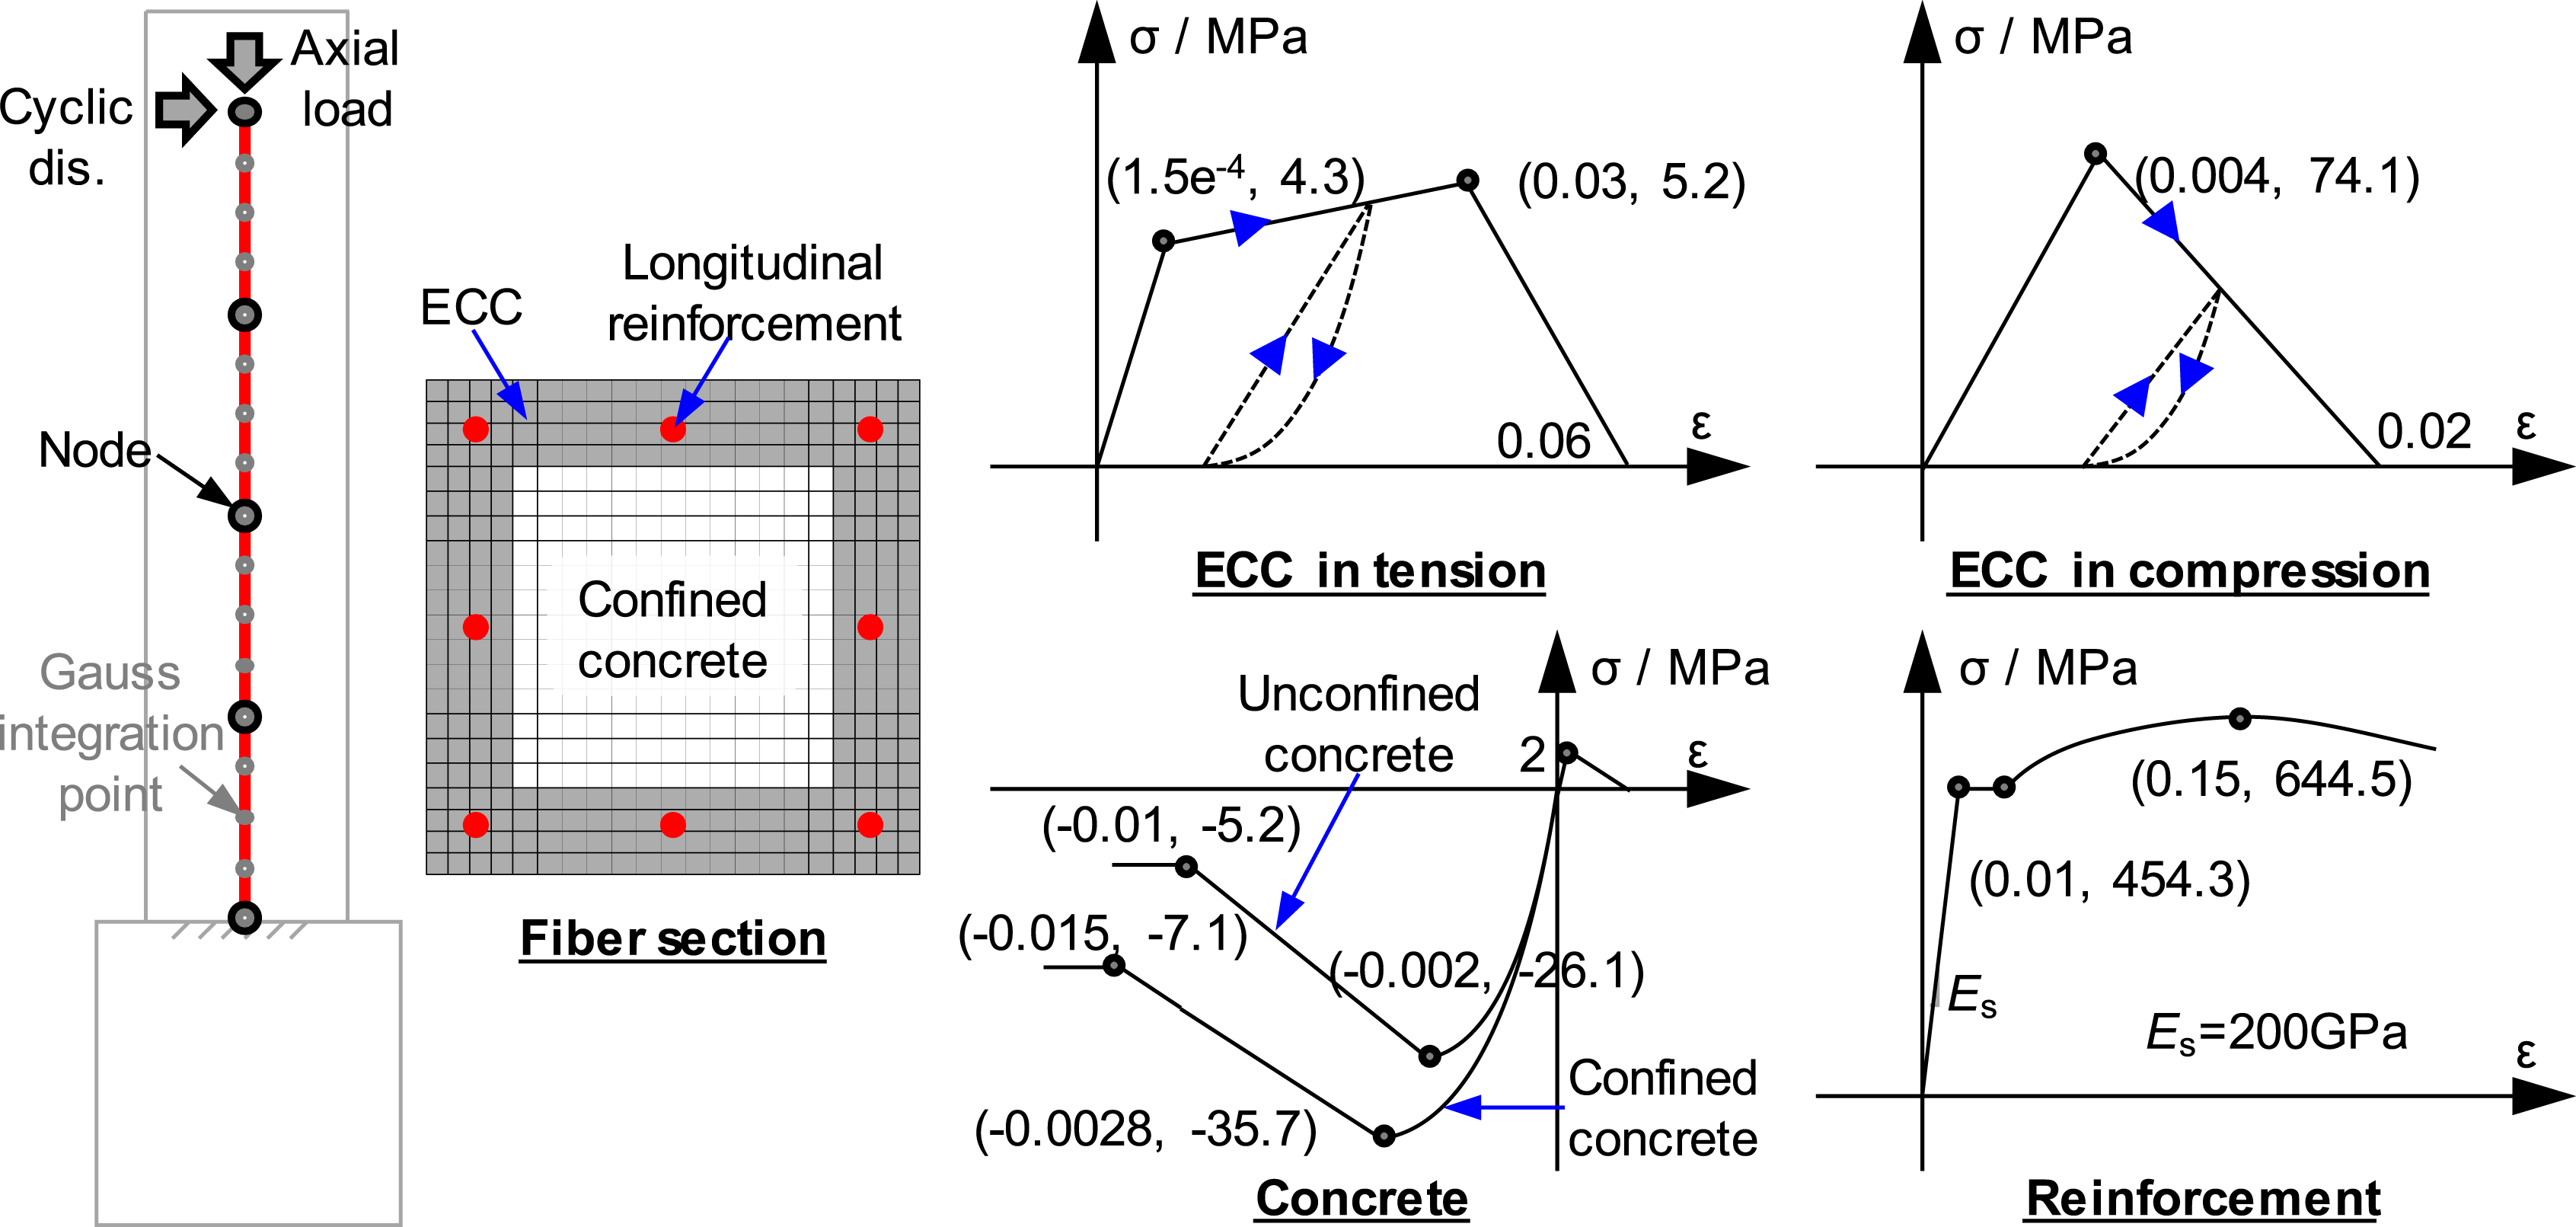
The material constitutive models of ECC, concrete, and reinforcement are also presented in Figure 11. The ECC01 model, proposed by Han et al. (2003), was used for modeling. For the tensile behavior, this study used the trilinear model with linear ascending, hardening, and softening components. The model consisted of two linear parts for compression behavior, that is, linear ascending and softening parts. The unloading curve obeyed the exponential function both in tension and compression, and the exponents were 5 and 2, respectively. The reloading curve was linear on both sides. The concrete02 material model was employed (Yassin, 1994). The bilinear model was used to consider the tension behavior of concrete. Two components were used in compression: a quadratic ascending component and a linear descending component. The confined concrete model, proposed by Braga et al. (2006), was adopted. The reinforcing steel material model was used for the reinforcements, because it can more accurately simulate behavior such as strain hardening and buckling under cyclic loading.
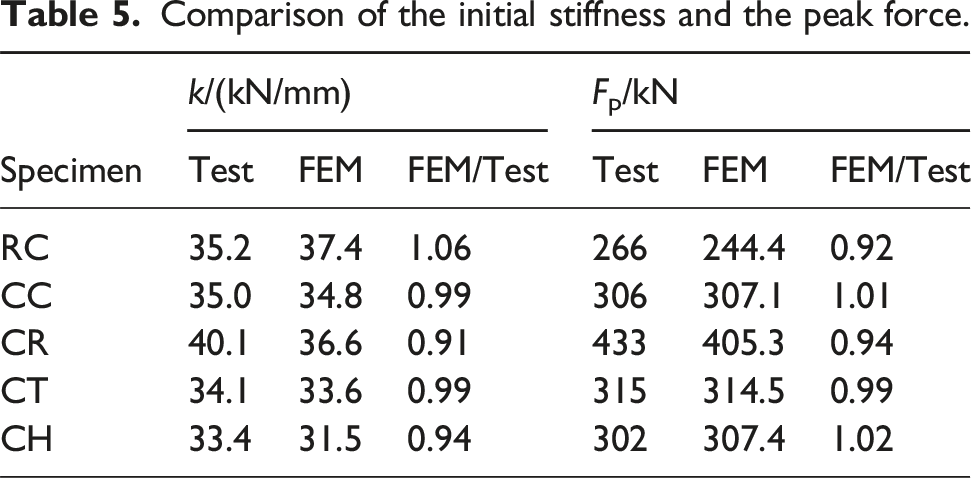
Numerical models of all specimens were developed following the methodology, which encompassed element type selection, material constitutive modeling, and boundary condition definition. The column bottom was fixed. The vertical axial load was equivalent to a concentrated mass acting on the column top, and lateral cyclic displacement was imposed at the column height. Figure 12 shows the numerical simulation results compared with the test results. The numerical model reproduced the test cyclic responses of all specimens, such as the skeleton curve, hysteretic curve, and pinch effect. Meanwhile, a comparison between experimental and numerical results is presented in Table 5. The numerical predictions for both initial stiffness and peak load correlate closely with the measured test data, exhibiting relative errors within 10%, thereby validating the accuracy and reliability of the developed numerical model. Notably, a discrepancy arose between the numerical predictions and the experimental results for specimens CT and CH under large deformations. This deviation can be attributed to the pronounced plastic behavior and distinct local buckling observed in the ECC jackets of these specimens during testing. Simulating such significant buckling responses accurately using fiber-section beam elements presented considerable challenges. Generally, the numerical model revealed the cyclic behavior of the composite and RC columns. Verification of the numerical model. Comparison of the initial stiffness and the peak force.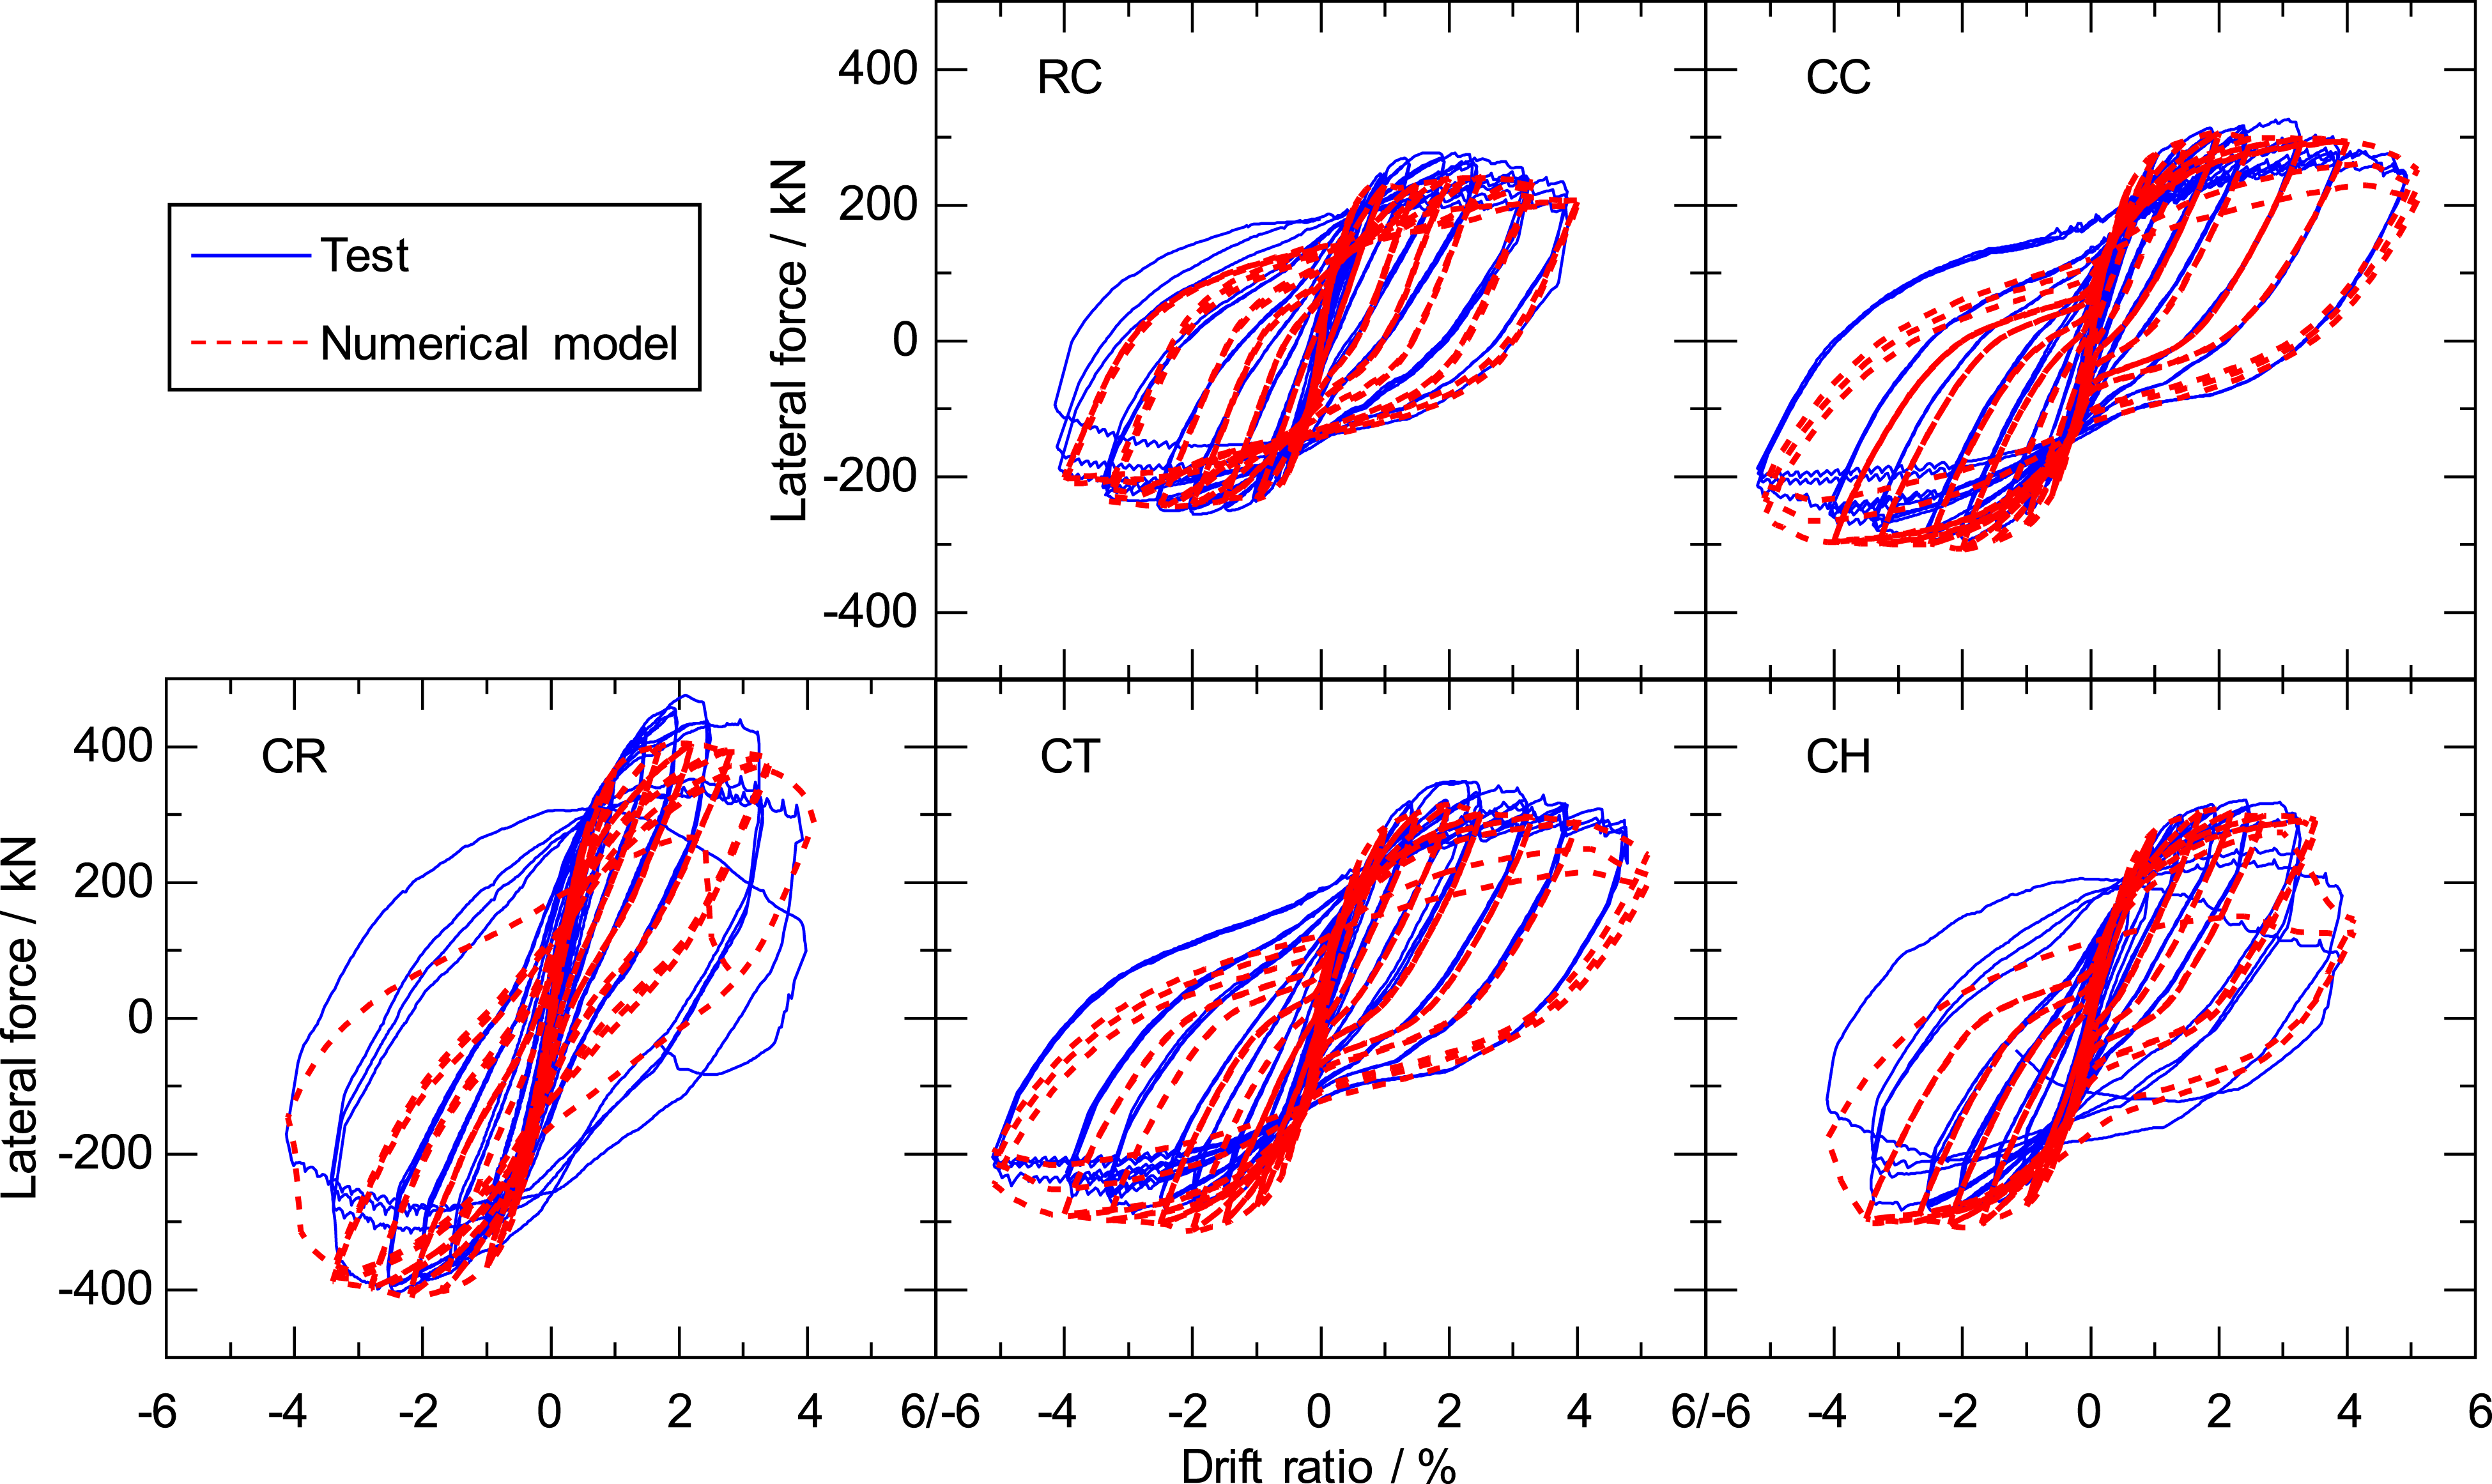
Parametric analysis
The cyclic test results indicate that the thickness of the ECC jacket had a complex effect on the bearing capacity and ductility of the composite column. To further reveal the effect’s mechanism, parametric analysis was conducted based on the verified numerical model.
Parameters in the parametric analysis.
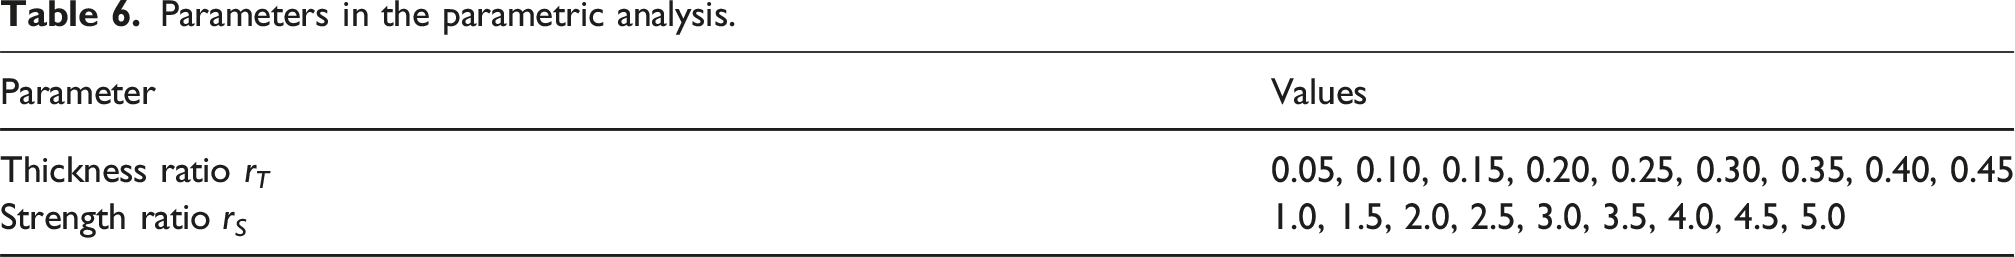
Figure 13 illustrates the influence of the rT at a constant rS of 2.0. As rT increased, both the yield DR and peak load exhibited a rising trend, attributable to the superior tensile and compressive properties of the ECC. However, the rate of this increase gradually diminished. This moderating effect can be explained by the reduced contribution efficiency of the additional ECC material located near the sectional centroid. Ductility showed a non-monotonic trend, initially rising and then declining. This behavior correlates with changes in the compression zone height. As ECC thickness increased, the compression zone height at failure first decreased and subsequently increased, leading to higher compressive strains and reduced ductility when the zone was larger. The underlying mechanism will be detailed later. Effect of the thickness ratio.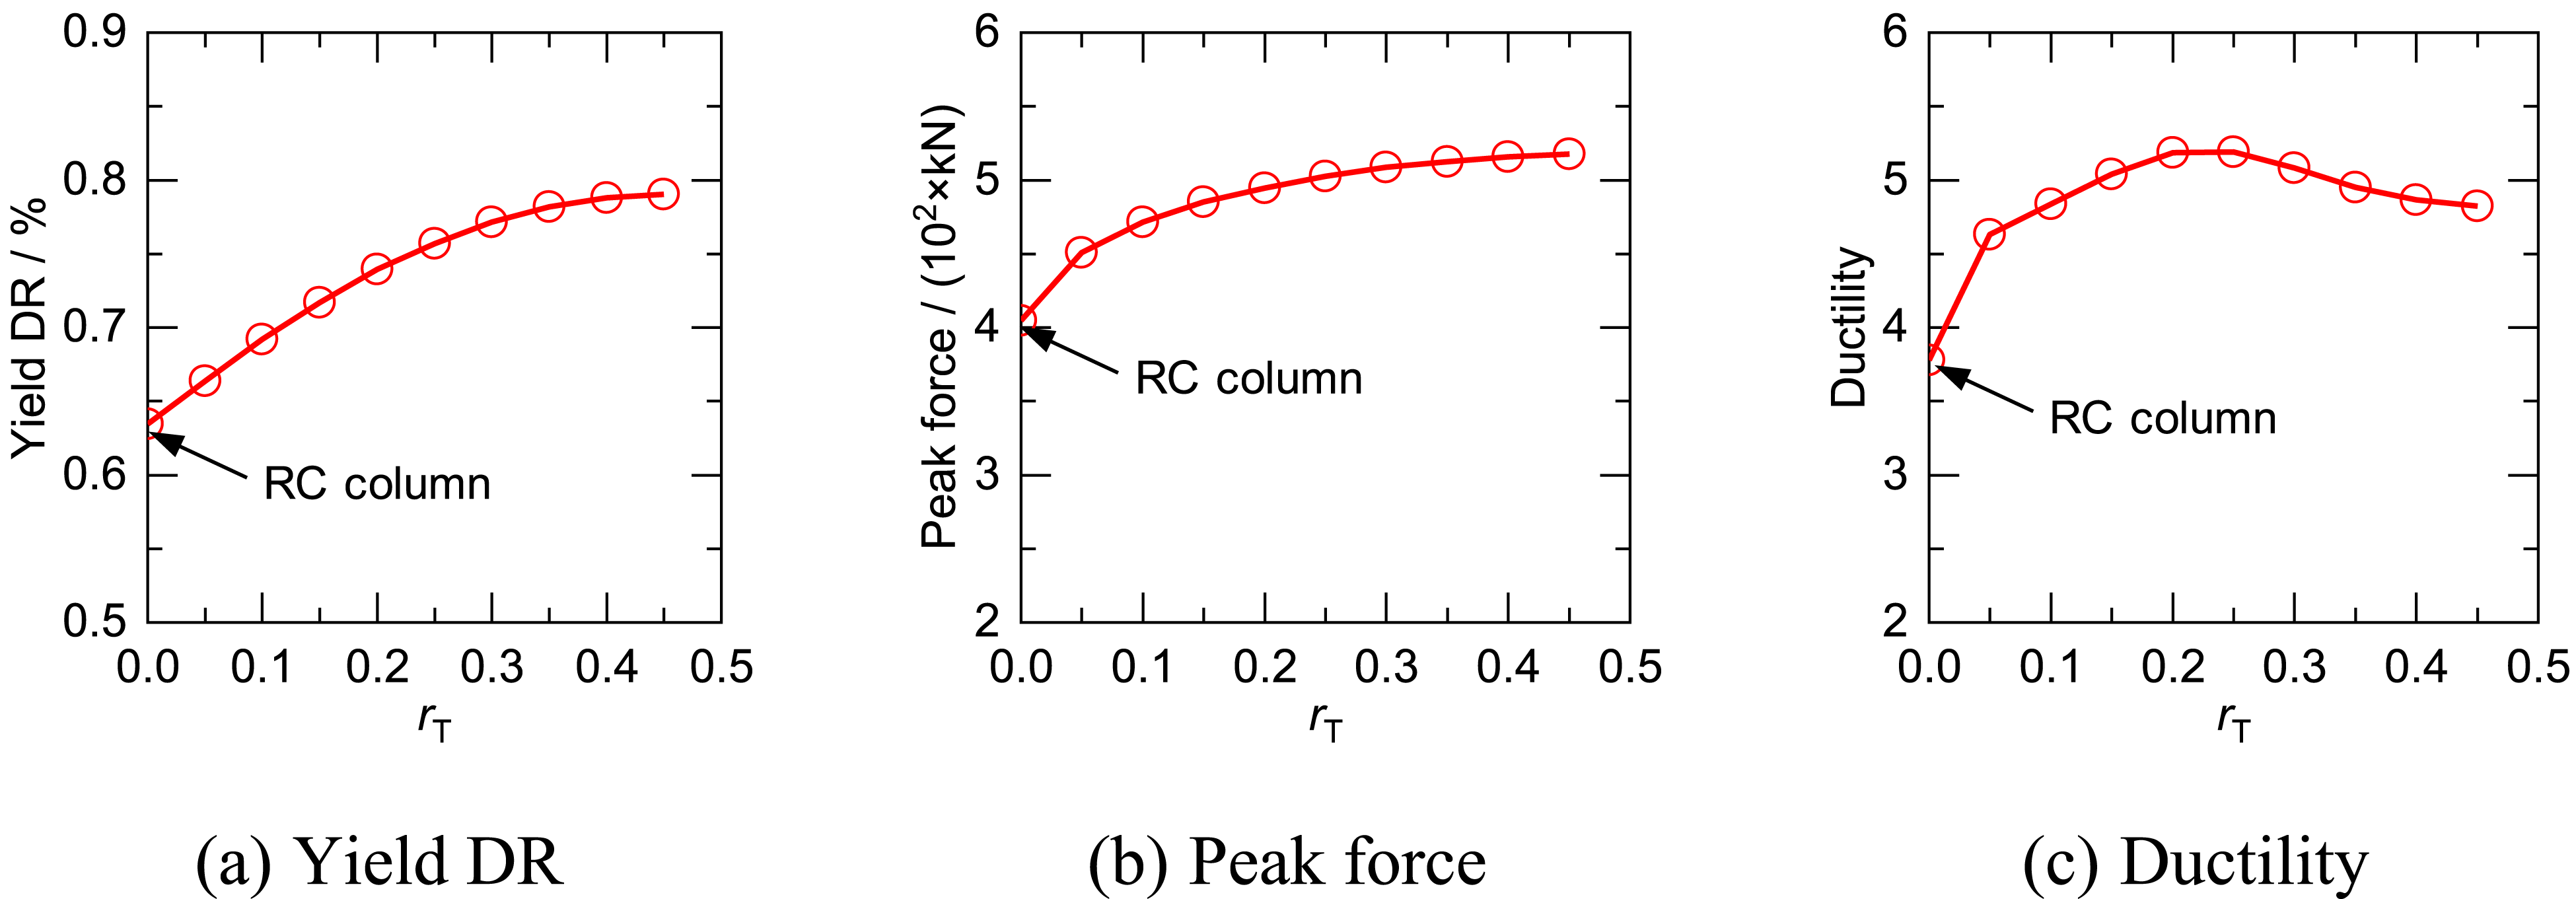
Figure 14 illustrates the effect of the rS at a fixed rT of 0.2. Increasing rS reduced the yield DR but enhanced the peak load and ductility. This behavior was attributed to a reduction in compression zone height, which raised tensile strain in the reinforcement and lowered the yield DR. A higher rS also improved the flexural contribution, increasing the peak load. Additionally, the enhanced compressive performance of ECC delayed crushing, thereby extending the ultimate deformation capacity and ductility. Effect of the strength ratio.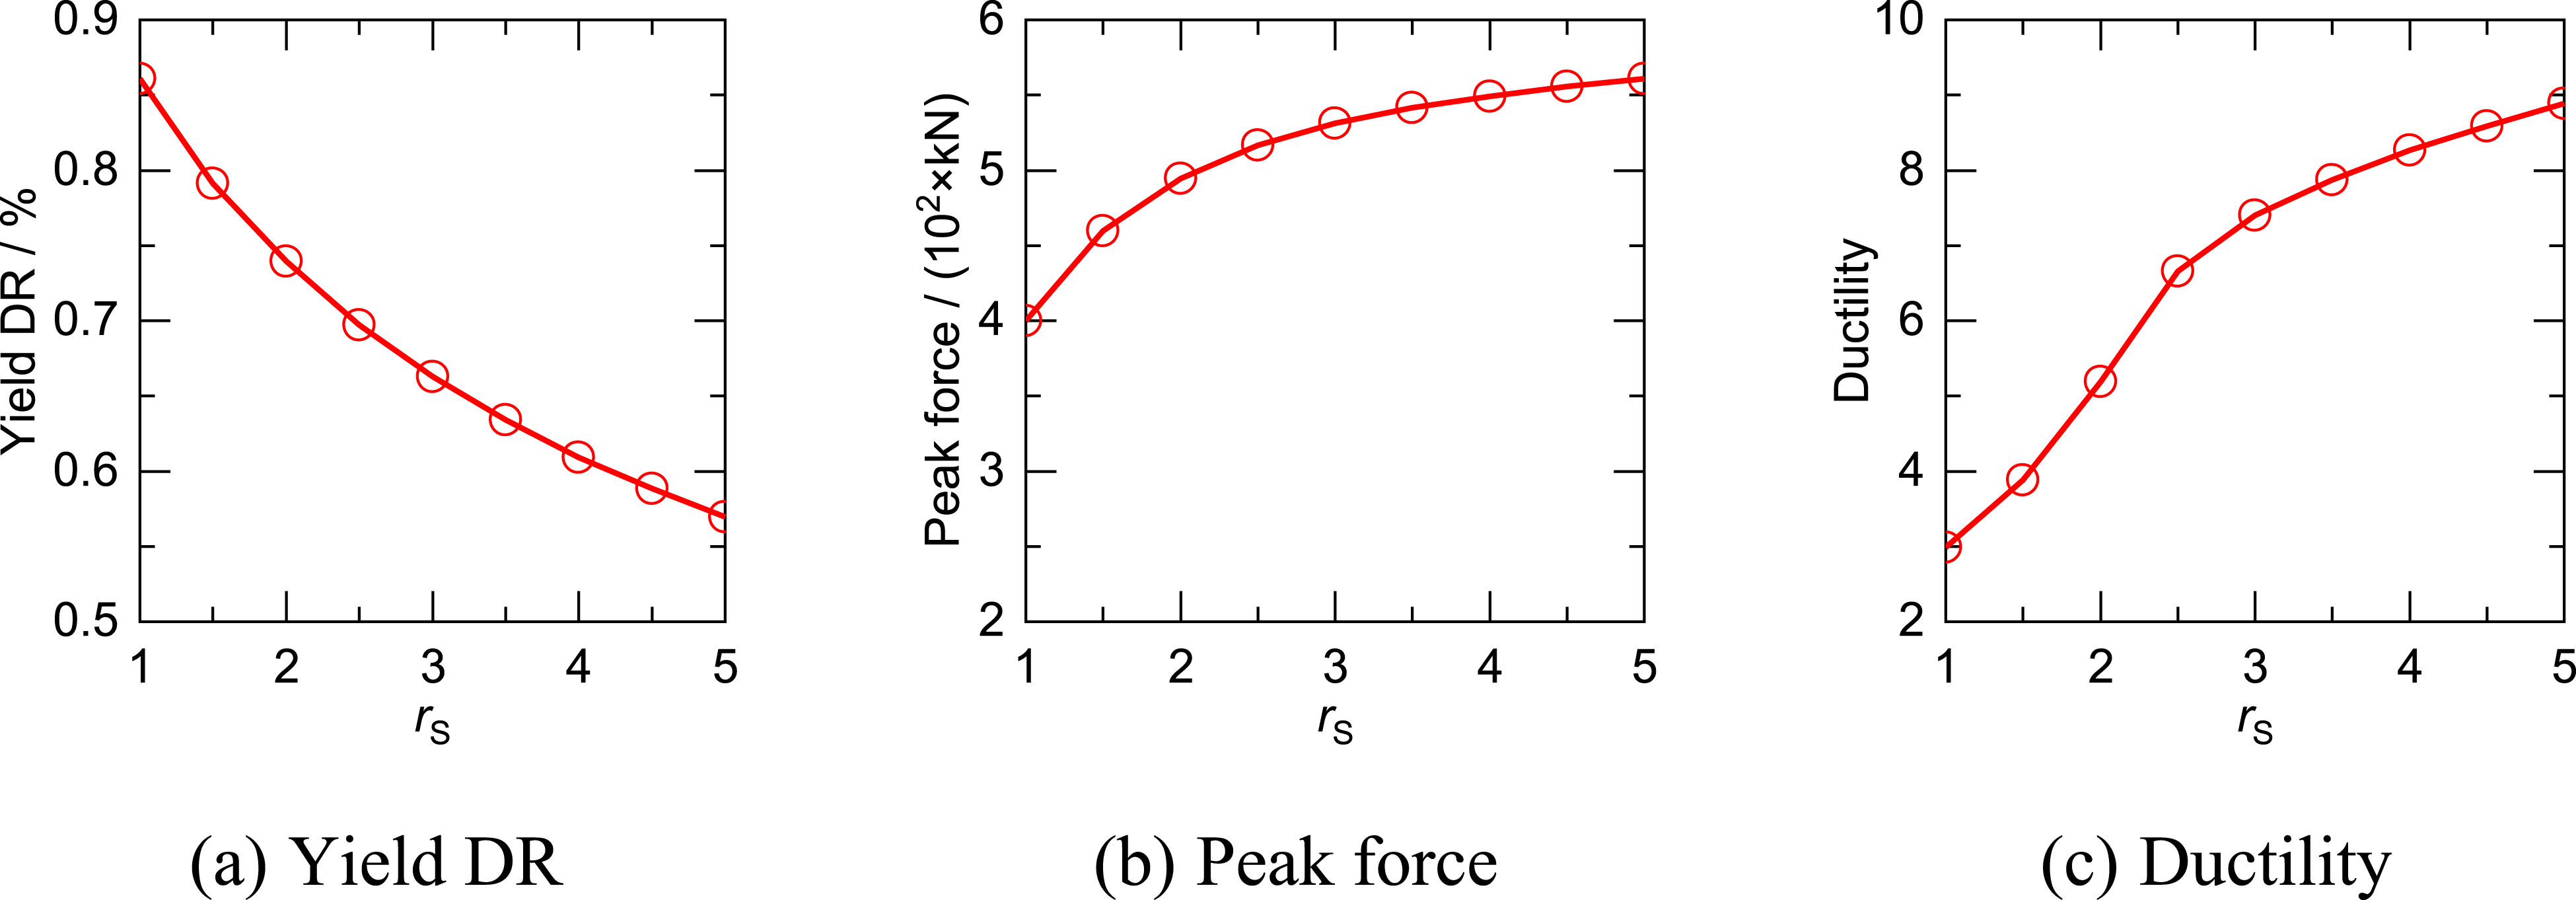
The coupling effect of rT and rS was further investigated. Figure 15 shows the parametric analysis results. To facilitate comparative analysis, the ratios of key parameters between the parametric specimen and the RC specimen were adopted. These parameters included the yield DR ratio (rθy), the peak force ratio (rFp), and ductility ratio (rμ). rθy exhibited a positive correlation with rT and a negative correlation with rS, as shown in Figure 15(a). An increase in rT resulted in a delay in the strain development of the reinforcement. Conversely, enhancing rS resulted in a decrease in the height of the compressive zone, thereby increasing the tensile strain of the reinforcement. Parametric analysis results.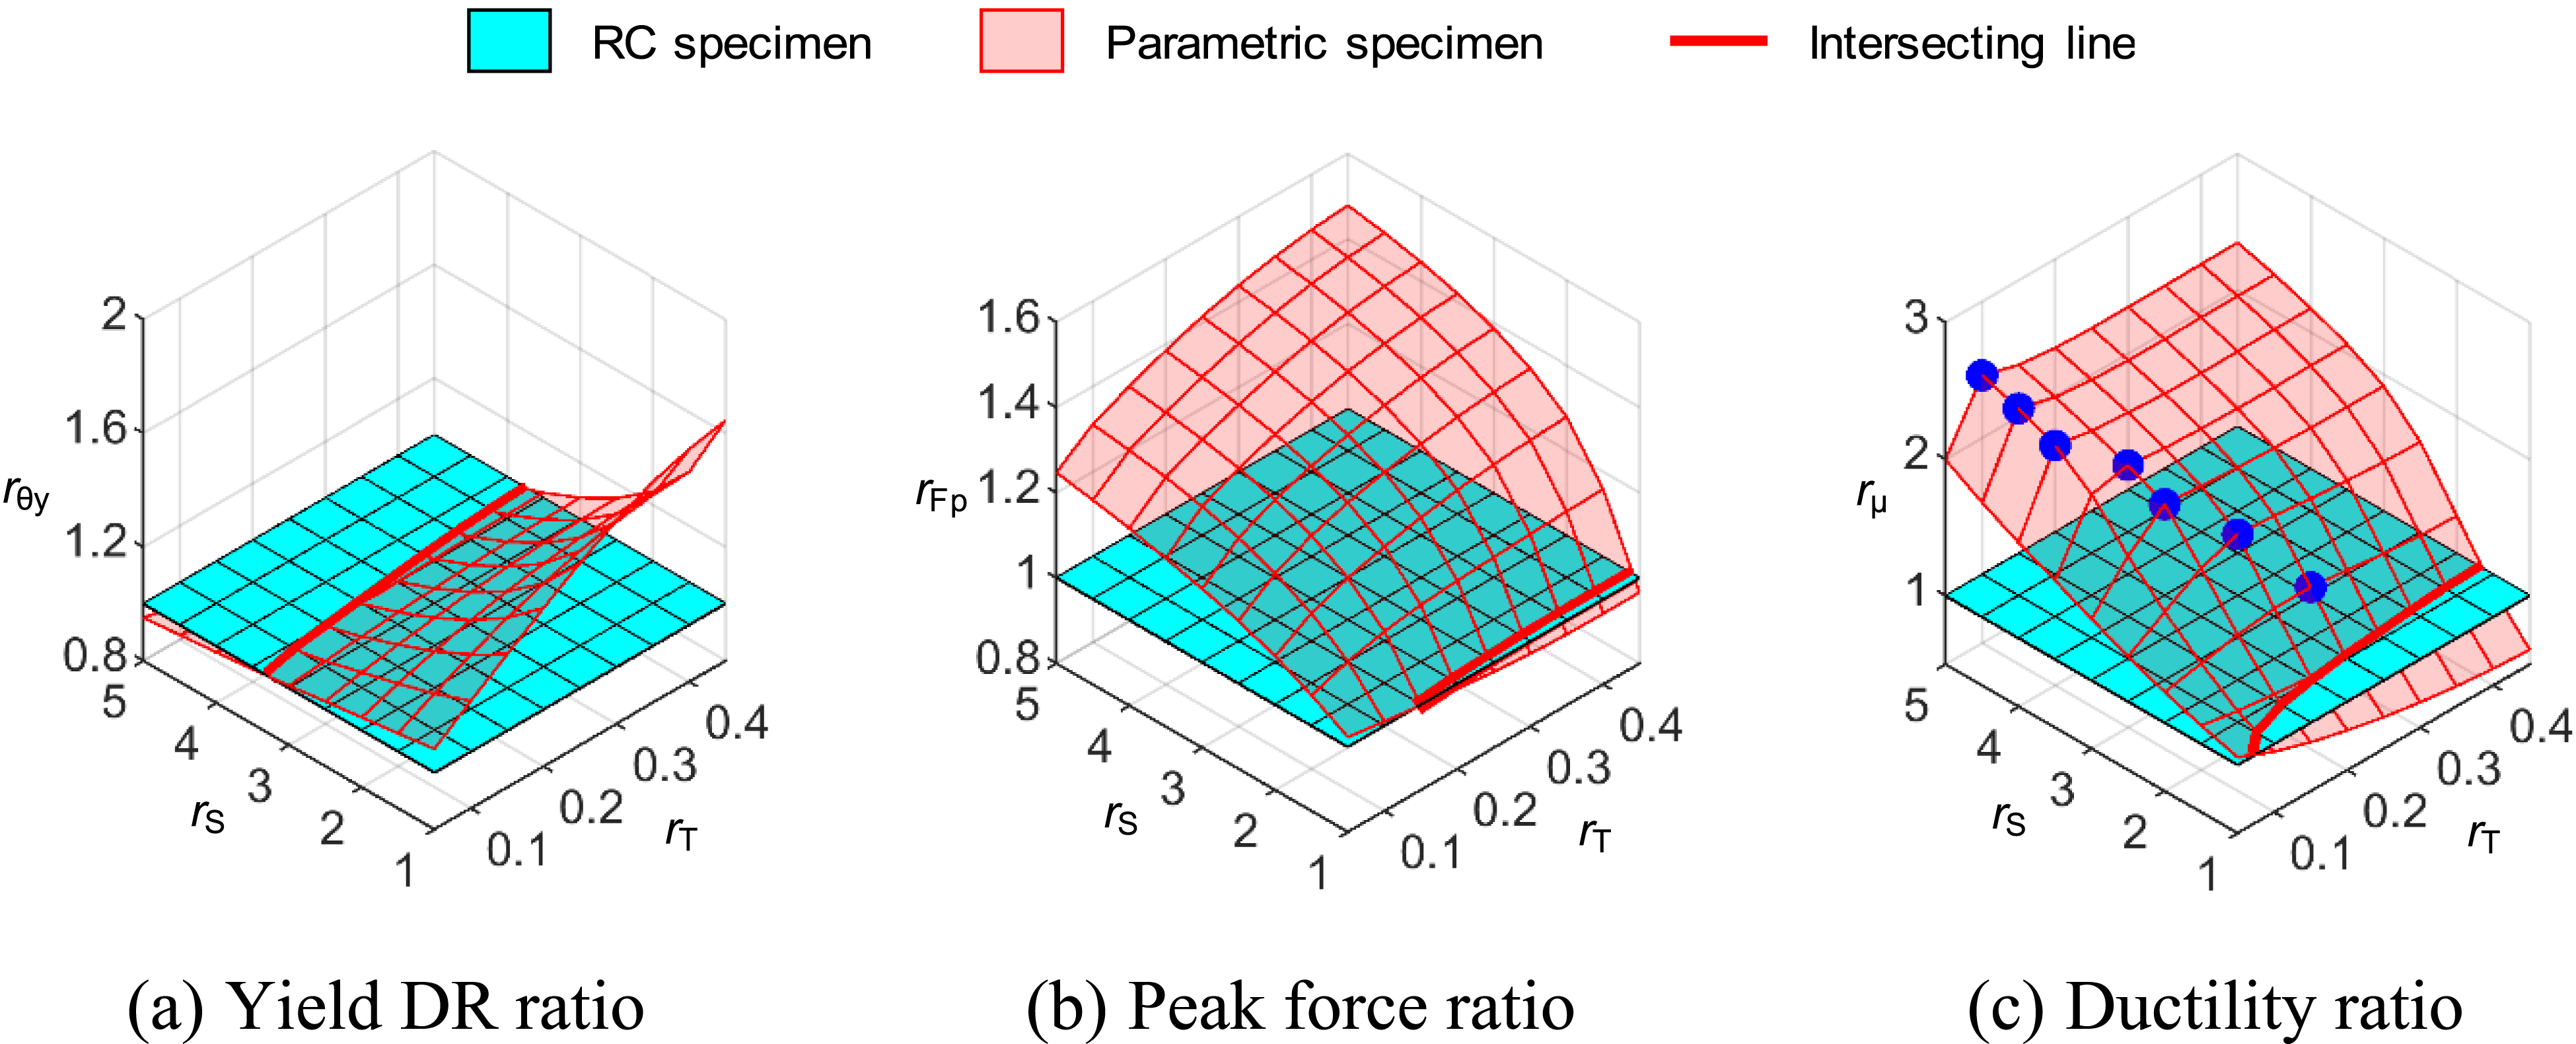
Figure 15(b) presents the analysis results for the rFp. Except for rS equal to 1, rFp increased with rS and rT, while the increase rate slowed down. This indicates that the superior performance of ECC may not be used sufficiently if ECC has exceedingly high compressive strength or ECC jacket has excessive thickness. When rS was equal to 1, because the uniaxial compressive strength of ECC was less than the confined strength of concrete, rFp tended to decrease as rT increased. Therefore, to maintain the bearing capacity of the column, it is recommended that the compressive strength of the ECC should exceed that of NC.
Figure 15(c) shows the parametric analysis results of the rμ. The rμ gradually increased with rS, possibly owing to the decrease of the yield DR and increase of ultimate deformability. When rS was less than 1.5, rμ decreased gradually as rT increased. However, if rS was greater than 2.0, rμ first increased and then decreased. The blue dots in Figure 15(c) represent the peak values of rμ at each rS level. Under a small rS, the ductility was primarily influenced by the yield DR. As rT increased, the rapid increase in the yield DR (Figure 15(a)) led to a gradual decrease in rμ. At a large rS, the yield DR varied within a limited range, and rμ was mainly affected by the ultimate DR. While the relationship between the ultimate DR and rT was not linear.
Figure 16 shows the sectional strain distribution under different rTs. When rT was small, the neutral axis crossed through NC. As rT increased, the compressive zone height h decreased owing to the enhanced pressure resistance resulting from the use of ECC. When rT was large, the neutral axis passed through the ECC jacket. Further increasing rT led to the enhancement of h owing to the improvement of the tensile resistance within the tensile zone. Therefore, the peak compressive strain of ECC first decreased and then increased. Conversely, the ultimate DR and ductility first increased and then decreased. Based on the above analyses, the composite column achieved the optimal ultimate DR and ductility when the neutral axis was at the interface between ECC and NC. Impact of different thicknesses of ECC jacket.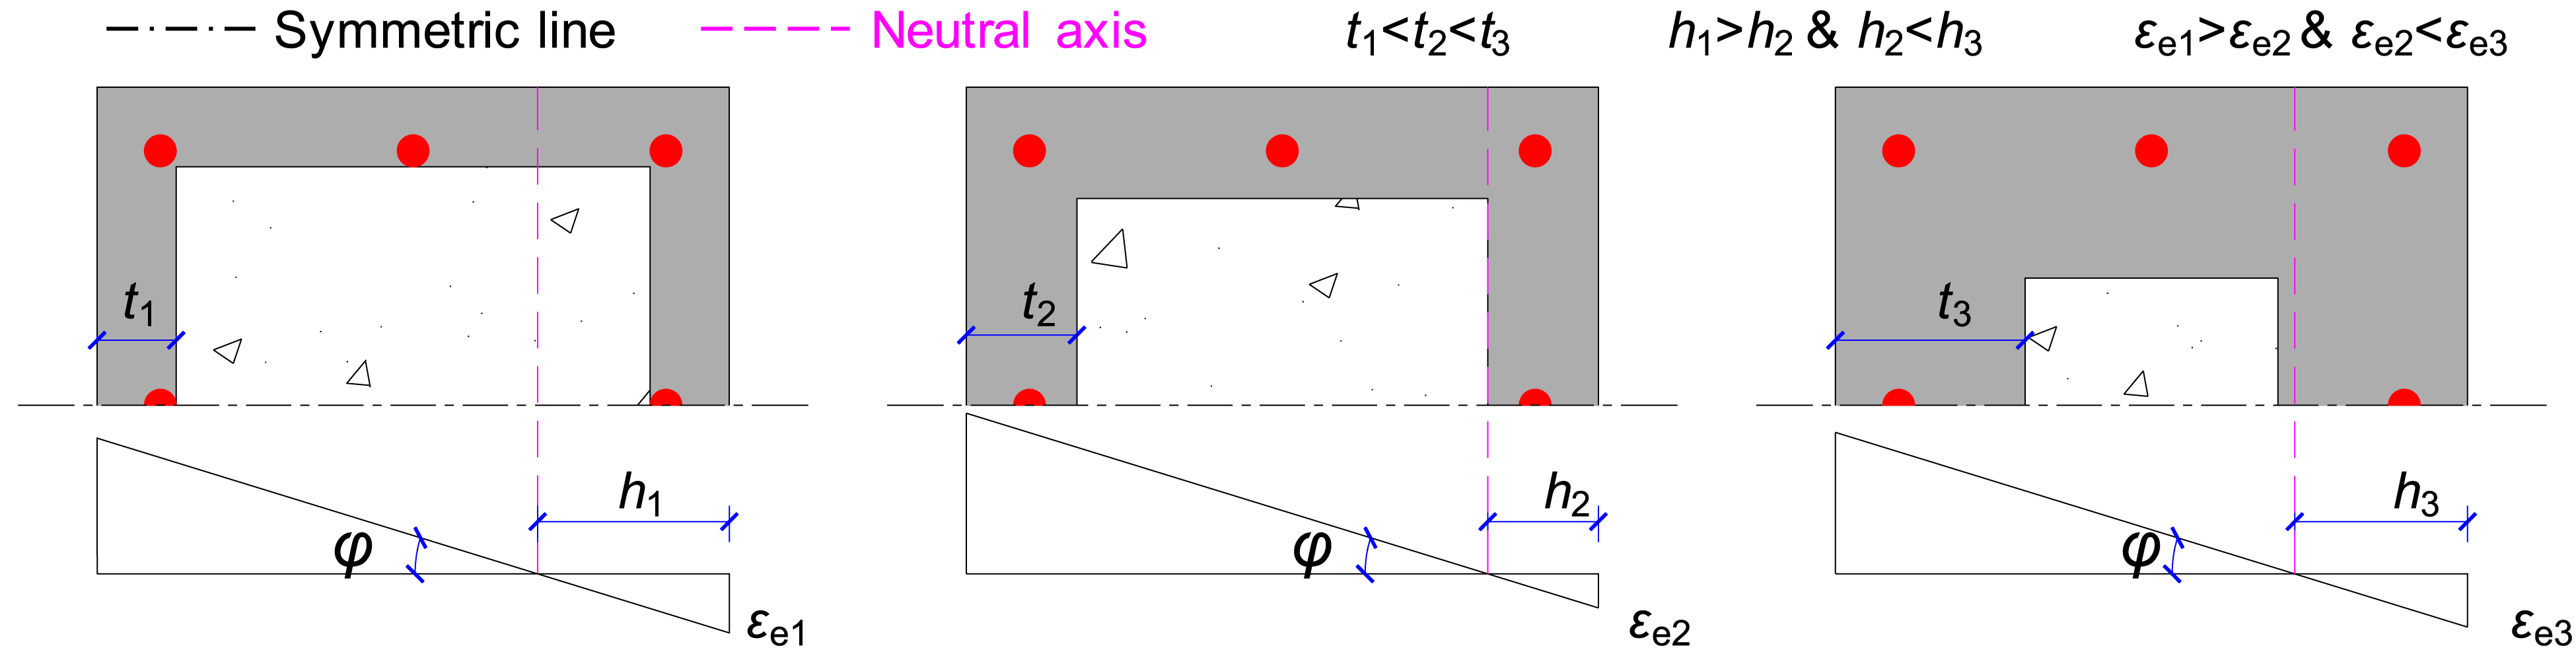
Notably, the peak force had also improved at the peak rμ dots. For example, when rS was equal to 5 in Figure 15(b), the peak force of the parametric column with an rT of 0.1 was 1.3 times that of the RC column; when rT increased to 0.45 about 4.5 times the previous, the peak force was only 1.15 times, showing insufficient utilization of the ECC jacket with excessive thickness. Therefore, considering the ductility and peak force, it is recommended that the composite column is designed based on the peak rμ.
Figure 17 shows the peak rμ dots in the rT – rS plan. The relationship was regressed with a quadratic function for the convenience of design, as expressed by equation (2). The coefficient of determination was 0.97 and the maximum relative error was 13.3%, indicating the high accuracy of the equation. Typically, when the adopted rS was between 2.0 and 3.0, the corresponding rT almost linearly decreased from 0.25 to 0.15. Notably, compared with specimen CC, the bearing capacity of CT did not markedly improve, but the ductility decreased, which is consistent with Figure 17. This demonstrates that the design equation for the thickness of the ECC jacket can ensure maximum ductility and leverage the full potential of ECC to enhance the bearing capacity of the composite column. rT - rS relationships.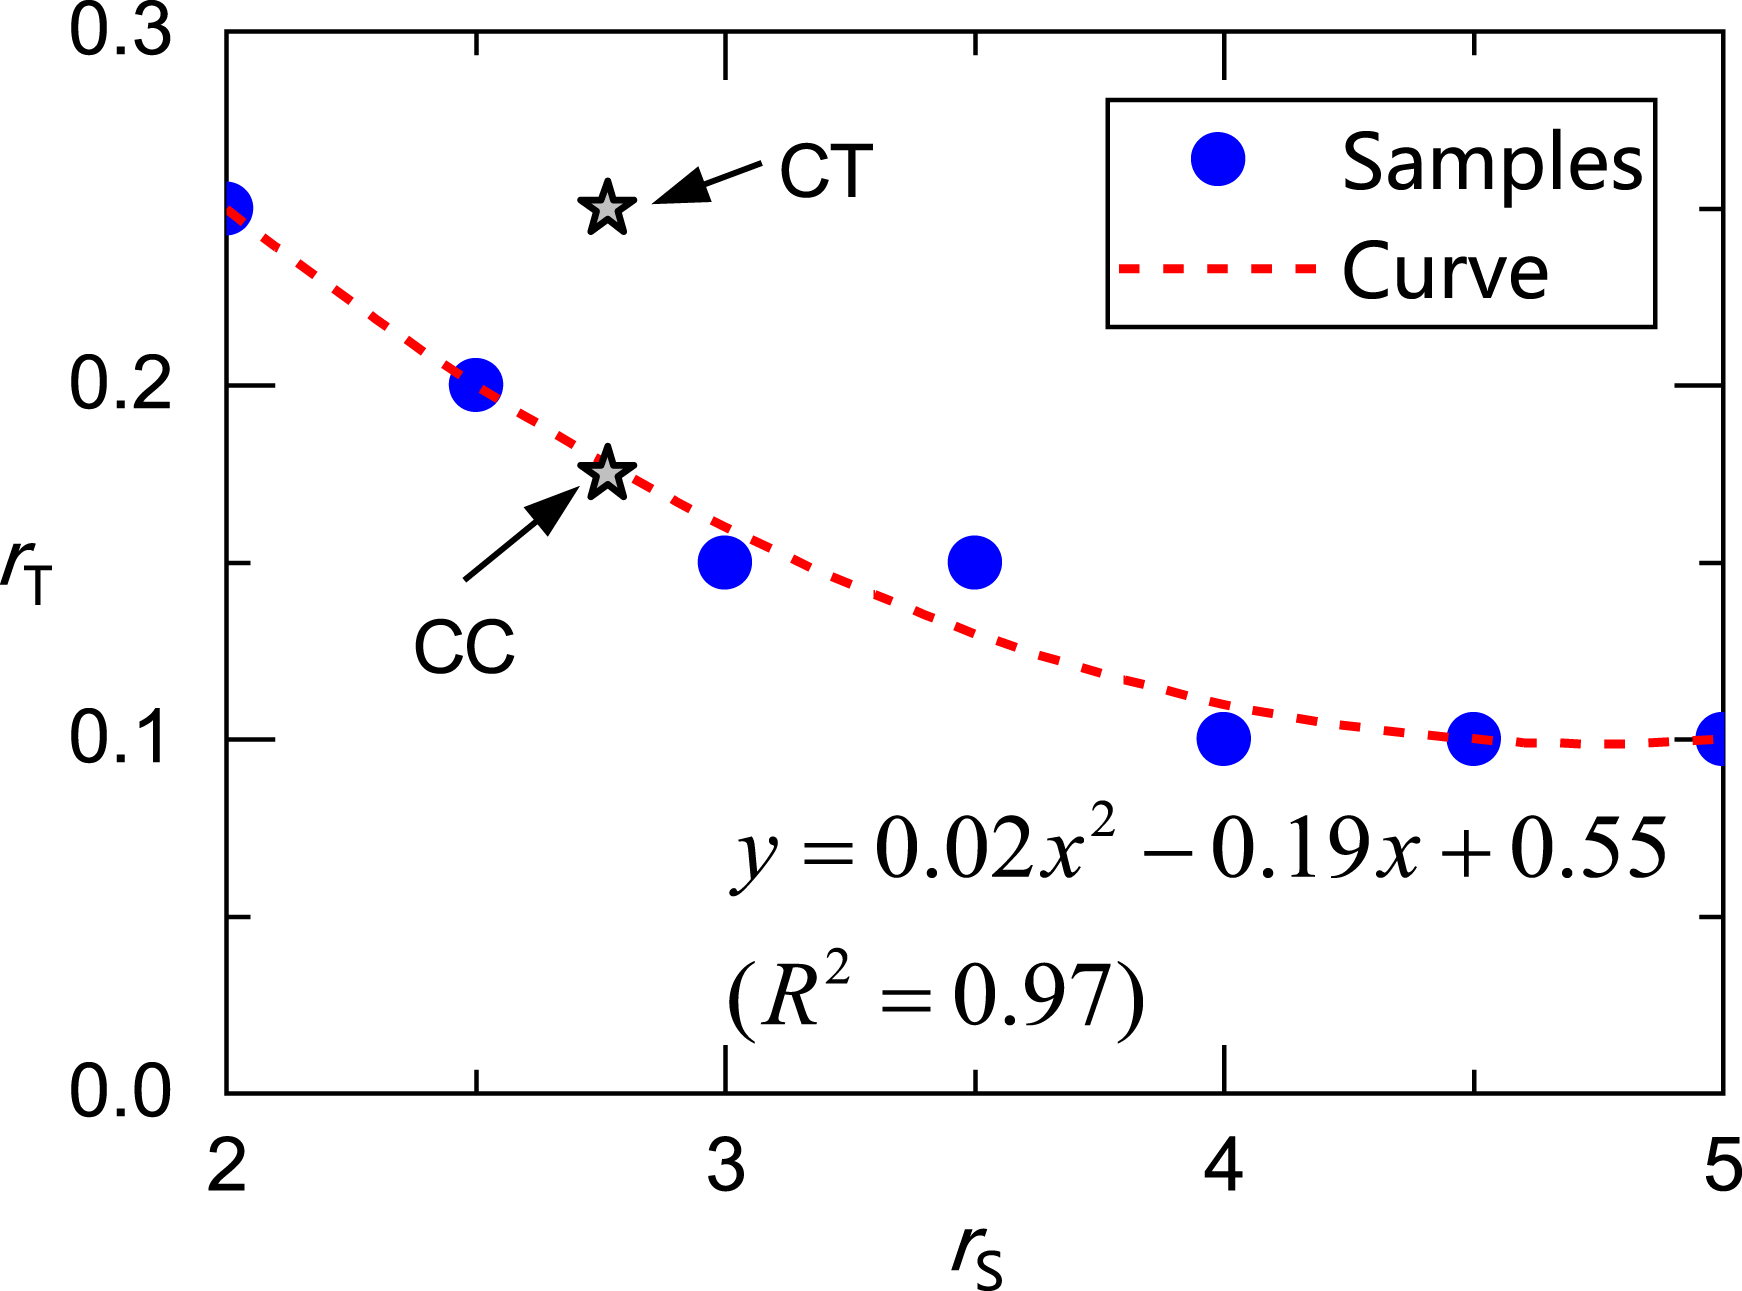
The rS was confined to a range of 2 to 5. The following practical application guidelines are proposed. First, determine the compressive strength of the concrete. Next, calculate the r
S
based on the target compressive strength of the ECC. Subsequently, determine the required r
T
using equation (2). Finally, compute the corresponding ECC jacket thickness. Notably, the proposed formula was derived based on typical reinforced concrete column configurations. If key design parameters of a column deviate significantly from the reference conditions, such as the axial load ratio and reinforcement ratio, the coefficients in the formula may require adjustment. Future research should therefore include a systematic parametric analysis. By performing extensive numerical calculations that vary critical design parameters, such as the axial load ratio and reinforcement ratio, a more generalized design formula for optimizing the ECC jacket thickness can be developed.
Conclusions
This study experimentally investigated the cyclic behavior of the ECC–NC composite column. The test parameters included various thicknesses of the ECC jacket, axial load ratio, and ECC jacket without concrete. Detailed observations were made regarding the cracking distribution, cyclic behavior, and damage and failure modes. The test results revealed that the thickness of the ECC jacket particularly affected the bearing capacity and ductility. Based on the test results, a numerical model was established and verified. Furthermore, parametric analysis was conducted to reveal the impact law, and a formula for the optimal design of the ECC jacket was derived. The main conclusions drawn from this study are as follows: (1) Benefiting from the superior properties of ECC, the composite column exhibited multiple and refined cracking patterns, which contributed to good cracking resistance. When subjected to the same axial load as the RC column, the composite column exhibited a bearing capacity and deformability that were approximately 1.15 times and 1.25 times those of the RC column respectively, with less compressive damage. (2) Composite columns without inner concrete exhibited similar behavior up to the peak force but with reduced ductility, indicating that the ECC jacket significantly contributed to the bearing capacity and the inner concrete played a crucial role in enhancing ductility, which correlated with the height of the sectional compressive zone and the thickness of the ECC jacket. (3) As the thickness of the ECC jacket increased toward the interior, the increased area approached the centroid, leading to an increase in the peak force, but the increase rate slowed down. Concurrently, the height of the sectional compressive zone decreased initially and then increased with the thickness of the ECC jacket, causing the ductility to first rise and then decline. (4) Based on the numerical analysis results, maximizing the ductility of composite columns can ensures that ECC is used to its full potential to balance both the bearing capacity and ductility. An optimal thickness formula for the ECC jacket is recommended with consideration of its compressive strength. Typically, when the ECC’s compressive strength is between 2.0 and 3.0 times that of concrete, the adopted thickness of the ECC jacket decreases almost linearly from 0.25 to 0.15 times the column side length.
Footnotes
Funding
The authors disclosed receipt of the following financial support for the research, authorship, and/or publication of this article: This study is supported by the National Key Research and Development Program of China (Grant No. 2022YFC3803000), National Natural Science Foundation of China (Grant No. 52438010), Sichuan Science and Technology Program (Grant No. 2023ZDZX0010), China Postdoctoral Science Foundation (Grant No. 2024M751699), Postdoctoral Fellowship Program of CPSF (Grant No. GZC20231352), Shui Mu Tsinghua Scholar Program of Tsinghua University (Grant No. 2023SM009). The authors acknowledge the financial support provided by Tsinghua University-China Construction Third Engineering Bureau Group Co., Ltd Joint Research Center for New Technology in Civil Engineering. The authors also acknowledge the financial support provided by the XPLORER PRIZE.
Declaration of conflicting interests
The authors declared no potential conflicts of interest with respect to the research, authorship, and/or publication of this article.
Data Availability Statement
All data are available from the corresponding author upon reasonable request.