
Abstract
Self-centering (SC) tall-pier bridges show strong potential for application in high-intensity seismic regions because of their excellent recentering ability and rapid post-earthquake functional recovery. However, their more complex structural system and additional components generally lead to higher initial construction costs than conventional reinforced concrete (RC) tall-pier bridges. To evaluate their practical feasibility, this study proposes a life-cycle cost assessment framework that accounts for initial construction cost, operation and maintenance cost, end-of-life cost, earthquake-induced loss, and environmental cost. Based on extensive nonlinear time-history analyses, probabilistic seismic demand models are established, and system-level fragility assessments are performed. The life-cycle costs of SC and conventional RC tall-pier bridges are then systematically compared. Results indicate that the SC tall-pier bridge has lower system fragility at all damage states, reflecting superior seismic resilience and post-earthquake recoverability. It also significantly reduces earthquake-induced economic losses and life-cycle carbon emissions. The initial construction cost ratio and discount rate are identified as the primary factors governing life-cycle economic performance. The SC bridge remains economically advantageous when its initial cost is controlled within 1.31 times that of the RC bridge, while this threshold decreases to 1.15 when a 10% target return is required. Overall, despite a higher initial cost, the SC bridge provides better life-cycle economic and environmental performance.
Keywords
Introduction
Recently, to traverse the rugged landscape of southwestern China, numerous tall-pier bridges with heights exceeding 40 m have been constructed (Chen et al., 2018). This region is seismically active, having experienced major earthquakes such as the 2008 Wenchuan earthquake (M8.0) and the 2013 Lushan earthquake (M7.0). These tall-pier bridges are critical components of regional transportation networks and play a vital role in post-earthquake emergency response and traffic restoration. Therefore, ensuring their functionality and rapid recovery after earthquakes is of significant engineering importance. However, conventional tall-pier bridges typically rely on ductility-based seismic design, where energy is dissipated through the yielding of plastic hinges at the pier bases. This approach often results in substantial residual deformations and structural damage, which prolongs repair time and hinders the restoration of functionality (Han et al., 2009; Schexnayder et al., 2014). In contrast, self-centering (SC) structures, which utilize unbonded post-tensioning (PT) tendons for recentering and replaceable energy dissipation devices (EDs), effectively control residual displacements and damage after earthquakes (Guo et al., 2016; Shi et al., 2023). This makes the self-centering system a promising solution for enhancing seismic resilience and enabling rapid functional recovery of tall-pier bridges.
Mander and Cheng (1997) pioneered a prestressed rocking pier concept motivated by damage-free design and experimentally demonstrated its strong recentering ability. However, the lack of dedicated energy dissipation (ED) elements led to limited hysteretic damping. To address this drawback, subsequent studies investigated self-centering (SC) piers equipped with internal (Ou et al., 2010; Palermo et al., 2007; Palermo and Pampanin, 2008; Solberg et al., 2009; Wang et al., 2008) or external (Chou and Chen, 2006; Marriott et al., 2009; ElGawady et al., 2010; ElGawady and Sha’Lan, 2011; Marriott et al., 2011; Guerrini et al., 2015; White and Palermo, 2016; Guo et al., 2016; Mashal and Palermo, 2019; Shi et al., 2023; Zhu et al., 2025a, 2025b) ED devices, generally showing that properly designed EDs can dissipate seismic energy while preserving the recentering function. To mitigate local concrete crushing at the rocking interface, additional confinement measures, such as steel jackets (Cheng, 2008; Chou and Chen, 2006; Dawood et al., 2014; Jeong et al., 2008) and FRP jackets (ElGawady et al., 2010; ElGawady and Sha’Lan, 2011; ElGawady and Dawood, 2012; Guo et al., 2016) were also proposed and validated (Palermo et al., 2005; Solberg et al., 2009).
To date, dedicated research on the seismic behavior of self-centering (SC) tall-pier bridge systems remains limited. Chen and Li (2020a, 2020b) examined several response-control and retrofit measures for tall-pier bridges, including lead-rubber bearings and rocking foundations, and evaluated supplemental damping devices such as yielding steel-cable systems, viscous dampers, and superelastic shape-memory-alloy (SMA) cables. More recently, Shi et al. (2025) proposed a self-centering tall-pier bridge system and verified its superior post-earthquake performance through shake-table experiments.
Greenhouse gas emissions are a major driver of global climate change, and the construction, transportation, and industrial sectors contribute substantially to this problem (Wang et al., 2021). For bridges, environmental impacts are mainly associated with life-cycle carbon emissions from material production, transportation, construction, operation and maintenance, post-earthquake repair, and end-of-life disposal. In seismic regions, structural damage and subsequent repair or reconstruction can further increase carbon emissions and environmental burdens, linking bridge recovery performance closely to life-cycle environmental impact (Gonzalez et al., 2022; Thormark, 2007). Therefore, incorporating environmental costs into life-cycle cost assessment enables a more comprehensive evaluation of bridge systems and supports the low-carbon and sustainable design of seismic-resistant bridges.
Although existing studies have shown that SC bridge systems provide superior post-earthquake performance, their wider engineering application still requires quantitative verification from a life-cycle economic perspective. Lee and Billington (2011) found that SC bridges may experience displacement demands similar to those of conventional bridges, but with much smaller residual displacements, leading to comparable repair costs and markedly reduced downtime. Zheng and Dong (2019), Xiang et al. (2020), Giouvanidis and Dong (2020), and Li et al. (2020) further demonstrated that self-centering or rocking bridge systems can effectively reduce damage probability, residual deformation, and seismic losses, thereby improving long-term economic performance. Recent studies have highlighted the importance of evaluating the long-term seismic resilience and sustainability of bridges under environmental degradation. For instance, Feng et al. (2026) investigated coastal highway bridges subjected to chloride-induced corrosion and predicted their long-term seismic resilience. Lei et al. (2025) applied active learning-enhanced Bayesian neural networks to predict and interpret the life-cycle performance of coastal and marine prestressed concrete beams. Similarly, Guo et al. (2024a) analyzed the life-cycle seismic resilience of sea-crossing bridge piers exposed to marine corrosion, while Guo et al. (2024b) proposed an ensemble learning framework for predicting and interpreting the life-cycle performance of coastal and marine reinforced concrete structures. These studies provide a theoretical and methodological foundation for integrating seismic, durability, and sustainability considerations in bridge design and assessment. However, most existing studies have mainly focused on earthquake-induced losses, while a comprehensive life-cycle cost framework covering initial construction, operation, maintenance, and end-of-life stages is still lacking. This gap limits a full understanding of the whole-life economic performance of SC bridge systems and may hinder their broader acceptance and practical application.
This study develops a life-cycle cost assessment framework for SC tall-pier bridges and compares their whole-life performance with that of conventional tall-pier bridges. The framework considers initial construction, operation and maintenance, end-of-life, earthquake-induced, and environmental costs. Finite-element models are established in OpenSees, followed by extensive nonlinear time-history analyses to develop probabilistic seismic demand models and evaluate system-level fragilities. Combined with seismic hazard, loss, and environmental impact analyses, the life-cycle costs of the two bridge systems are quantified and compared to clarify the advantages of SC tall-pier bridges in seismic resilience, post-earthquake recoverability, and long-term economic performance.
Methodology of life-cycle cost assessment
Life-cycle cost assessment is a comprehensive economic evaluation approach that quantifies the costs incurred by a structure or system throughout its entire life cycle, from design and construction to operation, maintenance, and eventual decommissioning. It aims to support decision-makers in making more informed and cost-effective choices. For bridges subjected to seismic actions, the life-cycle cost typically comprises the following five components:

The value of C
ICC
can be estimated using the following equation (Mander, 1999):

For the maintenance stage, the C
MC
is mainly attributable to the material consumption associated with the repair or replacement of bridge components. Based on prior studies (Hu and Zhu, 2023), this study simply assumes that maintenance is performed once every 20 years and that the cost of each maintenance action is 1% of the bridge’s initial construction cost (C
ICC
). Accordingly, the C
MC
is calculated as (Ping et al., 2025):
The cost at the end-of-life stage, C
ELC
, mainly consists of expenses associated with structural demolition, waste transportation, sorting and processing, and subsequent recycling or landfilling, and its magnitude depends on the specific disposal scenario considered. Additionally, the economic benefits arising from material reuse, recycling, and energy recovery should also be taken into account. Therefore, the C
ELC
can be calculated by comprehensively considering demolition, transportation, disposal, and recovery benefits, as follows:
The seismic life-cycle loss, C
EQL
, can be estimated based on the expected annual seismic loss (C
ASL
) (Porter et al., 2024):
Assuming that earthquake occurrence follows a Poisson process, C
ASL
can be calculated using the following equation (Huang et al., 2018):
The economic consequences induced by seismic hazards generally consist of two components: direct loss, which mainly represents the repair or replacement costs of structural components or bridge systems after an earthquake; and indirect loss, which results from traffic disruption caused by bridge damage, including detour-related operating costs and monetized travel time losses. For practical estimation, it is assumed that the repair cost associated with each damage state is proportional to the initial construction cost of the bridge. Therefore, the repair cost corresponding to the jth damage state, CREP,
j
can be calculated as follows (Stein et al., 1999):

In this study, the life-cycle environmental cost, C
ENC
, considered is mainly associated with the carbon emissions of the bridge, and it can be calculated as follows (Mehrzad et al., 2023):

The life-cycle cost of the bridge was ultimately calculated using equation (1), and the detailed analytical procedure and implementation steps are presented in the case study in Section 5.
Prototype and proposed SC tall-pier bridge
Bridge description
A representative three-span continuous tall-pier bridge in southwestern China is adopted as the prototype (Figure 1(a)). The superstructure is carried by two intermediate RC tall piers and two abutments. Each pier is 50 m high, with a 3.5 m × 5.0 m base section and a 0.6 m wall thickness, and is inclined at 1/80. The piers are made of C40 concrete. The girder is monolithically connected to the interior piers and supported at the abutments by sliding bearings. Prototype and SC tall-pier bridge (units: m).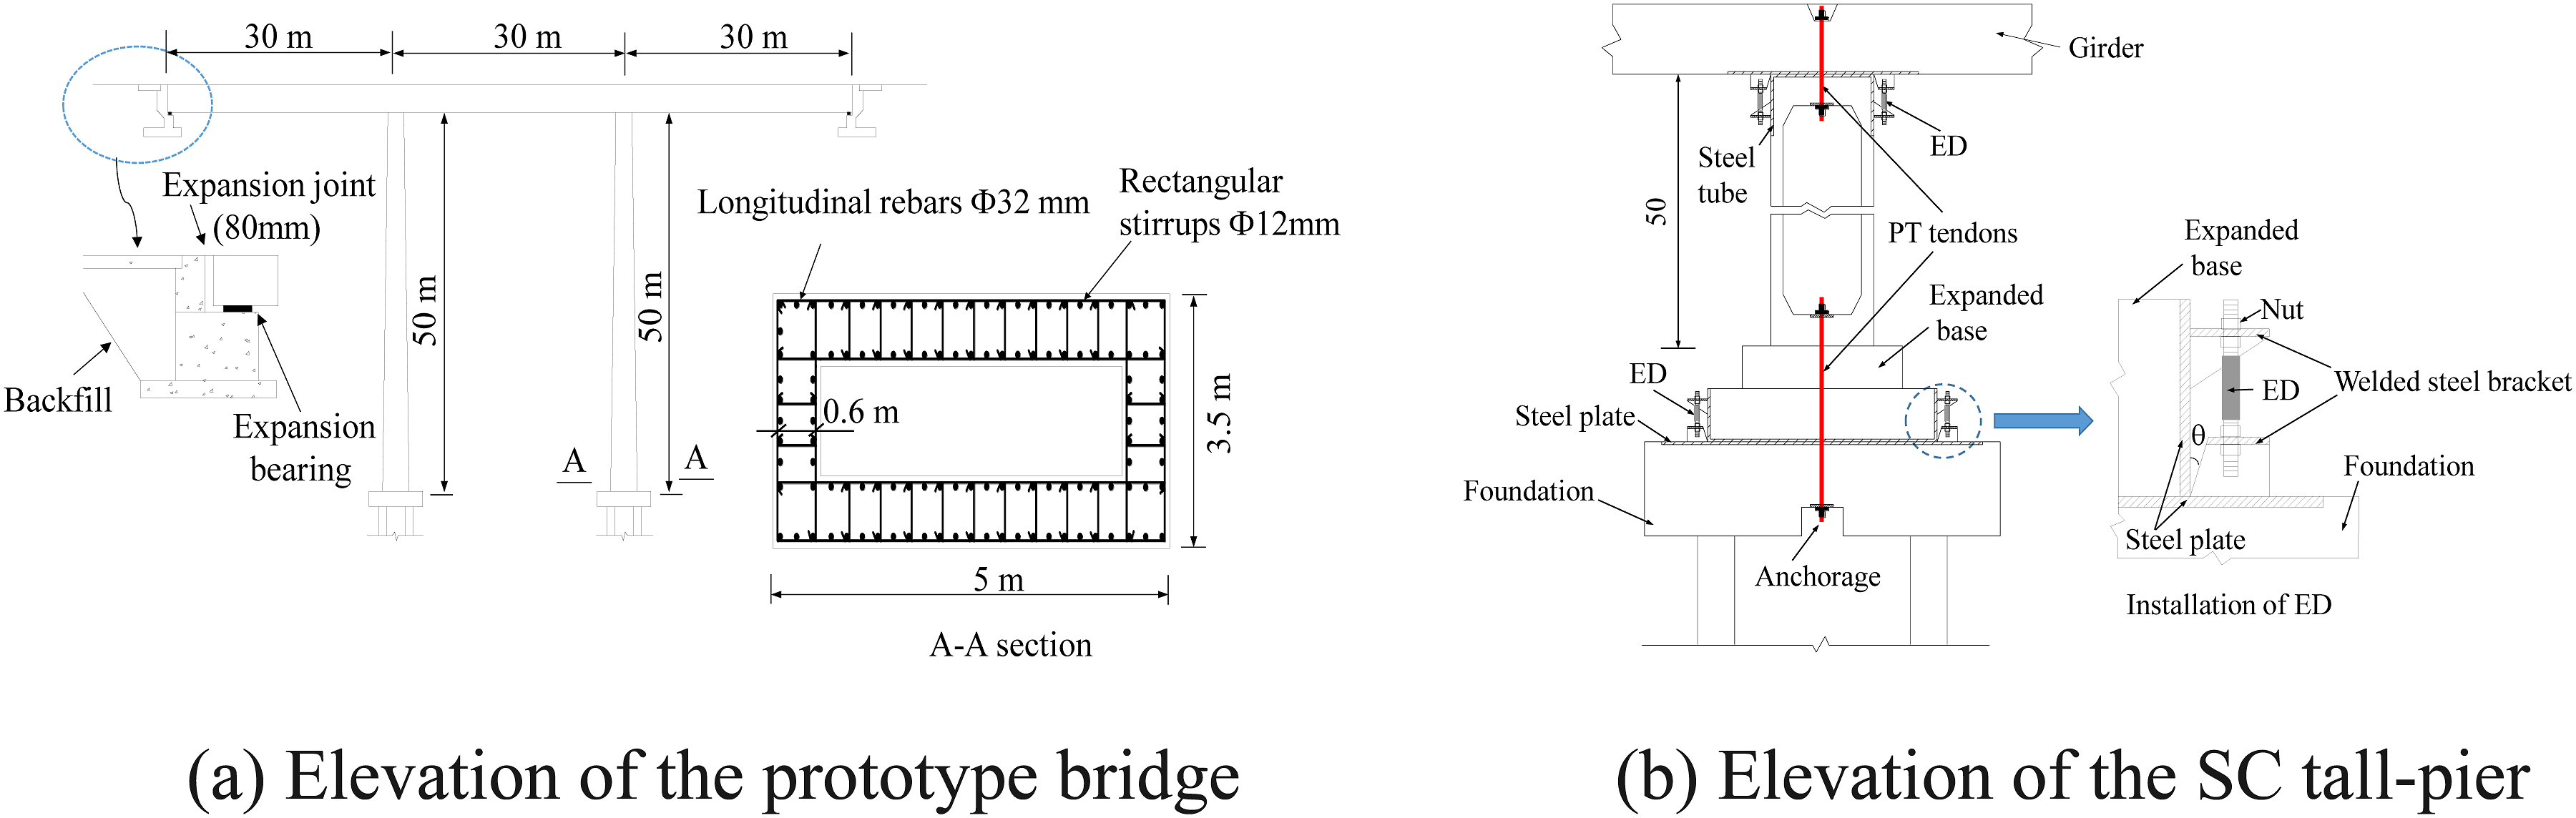
To enhance post-earthquake functionality, Shi et al. (2025) developed an SC tall-pier bridge configuration (Figure 1(b)). The girder, pier, and foundation are fabricated separately and assembled through unbonded PT tendons anchored at both pier ends. A cast-in-place expanded base is used to increase overturning resistance. Replaceable external EDs are installed at the pier top and bottom to provide supplemental damping. At the base, the EDs are bolted to steel brackets on the expanded base and the foundation; the bracket edges are slightly inclined to accommodate uplift while transferring shear and torsion. The upper EDs adopt an identical connection scheme.
Following an equal-capacity design criterion, the initial PT force Fp0 and the ED reduced-section diameter d0 were determined using the equations below (Chen and Li, 2020b):


Moreover, Seo and Sause (2005) suggested that adequate recentering is achieved when the energy-dissipation ratio β falls within 0–50%. Accordingly, β is taken as 0.35 in this study and is evaluated using the following expression:
A moment-curvature analysis of the prototype tall pier was carried out in OpenSees (McKenna et al., 2000), yielding a base yield moment of 9.65 × 10⁴ kN⋅m. A total of 20 mild-steel ED bars (nominal yield strength fy = 235 MPa) were deployed in the longitudinal direction, with d1 = 150 mm. Using these inputs, Fp0 = 3400 kN at the pier base and Fp0 = 7200 kN at the pier top were determined, and the corresponding d0 = 44 mm. Assume that the expanded base has a base plan dimension of 6 m × 6 m and a total height of 2 m.
The SC tall pier achieves rapid post-earthquake recentering and residual damage control through the combined action of unbonded PT tendons, replaceable ED devices, and an expanded base. The PT tendons are anchored at both ends to provide a restoring force, driving the pier back to its original position after rocking. The initial prestress is designed to balance the bending moments from the superstructure, PT tendons, and ED devices, ensuring that the pier does not exceed allowable curvature or tilt during recentering. ED devices are installed at both the top and base of the pier to dissipate energy while maintaining the PT restoring force. Their location and cross-sectional design achieve an energy dissipation ratio of approximately 0.35, providing effective energy absorption without compromising recentering performance. The pier base is designed with a controlled rocking interface, allowing slight rotation under seismic excitation to limit plastic deformation of the concrete. The expanded base increases overturning resistance, and steel or FRP sleeves can be applied at the rocking interface to prevent local damage. Overall, the SC pier design integrates controlled rocking, PT restoring forces, and replaceable ED devices to minimize residual displacements, enable rapid post-earthquake recovery, and reduce system-level fragility. Compared with conventional RC piers, the SC pier demonstrates significant advantages in terms of seismic resilience and adaptability.
Finite element modeling
The finite element models of both the prototype and SC tall-pier bridges were developed using the OpenSees software (McKenna et al., 2000). Figure 2 illustrates the numerical models of both types of bridges, incorporating the effects of higher-order modes and boundary conditions, such as the abutments and bearings. The modeling of the SC tall-pier bridge primarily involves including key details, such as the rocking interface, PT tendons, and EDs, into the model to capture its SC and energy dissipation mechanisms. Detailed finite-element modeling procedures are available in our previous study (Shi et al., 2026). Finite element models of the prototype and SC tall-pier bridges.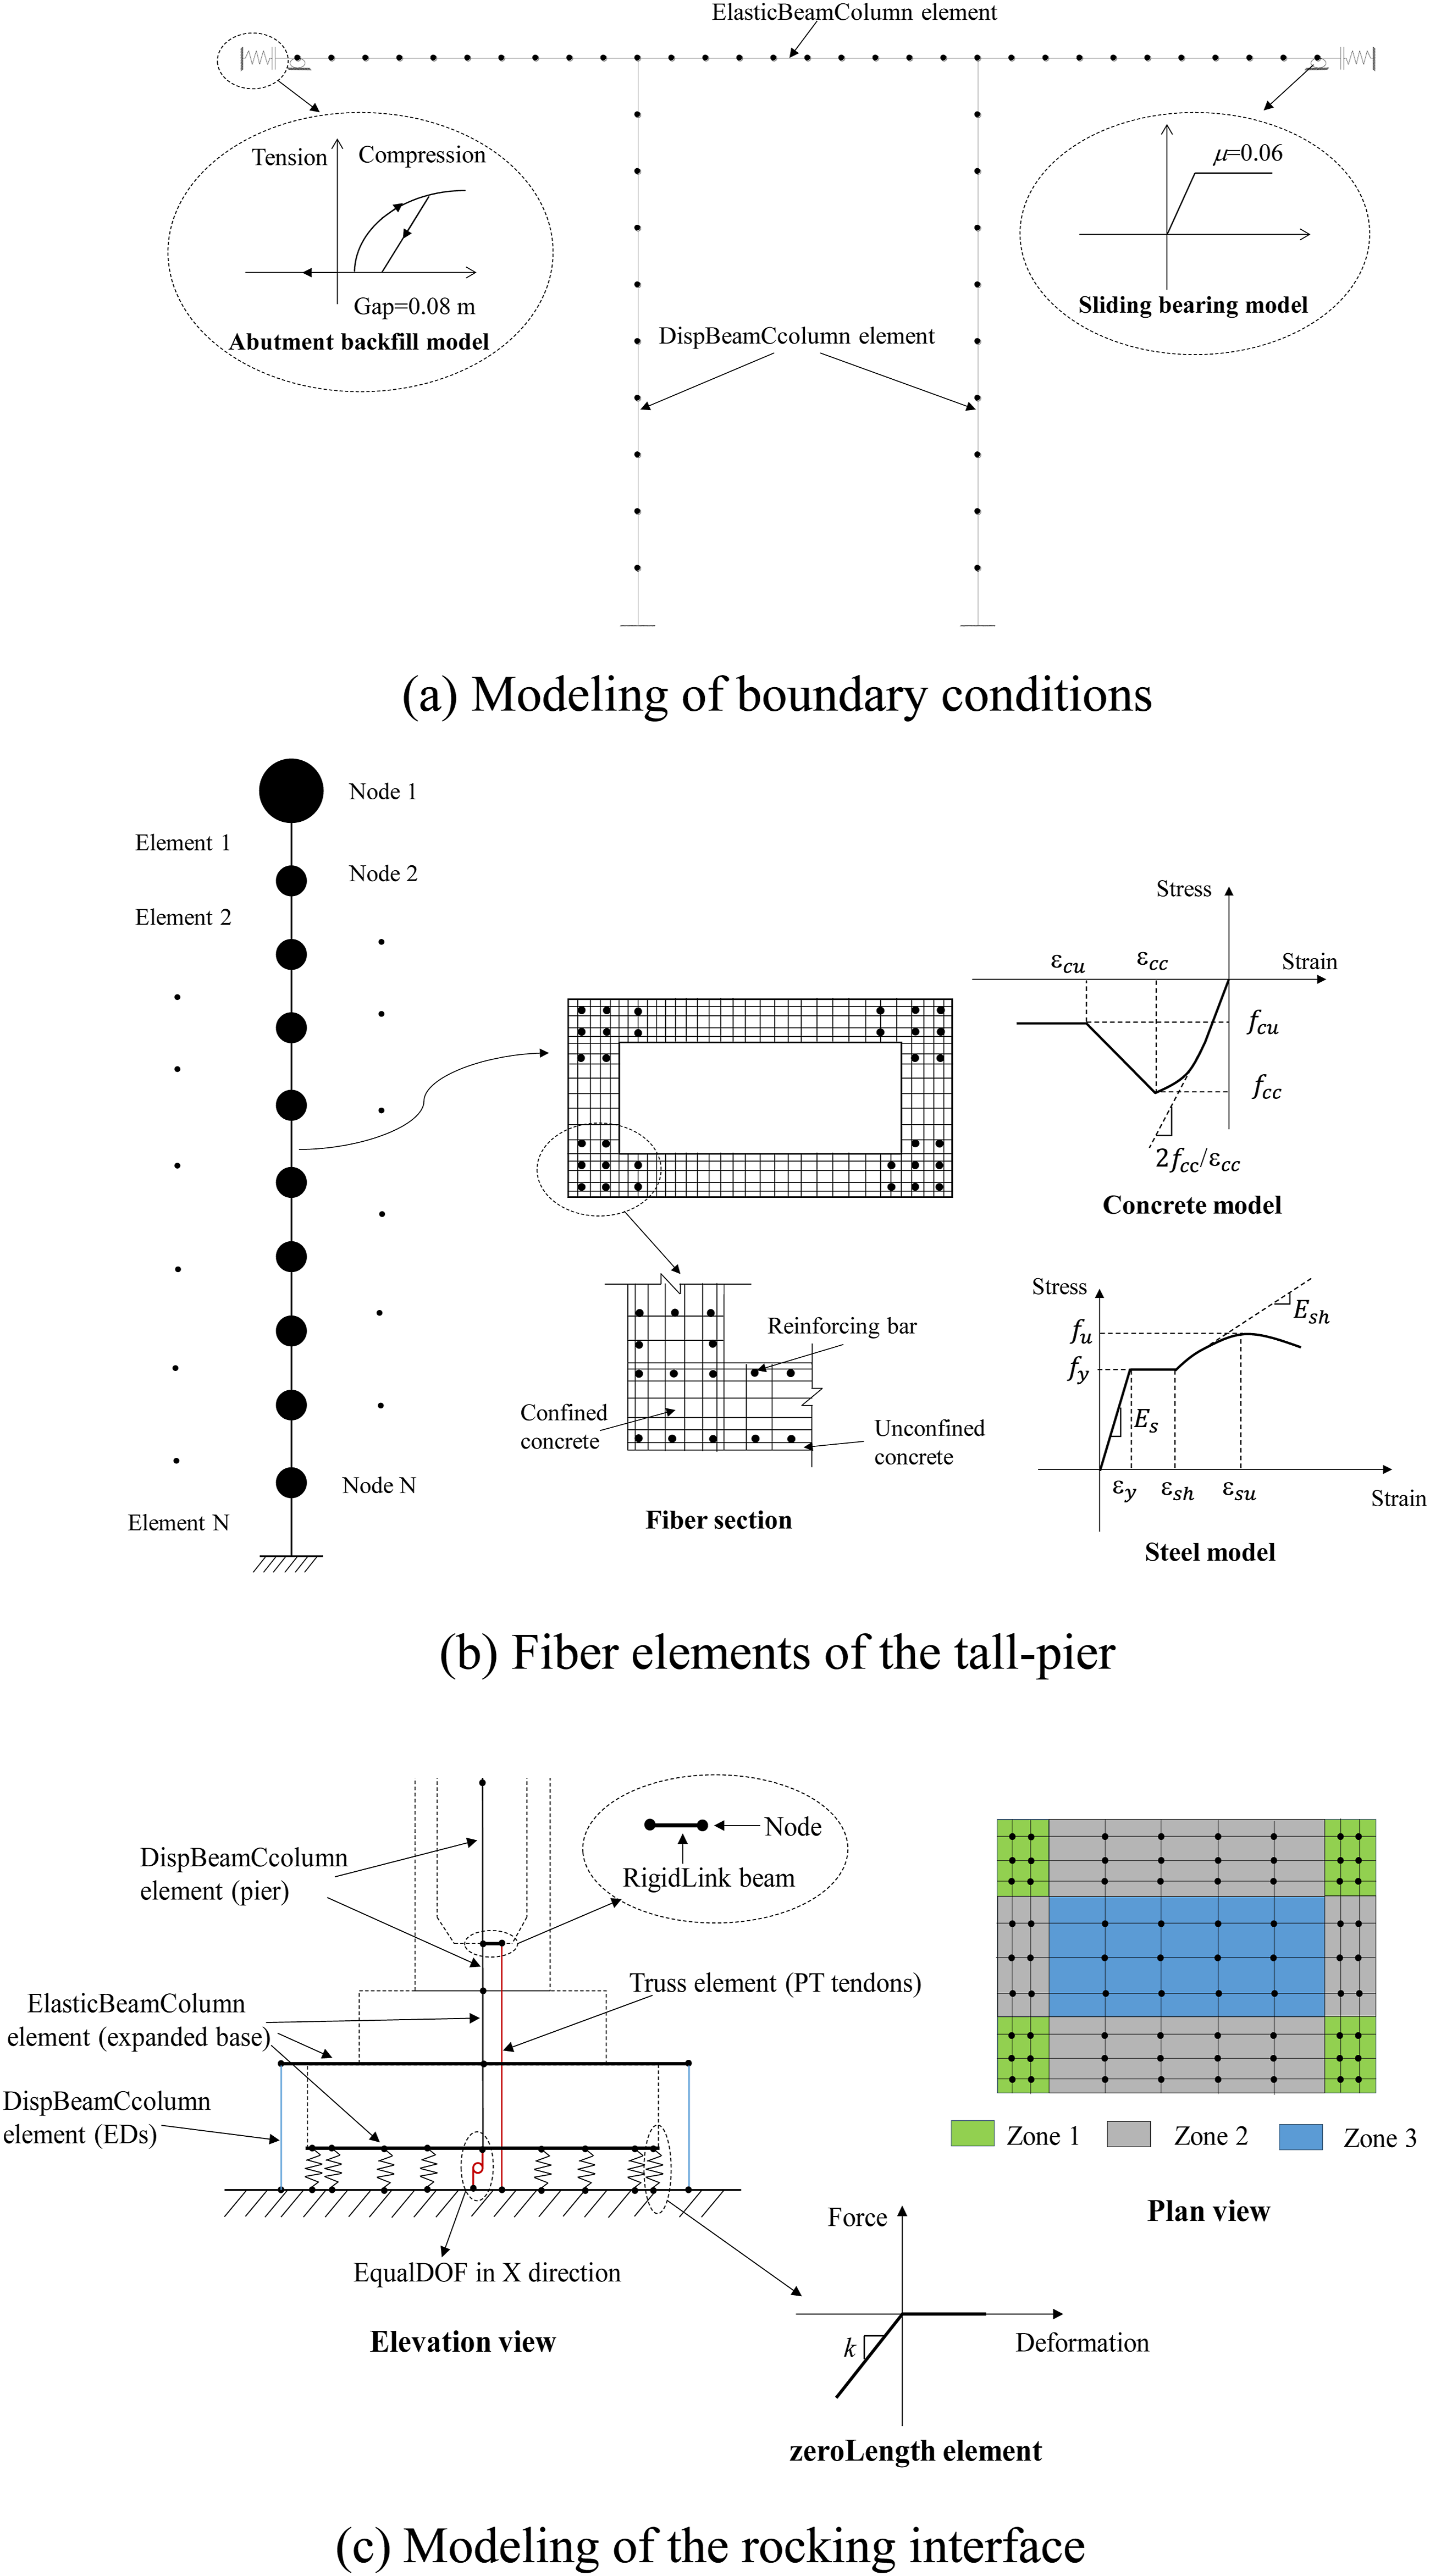
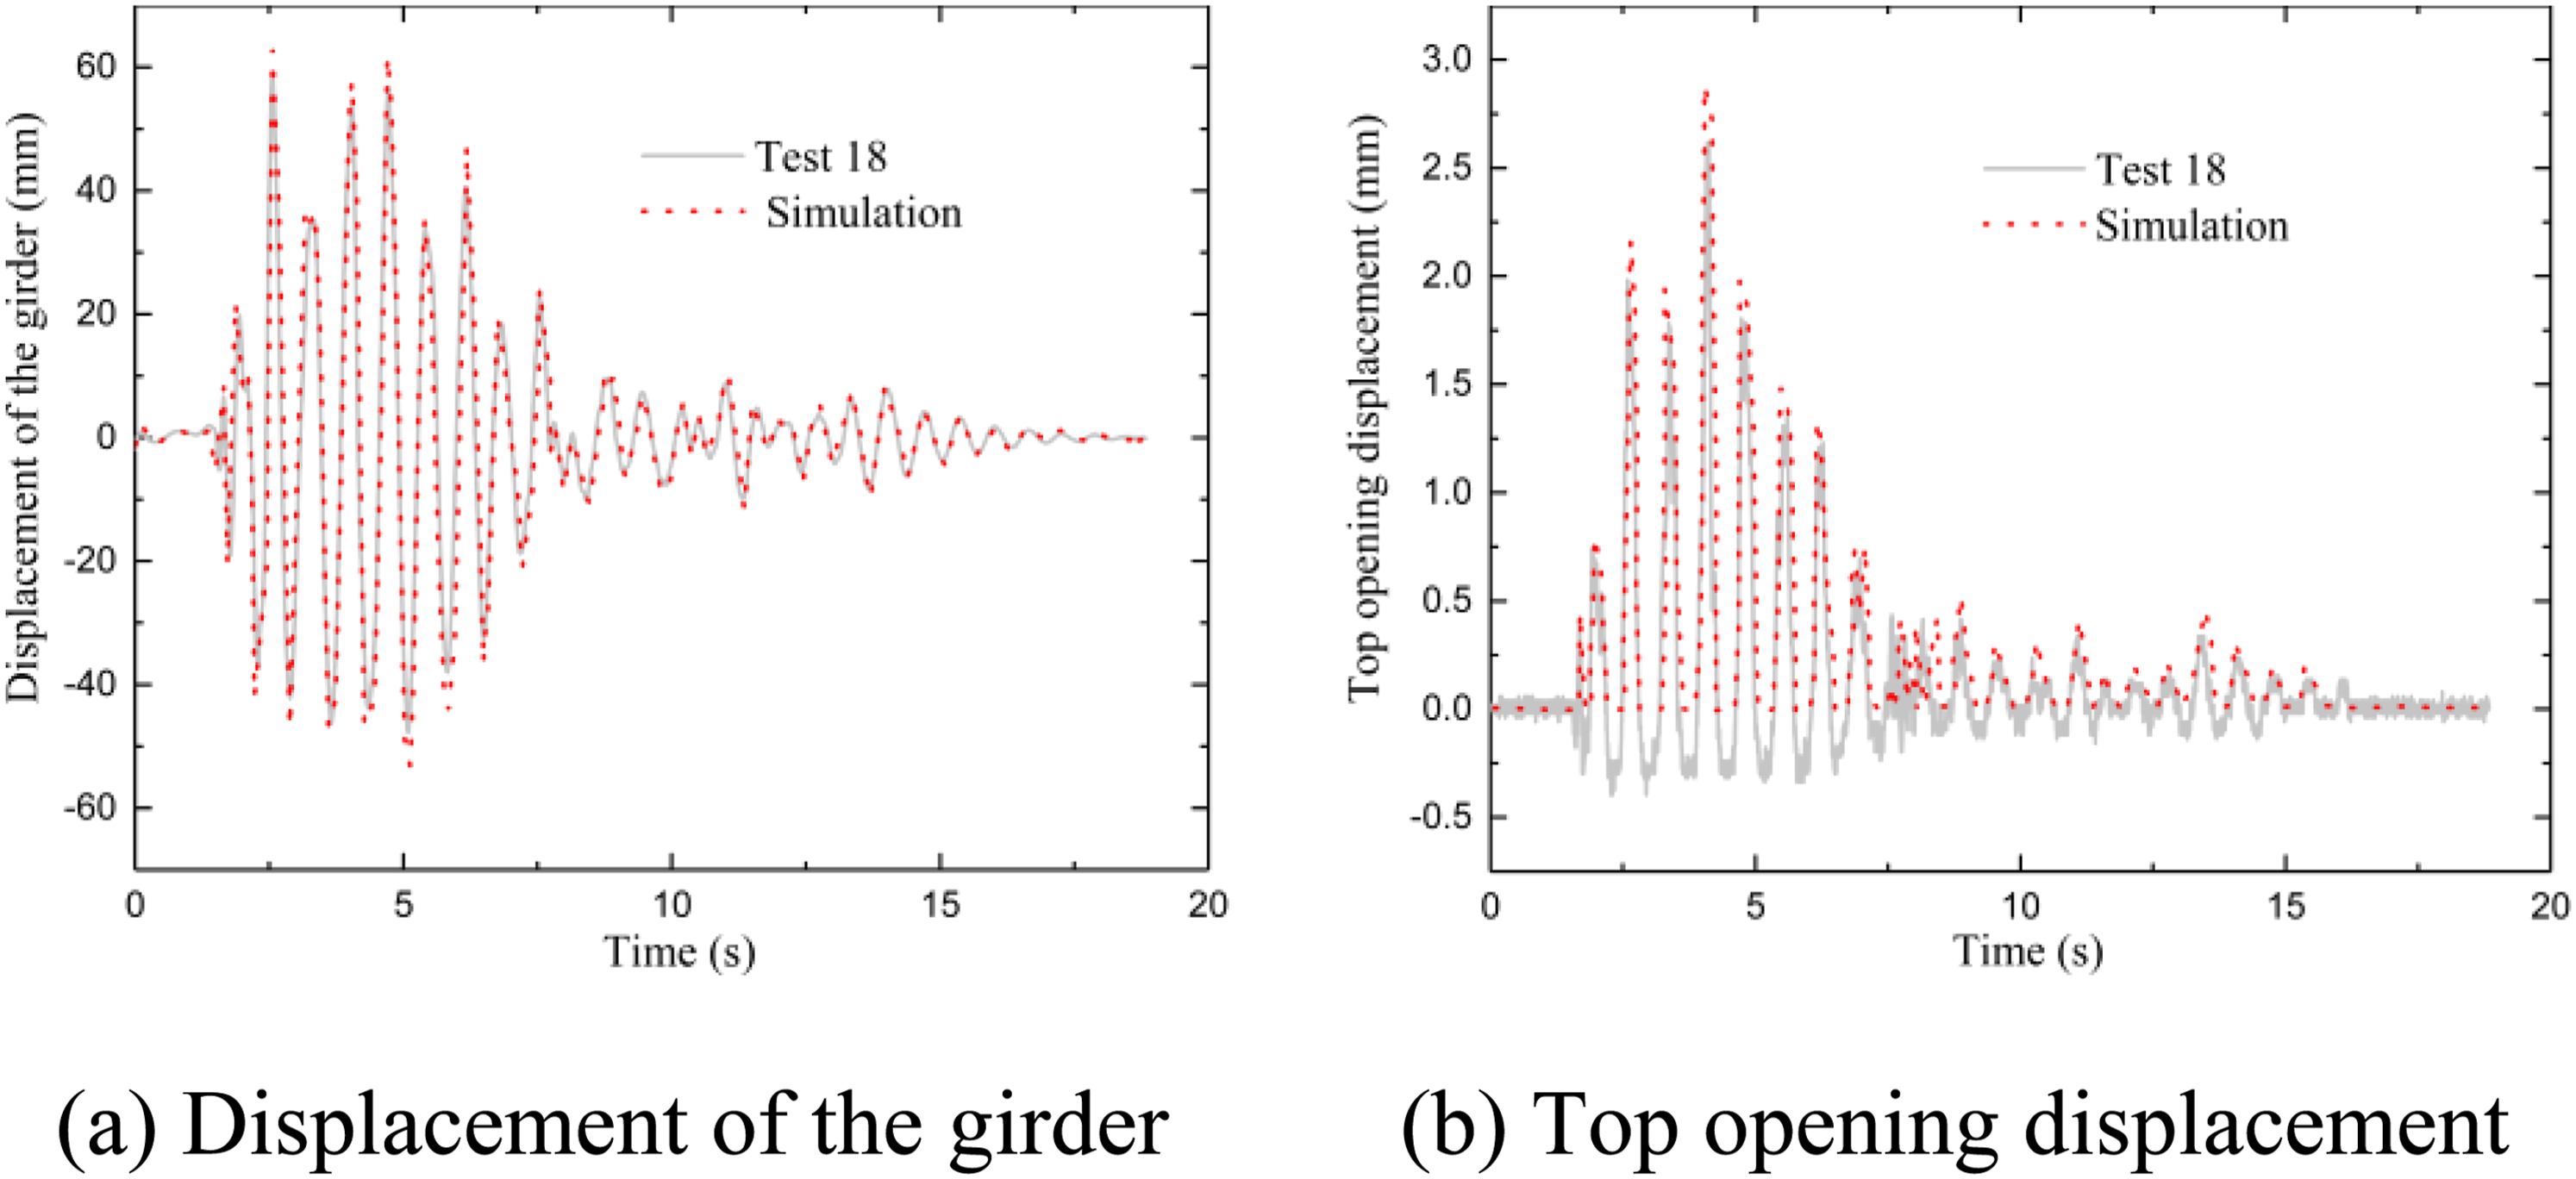
Shi et al. (2025) performed shake table tests on a 1/8-scale single-span self-centering tall-pier bridge (Figure 3). As shown in Figure 3, the girder-to-pier and pier-to-foundation connections employ PT tendons pre-embedded at both ends, with prestress of 70 kN at the bottom and 210 kN at the top. The pier measures 7550 mm in height, 440 × 625 mm in cross-section, and 75 mm in wall thickness. Its dynamic response was tested under seismic excitations of varying intensities. Figure 4 compares the girder lateral and opening displacements from test 18 with simulation results, showing good agreement and confirming the accuracy of the OpenSees model. The minor negative displacement in Figure 4(b) is attributed to experimental factors, including sensor placement, slight geometric imperfections, installation eccentricities, and possible micro-sliding or rocking of the foundation. In the numerical model, the base is perfectly fixed, and the rocking interface is symmetrical, resulting in purely positive computed responses. Shake table tests conducted by Shi et al. (2025). Comparison of simulation and test results.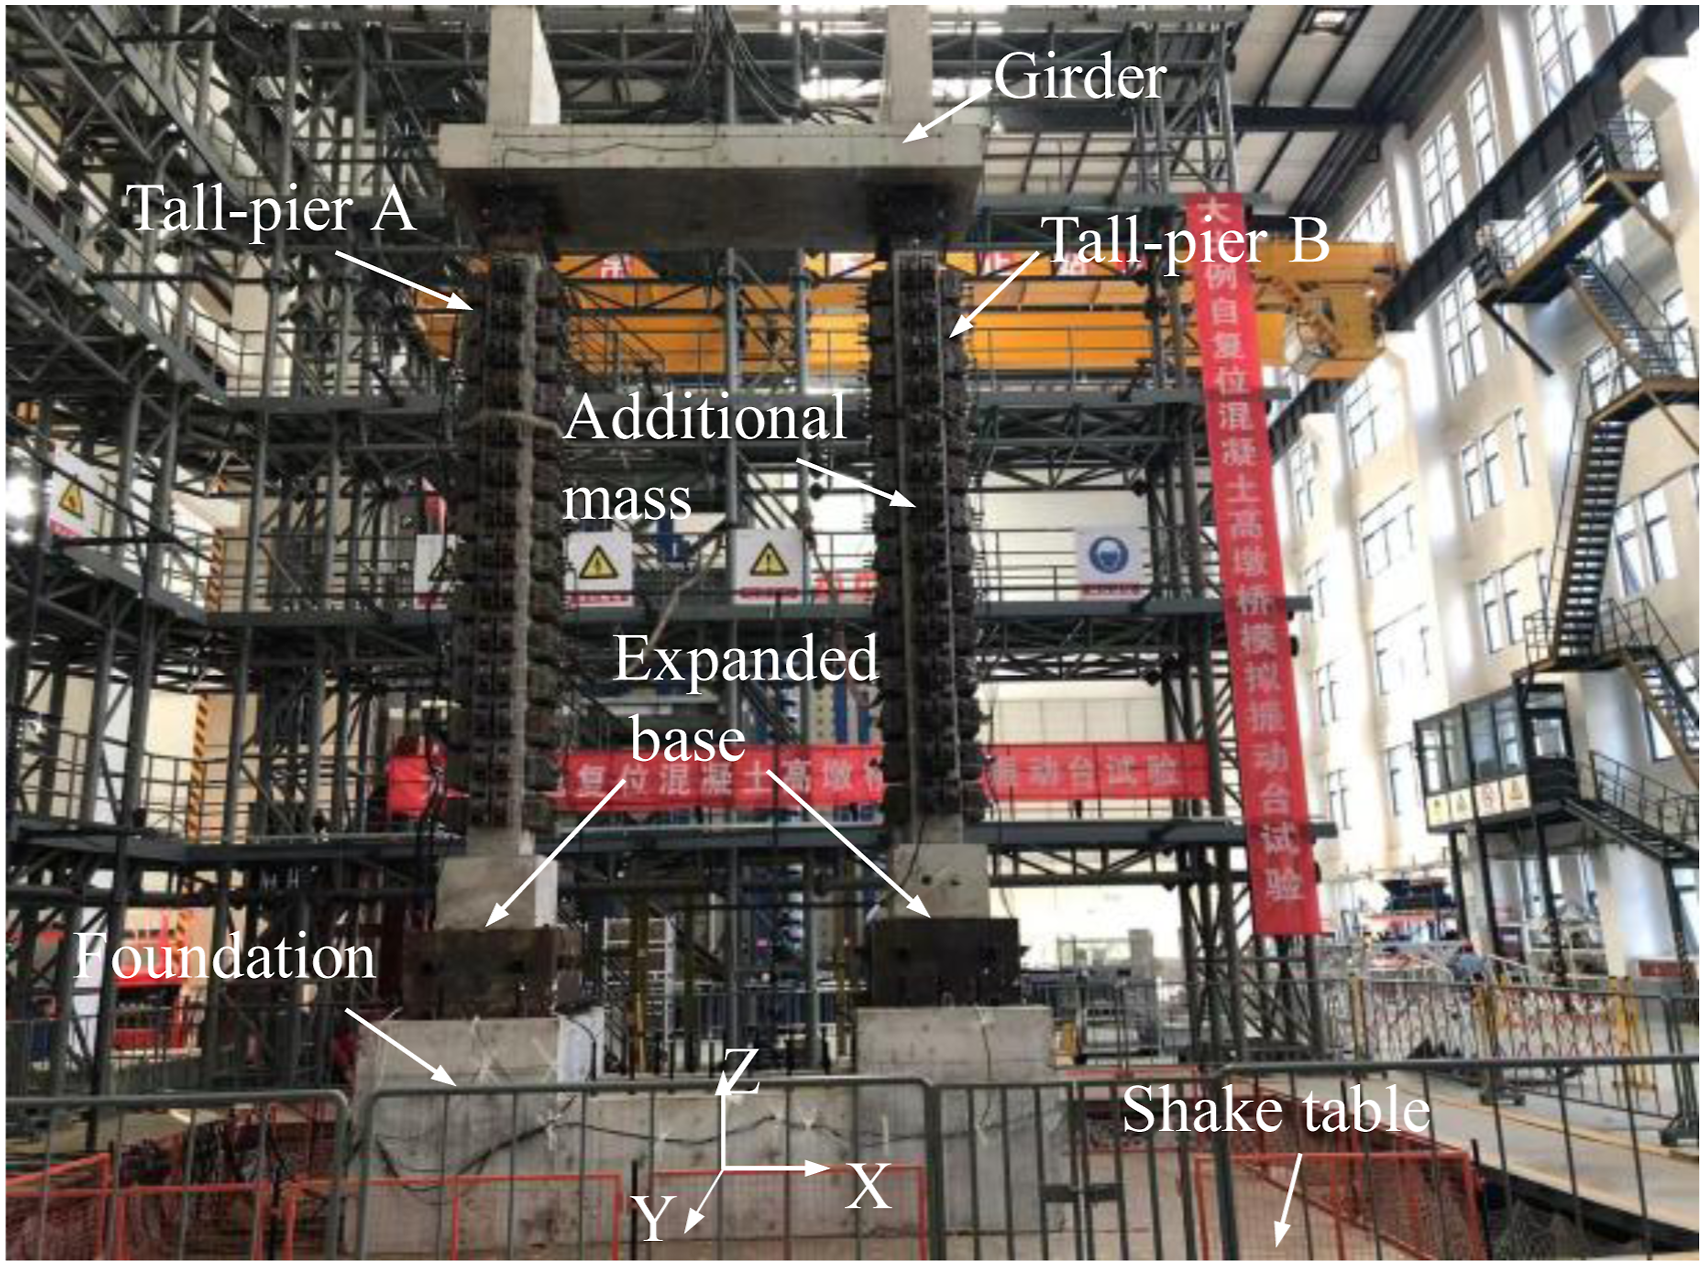
Seismic fragility analysis
First, a suite of ground motions was selected to perform nonlinear time-history analyses, and the corresponding seismic demands were recorded. Subsequently, a linear regression relationship was established between the logarithmic intensity measure and the logarithm of the seismic demand. All seismic demands were assumed to follow lognormal distributions, and the correlations among them were taken into account. On this basis, the system-level fragility was evaluated using the method proposed in (Xiang et al., 2020).
Definition of damage states and selection of ground motions
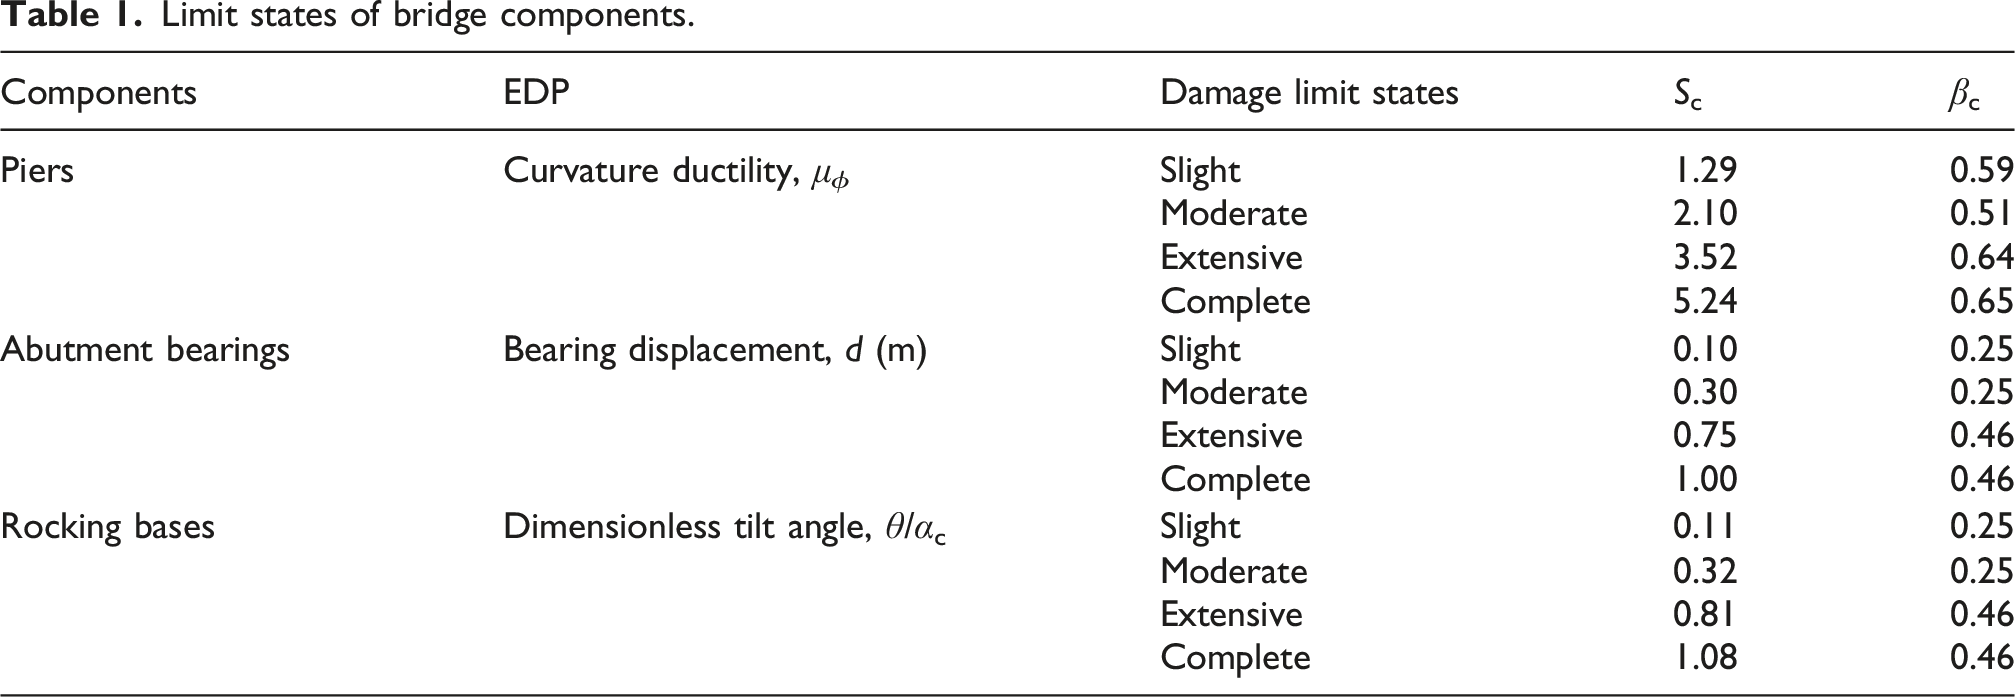
Because higher-mode effects govern tall-pier response, displacement-based indices are unsuitable for damage assessment (Chen et al., 2016; Guan et al., 2011). Thus, the maximum curvature ductility demand along the pier height, μ
ϕ
, is adopted as the pier damage index, with the median capacities (Sc) and dispersions (βc) taken from Nielson and DesRoches (2007). Abutment bearings and rocking pier bases are also considered vulnerable components because excessive bearing displacement may cause unseating and excessive rocking may lead to overturning. Four damage states are defined following HAZUS-MH-MR3 (2003). For the prototype bridge, the complete-state capacity of the bearing is set to d = 1.0 m. For the SC bridge, overturning is defined by θ/αc, as shown in Figure 5, with θ/αc = 1.08 taken as the complete-state threshold (Chen and Li, 2020b; Thiers‐Moggia and Málaga‐Chuquitaype, 2019). In this study, d and θ/αc are used as key damage indicators. Parameter d reflects the global displacement of the pier or bearing, which is directly related to serviceability and structural safety under seismic loads. Parameter θ/αc represents the ratio of pier base rotation to its overturning capacity, capturing local rocking and plastic deformation. Together, these indicators provide a combined assessment of component- and system-level damage and effectively quantify the performance of self-centering piers, including the effects of PT restoring forces and energy-dissipating devices. The capacities for the other three damage states are taken as 0.1, 0.3, and 0.75 of the complete-state value, respectively (Chang et al., 2000). The corresponding Sc and βc values are summarized in Table 1, and the βc values for d and θ/αc are adopted from Muntasir Billah and Alam (2015). Schematic illustration of rocking behavior in the SC tall pier. Limit states of bridge components.
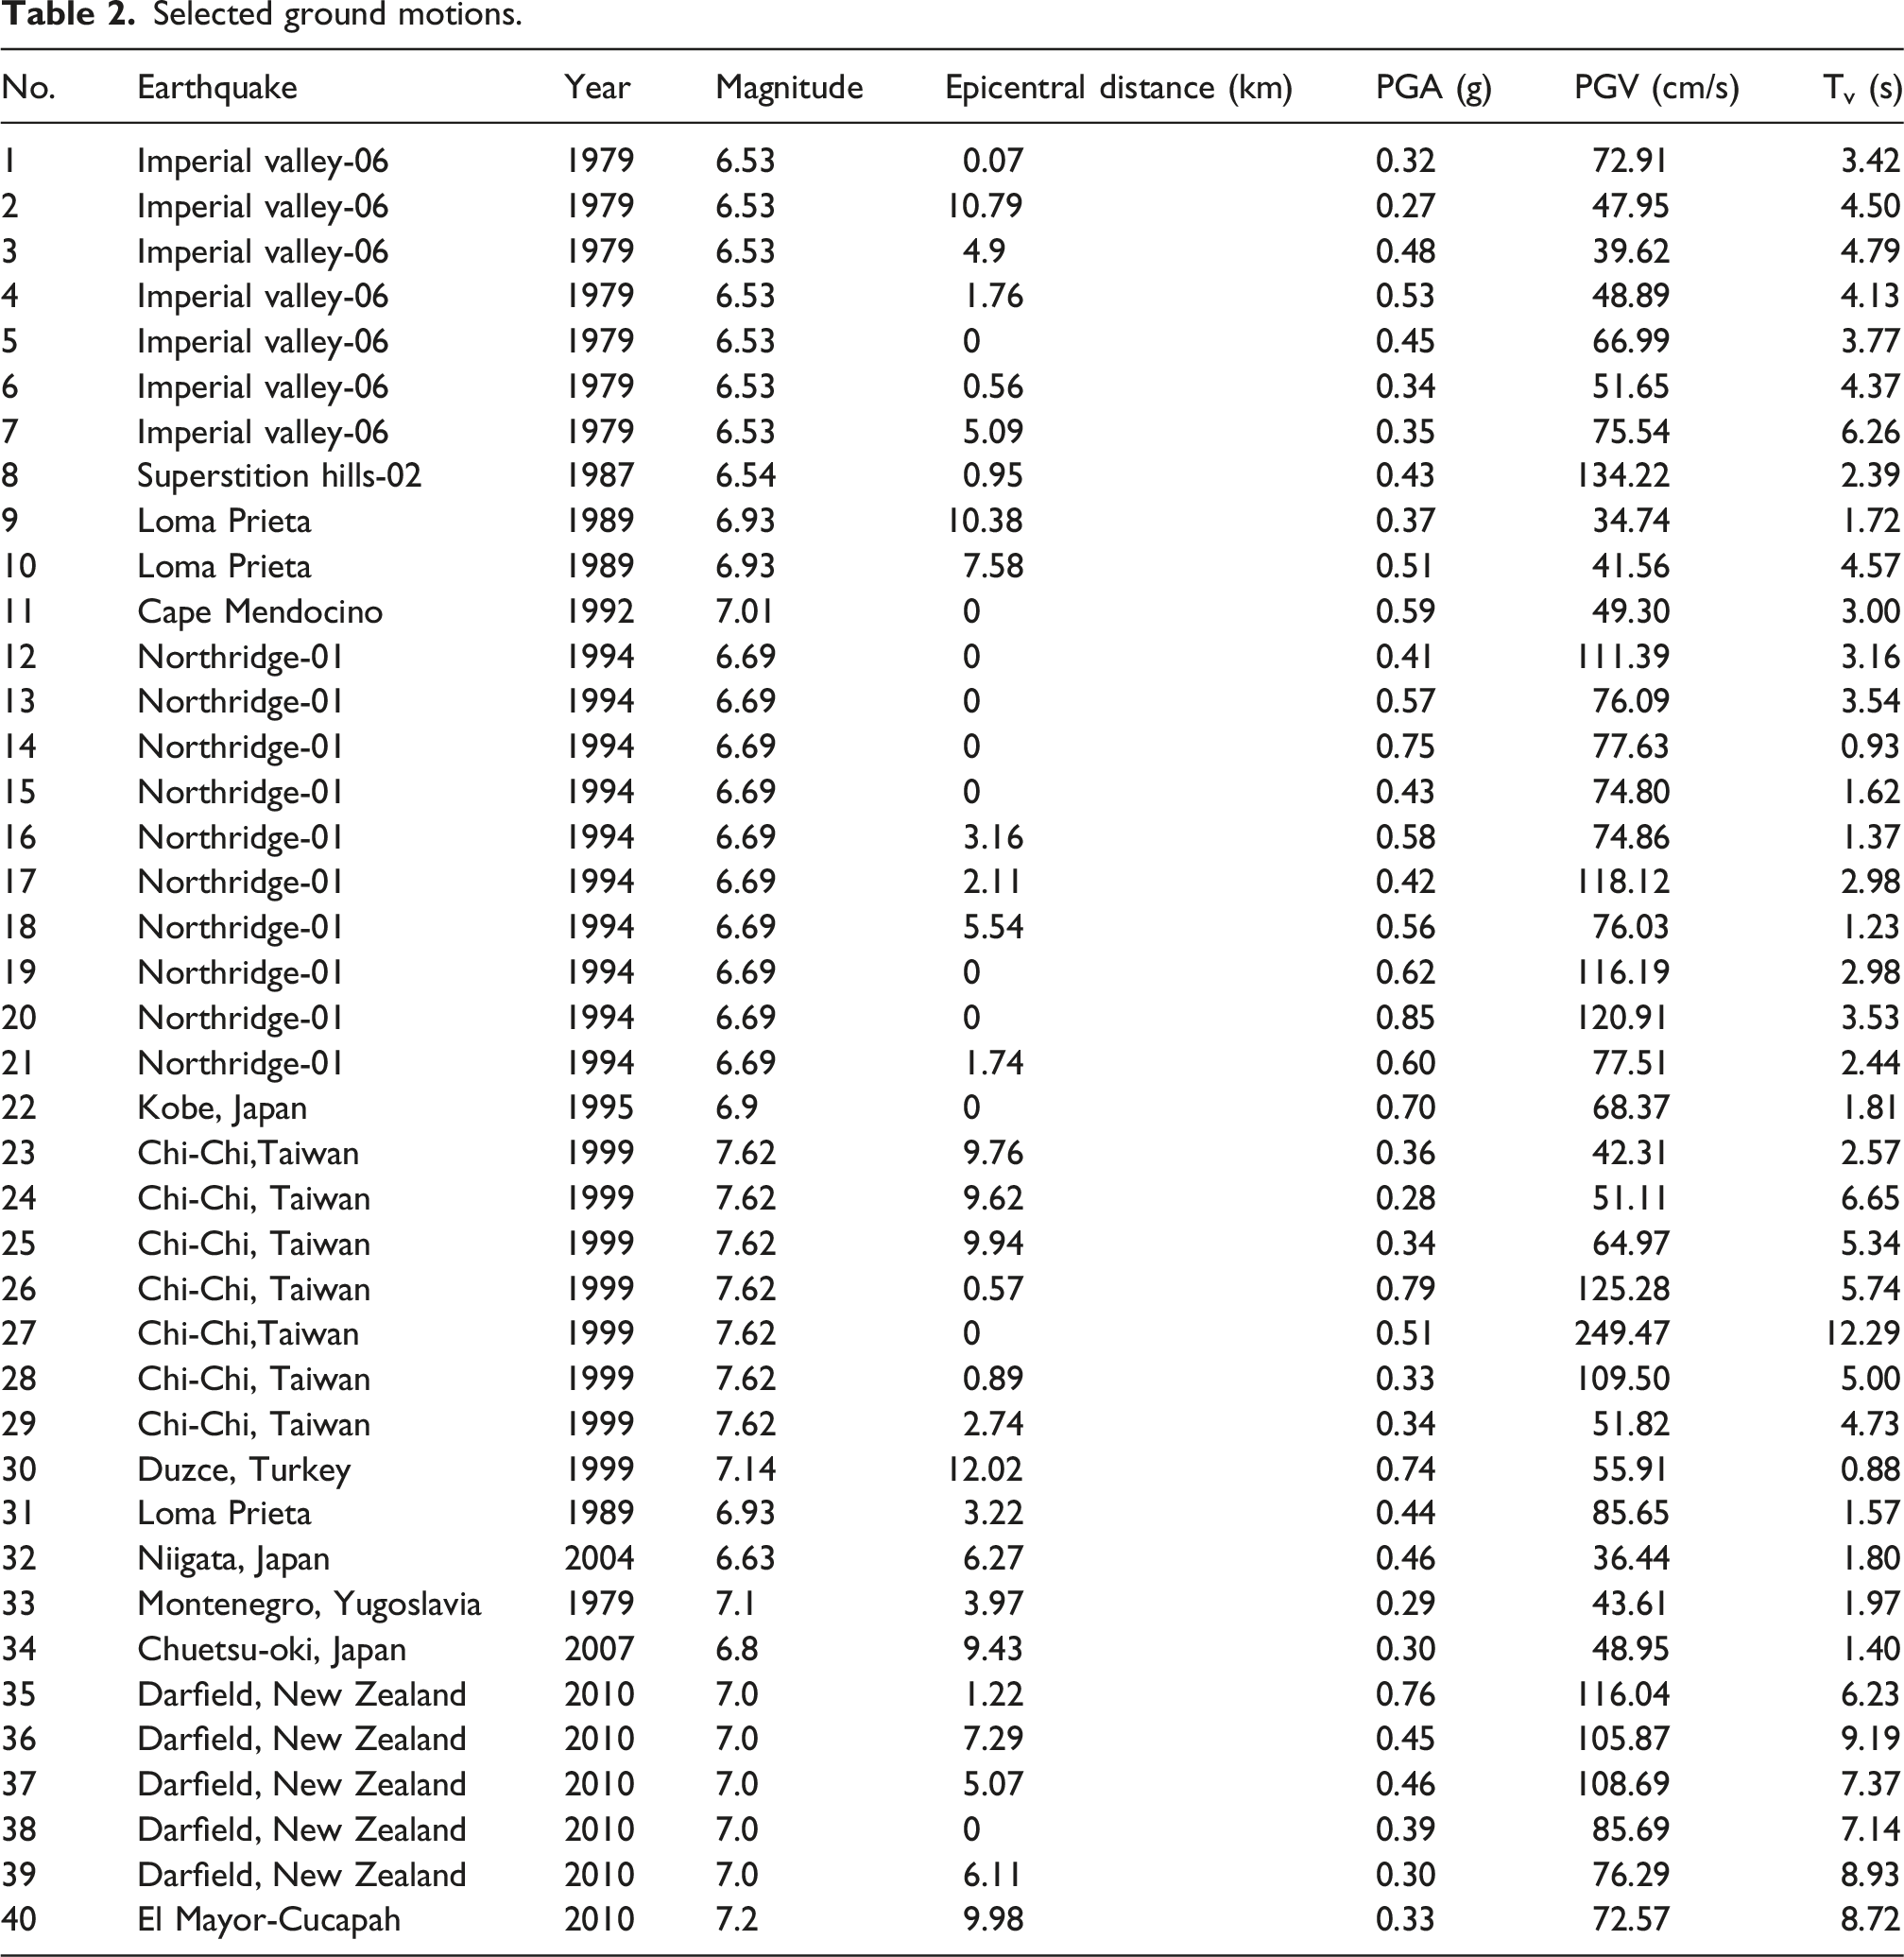
Selected ground motions.
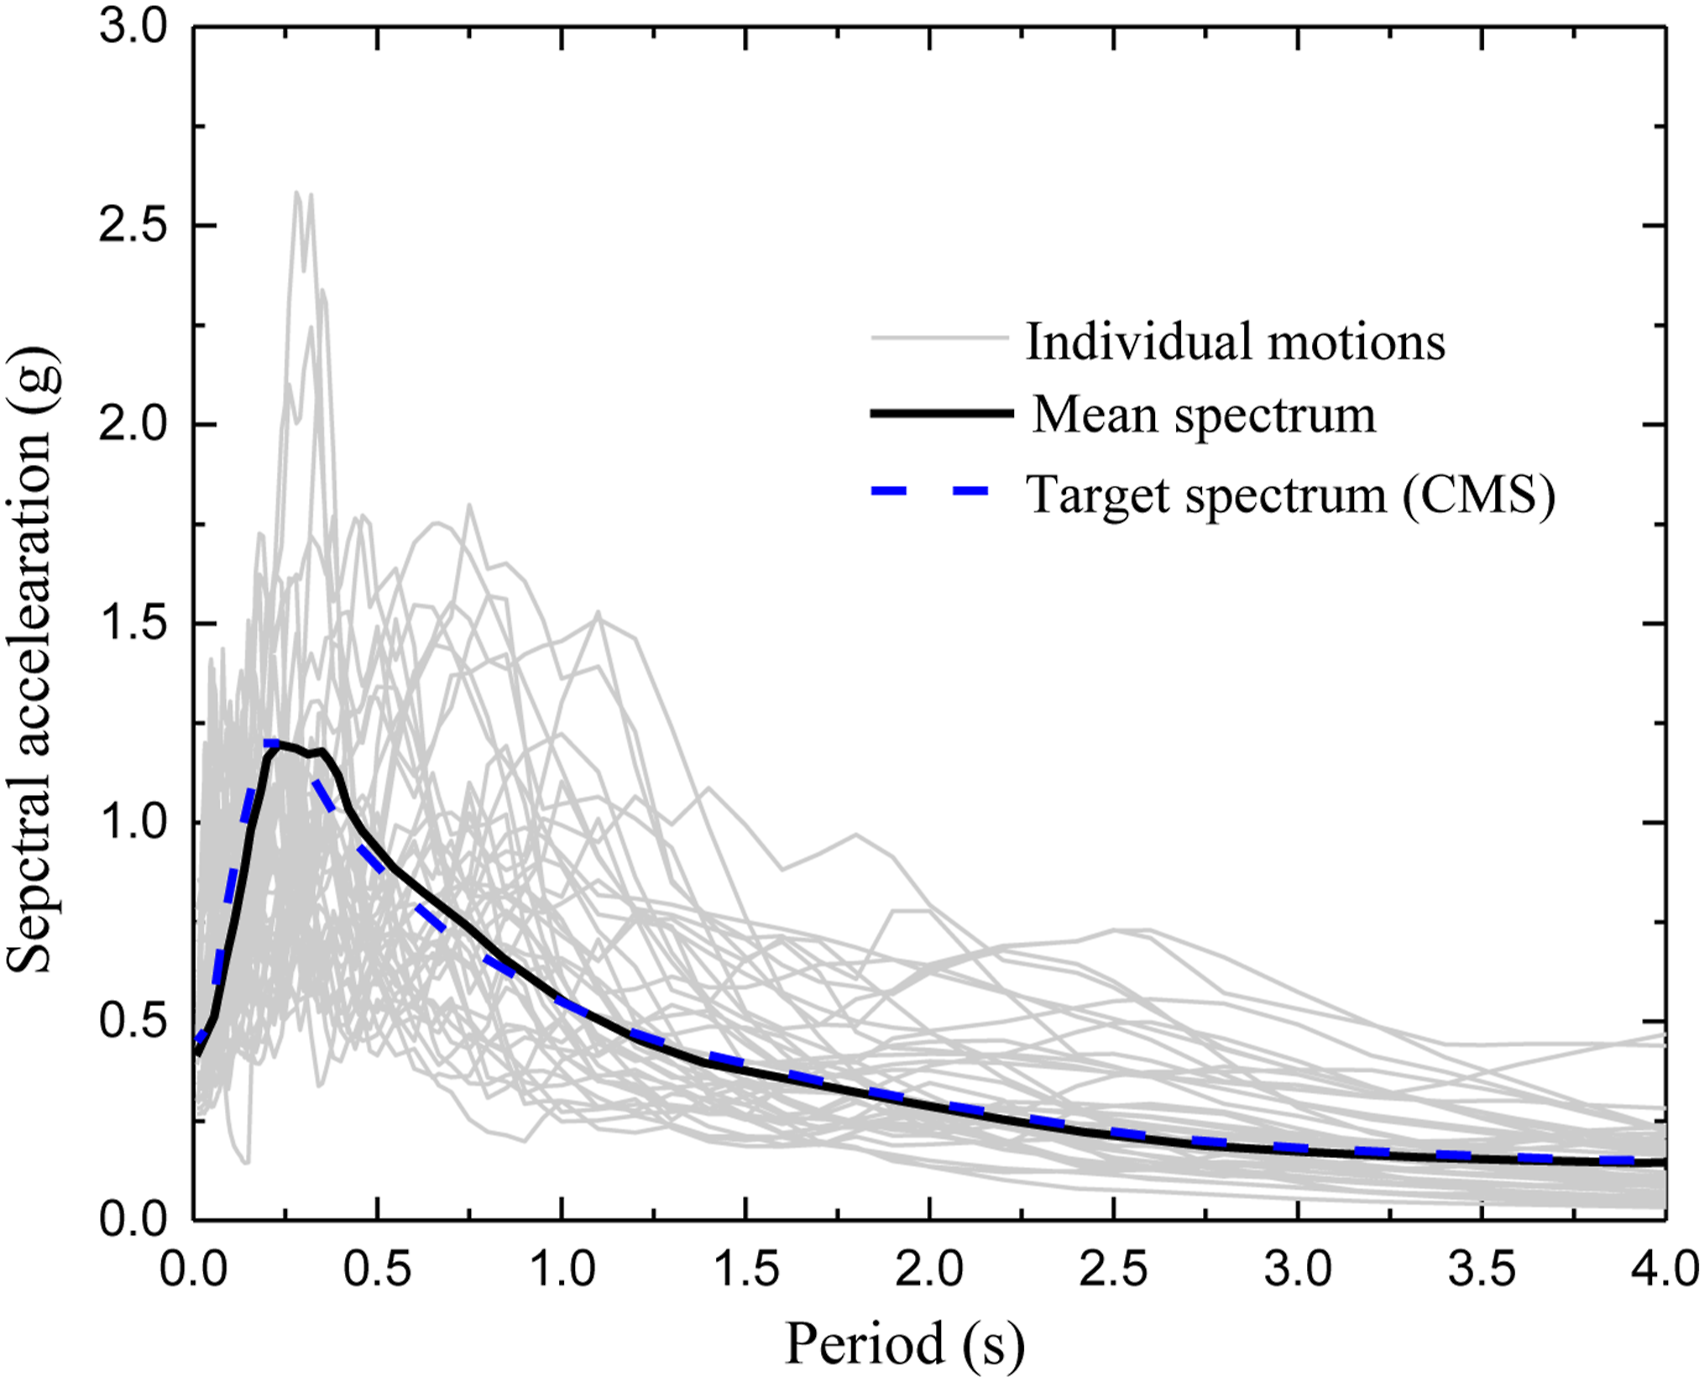
Acceleration spectra of selected motions.
Probabilistic seismic demand models
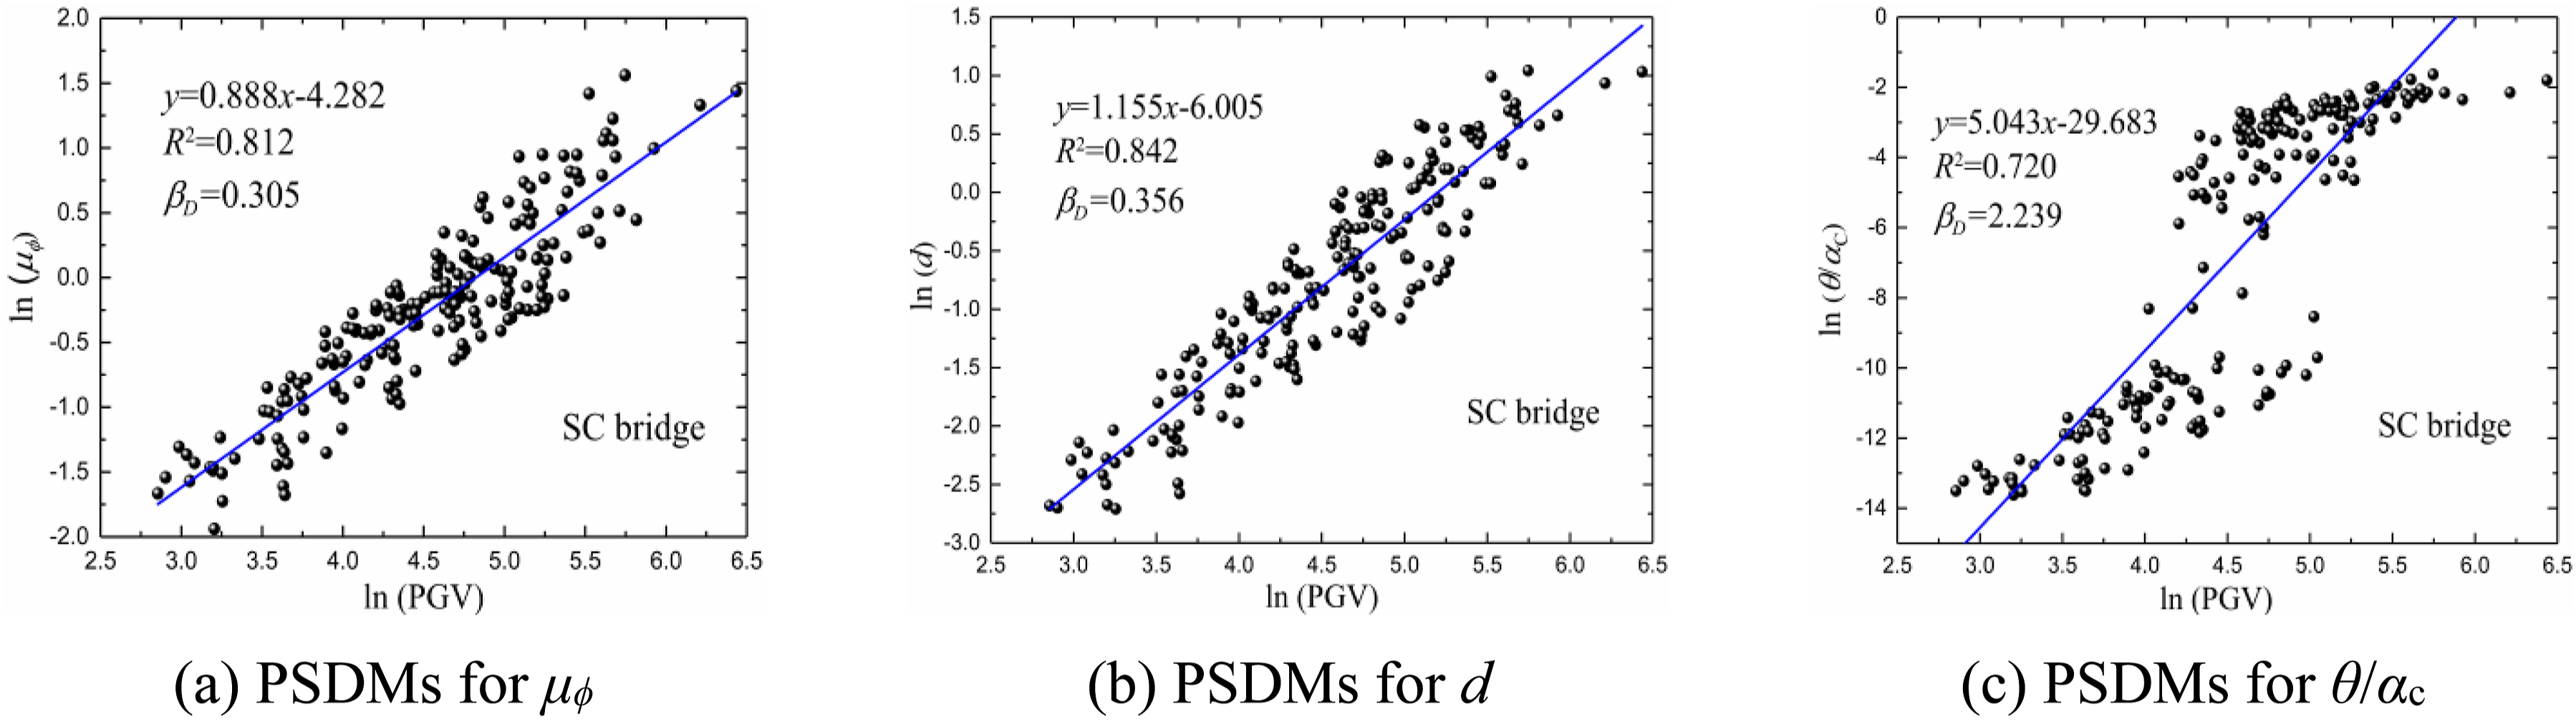
To ensure a sufficiently large dataset for developing robust PSDMs, the 40 selected near-fault ground-motion records were amplitude-scaled using five intensity factors (0.5, 1.0, 1.5, 2.0, and 2.5). Nonlinear time-history analyses were then conducted, from which the PSDMs for different components of the two bridge systems were derived, as shown in Figures 7 and 8. Overall, all EDPs exhibit a clear monotonic increasing trend with increasing PGV. The goodness of fit (R2) for all EDPs exceeds 0.7, indicating a stable log-linear relationship between EDPs and the IM in the logarithmic domain and confirming that PGV can effectively characterize the growth of structural demands. PSDMs for RC bridge. PSDMs for SC bridge.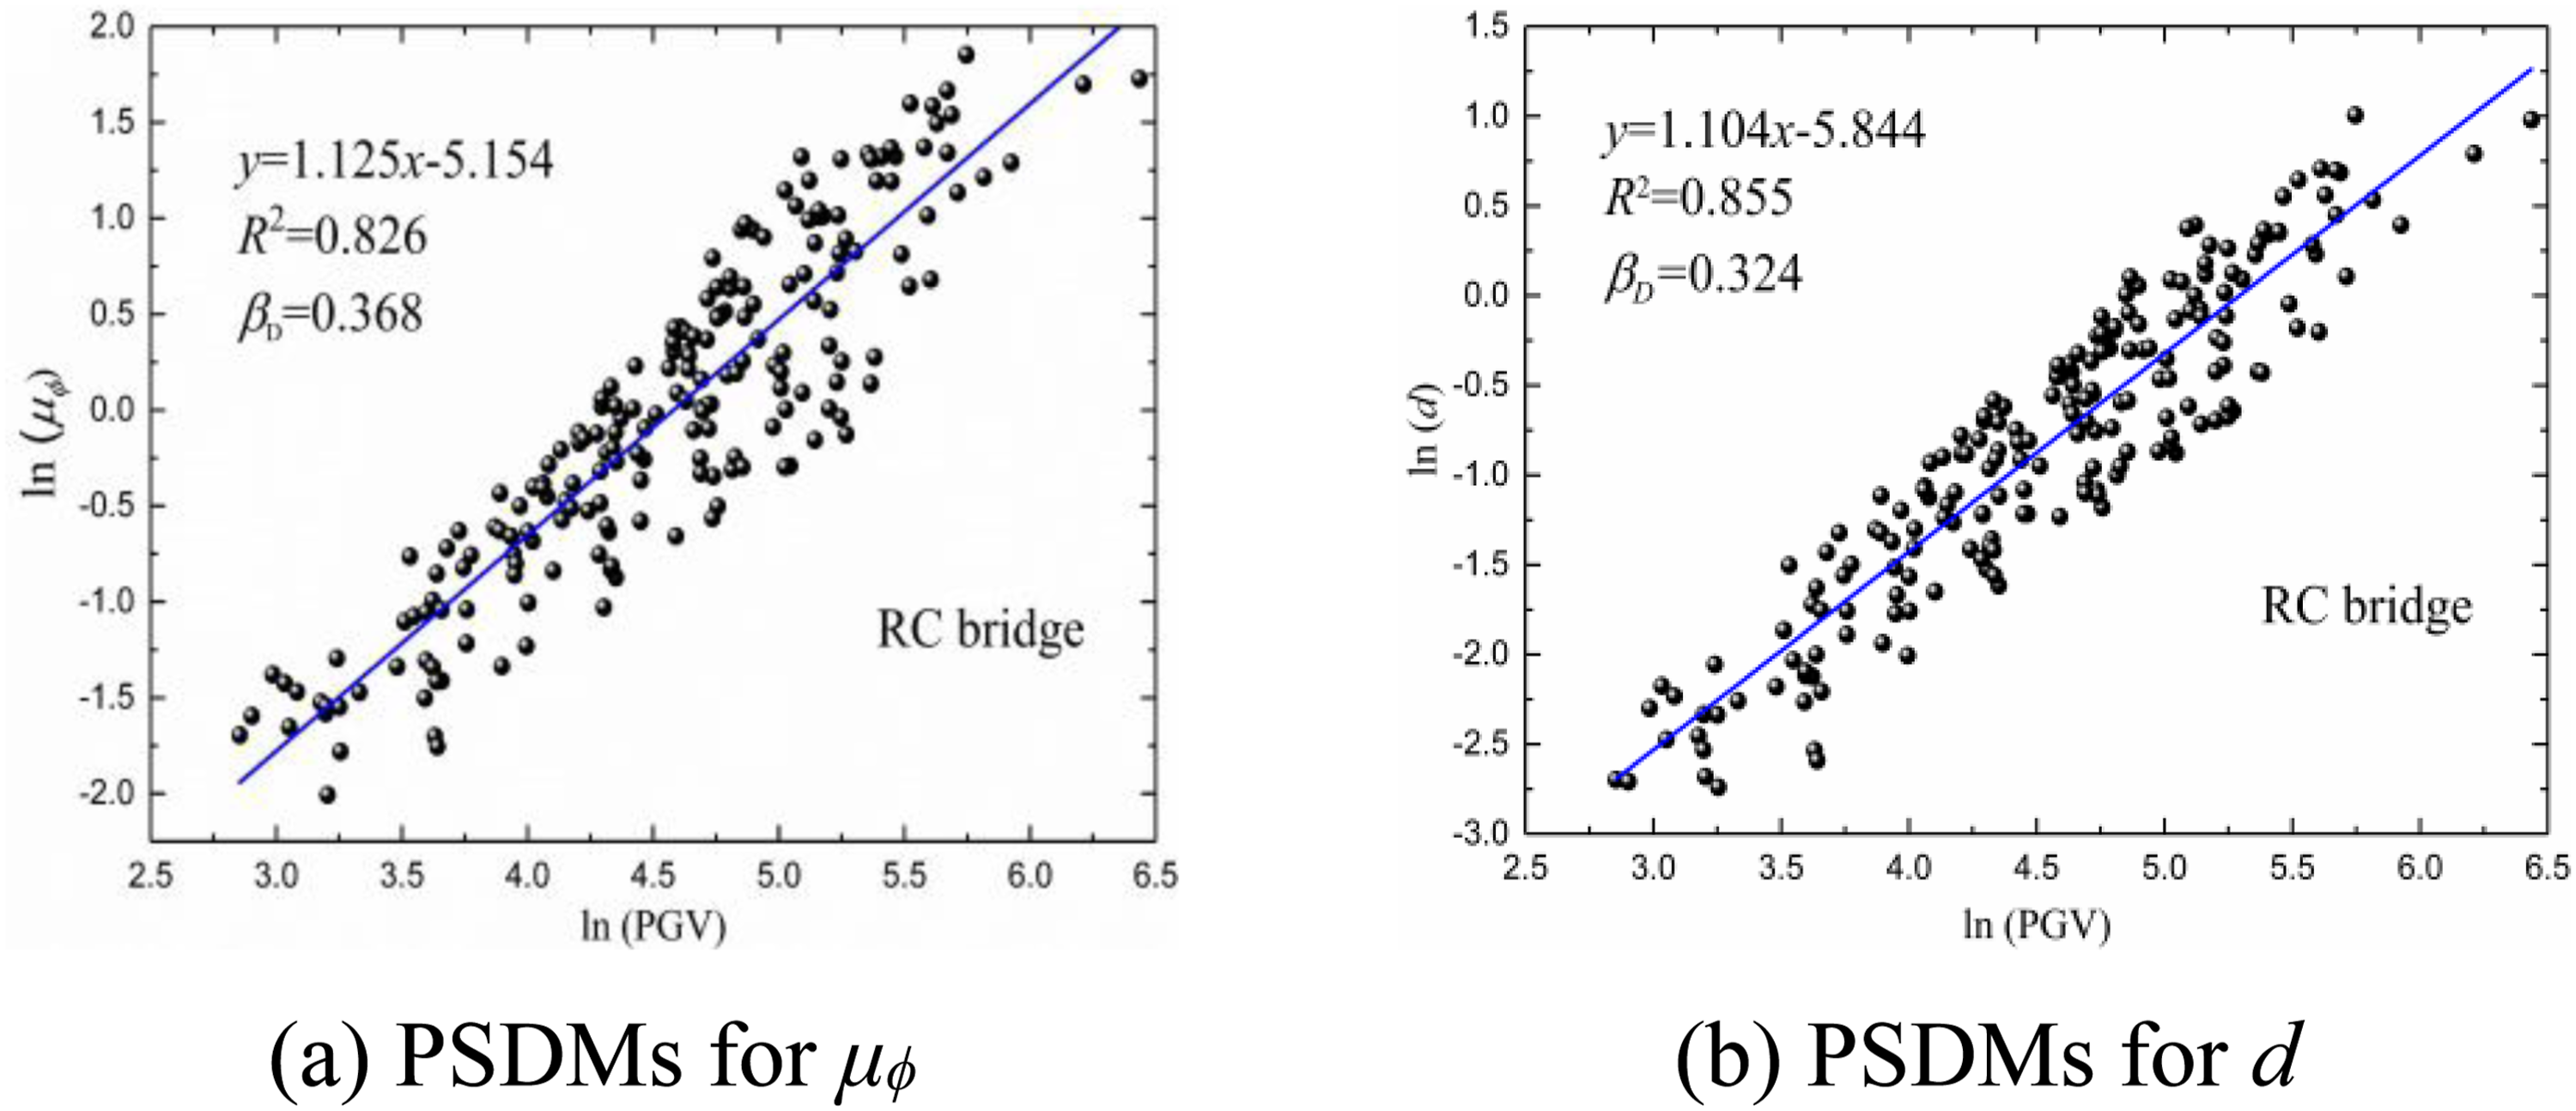
Nonlinear time-history analysis results
Inertial force response
Figure 9 compares the peak inertial-force responses of the RC and SC tall-pier bridges under different seismic scenarios. 0.21 g and 0.72 g corresponding to the E1 and E2 design hazard levels for southwestern China, respectively. Overall, the SC bridge reduces inertial-force demand, with the reduction depending on component location and earthquake intensity. At a low PGA of 0.21 g (Figure 9(a) and (b)), forces remain low, and differences are minimal. At the girder, mean peak forces are 4.11 × 10³ kN (RC) and 4.23 × 10³ kN (SC), while at the pier, the SC bridge shows a slightly lower force (2.41 × 10³ kN vs 2.52 × 10³ kN), indicating limited initial seismic mitigation from PT restoring action and minor rocking. At a higher PGA of 0.72 g (Figure 9(b) and (c)), reductions become pronounced. At the girder, mean peak forces decrease from 13.19 × 10³ kN (RC) to 8.95 × 10³ kN (SC), a 32% reduction, primarily due to full activation of the rocking-recentring mechanism, which lowers effective stiffness and slightly increases the fundamental period (1.51 s to 1.55 s), reducing spectral acceleration. PT tendon restoring forces and hysteretic energy dissipation from EDs further suppress the response. At the pier, forces drop from 8.34 × 10³ kN (RC) to 6.10 × 10³ kN (SC), a 27% reduction, as the stiffness degradation-recovery cycle at the base dissipates seismic energy, lowering pier inertial and bending demands. In both cases, pier inertial forces exceed 60% of girder forces, emphasizing the critical role of pier dynamics in overall seismic response. Peak inertial force response.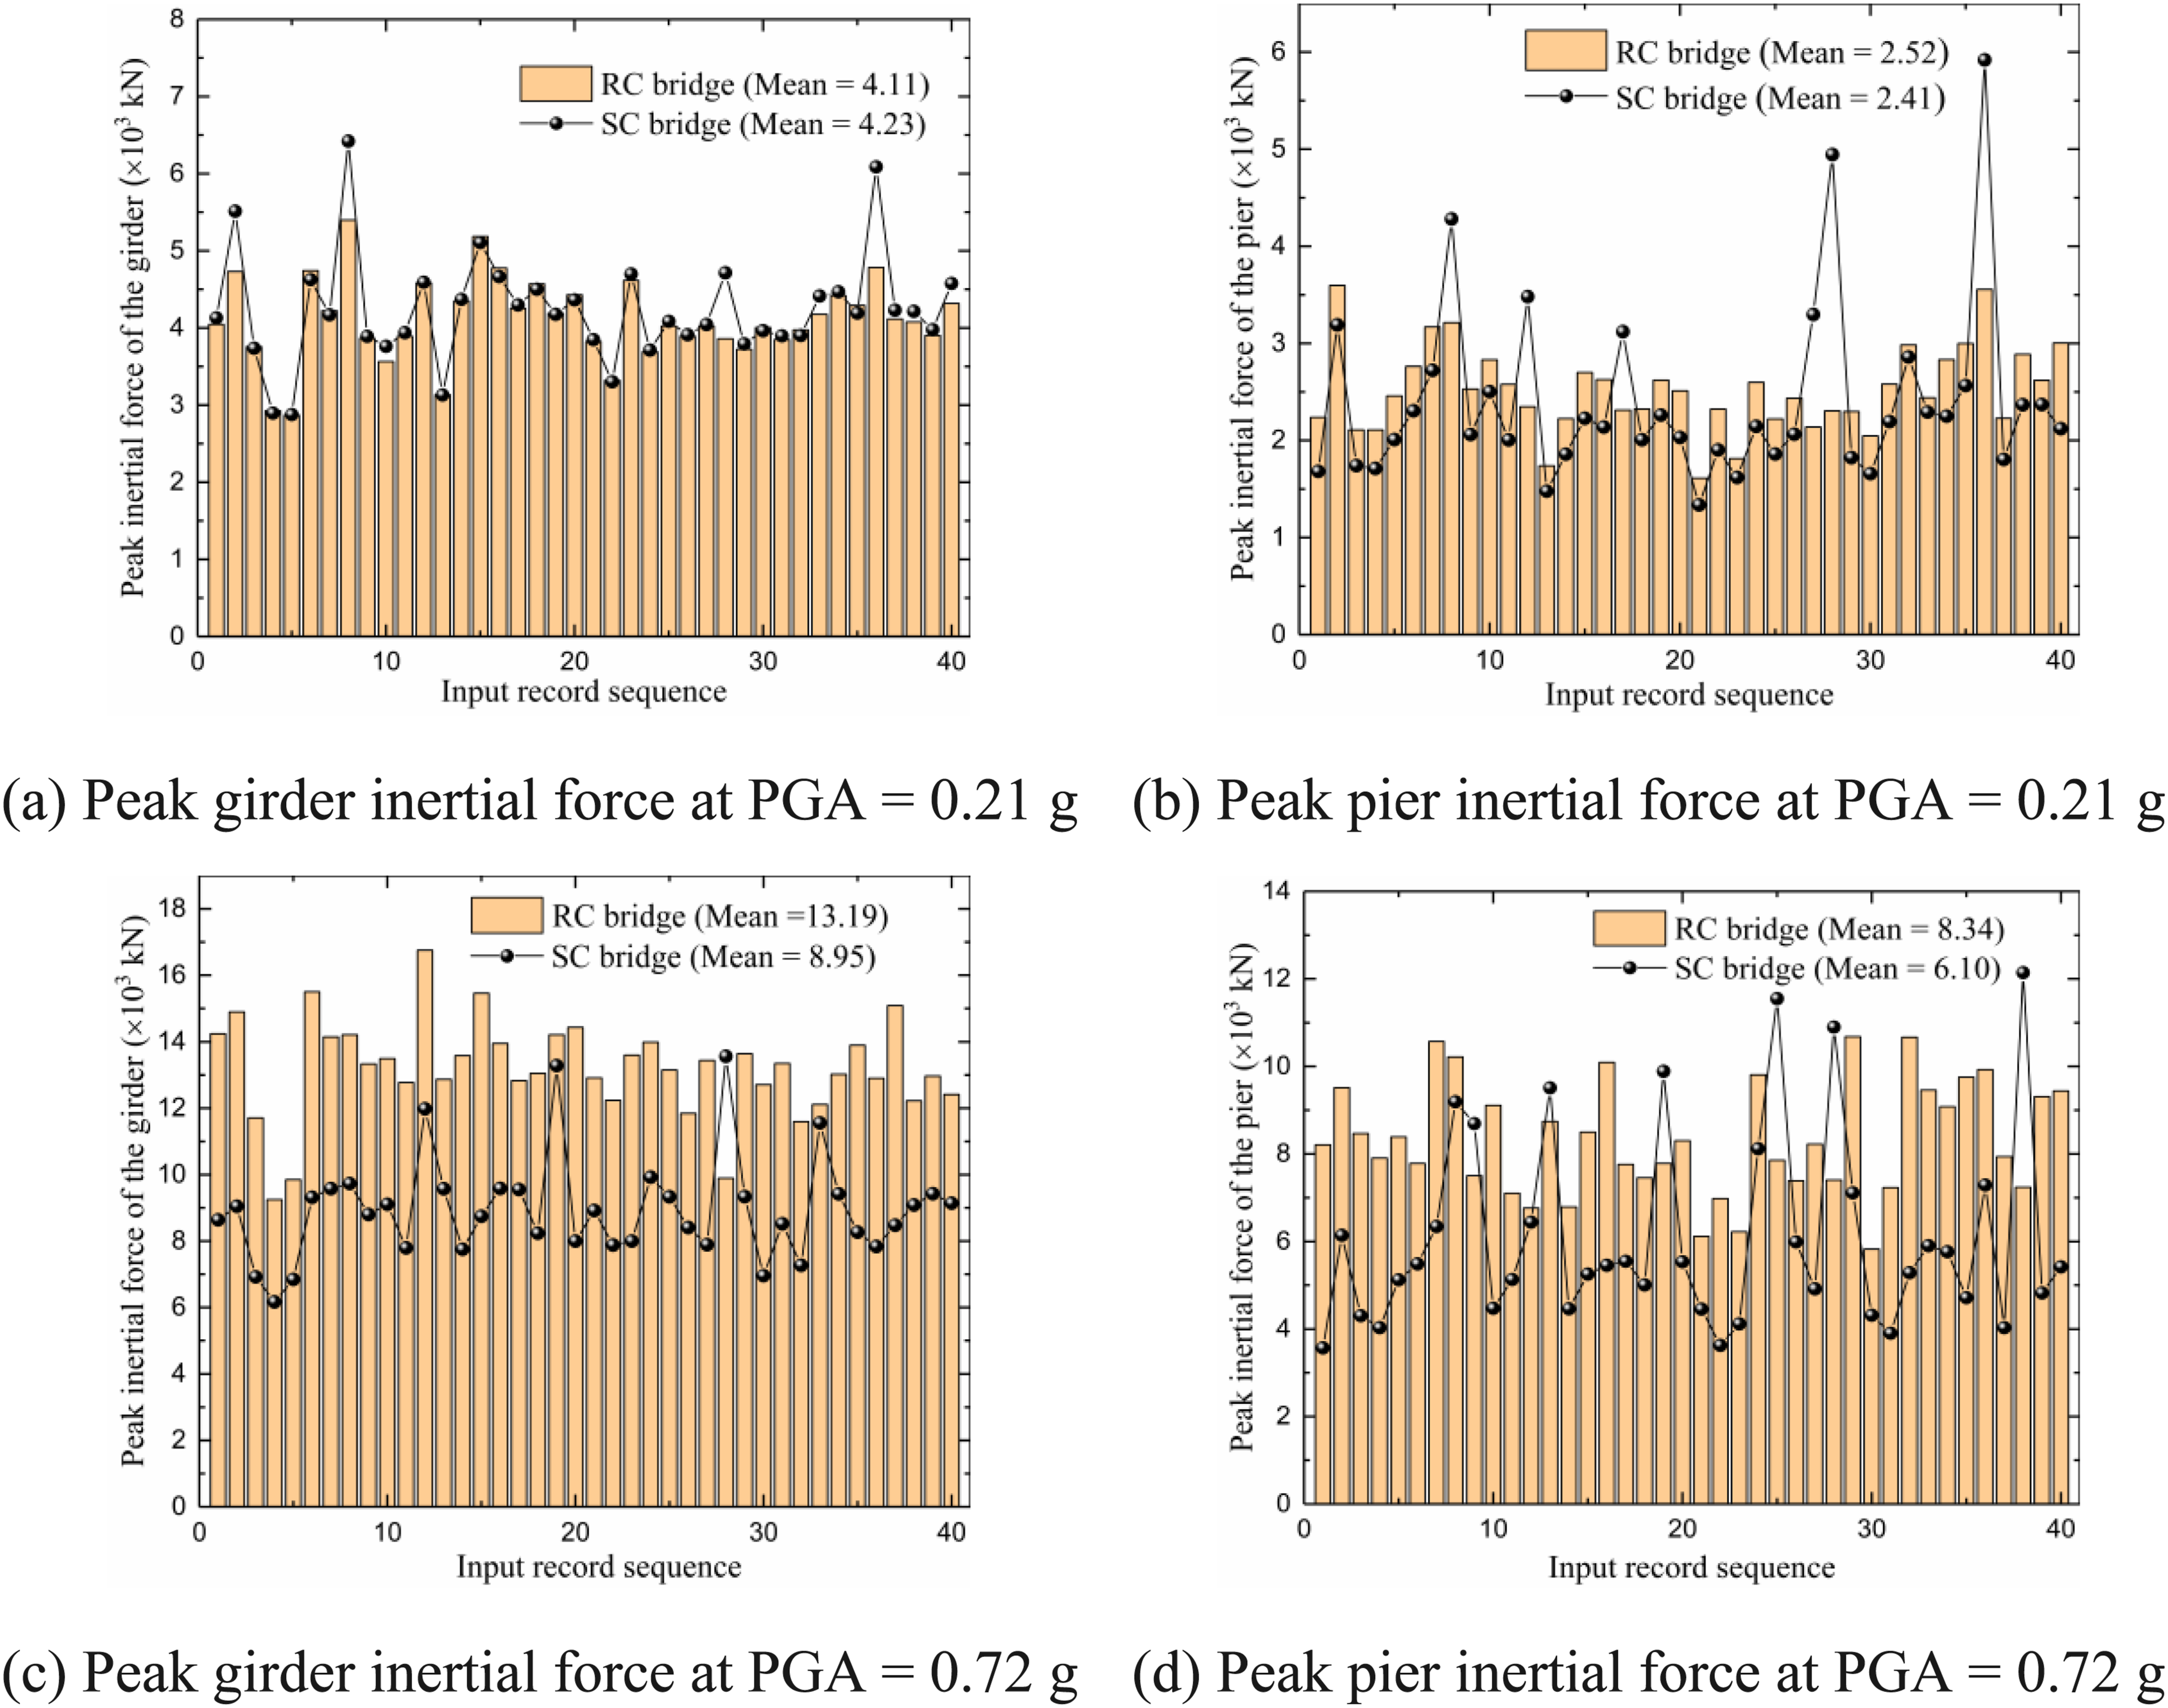
Curvature demand
Figure 10 compares the maximum section curvature ductility (μ
ϕ
) of the RC and SC tall piers under different ground motion cases, with the critical damage-state thresholds indicated for reference. As shown in Figure 10(a), under the low-intensity excitation of PGA = 0.21 g, the curvature-ductility demands for both piers remain small, with mean values of 0.42 for the RC pier and 0.39 for the SC pier. In all cases, the demands are below the slight-damage threshold (1.29), indicating that both piers remain elastic or nearly elastic. When the PGA increases to 0.72 g, the difference between the two systems becomes pronounced (Figure 10(b)). The mean μ
ϕ
value of the RC pier rises to 2.34, exceeding the moderate-damage threshold (2.10), suggesting that the pier enters a markedly nonlinear response regime in most cases. Based on the damage-state statistics, the proportions of cases reaching slight, moderate, and extensive damage are 25% (10/40), 27.5% (11/40), and 12.5% (5/40), respectively. Moreover, for several records (e.g., E17, E27, and E28), the response reaches the complete-damage state, indicating that the RC pier is prone to developing severe nonlinear behavior under strong shaking and exhibits a relatively high likelihood of serious damage or even collapse. In contrast, the SC pier shows substantially lower curvature-ductility demand, with the mean μ
ϕ
value of only 0.73, still below the slight-damage threshold (1.29). Among the 40 records, only 6 cases reach the slight-damage state, and only 1 record reaches the moderate-damage state, whereas the remaining 33 cases remain undamaged. Overall, these results demonstrate that the SC system can effectively suppress plastic-hinge development under strong earthquakes, significantly reducing the damage probability of tall piers and thereby offering superior post-earthquake recoverability and seismic reliability. Maximum section curvature ductility of the tall pier.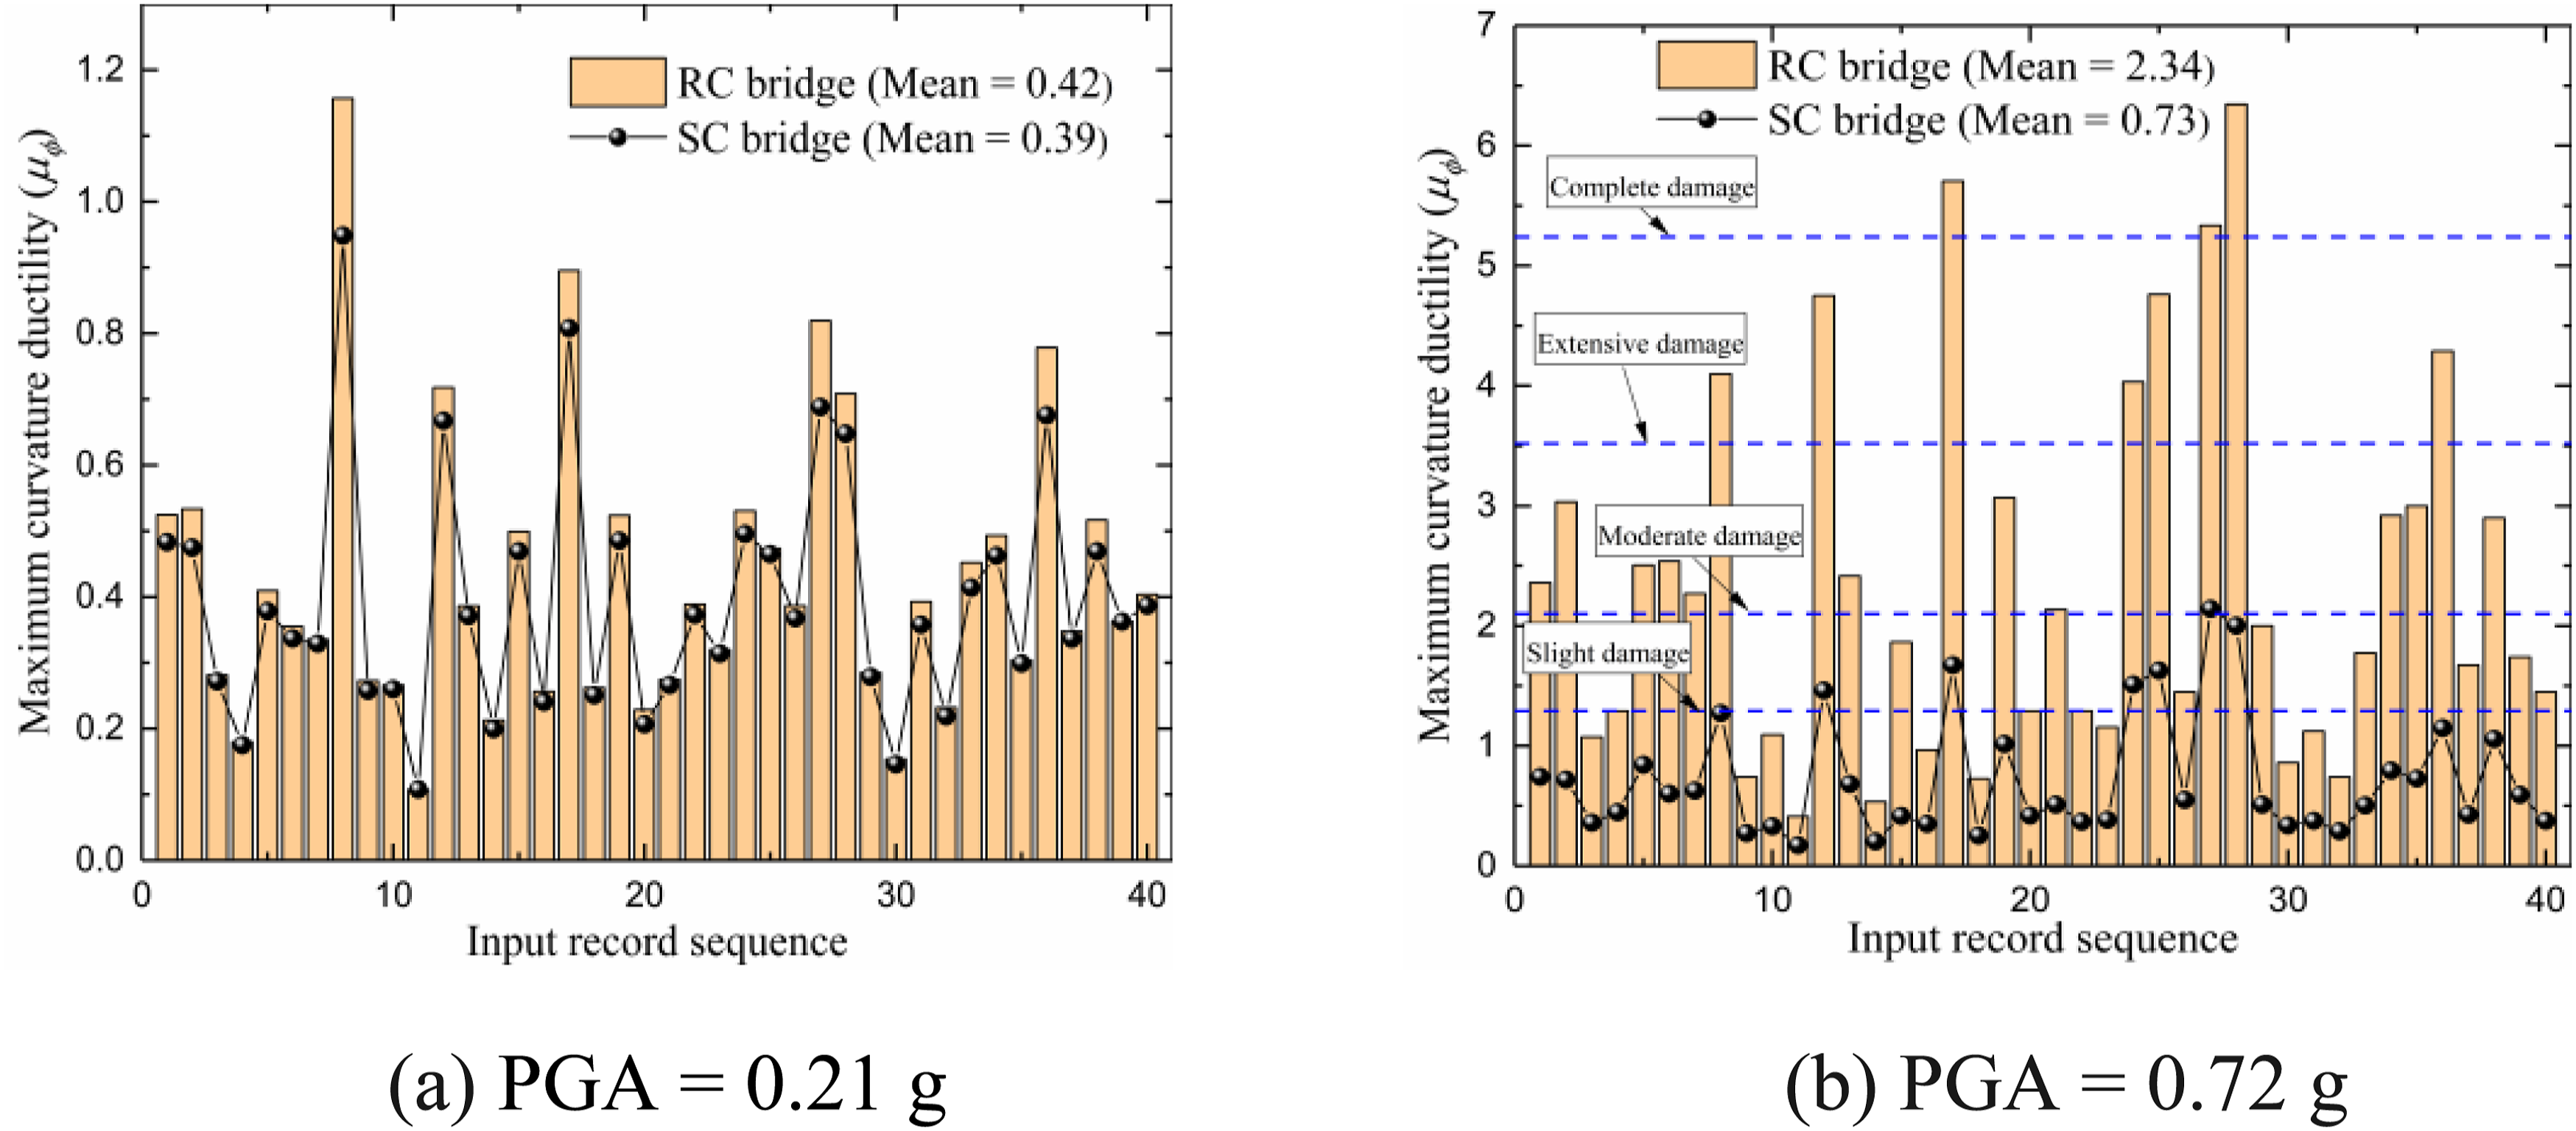
Residual drift ratio
Figure 11 presents the distribution of the residual pier-top drift ratio of the conventional RC bridge and the SC bridge under the strong-earthquake level of PGA = 0.72 g. This metric directly reflects the extent of post-earthquake nonlinearity and damage accumulation, and is therefore an important indicator for assessing post-event recoverability and functional retention. The results reveal a pronounced difference between the two systems in controlling residual deformation. Residual drift ratio at the pier top.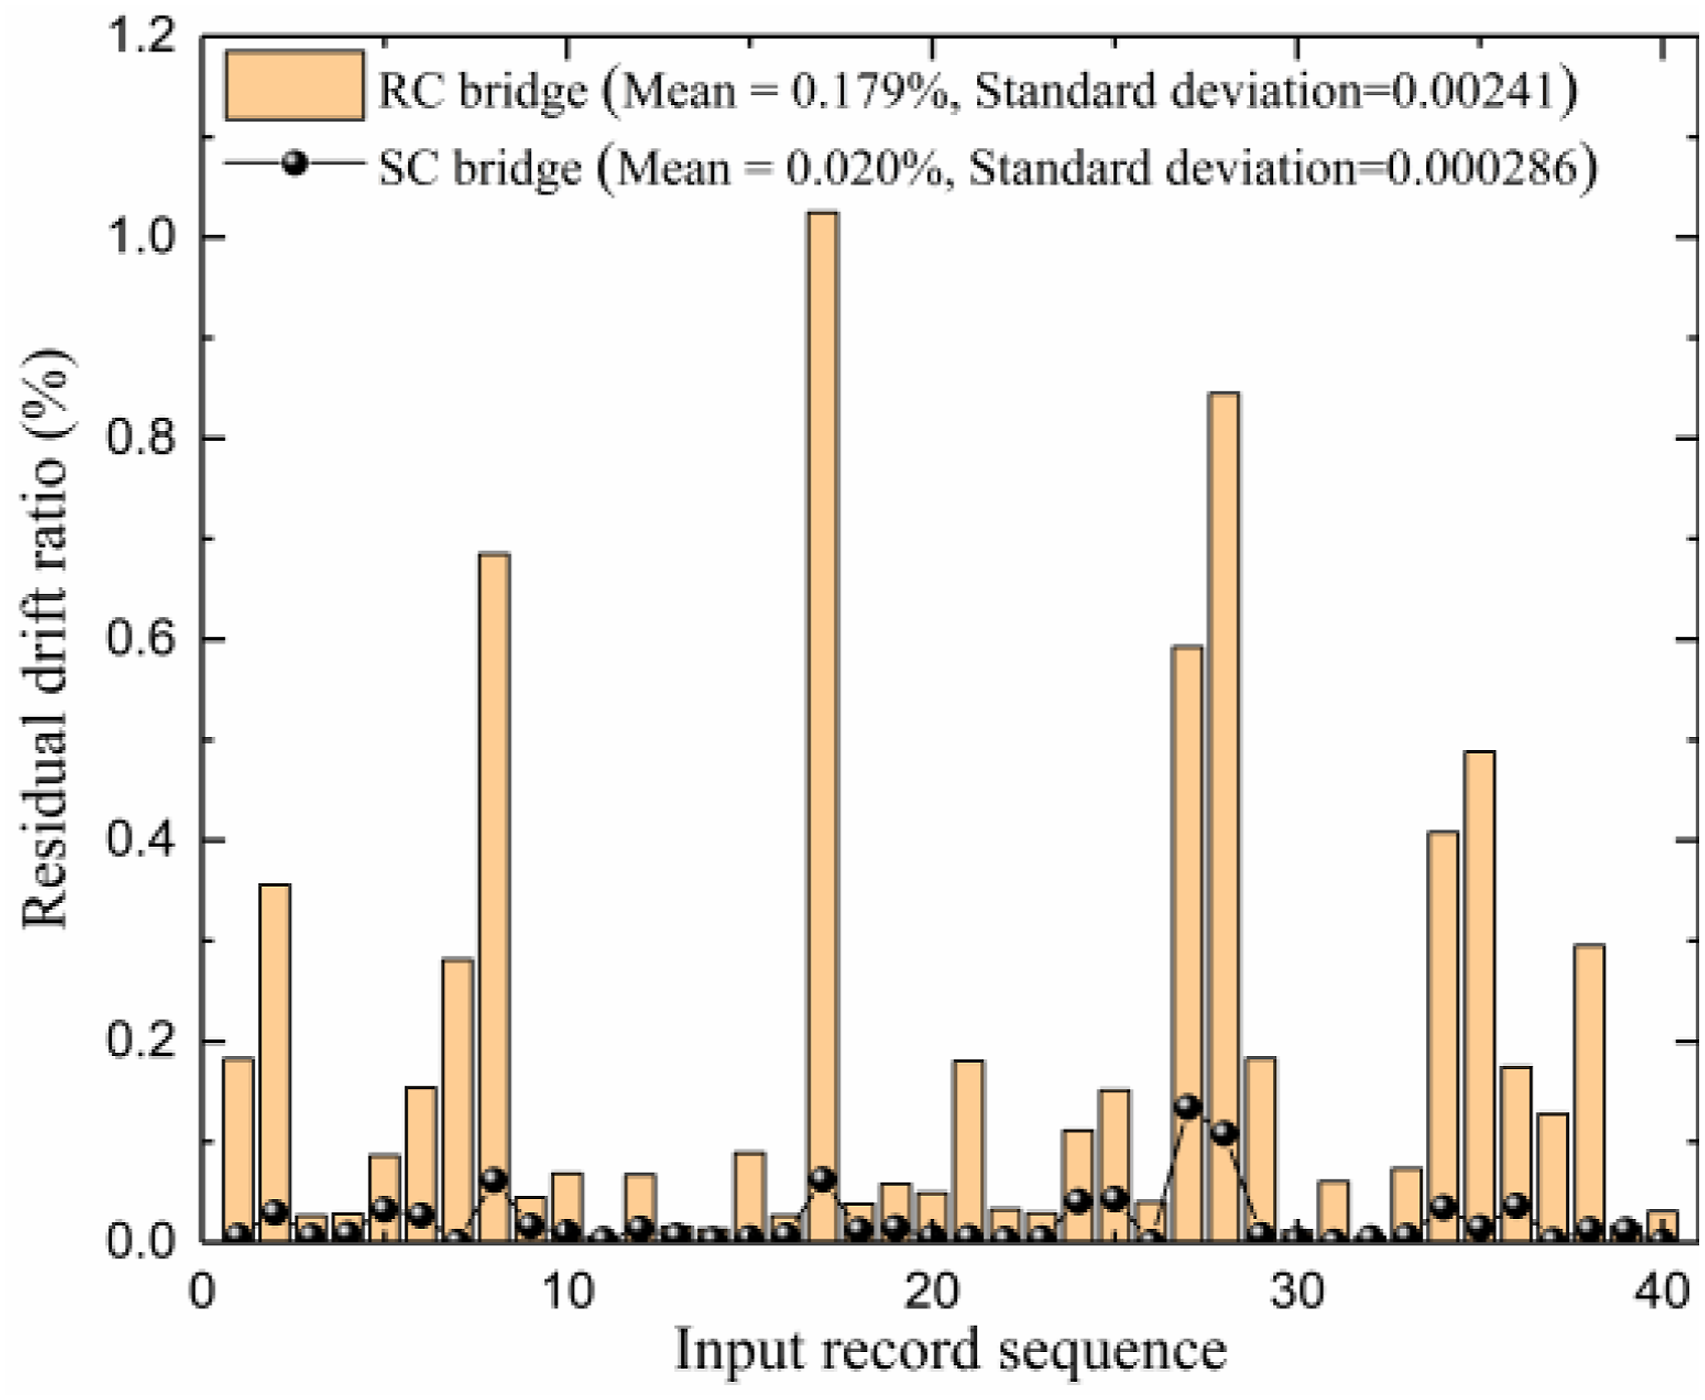
For the RC bridge, the residual drift ratios are generally large, with a mean value of 0.179%. In several records (e.g., E8, E17, and E28), the residual drift ratio exceeds 0.6%, indicating substantial unrecoverable plastic deformation of the tall pier. The maximum residual drift ratio occurs in E17, reaching 1.03%, which corresponds to a residual displacement of 51.5 cm. In contrast, the SC bridge exhibits consistently smaller residual drift ratios across all cases, with a mean value of only 0.020%, i.e., about 11% of that of the RC bridge. In nearly 90% of the cases (36/40), the residual drift ratio is close to zero, providing strong evidence for the effectiveness of the self-centering mechanism. Even in a few records (e.g., E27 and E28) where minor residual response is observed, the maximum residual drift ratio remains below 0.15%. More importantly, for all records, the residual drift ratios of the SC bridge are below the 0.2% threshold commonly associated with immediate functional recovery. This indicates that the SC bridge can maintain functionality and recover rapidly after strong shaking, which is consistent with the observation that the SC tall pier remains largely elastic under strong earthquakes (see Figure 10(b)). The maximum residual drift ratio for the SC bridge occurs in E27, with a value of 0.134%, corresponding to a residual displacement of 6.7 cm.
System fragility curves for two bridges
Figure 12 compares the system-level fragility curves of the SC and RC bridge systems. Overall, the SC bridge exhibits lower exceedance probabilities than the RC bridge at the same PGV for all damage states, indicating better system-level seismic performance. At the slight damage state, the difference between the two systems is relatively small. As the damage state increases, the separation between the fragility curves becomes more pronounced. The RC bridge shows a higher probability of entering severe damage states under moderate and strong ground motions, whereas the SC bridge remains markedly less vulnerable, especially at the extensive and complete damage states. This demonstrates that the self-centering mechanism effectively restrains damage progression and reduces collapse risk at the system level. For example, at PGV = 120 cm/s, the exceedance probabilities of the SC bridge are 97%, 78%, 18%, and 4% for the four damage states, compared with 98%, 88%, 44%, and 20% for the RC bridge. Comparison of system-level fragilities for the two bridge systems.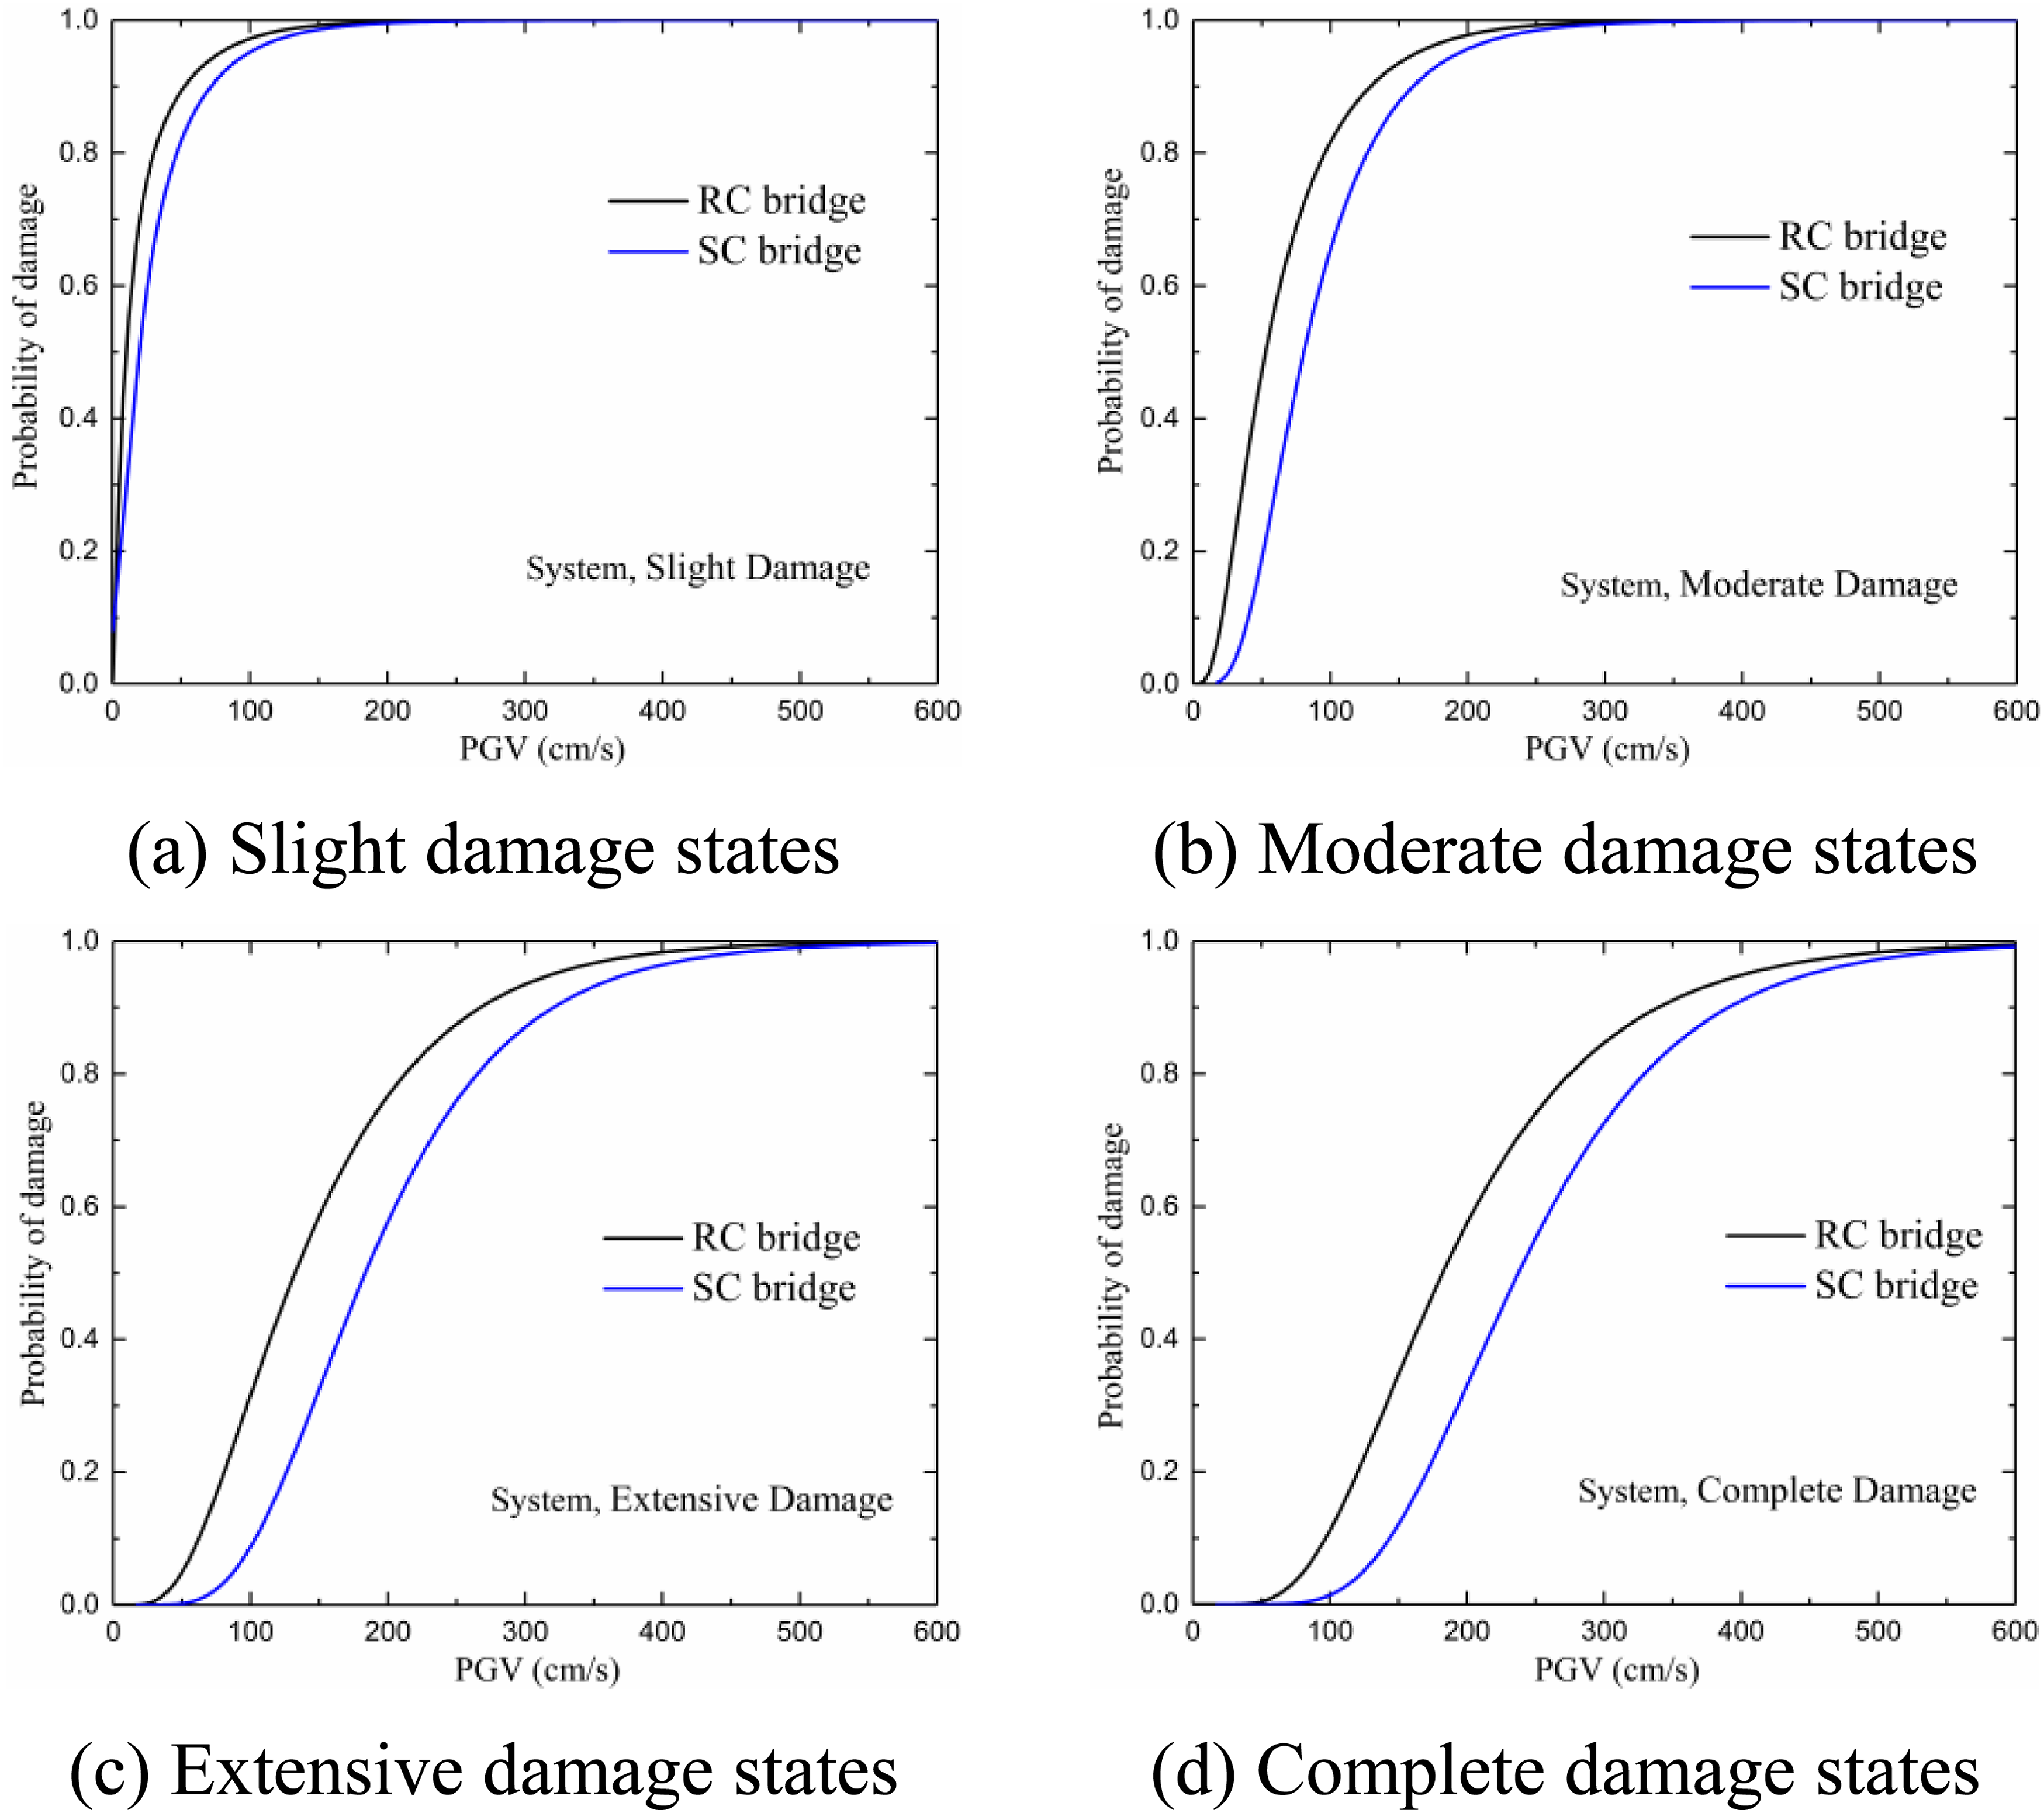
Life-cycle cost assessment for two bridges
Sections 5.1 to 5.5 present the cost calculations for the two bridges in terms of initial construction, operation and maintenance, expected seismic losses, end-of-life stage (including recycling benefits), and environmental impacts. On this basis, Section 5.6 integrates these cost components to provide a comprehensive assessment and comparison of life-cycle costs. It should be noted that, for clarity, the environmental impacts associated with each stage are discussed separately in their corresponding sections.
Initial construction stage
Calculation of the initial construction cost for the prototype tall-pier bridge.
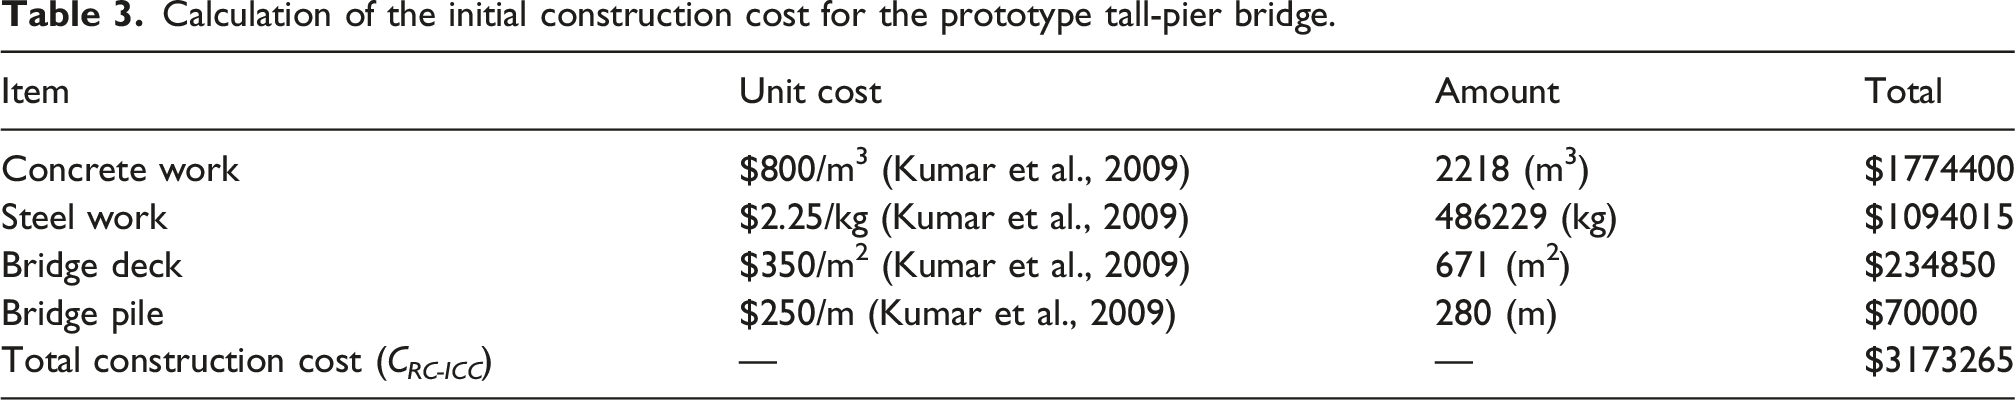
At this stage, the carbon emissions can be estimated based on the total materials consumed in the bridge. Previous studies indicate that the carbon emissions associated with construction activities are 376 kg per cubic meter of concrete and 1242 kg per ton of steel (Qian et al., 2022). Accordingly, the carbon emissions of the prototype and the SC tall-pier bridge are calculated to be 1438 tons and 1520 tons, respectively. The higher carbon emissions of the SC bridge are primarily attributed to the additional materials required for the expanded base.
Operation and maintenance stage
In this stage, the costs primarily cover the routine operation and maintenance activities of the bridge. Assuming a design service life of 100 years, maintenance is scheduled at years 20, 40, 60, and 80. As shown in Figure 13, both the life-cycle maintenance cost and carbon emissions generally increase with service time. However, due to the application of an annual discount rate γ, the present value of maintenance costs decreases over time, while the carbon emissions associated with each maintenance event remain unchanged. Additionally, maintenance costs decline significantly as the γ increases: for γ = 2%, 4%, and 6%, the total maintenance costs for the RC bridge are 5.191 × 10⁴ USD, 2.548 × 10⁴ USD, and 1.424 × 10⁴ USD, respectively. The total maintenance cost of the SC bridge is λ times that of the RC bridge. The total carbon emissions associated with maintenance for the RC and SC bridges are 58 tons and 61 tons, respectively. Life-cycle maintenance cost and carbon emissions.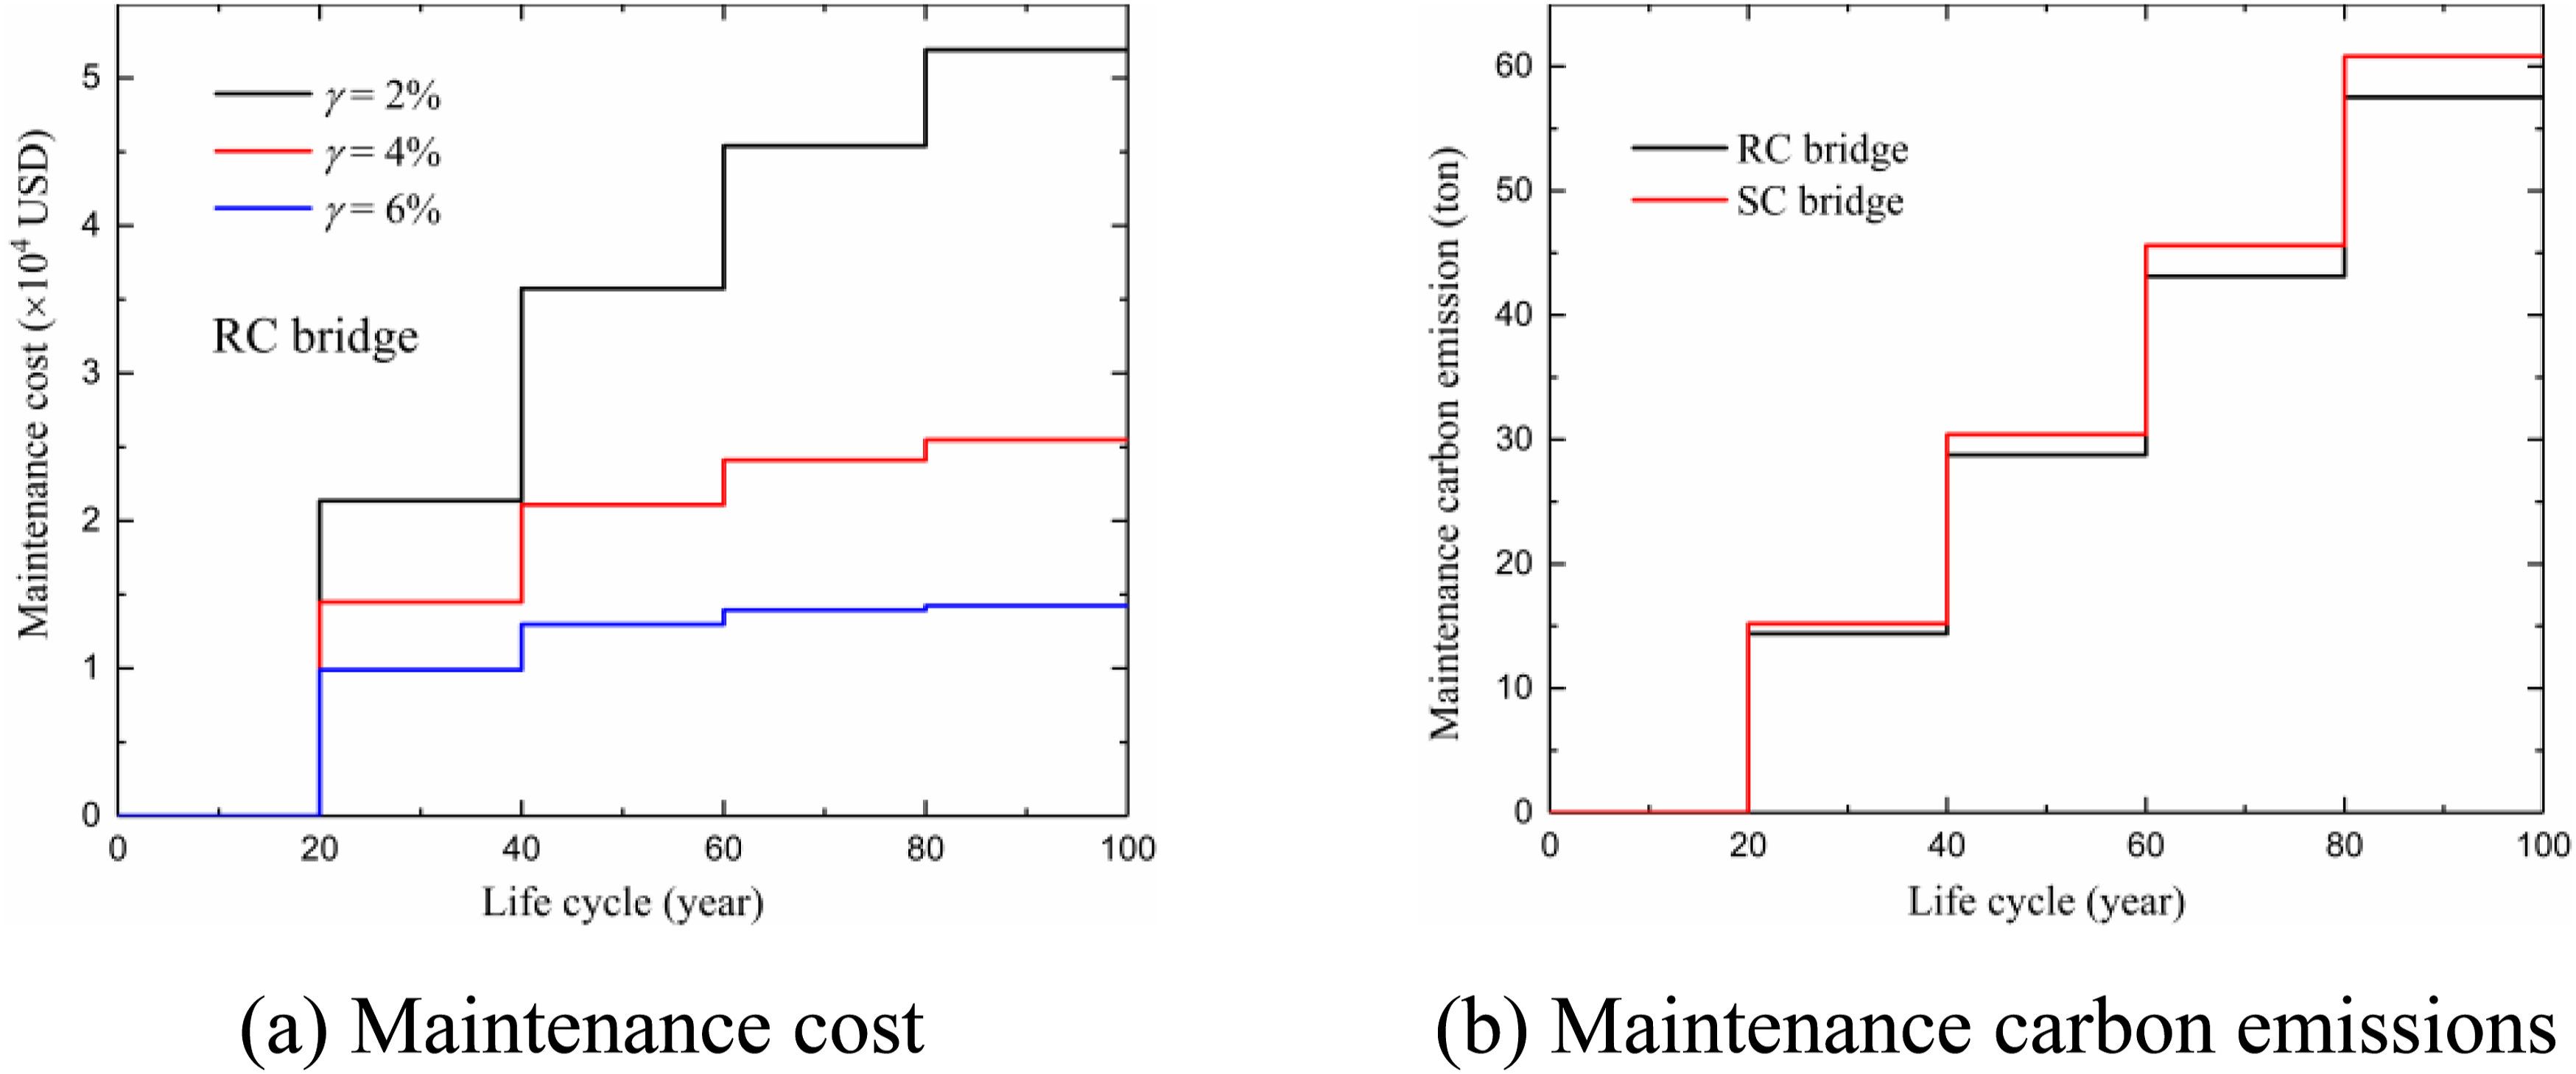
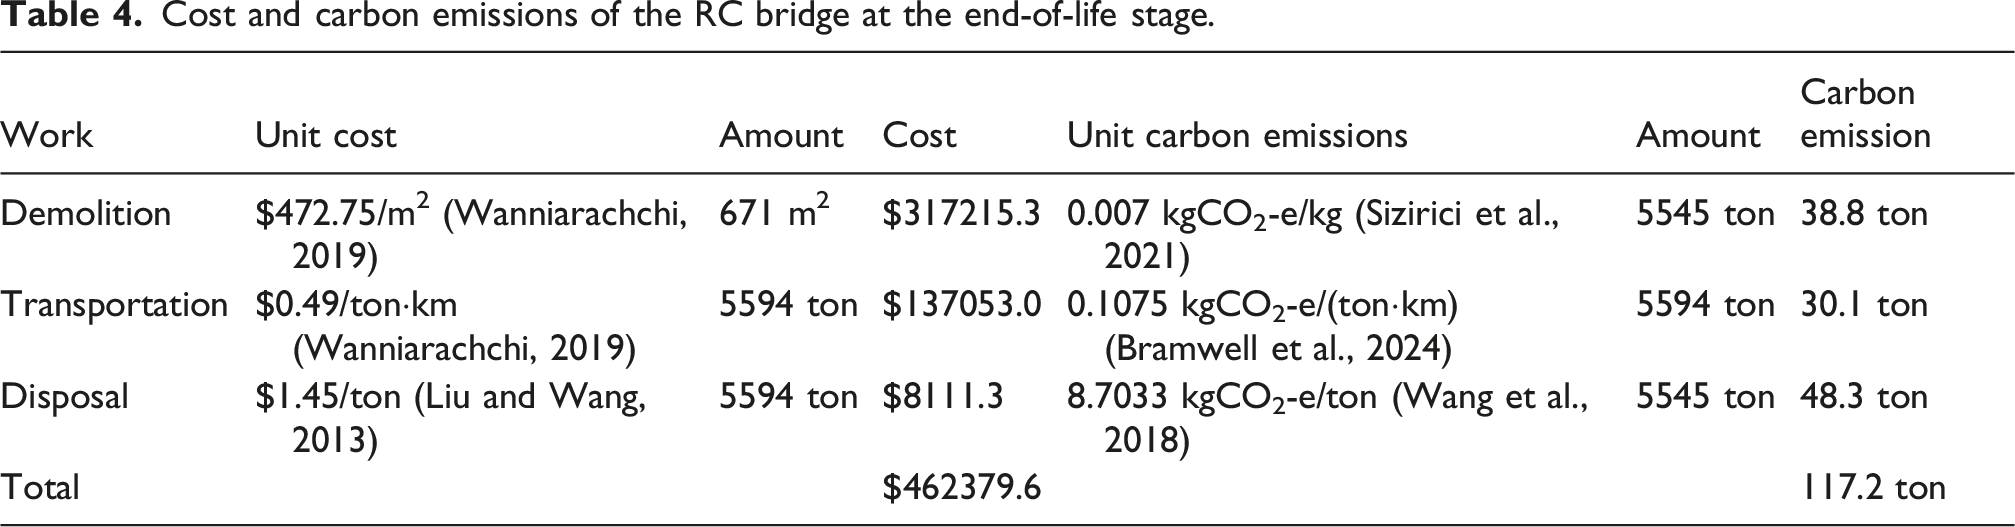
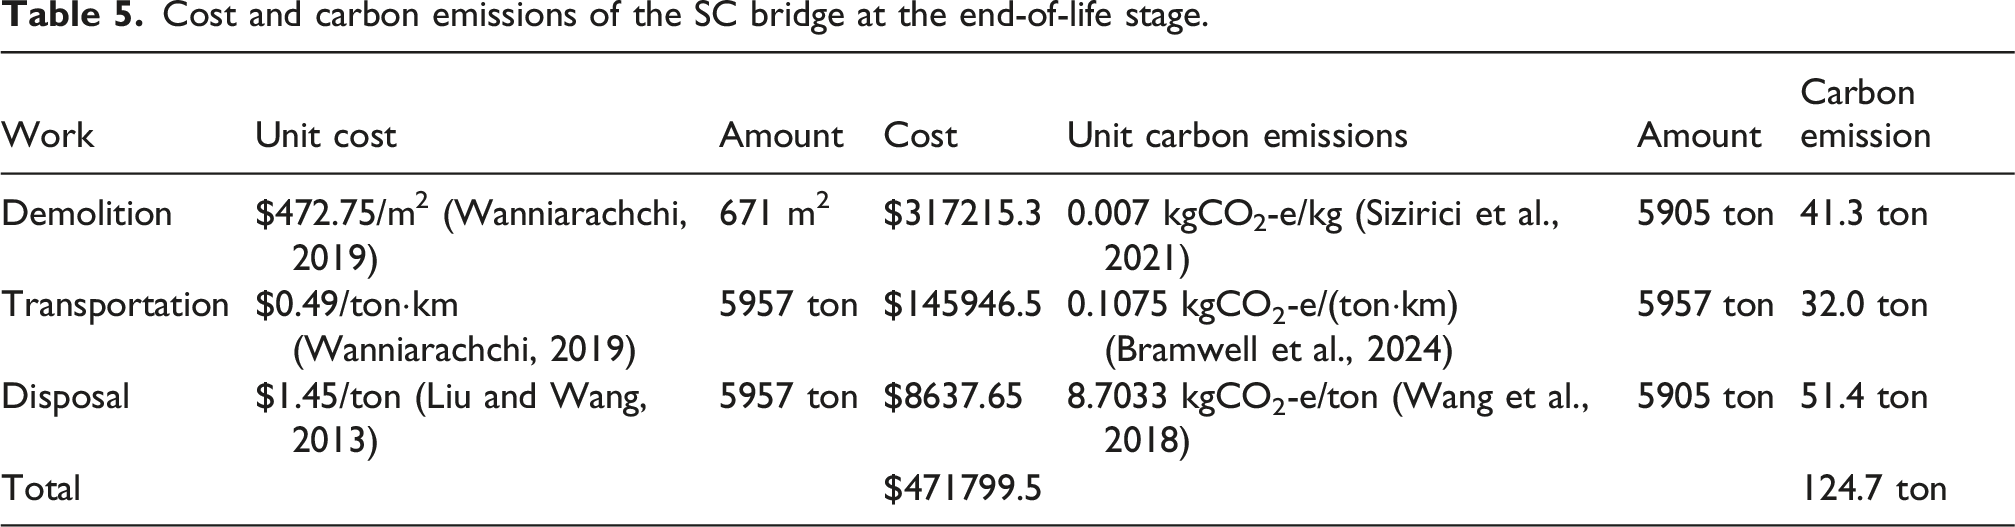
End-of-life stage and recycling benefits
Cost and carbon emissions of the RC bridge at the end-of-life stage.
Cost and carbon emissions of the SC bridge at the end-of-life stage.
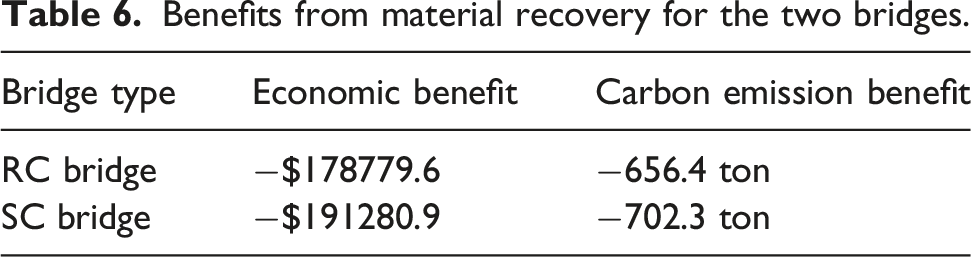
Benefits from material recovery for the two bridges.
Earthquake-induced life-cycle losses
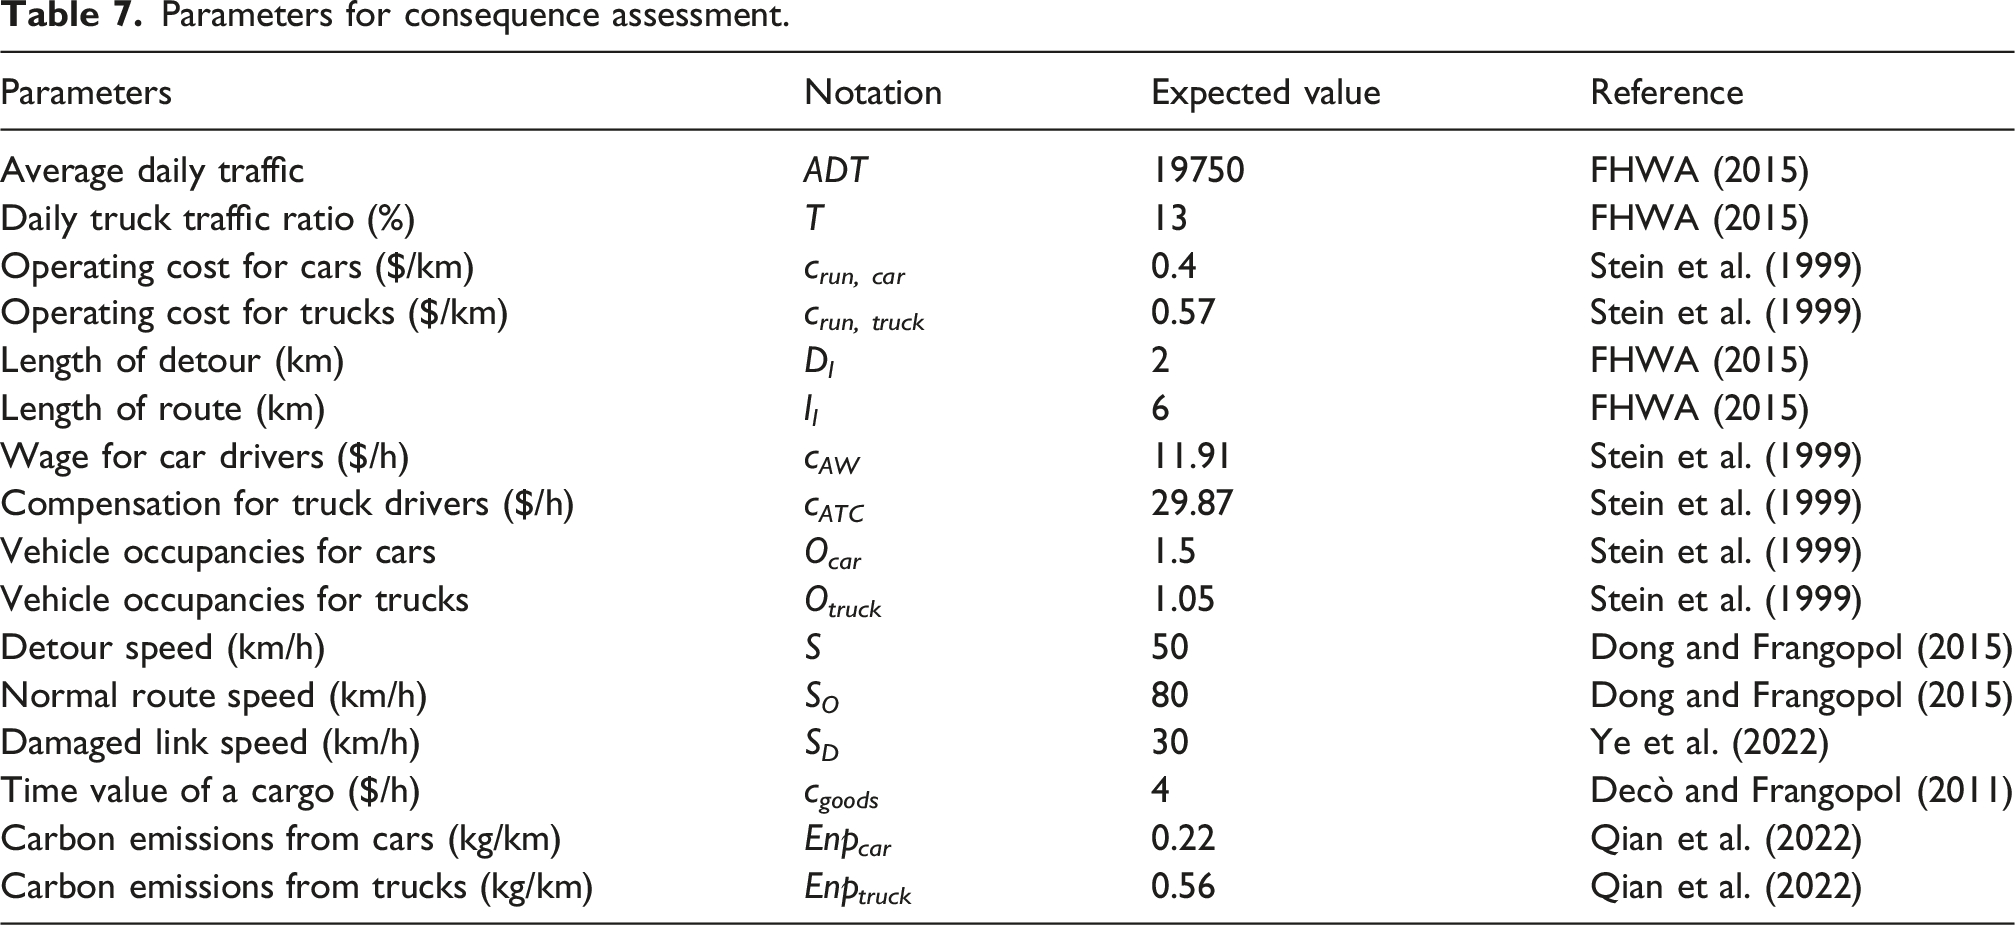
Parameters for consequence assessment.
It should be noted that tall-pier bridges generally incur higher repair costs than conventional bridges due to the increased difficulty of working at heights, the need for specialized equipment, and longer traffic disruption periods. The RCR values adopted in this study are based on general bridge data (Mander, 1999) and may therefore be conservative for tall-pier applications. However, the comparative conclusions between SC and RC bridges remain valid, as both systems share similar construction and repair conditions. Future research should develop tall-pier-specific RCR databases through detailed case studies and stakeholder surveys. The repair cost of the self-centering (SC) tall pier includes the replacement of energy dissipation devices (EDs), local concrete repair, and maintenance of PT tendons, as well as associated labor and material costs. Costs for different damage states, including minor, moderate, extensive, and complete damage, are calculated as fractions of the initial construction cost. Downtime and traffic disruption are also considered, and the expected repair cost is weighted by the probability of each damage state obtained from system-level fragility curves. This method ensures that the estimated repair cost reflects both structural damage and functional loss.
Seismic-induced bridge damage results in additional carbon emissions associated with repair activities and traffic detours. The carbon emissions caused by traffic detours are calculated as (Qian et al., 2022):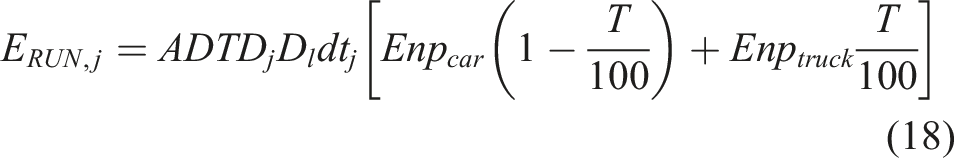
Figure 14 shows the life-cycle seismic loss and corresponding carbon emissions of the two bridges under γ = 2%. The SC bridge has substantially lower seismic loss than the RC bridge, indicating better economic resilience under earthquakes. The life-cycle seismic loss of the RC bridge is 4.922 × 10⁶ USD, while that of the SC bridge increases slightly with λ, from 2.764 × 10⁶ USD at λ = 1.1 to 2.877 × 10⁶ USD at λ = 1.2. Even so, the SC bridge still reduces seismic loss by 43.8% and 41.5%, respectively, showing that its lower fragility and faster recovery effectively offset the disadvantage of a higher initial cost. Equal seismic loss is reached only when λ = 3, which is unrealistic in practice. In terms of environmental impact, the earthquake-induced carbon emissions of the RC and SC bridges are 2738.5 tons and 1468.6 tons, respectively, indicating a 46.4% reduction for the SC bridge. This confirms its clear advantage in reducing earthquake-related environmental burdens. Life-cycle seismic losses and carbon emissions of the two bridges.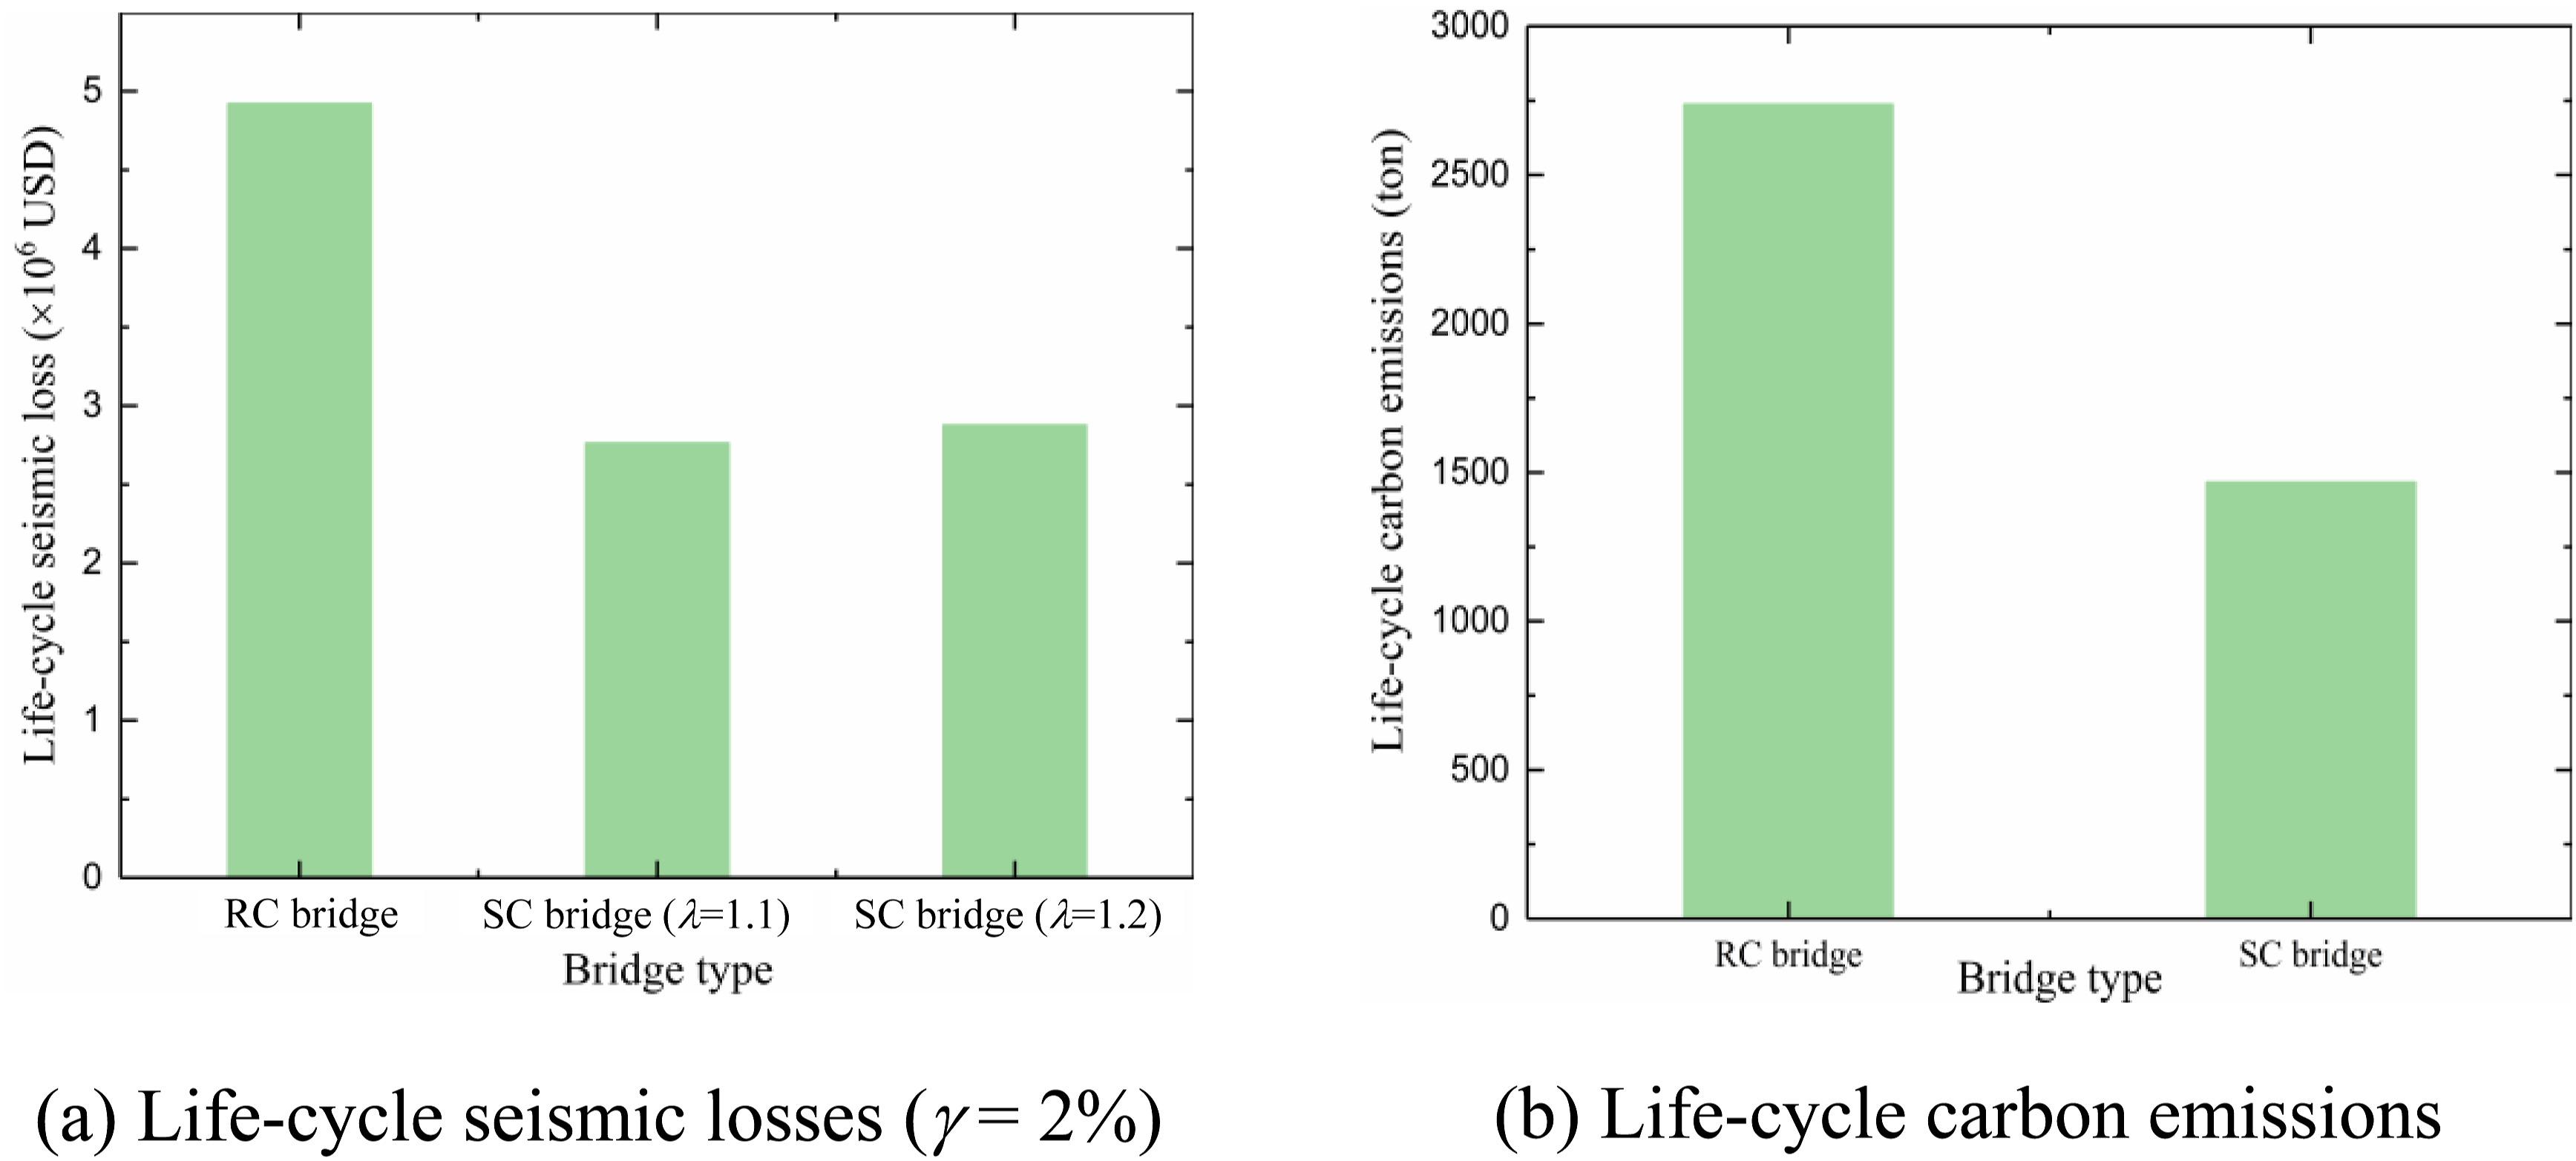
Environmental cost
Figure 15 shows the whole-life carbon emissions of the two bridges at different stages. Overall, the SC bridge has much lower whole-life carbon emissions than the RC bridge, with total emissions of 2472.0 tons and 3695.3 tons, respectively, representing a 33.1% reduction. The recycling benefits are −702.3 tons for the SC bridge and −656.4 tons for the RC bridge, accounting for 28.4% and 17.8% of the corresponding totals, which indicates that recycling should not be neglected in life-cycle carbon evaluation. For both bridges, the maintenance stage contributes the least carbon emissions, while the initial construction and earthquake-induced stages dominate the total, accounting for about 95%. Therefore, material production, construction, post-earthquake repair, and traffic recovery are the main contributors to life-cycle environmental impact. Whole life-cycle carbon emissions (100 years).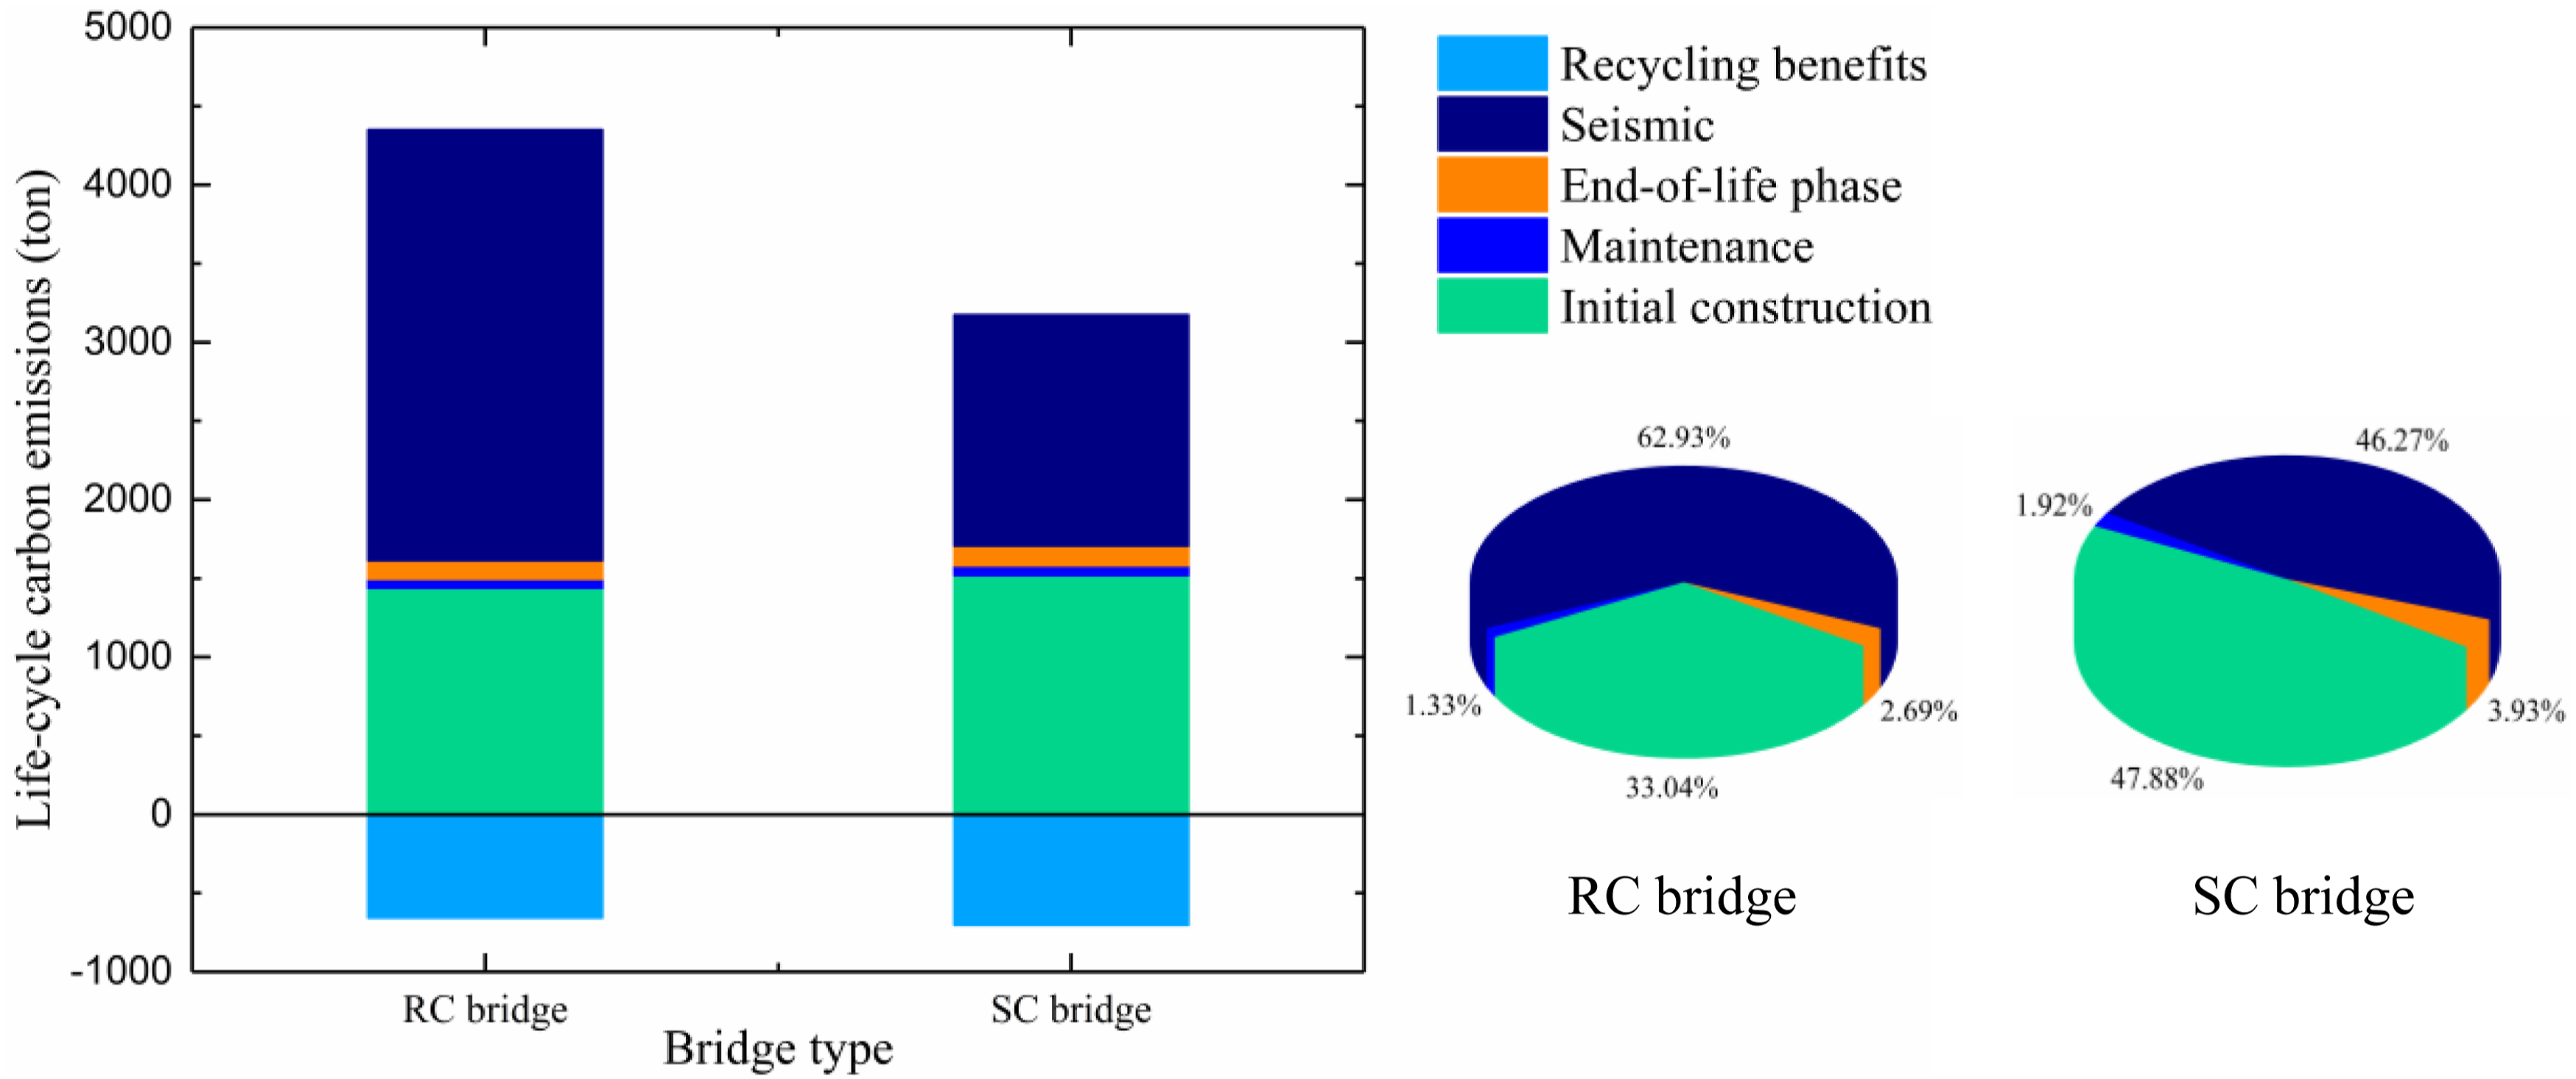
Given the variation in carbon pricing across different countries and regions, the median carbon price is adopted in this study for analysis, i.e., 243 USD/ton (CCCA-Experten, 2020). Accordingly, the environmental costs of the RC bridge and SC bridge are calculated to be 8.980 × 10⁵ USD and 6.007 × 10⁵ USD, respectively.
Life-cycle cost benefit analysis
By integrating the results of the above cost-component analyses, the total life-cycle costs of the two bridges can be further obtained. To quantitatively evaluate the whole-life economic advantage of the SC bridge relative to the RC bridge, the life-cycle benefit ratio η of the SC bridge is defined as follows: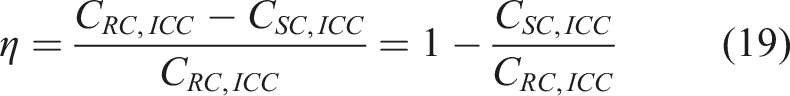
Figure 16 shows the values of η under different γ and λ for service lives of 50 and 100 years. Overall, η decreases with increasing γ and λ. When η > 0 is taken as the economic criterion, the SC bridge remains economically beneficial when λ is below about 1.31 under typical discount-rate conditions. If a higher target of η ≥ 10% is required, this limit decreases to about 1.15. These results indicate that reducing the initial construction cost is critical to improving the life-cycle economic performance of SC tall-pier bridges. Moreover, for a given γ, the maximum η always occurs at λ = 1. The maximum η ranges from 0.19 to 0.25 for t = 50 years and from 0.20 to 0.28 for t = 100 years, implying that the SC bridge may lose its economic attractiveness when the owner’s target benefit exceeds this range. The values of η under different λ and γ.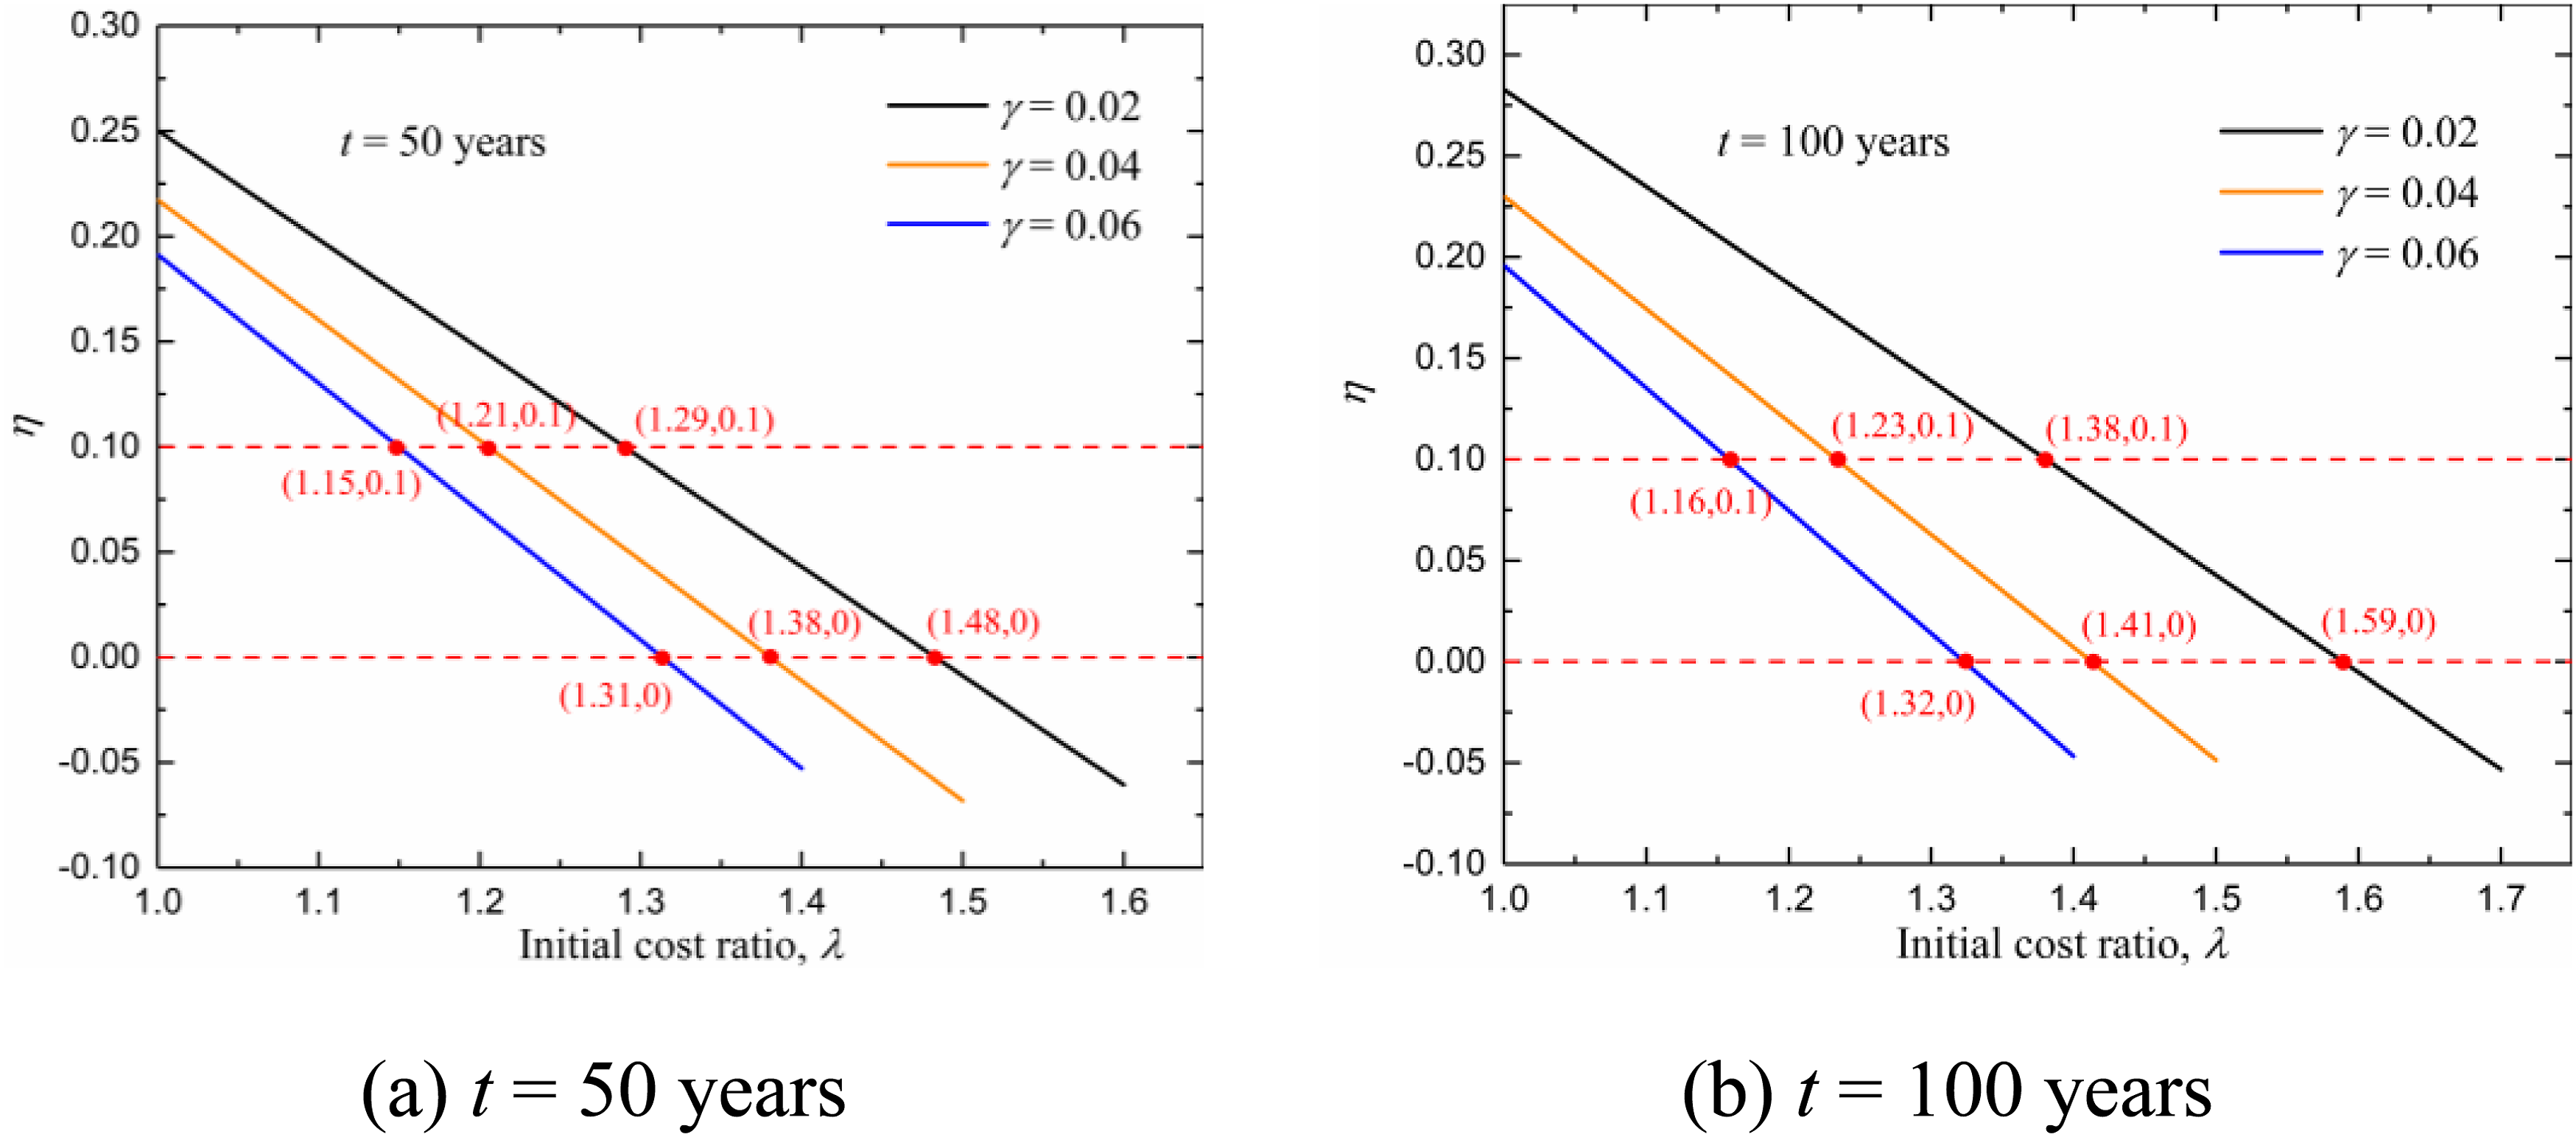
Figure 17 illustrates the effect of λ and γ on the pay-off time of the SC bridge. Overall, γ has a significant influence on the life-cycle economic performance, with lower discount rates corresponding to shorter pay-off times, indicating that the SC bridge is more economically advantageous in low-inflation economies or other contexts where the discount rate is relatively low. For a given γ, the pay-off time generally increases with the initial construction cost of the SC bridge, i.e., with increasing λ. In particular, when γ = 0.04 and γ = 0.06, the pay-off time rises sharply once λ exceeds 1.35 and 1.30, respectively. To limit the pay-off time to within 50 years, λ should be maintained approximately between 1.31 and 1.48, depending on the discount rate γ. In other words, when the initial construction cost of the SC bridge is kept within a reasonable range, it demonstrates favorable economic feasibility over the full life cycle. The pay-off time under different λ and γ.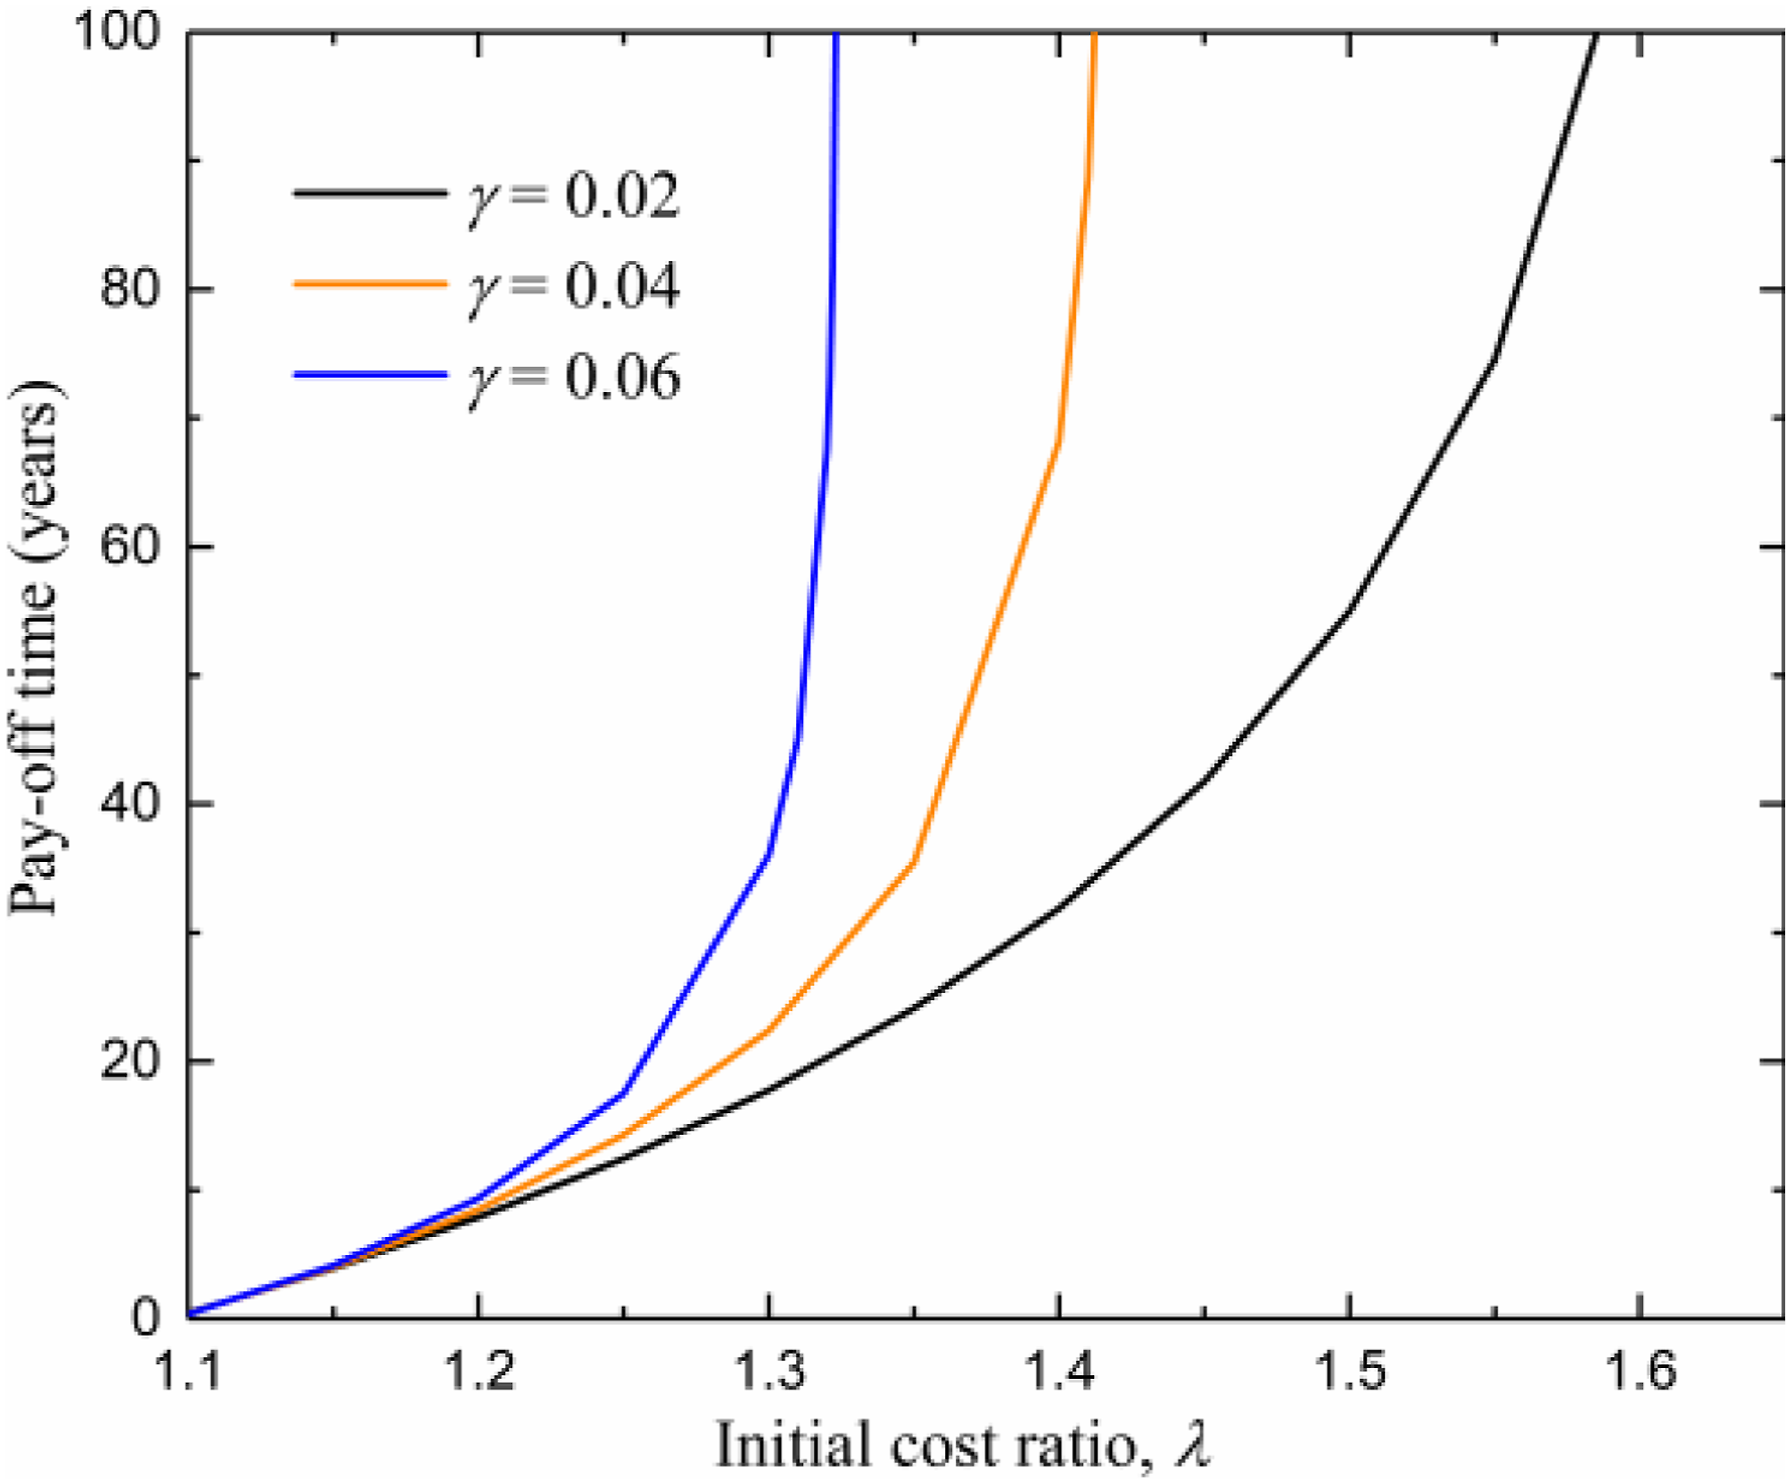
Figure 18 presents the whole-life cost of the two bridges at different stages under γ = 0.02. The total whole-life costs of the RC bridge and the SC bridge with λ = 1.38 are 9.083 × 10⁶ USD and 8.175 × 10⁶ USD, respectively, corresponding to η = 10%. Recycling benefits account for 2.0% and 2.4% of the total cost for the RC and SC bridges, respectively, indicating a limited but positive contribution. For both systems, the initial construction and earthquake-induced stages dominate the whole-life cost, while the maintenance and end-of-life stages contribute much less. Compared with the RC bridge, the SC bridge has a lower proportion of earthquake-induced cost because its self-centering mechanism reduces post-earthquake damage, repair demand, and traffic detour losses. Therefore, the better whole-life economic performance of the SC bridge mainly results from its lower earthquake-induced loss. Total life-cycle cost for γ = 0.02 (100 years).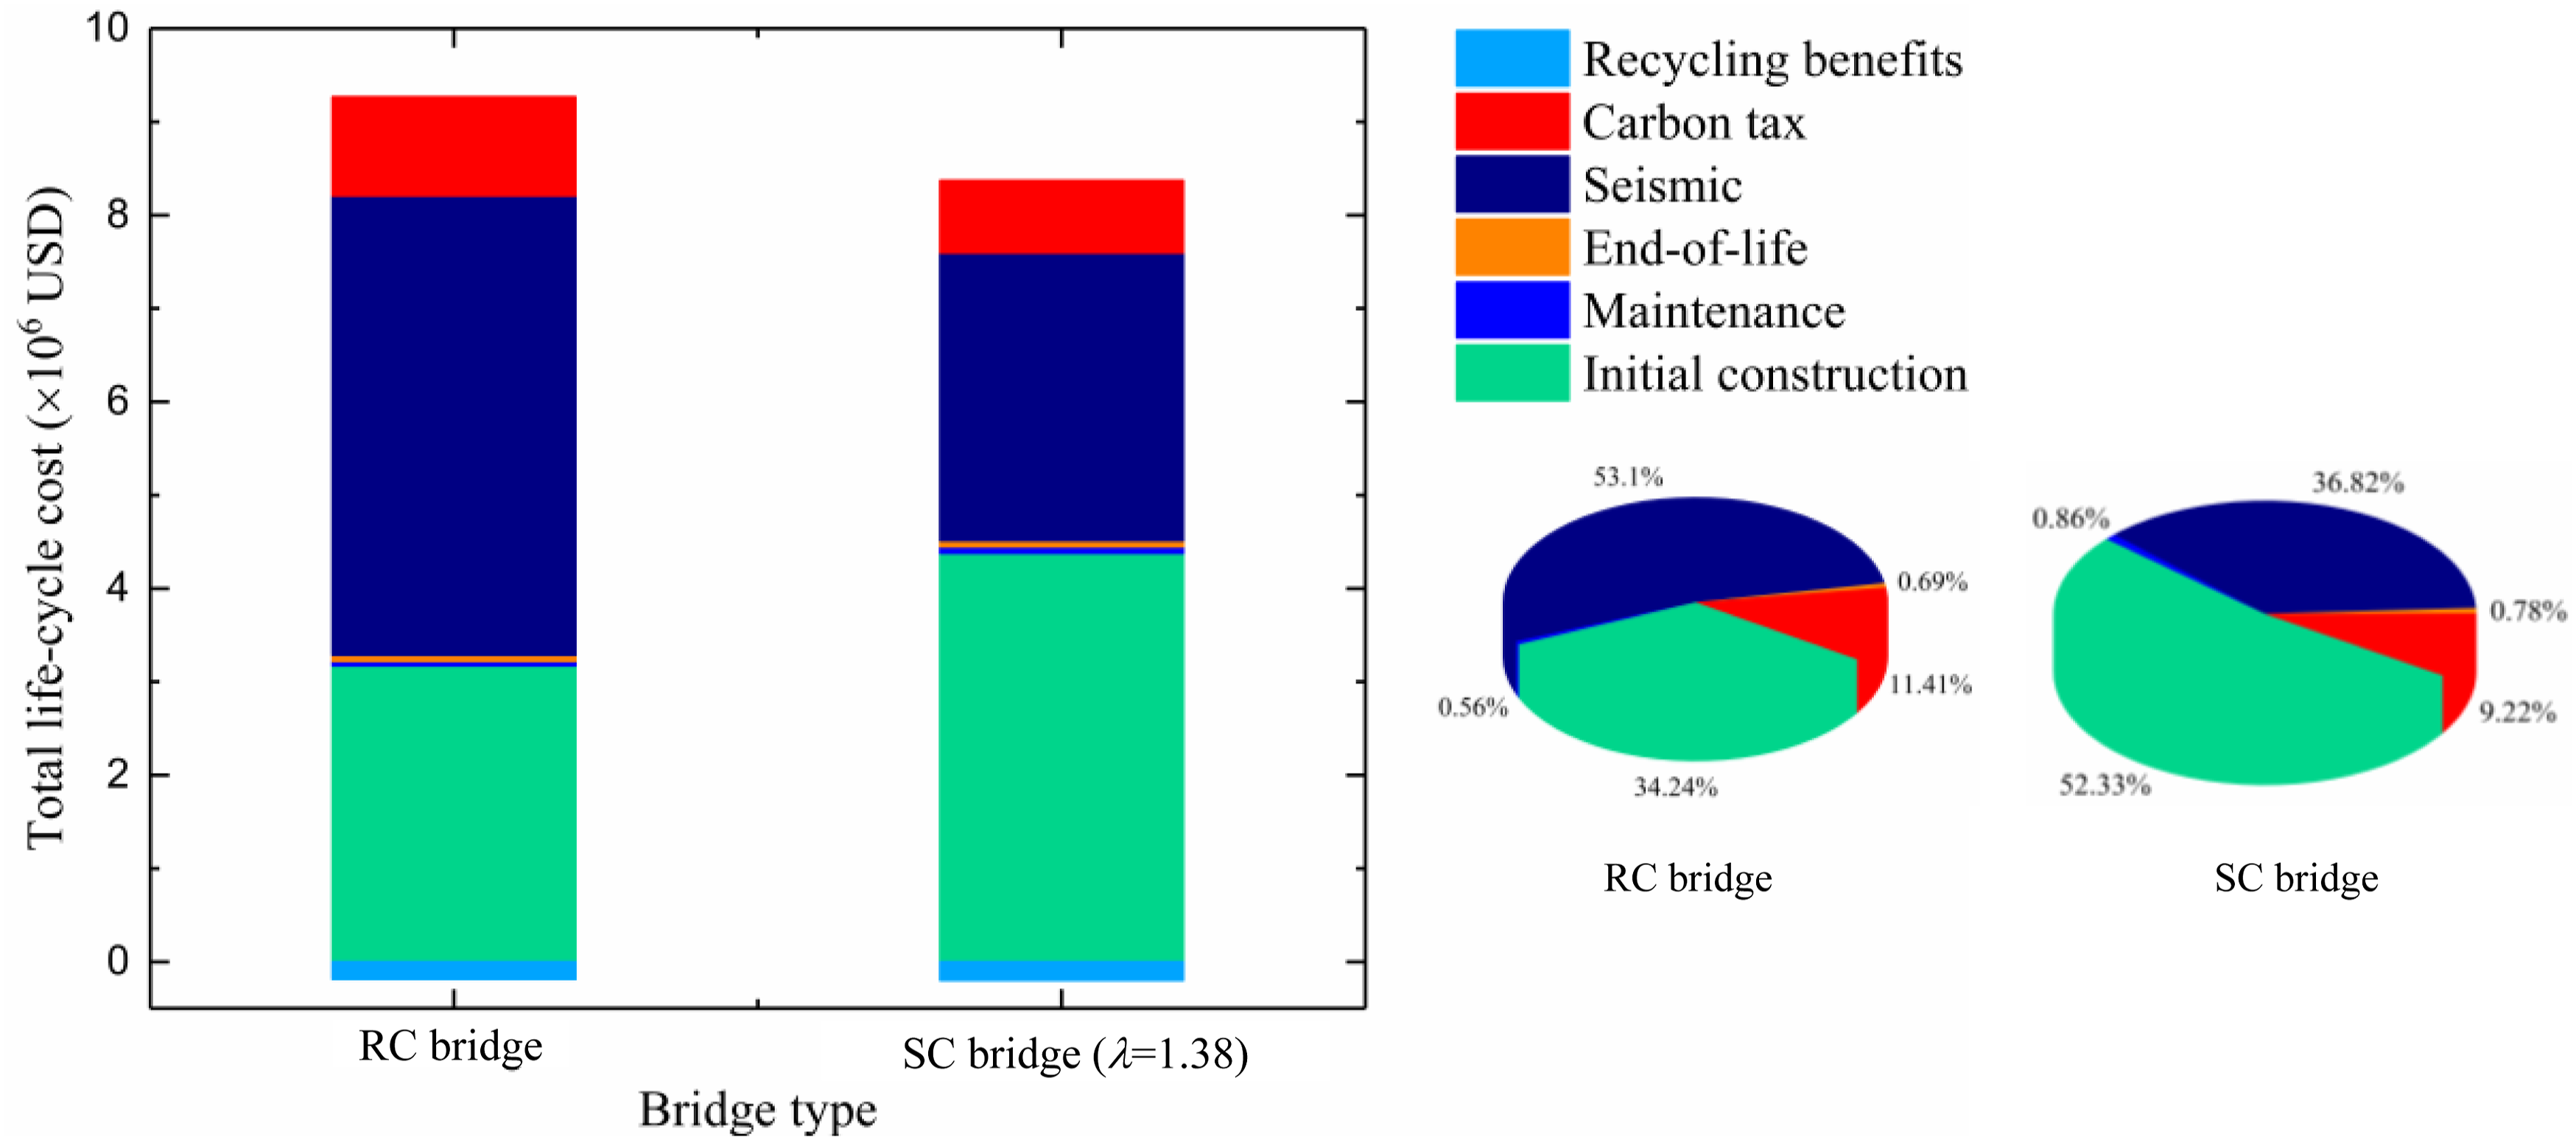
Discussion on the lightweighting potential of the SC tall pier
It is noteworthy that lightweighting of tall-pier structures can further reduce seismic forces and improve economic performance. The proposed SC tall pier inherently incorporates a hollow-section design, which partially reduces material consumption. Nevertheless, further lightweighting is achievable through several strategies: (1) application of high-strength concrete (e.g., C60 or UHPC) to reduce sectional dimensions; (2) use of high-strength or SMA-based energy dissipation devices to reduce the amount of steel; (3) optimization of PT tendon layout and anchorage details; and (4) refined sizing of the expanded base based on overturning demand. However, lightweighting should be carefully balanced with the recentering capability and overturning stability, as reduced self-weight may require higher prestressing forces to maintain the same level of recentering performance. A systematic multi-objective optimization framework is therefore recommended for future studies to explore the lightweighting potential of SC tall-pier bridges while satisfying seismic resilience and life-cycle economic requirements.
Conclusions
This study proposes a life-cycle cost assessment framework for SC tall-pier bridges and conducts a comparative investigation into the economic performance and environmental impacts of SC tall-pier bridges and conventional RC bridges over the whole life cycle. The main conclusions are summarized as follows: 1. The SC tall-pier bridge shows lower system fragility than the conventional RC bridge at all damage states, especially under extensive and complete damage states, indicating better seismic resilience and post-earthquake recoverability. 2. The SC tall-pier bridge significantly reduces earthquake-induced loss and life-cycle carbon emissions. For example, when λ = 1.1 and γ = 2%, the life-cycle seismic loss is reduced by 43.8%. 3. The initial cost ratio λ and discount rate γ govern the life-cycle economic performance of the SC bridge. The economic benefit remains positive when the initial cost is below 1.31 times that of the RC bridge, and this limit decreases to 1.15 for a 10% target return. 4. The initial construction and earthquake stages dominate whole-life cost and carbon emissions. Overall, despite its higher initial cost, the SC tall-pier bridge offers better whole-life economic and environmental performance.
Future research could focus on the following aspects: 1. Further investigation of self-centering tall-pier bridges under combined effects of varying seismic intensities, wind loads, and traffic loads, to better simulate complex in-service conditions. 2. Exploration of the influence of design parameters, such as PT tendon arrangement, energy dissipation device performance, and cross-sectional dimensions, on life-cycle cost, maintenance demand, and environmental impact, providing quantitative guidance for design and investment decisions. 3. Conducting medium- and large-scale shake table tests and field monitoring to further validate numerical models and evaluate the long-term performance of the self-centering mechanism under realistic conditions. 4. Investigation of high-performance lightweight concrete, composite materials, and optimized cross-section design to reduce structural weight and enhance seismic performance and economic efficiency of self-centering bridges. 5. Development of a multi-indicator framework combining seismic fragility analysis, economic loss assessment, and CO2 emissions, to guide resilient and sustainable design of tall-pier bridges under extreme conditions.
Footnotes
Funding
The authors disclosed receipt of the following financial support for the research, authorship, and/or publication of this article: This work was supported by we gratefully acknowledge the financial support provided by the National Natural Science Foundation of China (Grant No. 52125802).
Declaration of conflicting interests
The authors declared no potential conflicts of interest with respect to the research, authorship, and/or publication of this article.