






Abstract
Perfobond rib shear connectors (PBLs) are largely applied in steel-concrete composite beams because they provide high shear strength, significant stiffness, and good fatigue durability. In order to clarify the respective roles of the perforating bars and concrete dowels in the shear resistance of PBLs, a total number of 42 tests were carried out on PBL push-out specimens, excluding the concrete end-bearing effect. Experimental variables comprised the concrete compressive strength, hole diameter, number and diameter of the perforating bars, and their positional arrangement within the rib holes. The test results revealed two primary failure patterns: (1) concrete slab splitting failure for specimens with one or without the perforating bar, and (2) splitting failure with transverse cracks of the concrete slab for specimens with two perforating bars. All specimens reinforced with 12 mm and 16 mm perforating bars exhibited yielding or shear failure of the bars, whereas those with 20 mm bars remained unyielded. The corresponding load-slip (P-S) curves revealed three sequential phases: an initial elastic phase, a plastic ascending phase, and a descending phase. A new predictive equation was derived through regression analysis, which has subsequently been incorporated into the Chinese design standard (GB 50917). In addition, an empirical expression for the ascending stage of the P-S curve was obtained through curve-fitting analysis.
Keywords
Introduction
Steel-concrete composite structures have been commonly used in buildings and bridges owing to their high strength, good ductility, and construction efficiency (Abdulhameed et al., 2021; Xue et al., 2008b). The composite action between the concrete slab and steel beam is ensured by shear connectors, which transfer longitudinal shear forces and restrain interfacial separation under service conditions (Chen et al., 2024; Li et al., 2022; Xue et al., 2025a, 2025b). Weld studs and Perfobond rib shear connectors (PBLs) are two types of shear connectors adopted in the composite structures. Among these, weld studs are widely used shear connectors due to simple application, rapid fabrication, and high strength (Kuang et al., 2024; Oehlers and Coughlan, 1986; Xue et al., 2008a). However, such connectors have certain limitations, particularly when fatigue issues dominate the design due to the high flexibility and the resulting interfacial deformations under service loads (Luo et al., 2016). Besides, the shear strength of weld studs is affected by welding quality and conditions (Wang et al., 2023; Wei et al., 2022). A large number of studs are required to ensure the composite action, which leads to difficulty in the on-site construction due to the large amount of welding work. Given this fact, Leonhard et al. (1987) first proposed an enhanced new type of shear connectors, Perfobond rib shear connectors (PBLs) (Leonhardt et al., 1987; Zhan et al., 2023a). PBLs consist of steel plates with several predrilled holes, perforating bars, and concrete dowels (Karam et al., 2024; Xue et al., 2024a, 2024b; Zhang et al., 2022), which resist the interfacial horizontal shear forces and vertical uplift forces between the concrete slab and the steel beam. The force transmission for PBLs is directionally constrained along the PBL ribs (He et al., 2017). Compared to weld studs, the PBLs have superior shear performance and anti-fatigue behavior (Allahyari et al., 2018). And, PBLs received extensive attention due to advantages of simple manufacture and easy installation (Lorenc et al., 2022).
Numerous studies have investigated the shear behavior of PBLs, with most adopting the push-out testing procedure specified in Eurocode 4. This method can reduce the initial loading eccentricity, which would lead to additional bending moments and affect the accuracy of the test. Experimental research has revealed that the ultimate shear resistance of PBLs is influenced by several factors, including the concrete dowels, perforating bars, the friction between the concrete slab and the steel beam, and the concrete end-bearing effect (He et al., 2017; Tan et al., 2022; Zhan et al., 2023b). Among these factors, the shear resistance primarily depends on the transverse perforating bars and the concrete dowels, whereas friction provides a relatively minor contribution because large interfacial slip occurs at failure (Kim and Choi, 2010; Kim et al., 2013; Zou et al., 2023). Additionally, the concrete end-bearing effect, arising from the direct contact between the rib end and the surrounding concrete, offers extra shear resistance to the connector (Yang and Chen, 2018; Zou et al., 2023). Accordingly, push-out specimens can be classified into two types: those incorporating and those excluding the concrete end-bearing effect (Ahn et al., 2008; Lee et al., 2020; Valente and Cruz, 2009).
Currently, a large number of experimental studies are underway to investigate the shear behavior of PBLs, taking into account the effect of concrete end-bearing. (Ahn et al., 2008; Costa-Neves et al., 2013; Da. C. Vianna et al., 2013; Neto et al., 2017; Nishido et al., 2002; Oguejiofor and Hosain, 1994; Peng et al., 2025; Veldanda and Hosain, 1992; Vianna et al., 2009; Wu et al., 2023; Yang and Chen, 2018). Previous studies have demonstrated that the ultimate shear resistance and the load–slip response of PBLs are largely governed by several geometric and material parameters, such as the number and shape of the perforated holes, the rib height and thickness, the arrangement and transverse perforating bars diameter, and the concrete compressive strength (Abdulhameed et al., 2021; He et al., 2021; Hu et al., 2024; Wang et al., 2019, 2021). Push-out tests on PBLs were first carried out by Oguejiofor et al. (Oguejiofor and Hosain, 1994, 1997), reporting that the shear contribution of the concrete dowels did not scale proportionally with increasing concrete strength. They also observed that the effect of spacing between adjacent holes becomes negligible when the center-to-center distance exceeds approximately 2.25 times the diameter of the hole in PBLs. The perforating bars were found to markedly improve the connector’s shear resistance, stiffness, and slip restraint capacity. Ahn et al. (Ahn et al., 2010) investigated various configurations of PBL connectors and found that the presence of the concrete end-bearing effect modifies how the perforating bars and concrete dowels, respectively, contribute to the overall shear resistance of the connectors. Yang and Chen (Yang and Chen, 2018) conducted a series of 15 PBL push-out tests to study the influence of hole diameter, number of holes, concrete strength, rib thickness, and perforating bar diameter on the shear performance of PBLs. Their results indicated that the specimens failed by concrete slabs splitting, perforating bar yielding, and concrete shearing off, while the hole number exerted a limited influence on the mechanical behavior.
Compared to research on specimens with concrete end bearing effect, experimental research on specimens without concrete end-bearing effect is less (Kim and Choi, 2010; Zheng and Liu, 2014; Zou et al., 2023). Kim and Choi (Kim and Choi, 2010) investigated the impact of perforating bars’ diameter and hole number on the shear behavior of PBLs, concluding that the strength of PBLs increases linearly with the diameter of the perforating bars. Zhao and Liu (Zheng and Liu, 2014) performed 21 push-out experiments and reported that the hole geometry -whether circular or elliptical - had a negligible influence on the ultimate shear strength of PBLs, though it noticeably affected their stiffness. Valente (Valente and Cruz, 2009) conducted push-out tests on PBL specimens and found that eliminating the concrete end-bearing effect reduced the shear resistance to approximately 75–87% of that observed in specimens with end-bearing. In contrast, Yang and Chen (Yang and Chen, 2018) observed a more significant reduction, with the shear capacity of the non-end-bearing specimens being about 44% lower. Furthermore, Zhou et al. (Zou et al., 2023) investigated four sets of push-out tests and noted that the inclusion of restrained reinforcing bars enhanced the overall shear resistance by roughly 19%, while exerting only a minor influence on the rigidity and ductility of connectors.
Several empirical models derived from push-out test data have been put forward to estimate the shear resistance of PBLs. Oguejiofor et al. (Oguejiofor and Hosain, 1994, 1997), Al-Darzi et al. (Al-Darzi et al., 2007), Ahn et al. (Ahn et al., 2008, 2010), and Yang (Yang and Chen, 2018) developed empirical models that take into account the combined influence of concrete dowel strength, the resistance offered by the perforating bars, and the supplementary effect arising from concrete end-bearing. In contrast, Zheng et al. (Zheng et al., 2016) presented a simplified expression that excludes the influence of the end-bearing mechanism.
Based on the above literature review, several research gaps can be identified: (a) Most previous push-out tests on PBLs considered the concrete end-bearing effect. Although this effect can increase the shear resistance, it makes it difficult to distinguish the individual contributions of concrete dowels and perforating bars. (b) The influence of the position of perforating bars within the rib holes has not been sufficiently investigated. (c) Existing predictive models for the shear capacity of PBLs differ considerably in form and are mostly based on empirical regression, while the load-slip behavior of PBL connectors without end-bearing effect has not been systematically studied.
Accordingly, 14 groups comprising 42 push-out specimens were designed and tested in this study. The specimens were configured to eliminate the concrete end-bearing effect. The investigated variables included concrete strength, rib-hole diameter, perforating bar diameter, number of perforating bars, and bar position within the holes. Based on the test results, the shear-transfer mechanism of PBL connectors was analyzed, and the respective roles of concrete dowels and perforating bars were clarified. Furthermore, a shear-capacity equation and a load–slip model were developed and verified against the experimental data. The results provide useful experimental evidence and analytical support for the refined design and numerical analysis of PBL connectors in steel–concrete composite beams.
Experimental investigation
Design of specimens
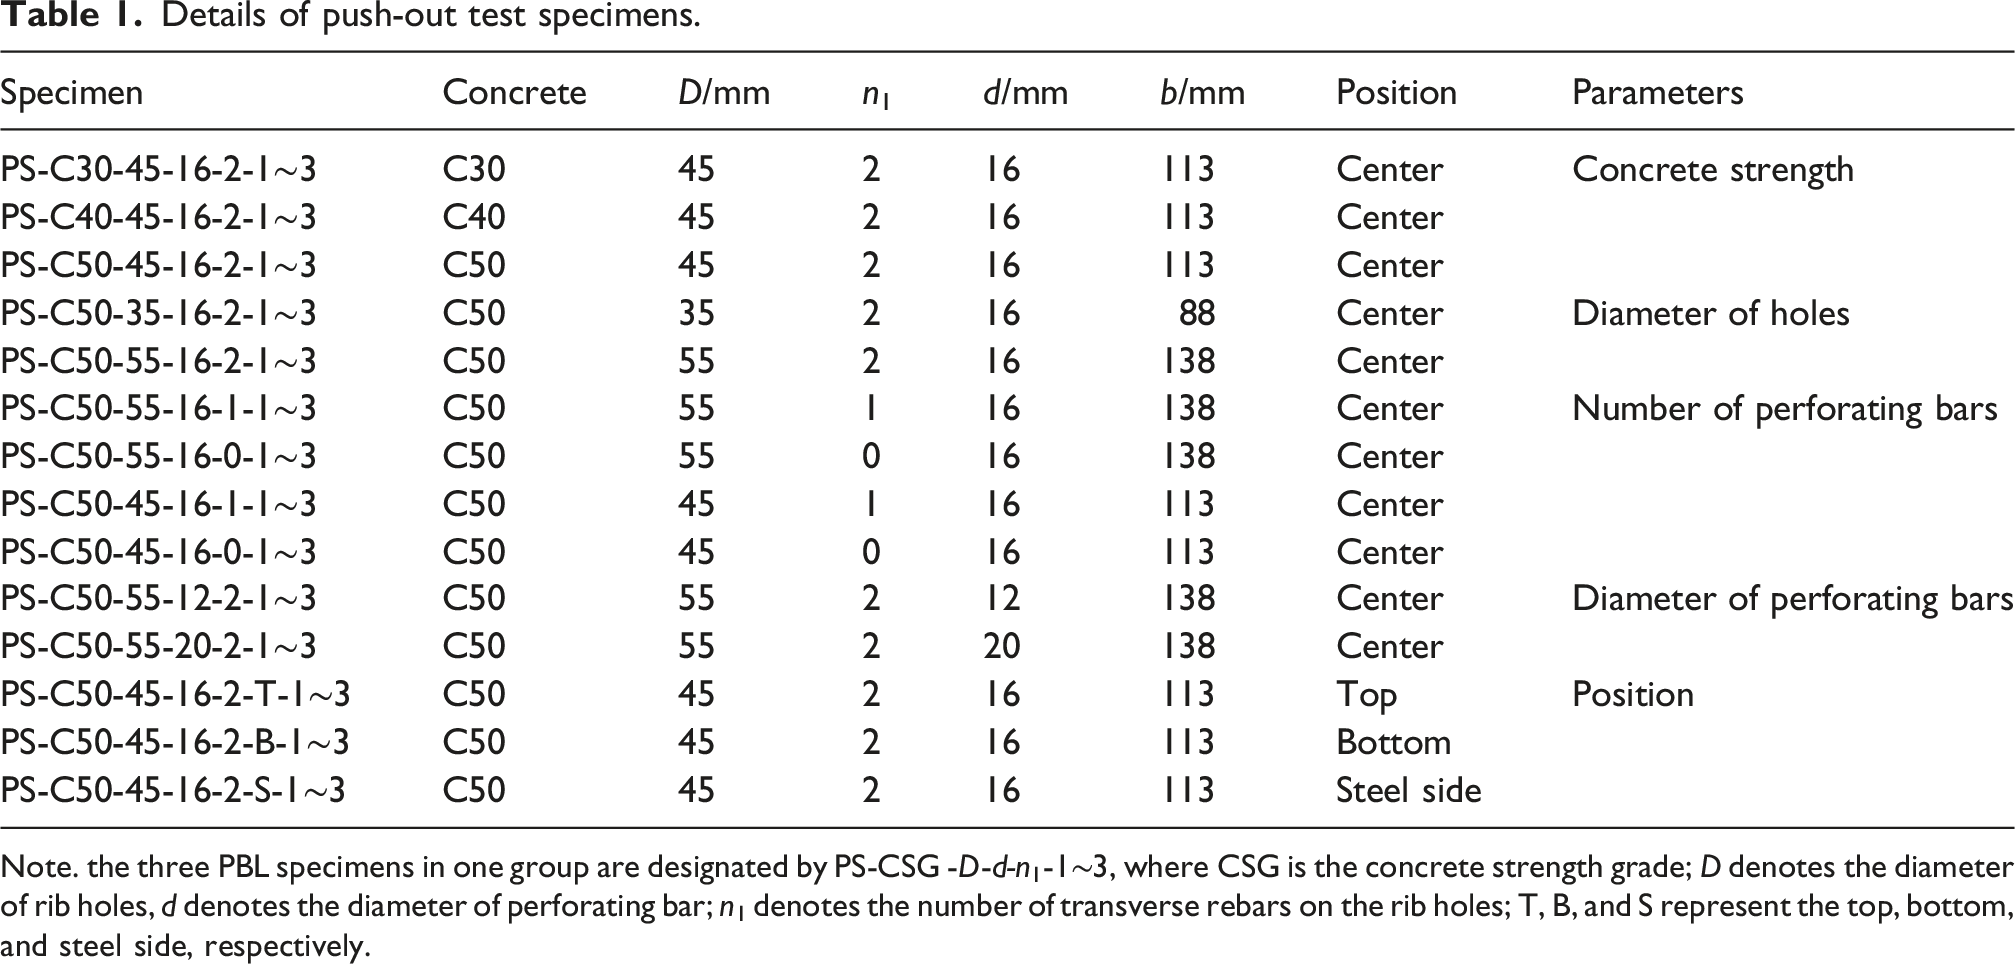
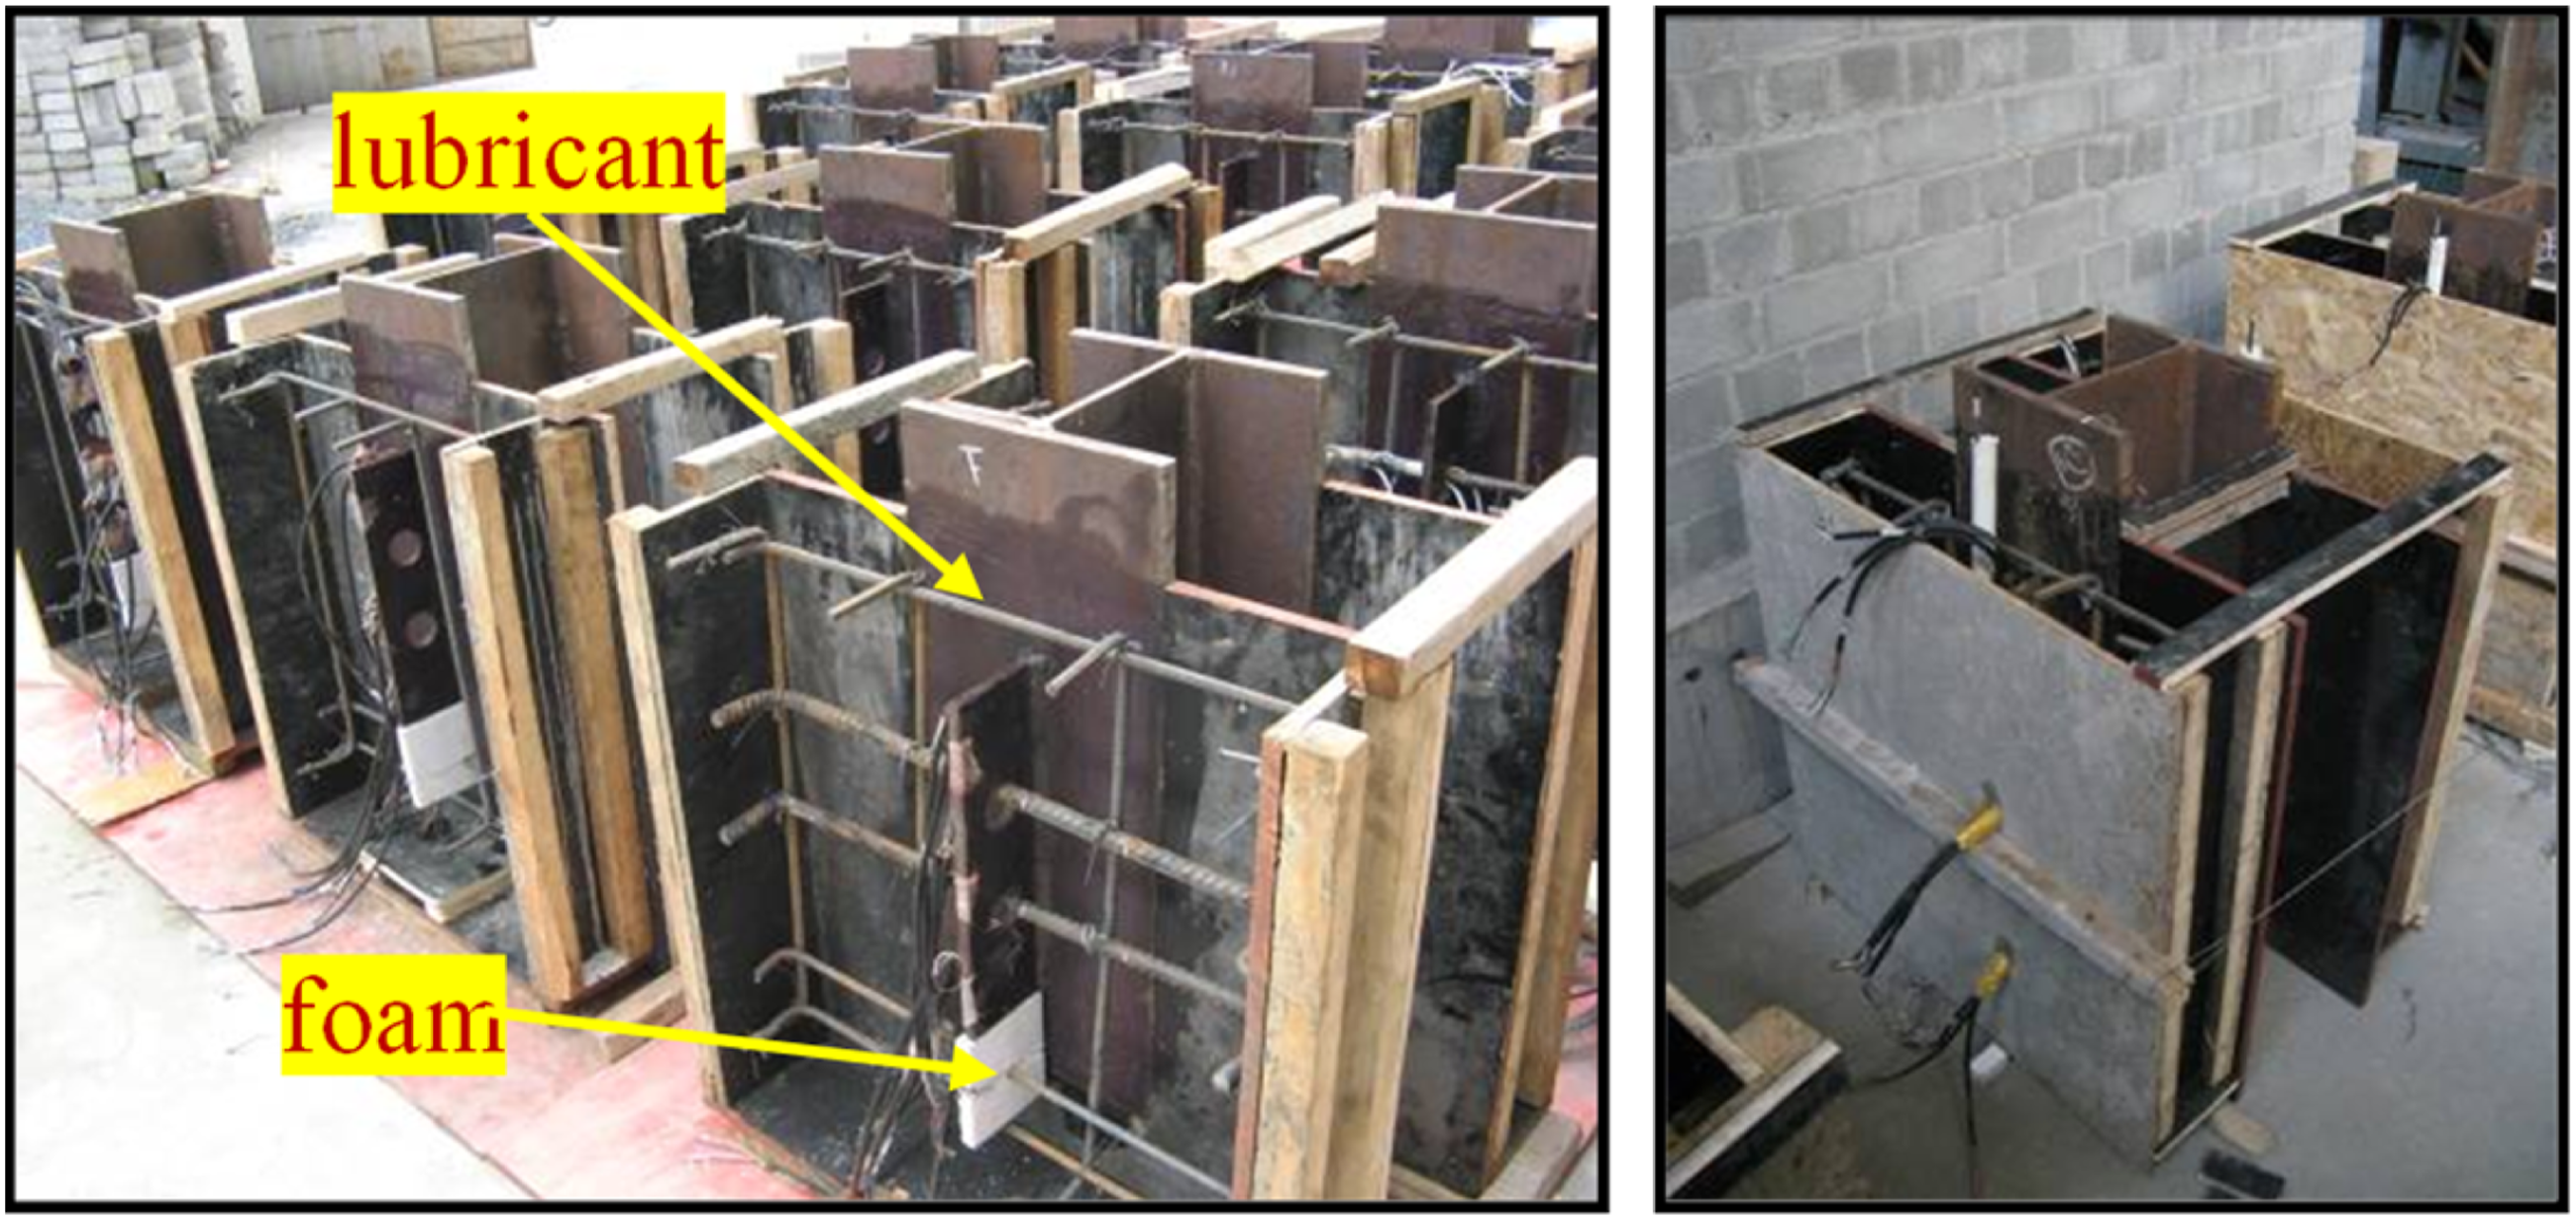
A total number of 42 push-out specimens, divided into 14 sets, were designed, produced, and tested in this study. Each group included three identical samples, as illustrated in Figure 1, and the corresponding design parameters are presented in Table 1. The test variables were the concrete compressive strength (C30, C40, and C50), the diameter of holes (35, 45, and 55 mm), the diameter of perforating bars (12, 16, and 20 mm), the number of transverse perforating bar (2, 1, and 0), and the position of perforating bar within the rib hole (top, center, bottom, and near the steel flange). Each push-out specimen comprised two concrete slabs with dimensions of 600 mm × 685 mm × 150 mm (width × height × thickness) that were connected to a 650 mm-long steel beam having an H-shaped cross-section of 260 mm × 260 mm × 10 mm × 17.5 mm (height × width × web × flange thickness). The PBL plate measured 350 mm in height, 150 mm in width, and 12 mm in thickness. In order to prevent any interaction between adjacent holes that might affect the shear response, the hole spacing was set to 2.5 times the hole diameter, following the recommendation in previous studies (Oguejiofor and Hosain, 1994). Specifically, a layer of lubricant was applied to the perforated plate to reduce friction between the plate and the concrete. A 120 mm-high foam block with a thickness of 12 mm was positioned at both ends of the ribs to eliminate the influence of concrete end-bearing. The specimen fabrication process is shown in Figure 2. Sketches of push-out specimens. Details of push-out test specimens. Note. the three PBL specimens in one group are designated by PS-CSG -D-d-n1-1∼3, where CSG is the concrete strength grade; D denotes the diameter of rib holes, d denotes the diameter of perforating bar; n1 denotes the number of transverse rebars on the rib holes; T, B, and S represent the top, bottom, and steel side, respectively. Fabrication of push-out specimens.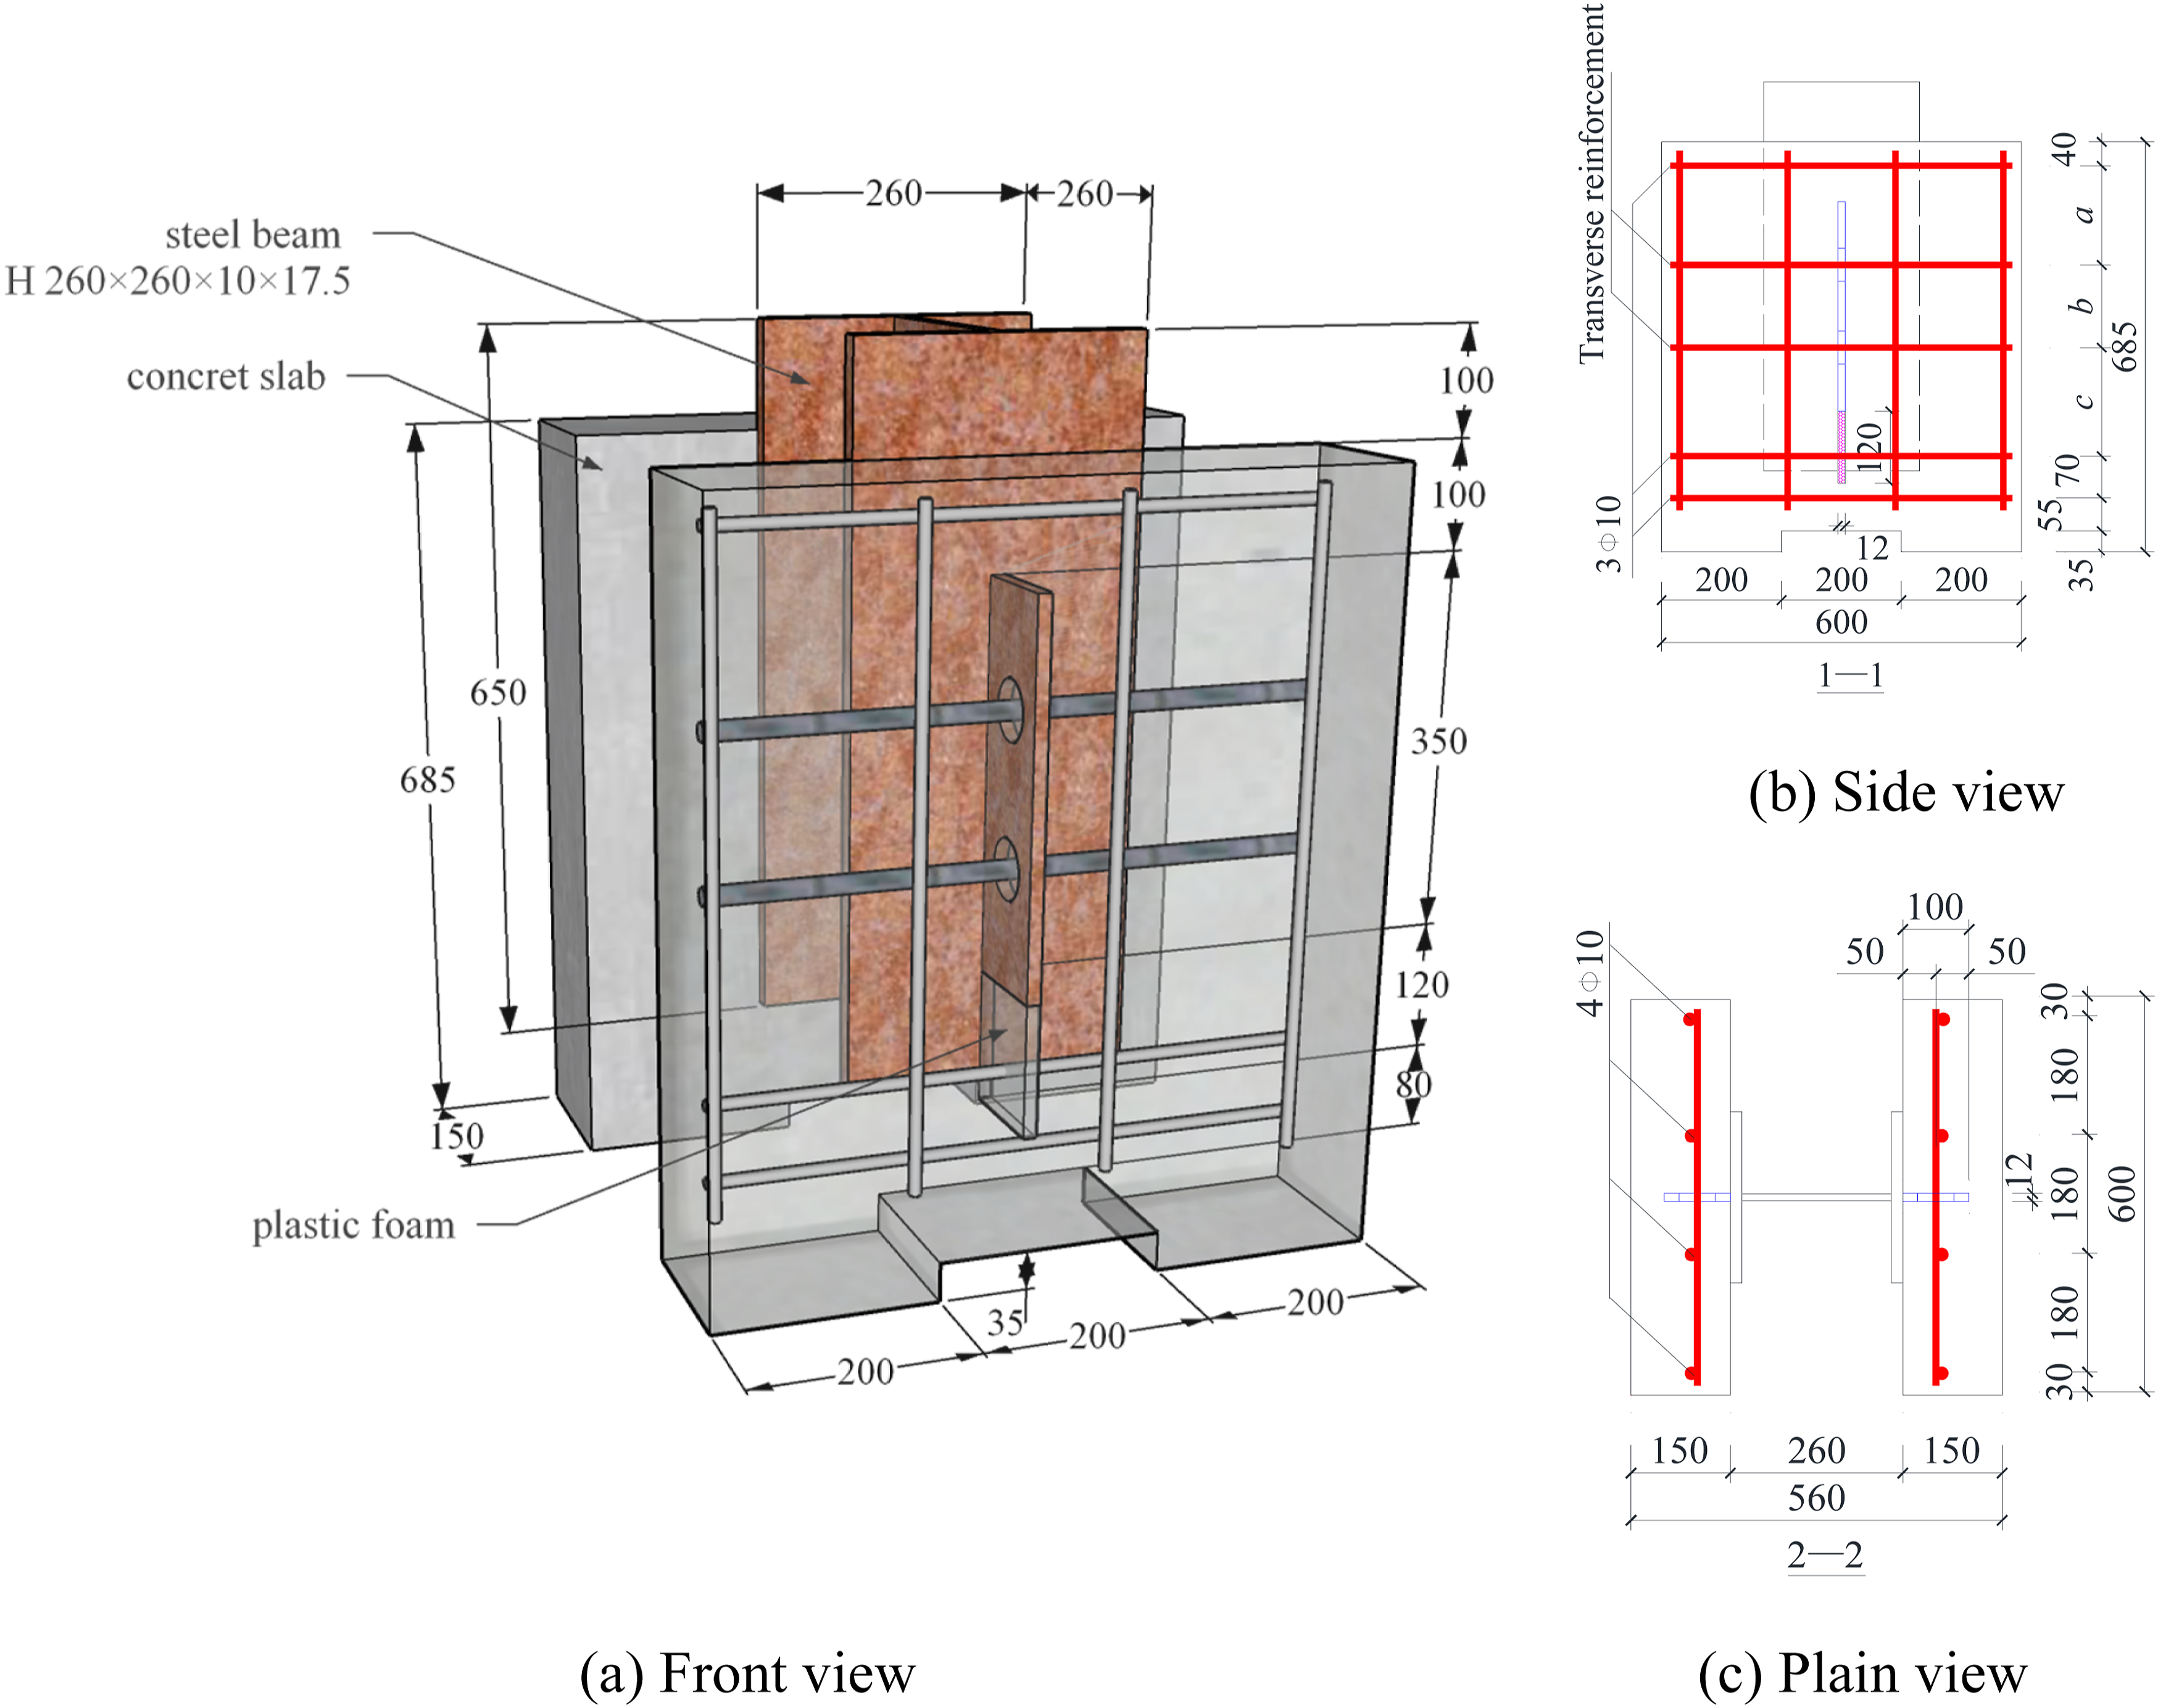
Materials
Mechanical properties of rebar.

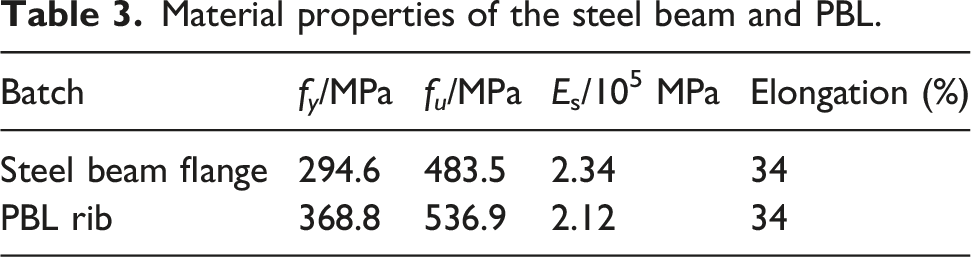
Material properties of the steel beam and PBL.
Mechanical properties of concrete.

Loading and measurements
The test method outlined in Eurocode 4 was employed to assess the shear behavior of the specimens (CEN, 2004). The test setup is depicted in Figure 3. Each specimen was tested under monotonic loading using a hydraulic actuator with 2000 kN capacity. The load was applied to the top of the steel H-beam through a 20 mm-thick steel plate to achieve a uniform pressure distribution. To compensate for minor unevenness on the underside of the concrete slabs and to maintain consistent load transfer across all connectors, a thin layer of fine sand was placed beneath each slab. The specimens were first loaded under force control at a constant rate of 1 kN/s up to approximately 80% of the estimated ultimate load, after which the control mode was switched to displacement control at a speed of 1 mm/min until failure occurred. Test setup.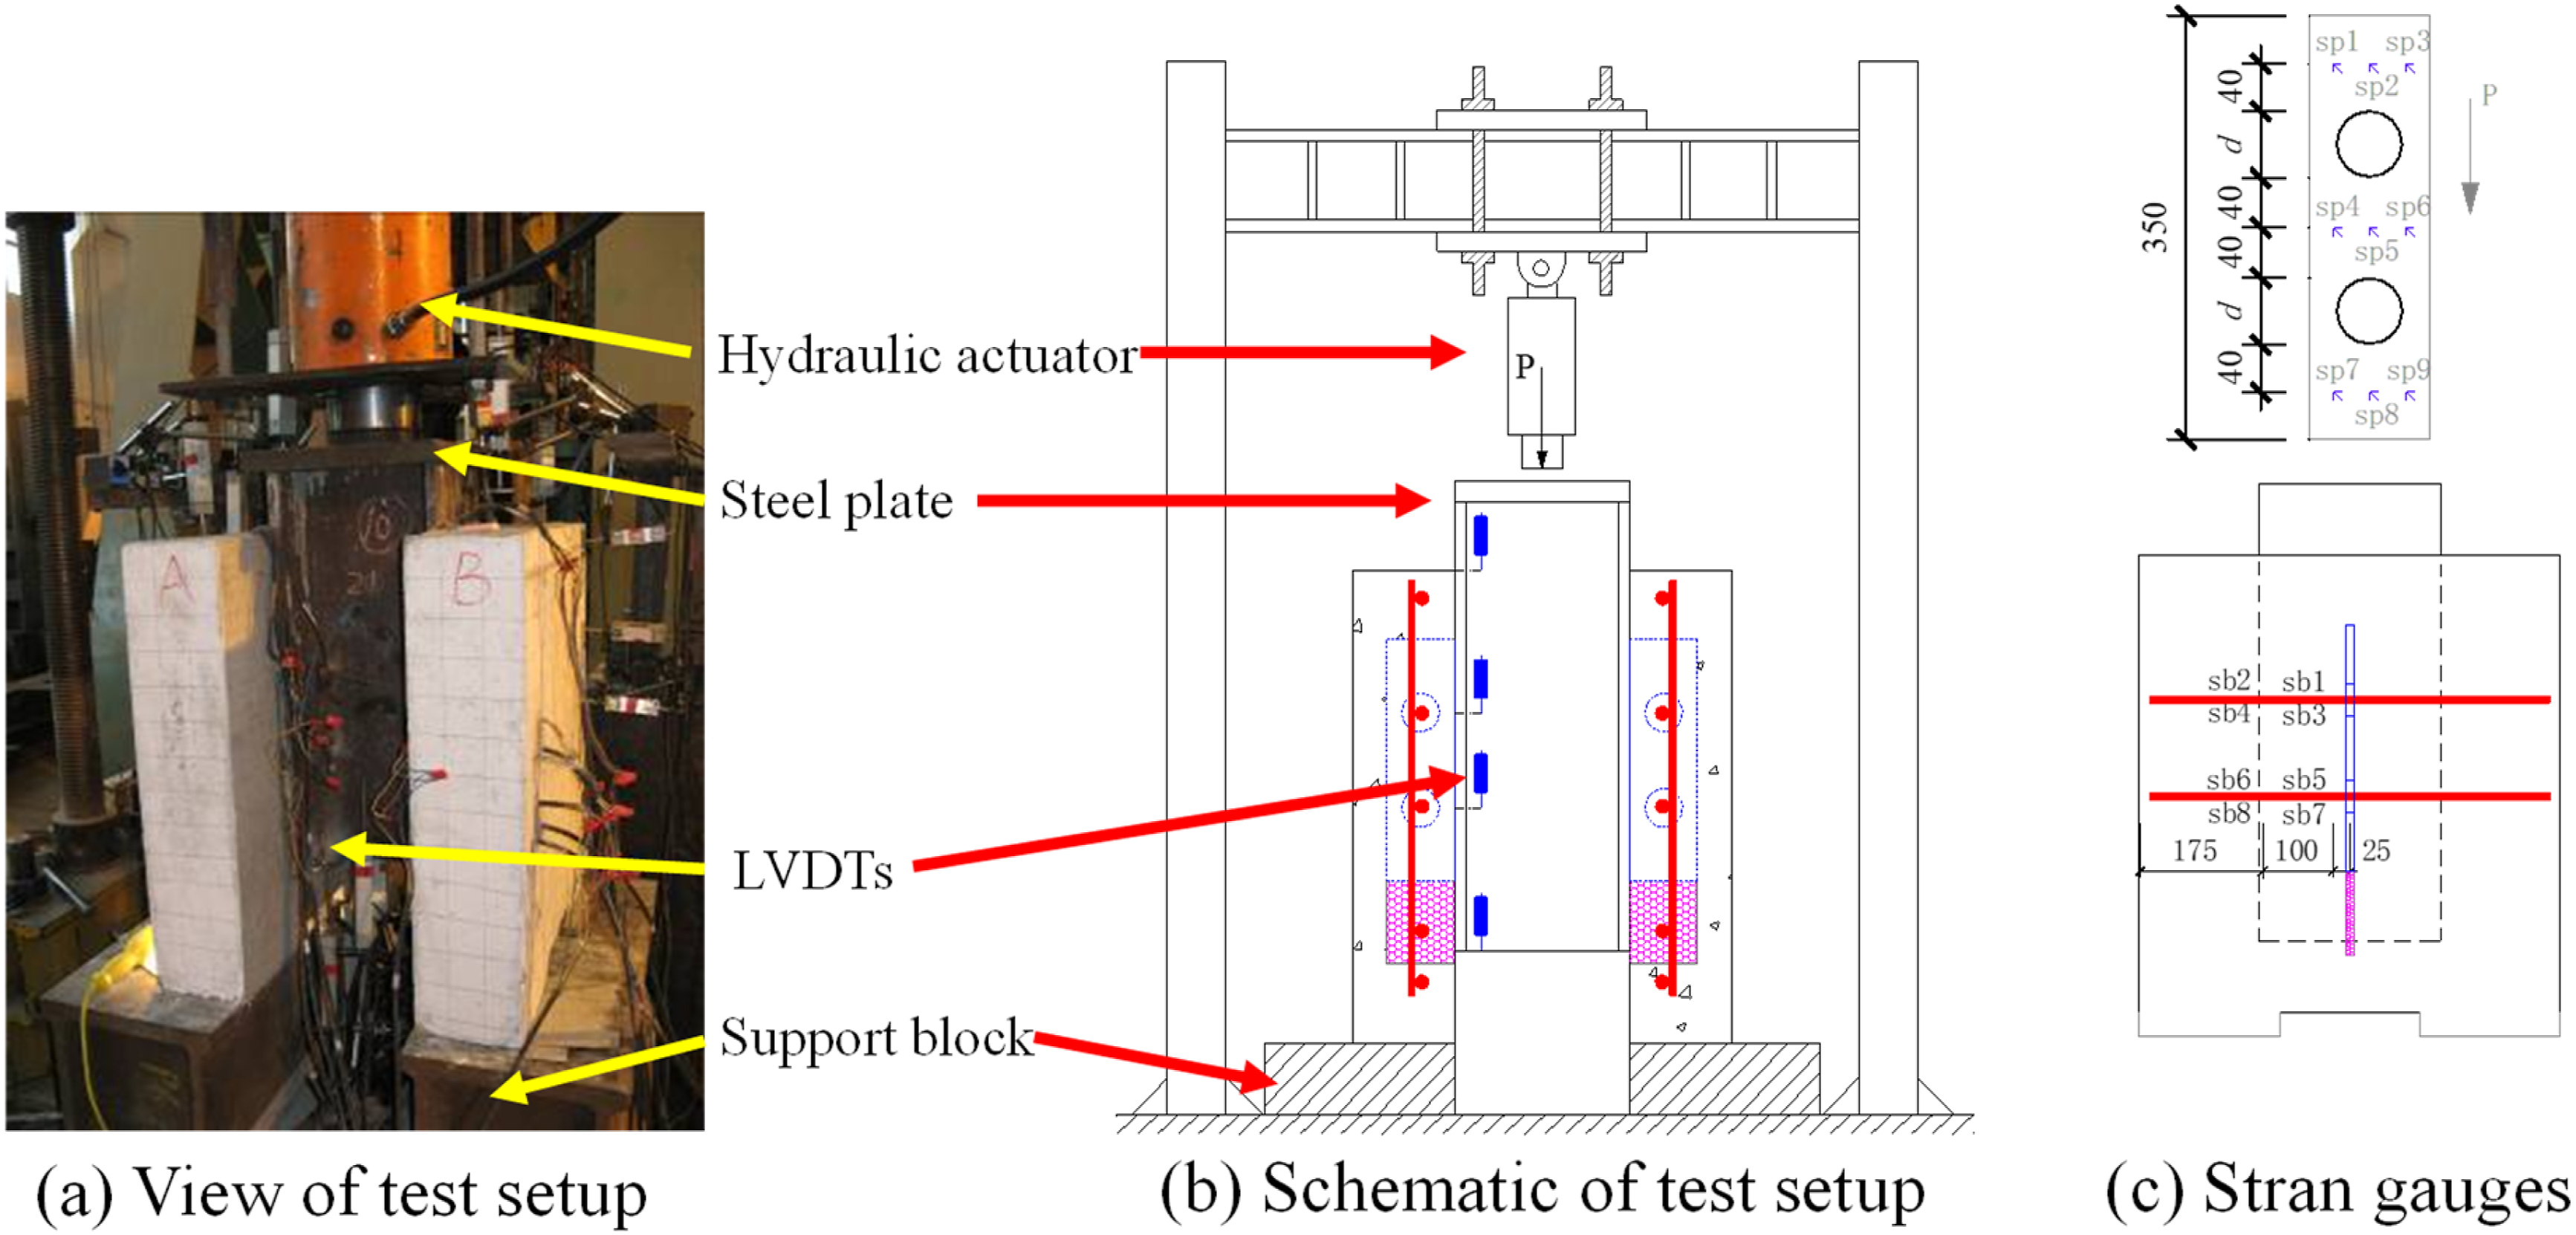
During testing, four linear variable displacement transducers (LVDTs) were positioned along the sides of the concrete slabs to capture the relative displacement between the steel beam and concrete surface, as illustrated in Figure 3(b). Moreover, strain gauges were mounted on the PBL plates and on the perforating bars to monitor the evolution of strain throughout the loading process. Failure patterns of all push-out specimens were carefully observed and analyzed.
Push-out test results and discussion
Failure patterns
Two distinct failure patterns were identified in the PBLs: (a) splitting failure of the concrete slab and (b) splitting failure with transverse cracks. The detailed characteristics of these failure patterns and the corresponding load-bearing behavior are described below:
For specimens without or with one perforating bar (PS-C50-45-16-1, PS-C50-45-16-0, PS-C50-55-16-1, and PS-C50-55-16-0), concrete slab splitting failure was observed as illustrated in Figure 4(a). As loading progressed, the first visible cracks appeared near the base of the perforated rib and gradually propagated along the surface of the concrete slab. The load-carrying capacity of the specimen began to decline after the cracks appeared on the outer face of the concrete slab. Moreover, the concrete dowels inside the rib hole were sheared off, as illustrated in Figure 4(a). Failure pattern of specimens with a single PBL.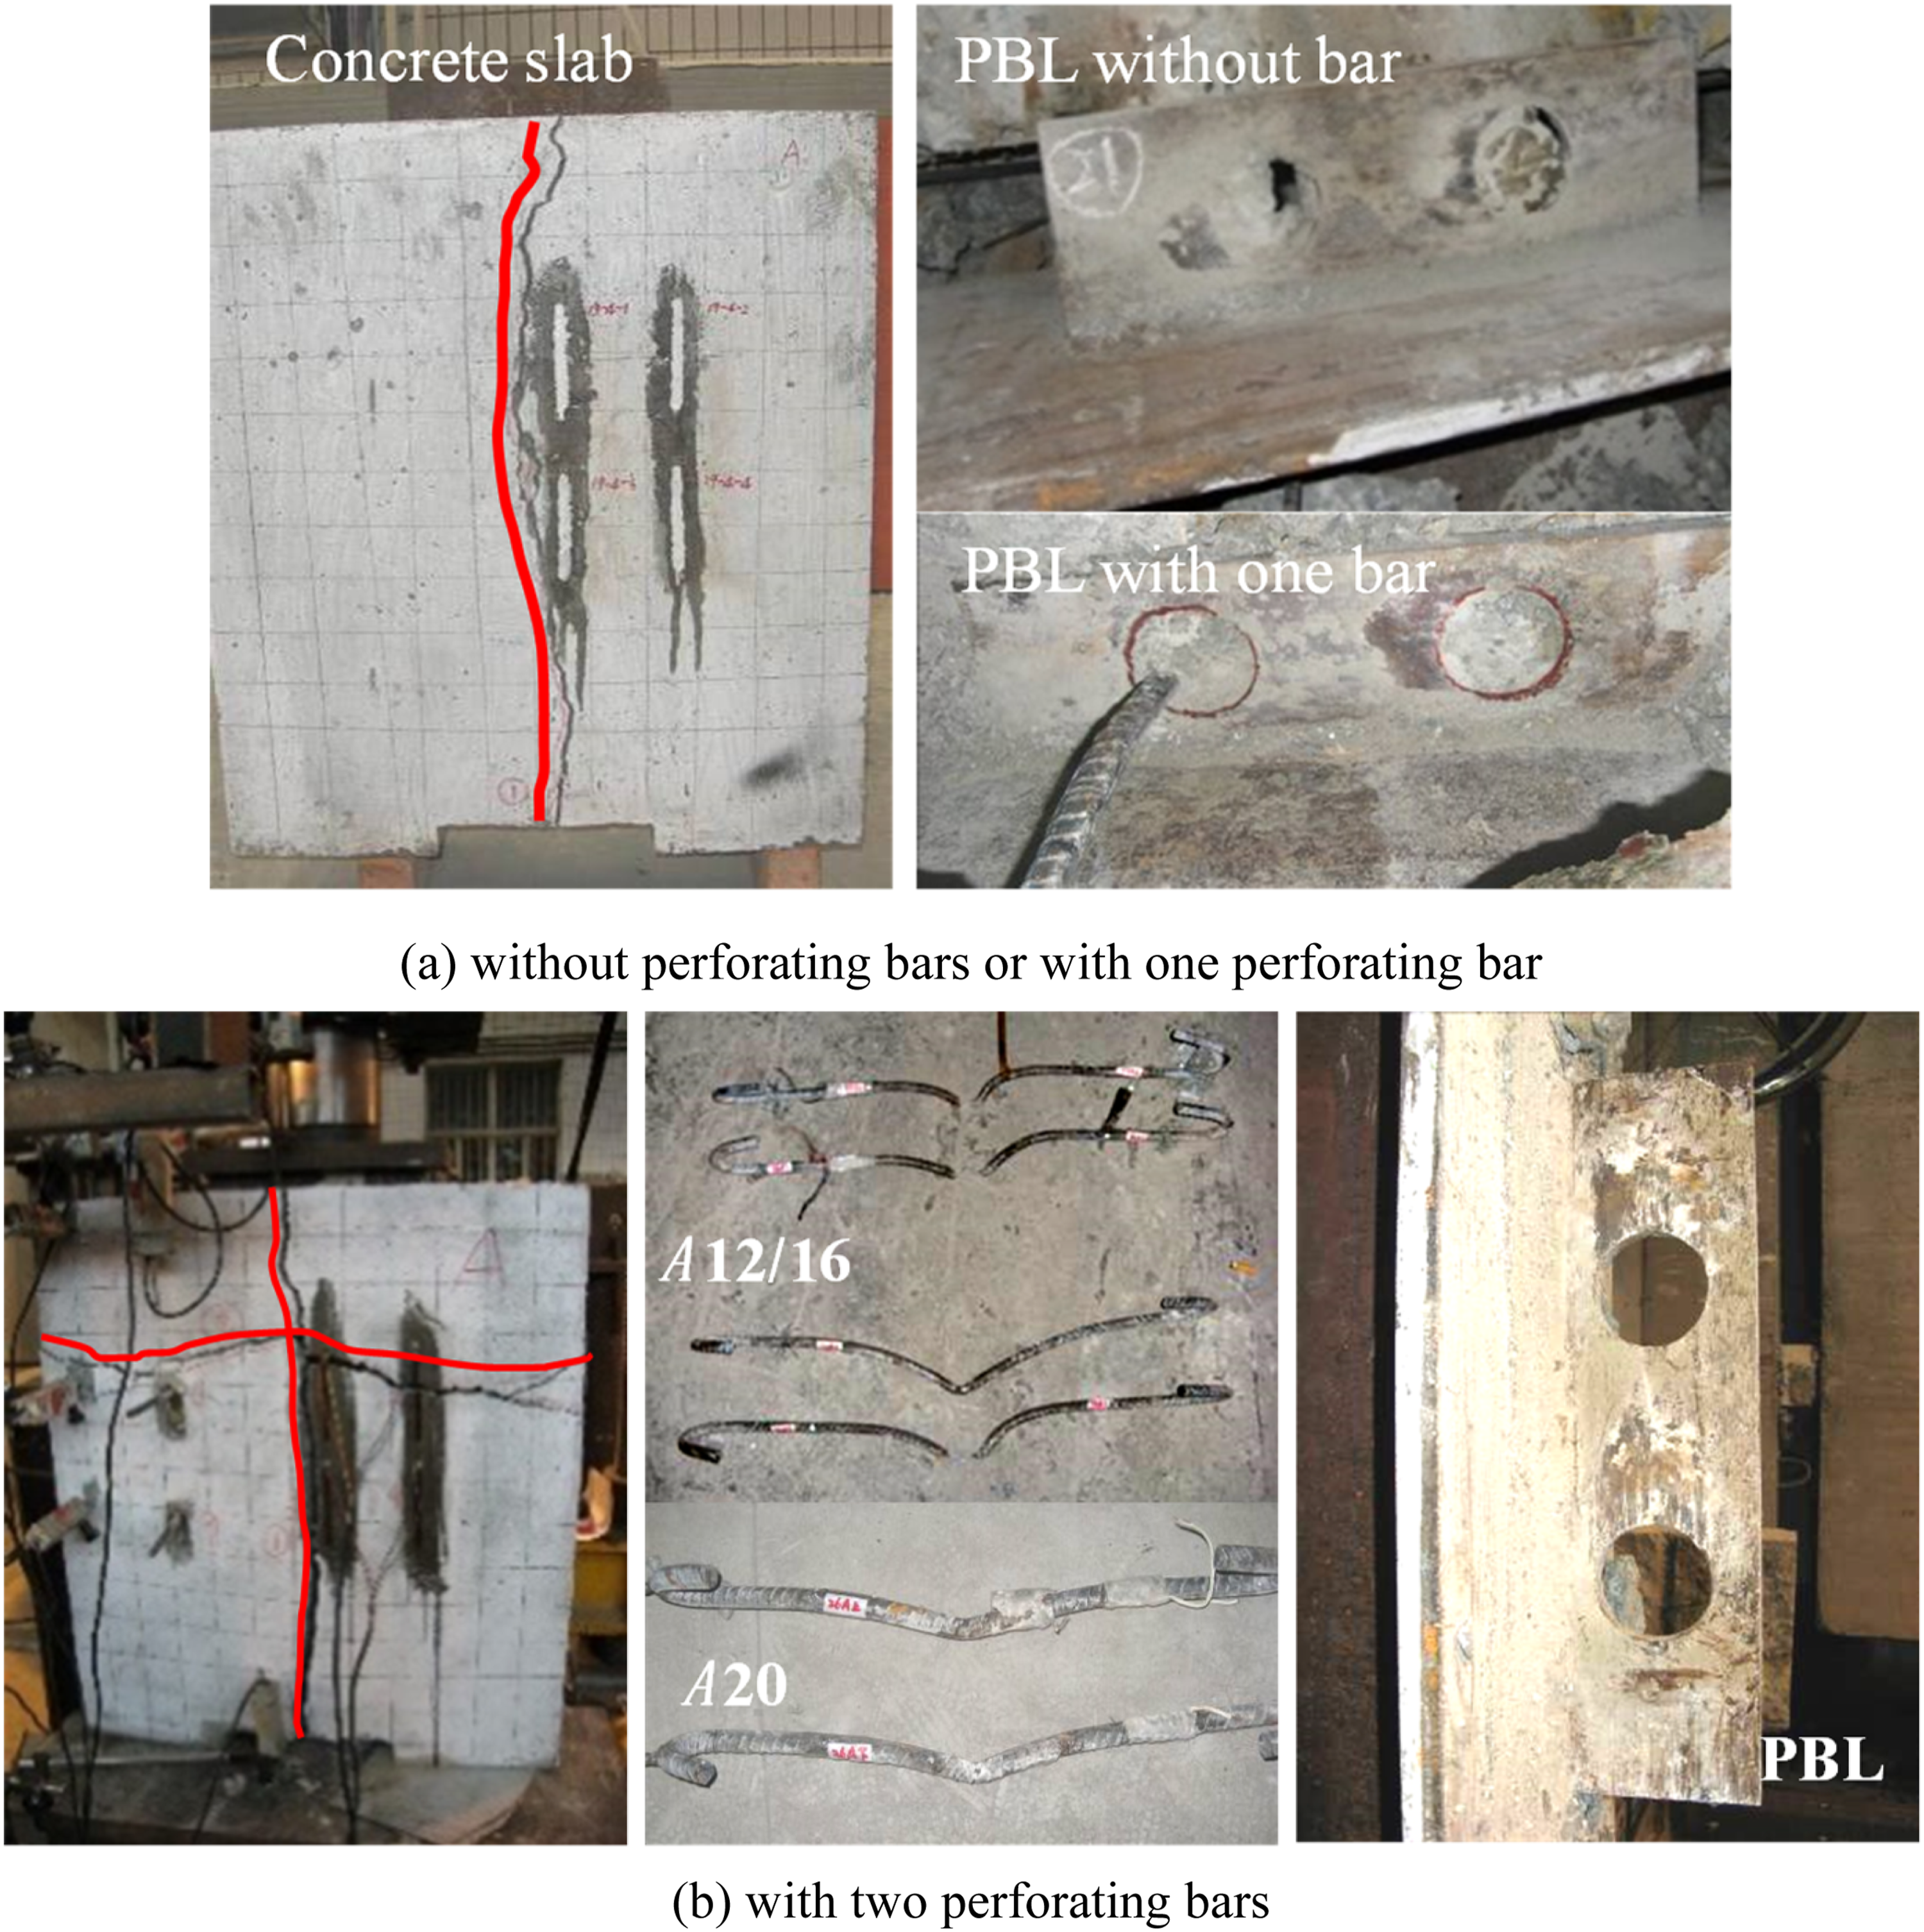
The specimens reinforced with two transverse perforating bars failed by concrete slab splitting, which was associated with evident transverse cracking and either yielding or shear rupture of the perforating bars. Severe cracking developed along the slab surface, and transverse cracks appeared near the upper hole region owing to the substantial deformation of the perforating reinforcement, as illustrated in Figure 4(b). When the connectors reached their ultimate load, the recorded strains in the perforating bars near the rib holes surpassed their respective yield values - 2082 με for the 12 mm bars and 1827 με for the 16 mm bars. In contrast, for specimens with 20 mm-diameter perforating bars, the perforating bars did not yield. It should be mentioned that all PBLs were enacted and did not reach their yield strain when connectors failed, which is in line with other literature (Valente and Cruz, 2004).
Load versus slip curves
Summary of push-out test results.
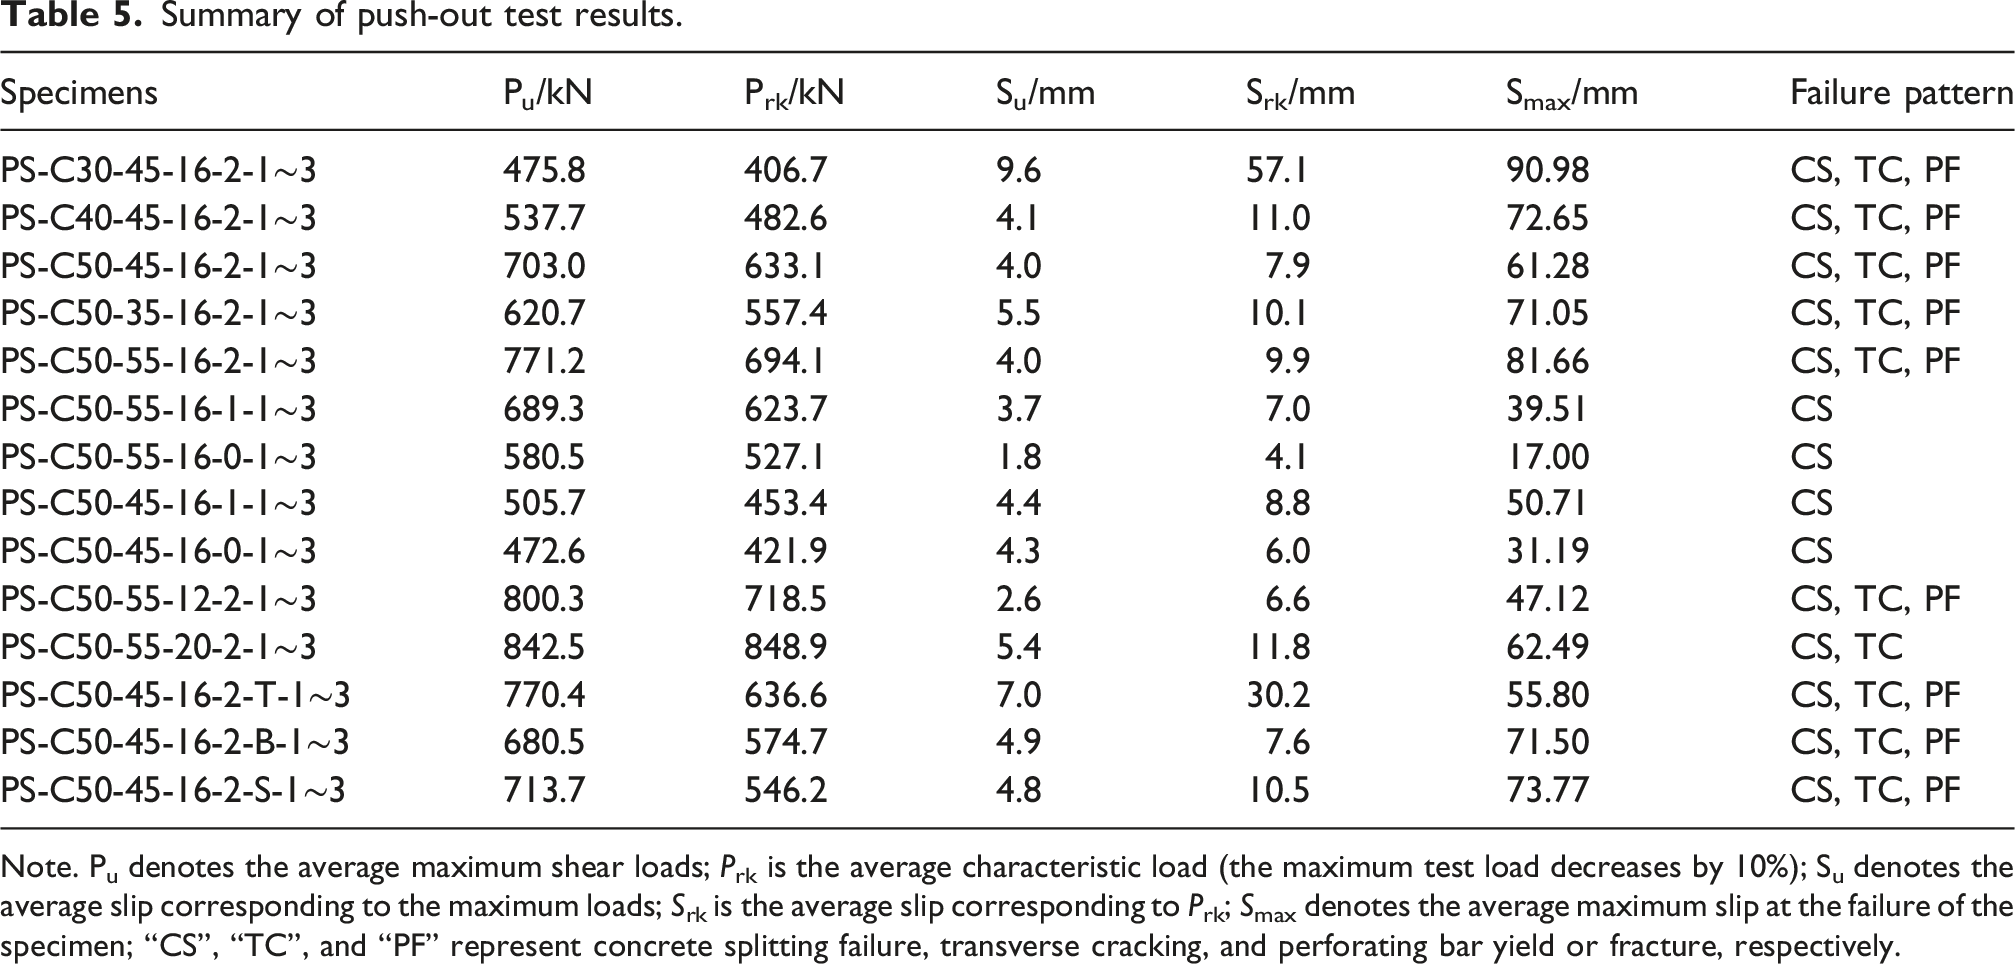
Note. Pu denotes the average maximum shear loads; Prk is the average characteristic load (the maximum test load decreases by 10%); Su denotes the average slip corresponding to the maximum loads; Srk is the average slip corresponding to Prk; Smax denotes the average maximum slip at the failure of the specimen; “CS”, “TC”, and “PF” represent concrete splitting failure, transverse cracking, and perforating bar yield or fracture, respectively.
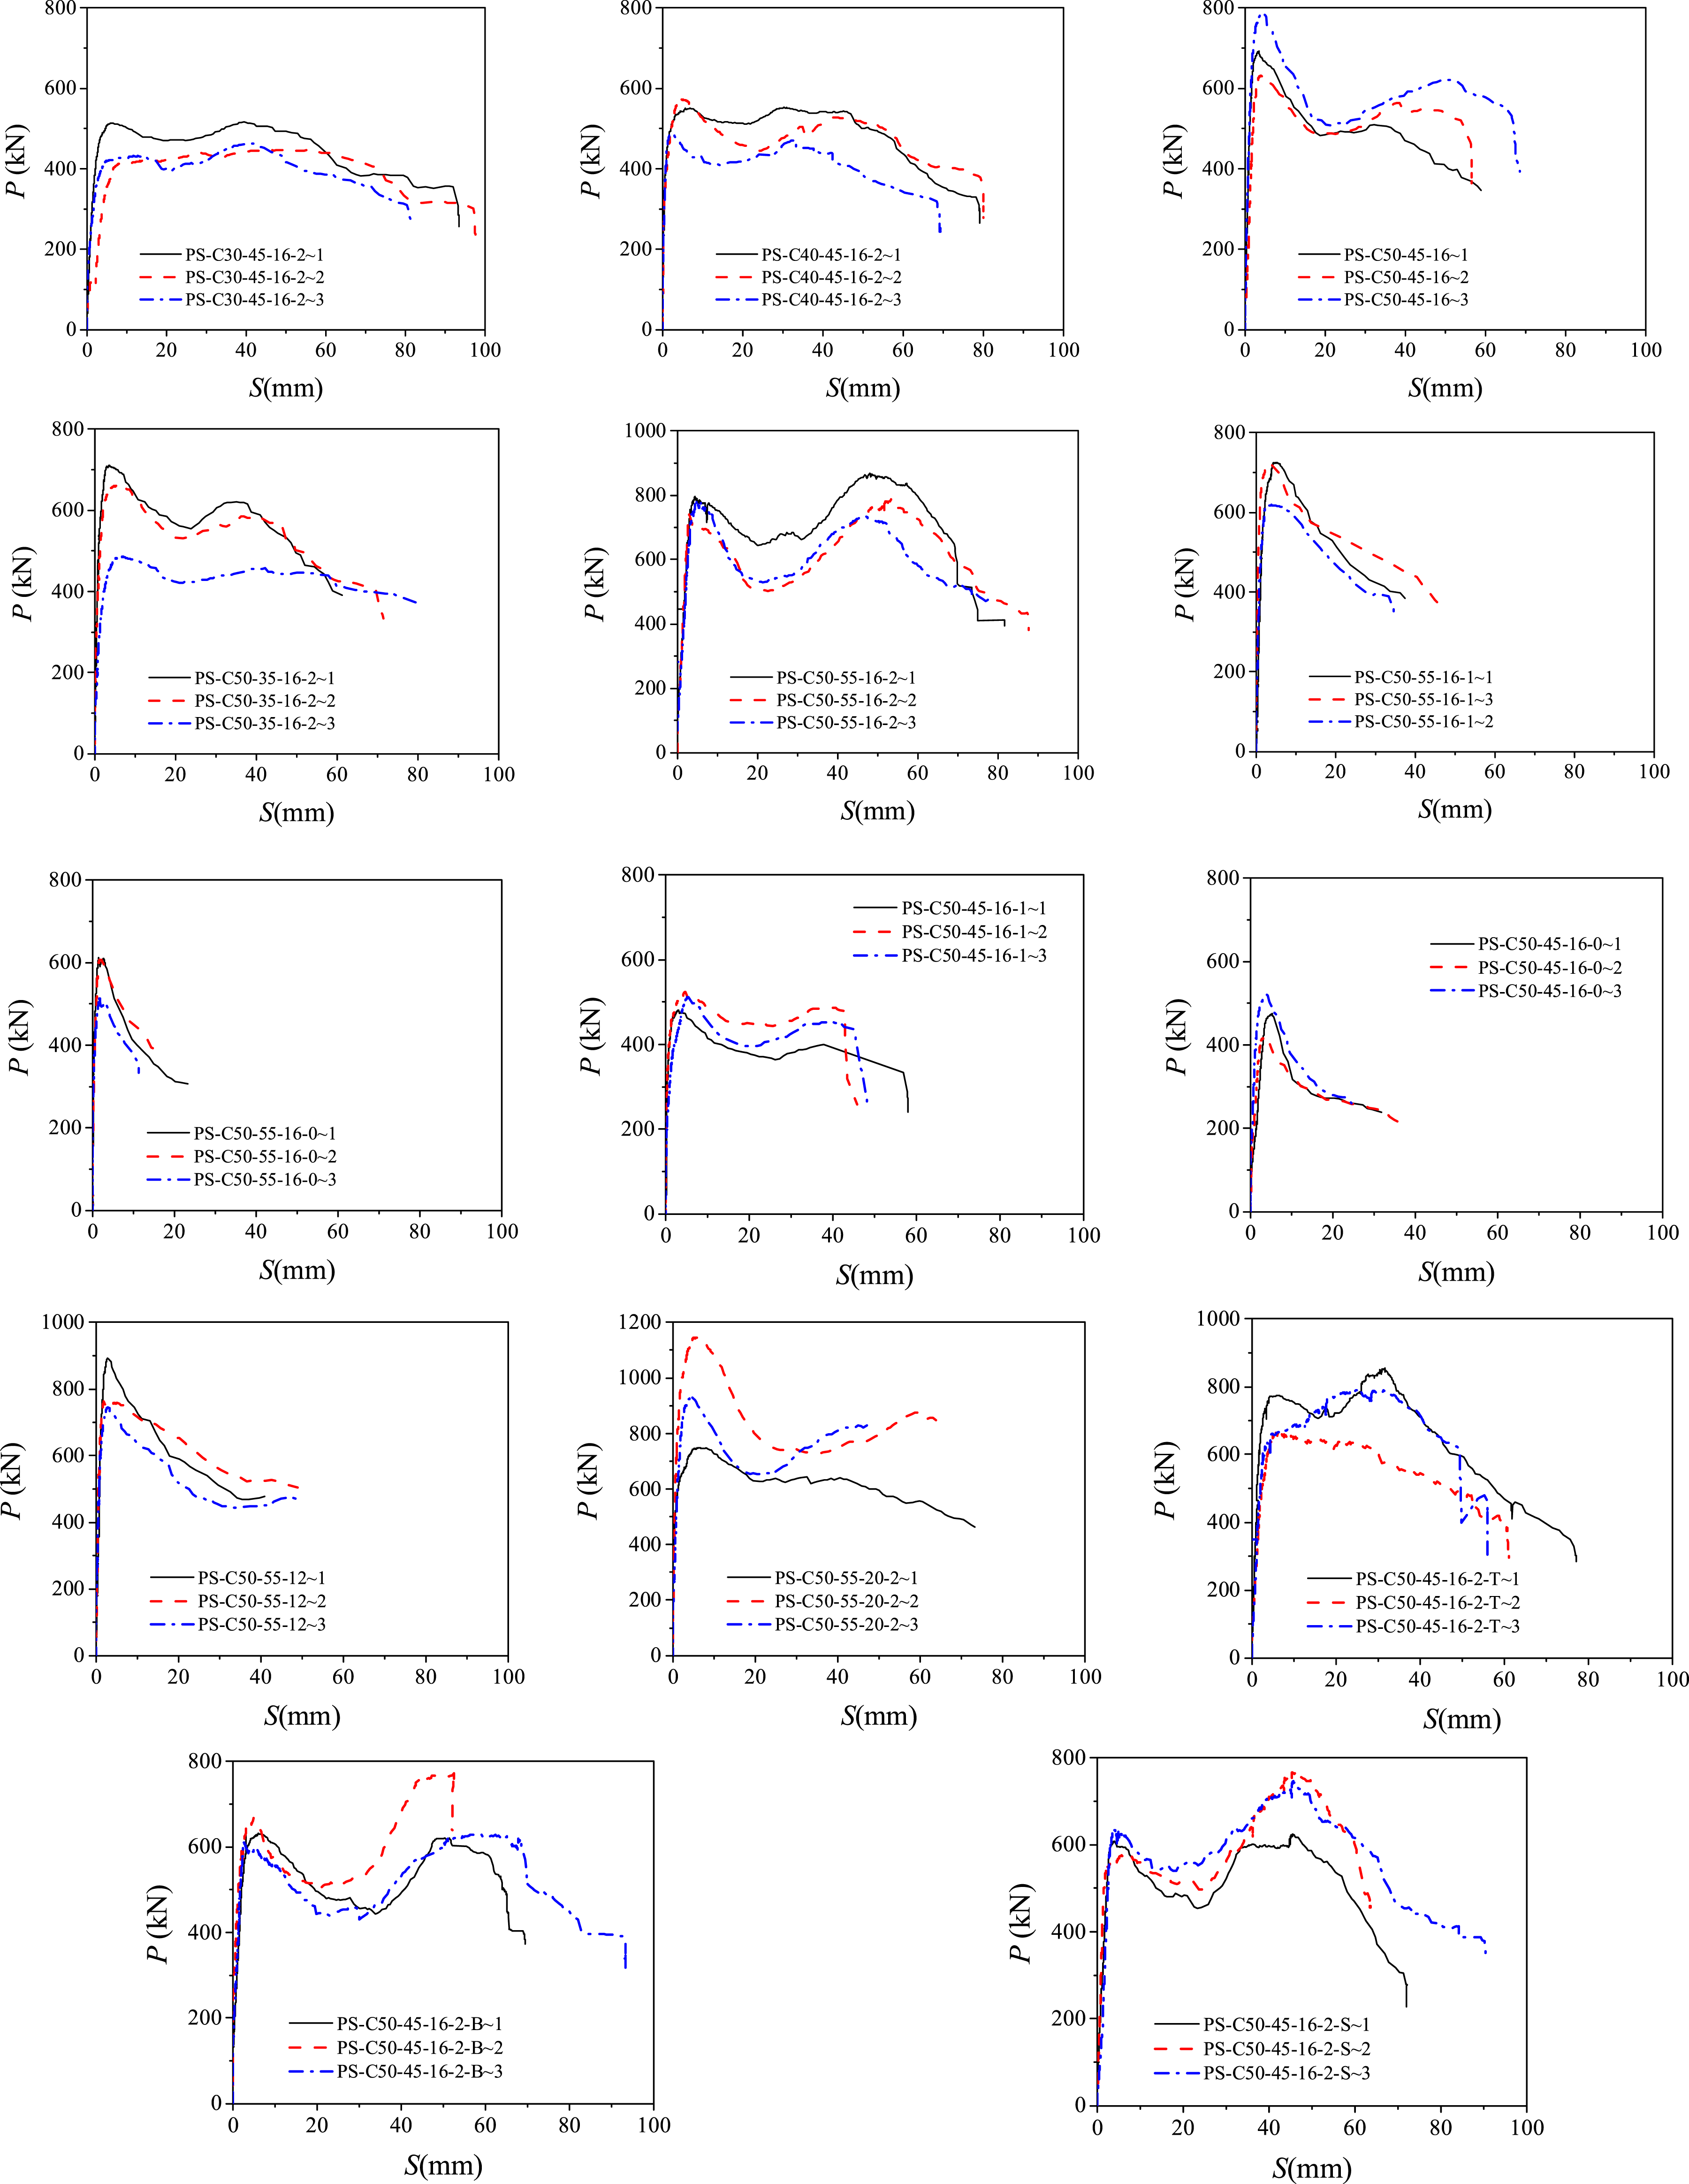
P-S curves for all specimens.
Elastic ascending phase: the applied load increased linearly with the slip, and the PBLs exhibited large shear stiffness with small slips in this stage. During this phase, the strains in the perforating bars remained relatively low, typically below 400 με, indicating that the concrete dowels bore the majority of the applied load.
Plastic ascending phase: the slip increased significantly despite the slowly increasing load, leading to a reduction in the slope of the P-S curve, which indicated a continuous decrease in the shear stiffness of the specimens. The cracks in the concrete slab gradually developed. The slips corresponding to the capacity of the shear connector were 4.04 mm ∼ 9.60 mm and 4.25 mm ∼ 4.41 mm for PBLs with perforating bars, and without perforating bars, respectively. In this phase, the strain within the perforating bars increased significantly with the progressive rise in applied load. Upon reaching the ultimate shear resistance, most of the perforating bars yielded, indicating that the applied load was undertaken mainly by the concrete dowels and the perforating reinforcement.
Descending phase, for PBLs without perforating bars, the applied load decreased rapidly due to the concrete slab splitting failure and the concrete dowels shearing off. While for PBLs with perforating bars, the applied load decreased vibrantly, and the P-S curves may exhibit a second peak. This behavior is attributed to the residual shear force that develops as the perforating bars come into contact with the rib-hole edges once the surrounding concrete dowels have been fully crushed. The applied load descended rapidly due to the perforating bar shearing off and crushing of concrete dowels. It should be noted that the maximum slips of the specimen exceeded 60 mm, which was larger than the 6 mm required for ductile connector in EC4. This indicates that PBLs have good ductility.
Results analysis
Influence of concrete compressive strength
The influence of concrete strength on the shear performance of the PBLs was examined by comparing three groups of specimens (PS-C30-45-16-2, PS-C40-45-16-2, and PS-C50-45-16-2) fabricated with different concrete grades, as illustrated in Figure 6. Influence of concrete strength on shear behavior of PBLs.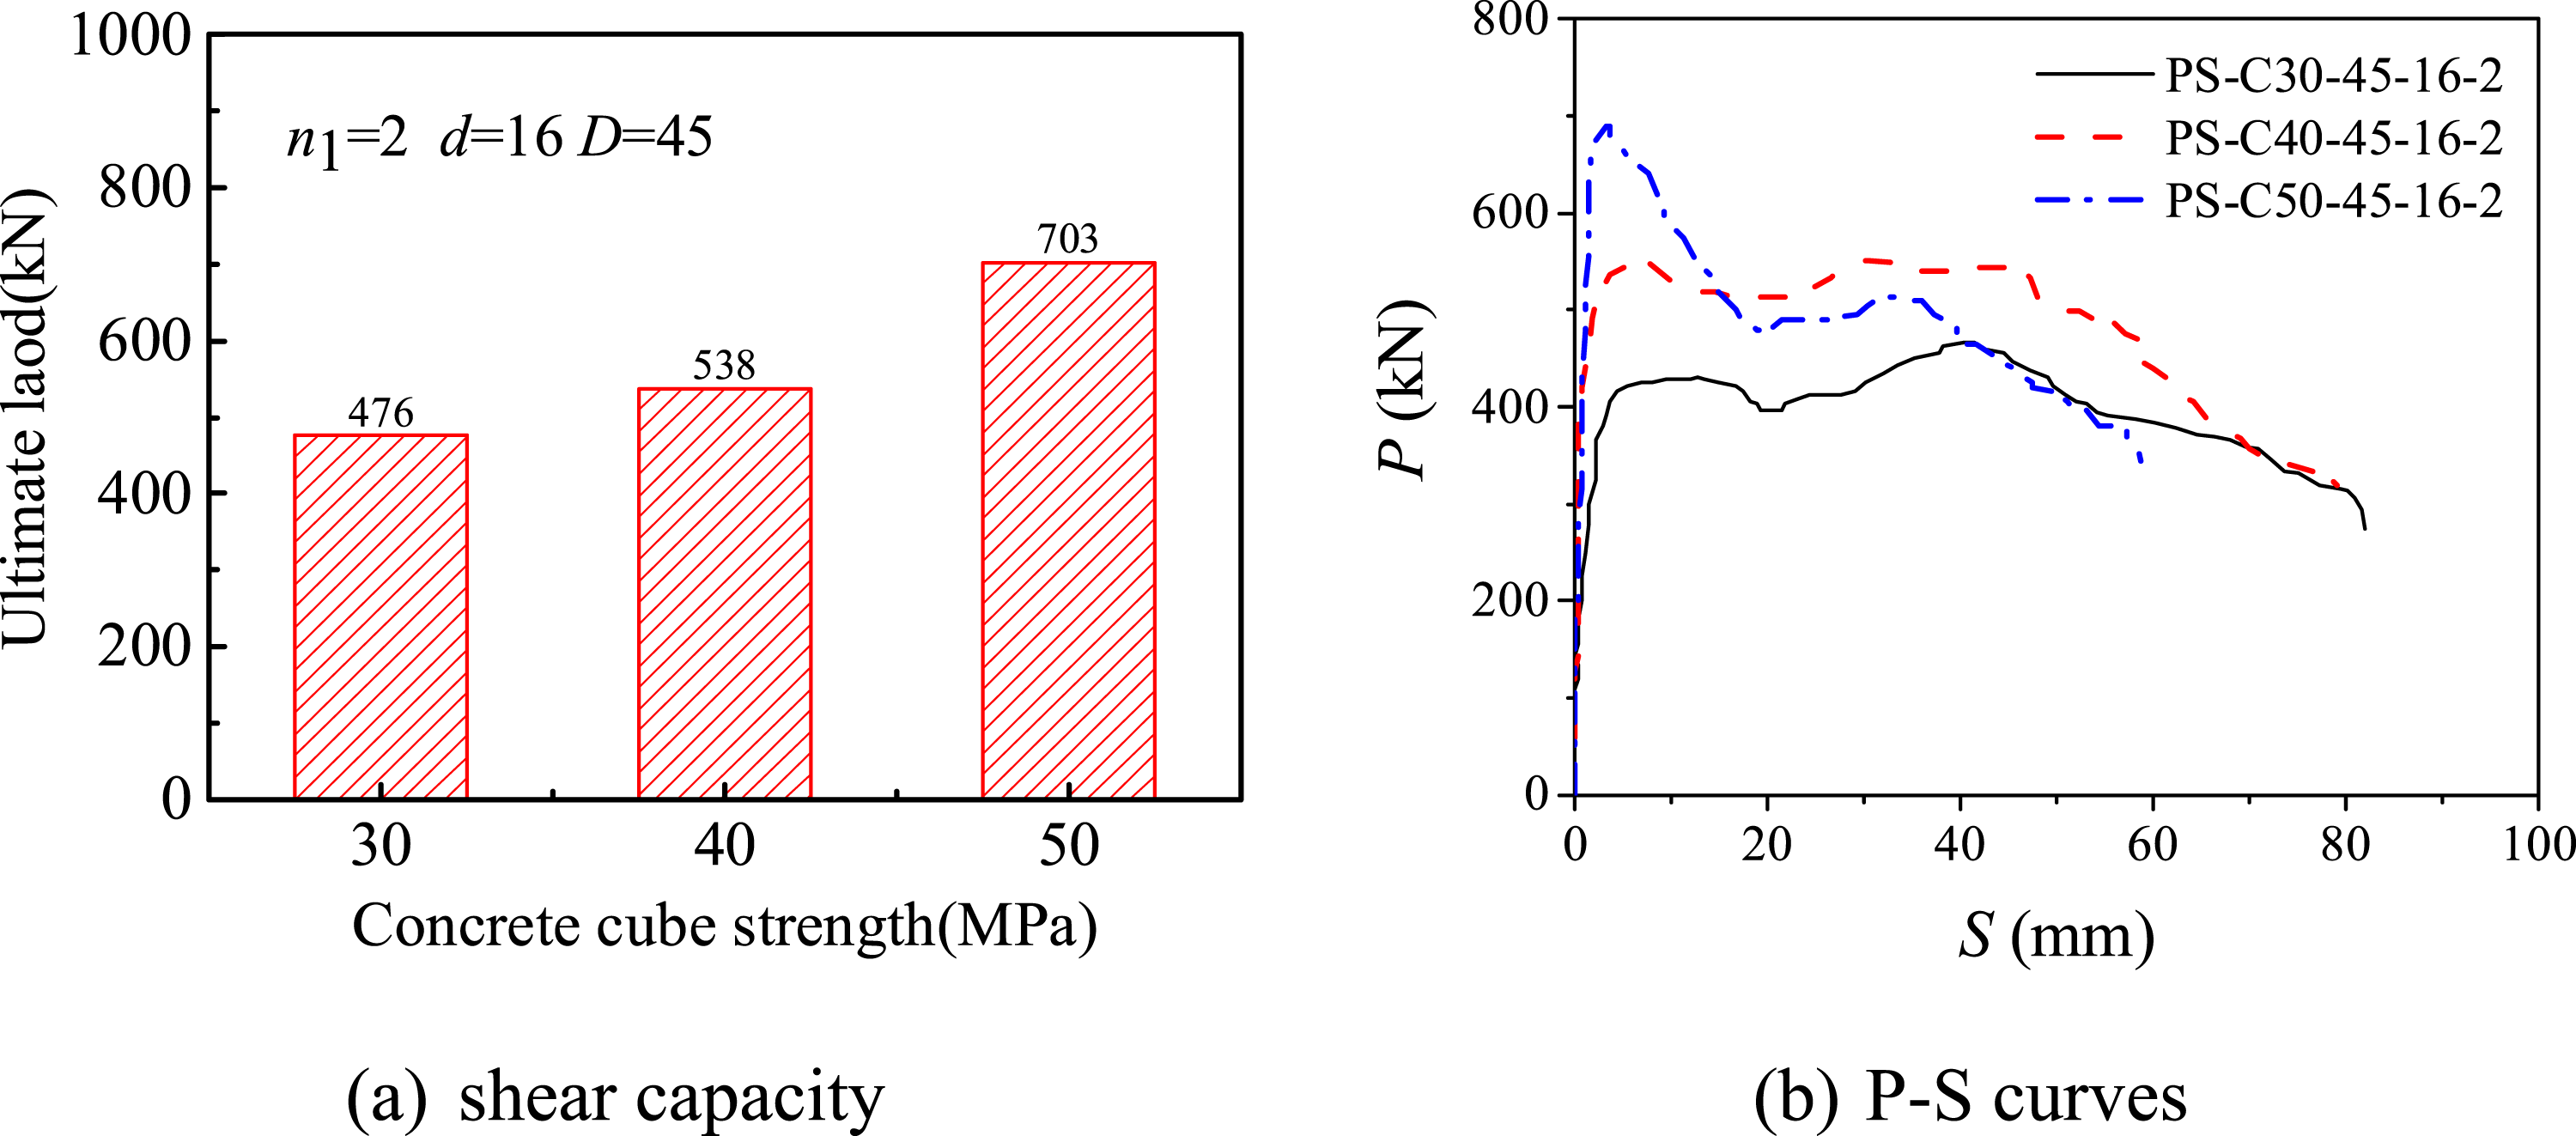
An evident increase in both ultimate shear capacity and overall stiffness was observed with higher concrete strength. When the concrete grade was raised from 30 MPa to 40 MPa and subsequently to 50 MPa, the corresponding shear capacity improved by approximately 13.0% and 47.8%, respectively. This improvement is mainly attributed to the dominant role of the concrete dowels in transferring shear forces. Stronger concrete not only enhances the dowel’s load-carrying ability but also provides a greater elastic modulus, which in turn increases the overall rigidity of the PBL connector. Conversely, the maximum slip associated with the peak load tended to decline as concrete strength increased, likely due to the increased stiffness and reduced deformation of the higher-strength concrete.
Influence of the diameter of holes in PBL ribs
The influence of the diameter of holes in PBL ribs on the ultimate shear capacity and P-S curves is illustrated in Figure 7, which compares the P-S responses and peak loads of specimens PS-C50-35-16-2, PS-C50-45-16-2, and PS-C50-55-16-2. Influence of the rib hole diameter on shear behavior of PBLs.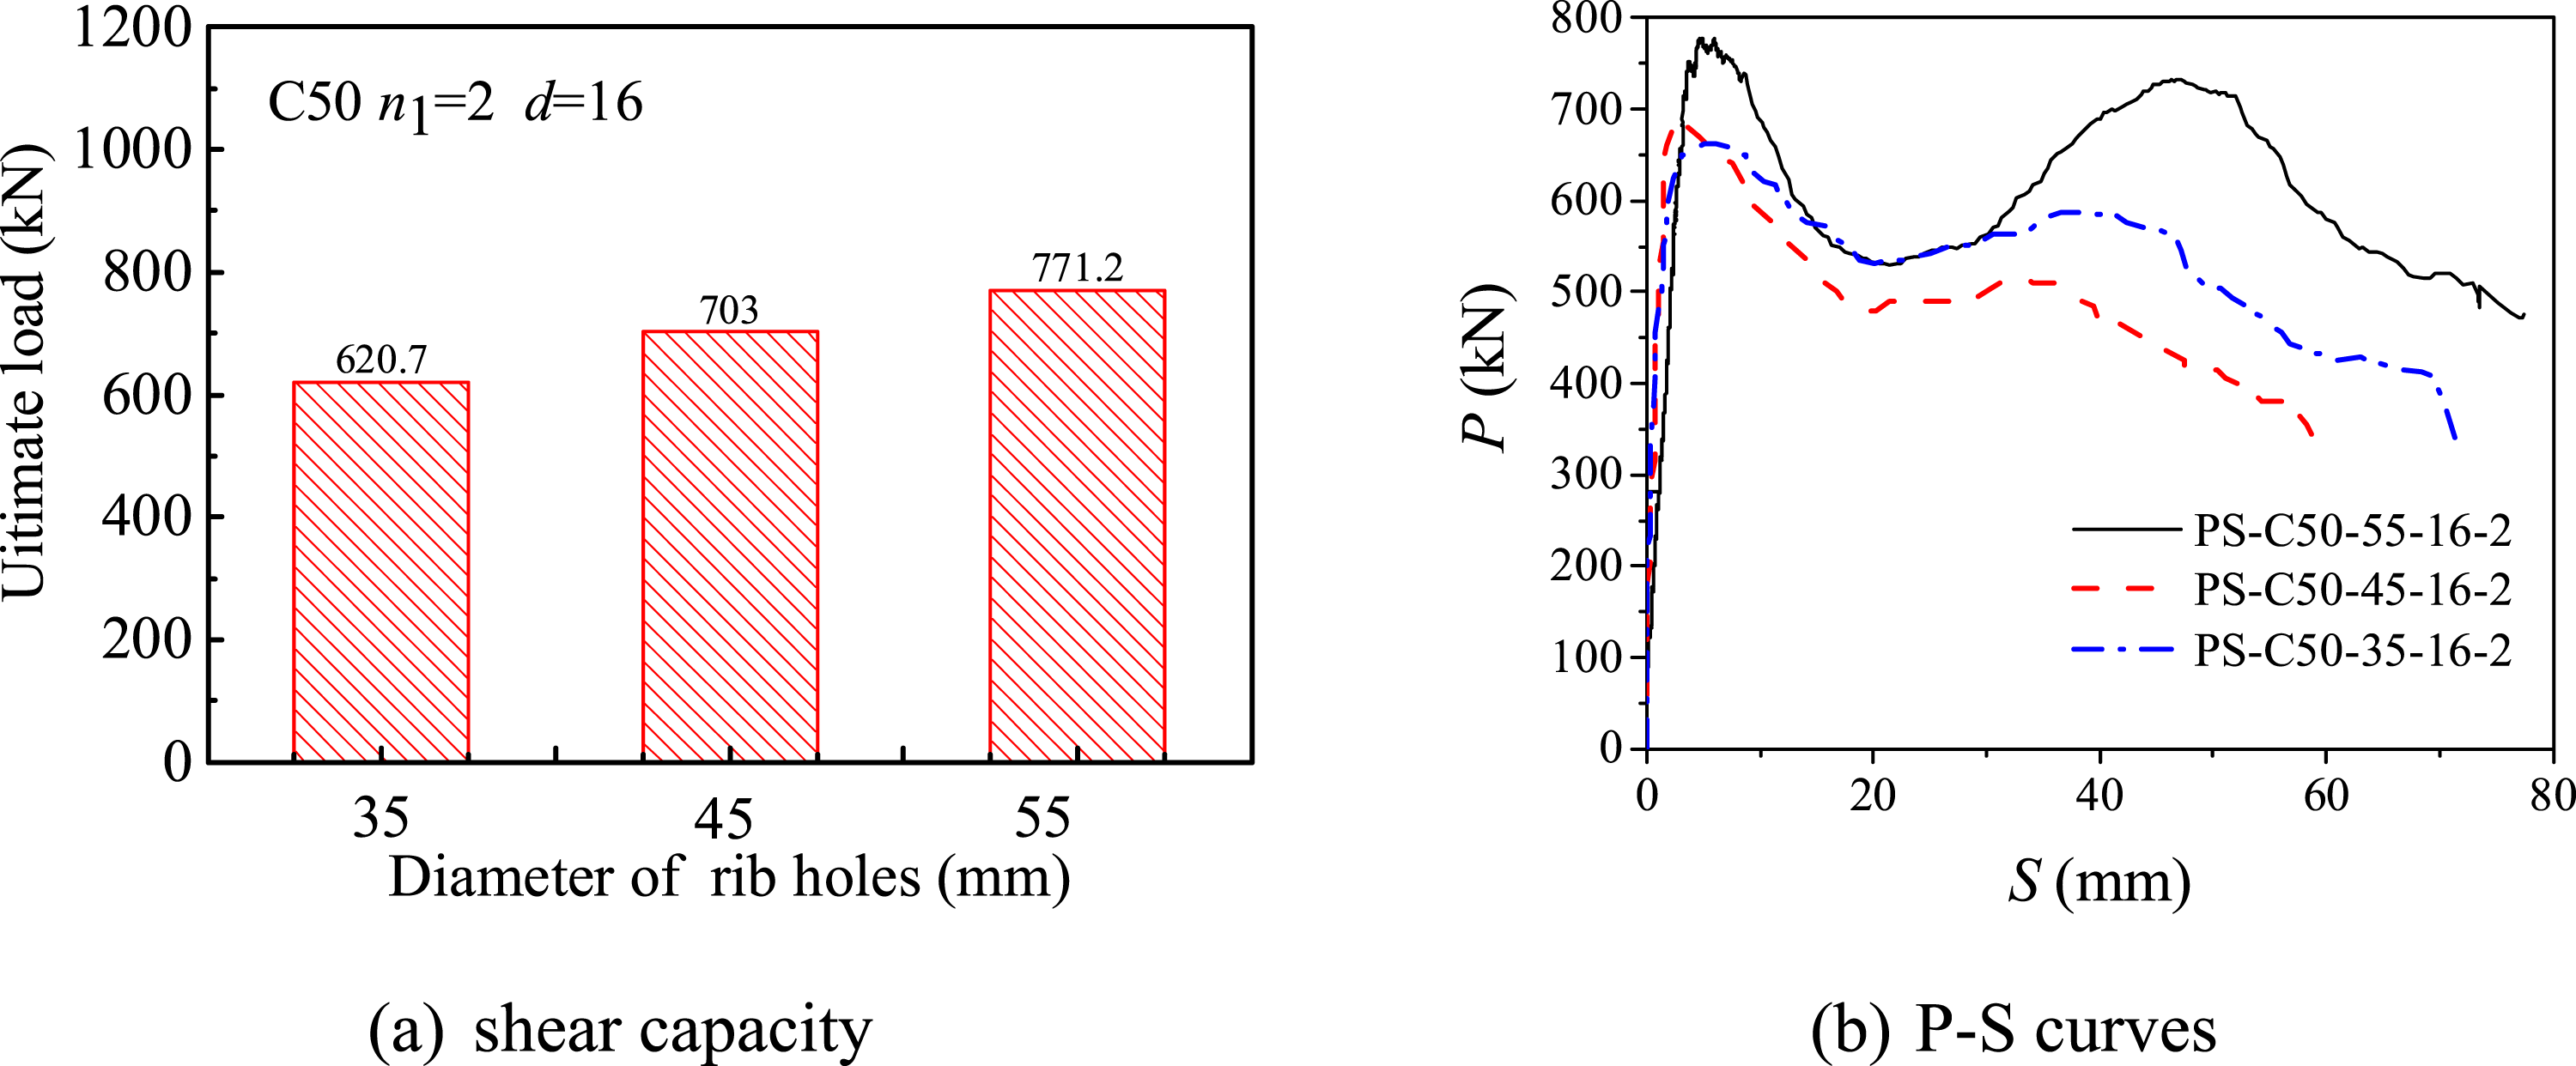
An increase in the rib-hole diameter resulted in a noticeable improvement in the shear capacity of the connectors. Specifically, the specimens with 55 mm and 45 mm holes exhibited ultimate strengths about 24.2% and 13.3% greater than those with 35 mm holes, respectively. This trend indicates that enlarging the hole diameter can significantly improve the overall shear resistance of the PBL connectors.
Increasing the PBL hole diameter, the slips corresponding to the second peak point for the P-S curves of the specimens were increasing. The second peak was due to the direct contact between the perforating bar and rib holes. The slips increased because the distance of the perforating bar to the edge of the holes increased.
Influence of perforating bars diameter
The influence of perforating bars’ diameter on the ultimate load and corresponding P-S curves is presented in Figure 8, which compares the shear performance of specimens PS-C50-55-12-2, PS-C50-55-16-2, and PS-C50-55-20-2. Influence of perforating bar diameter on shear behavior of PBLs.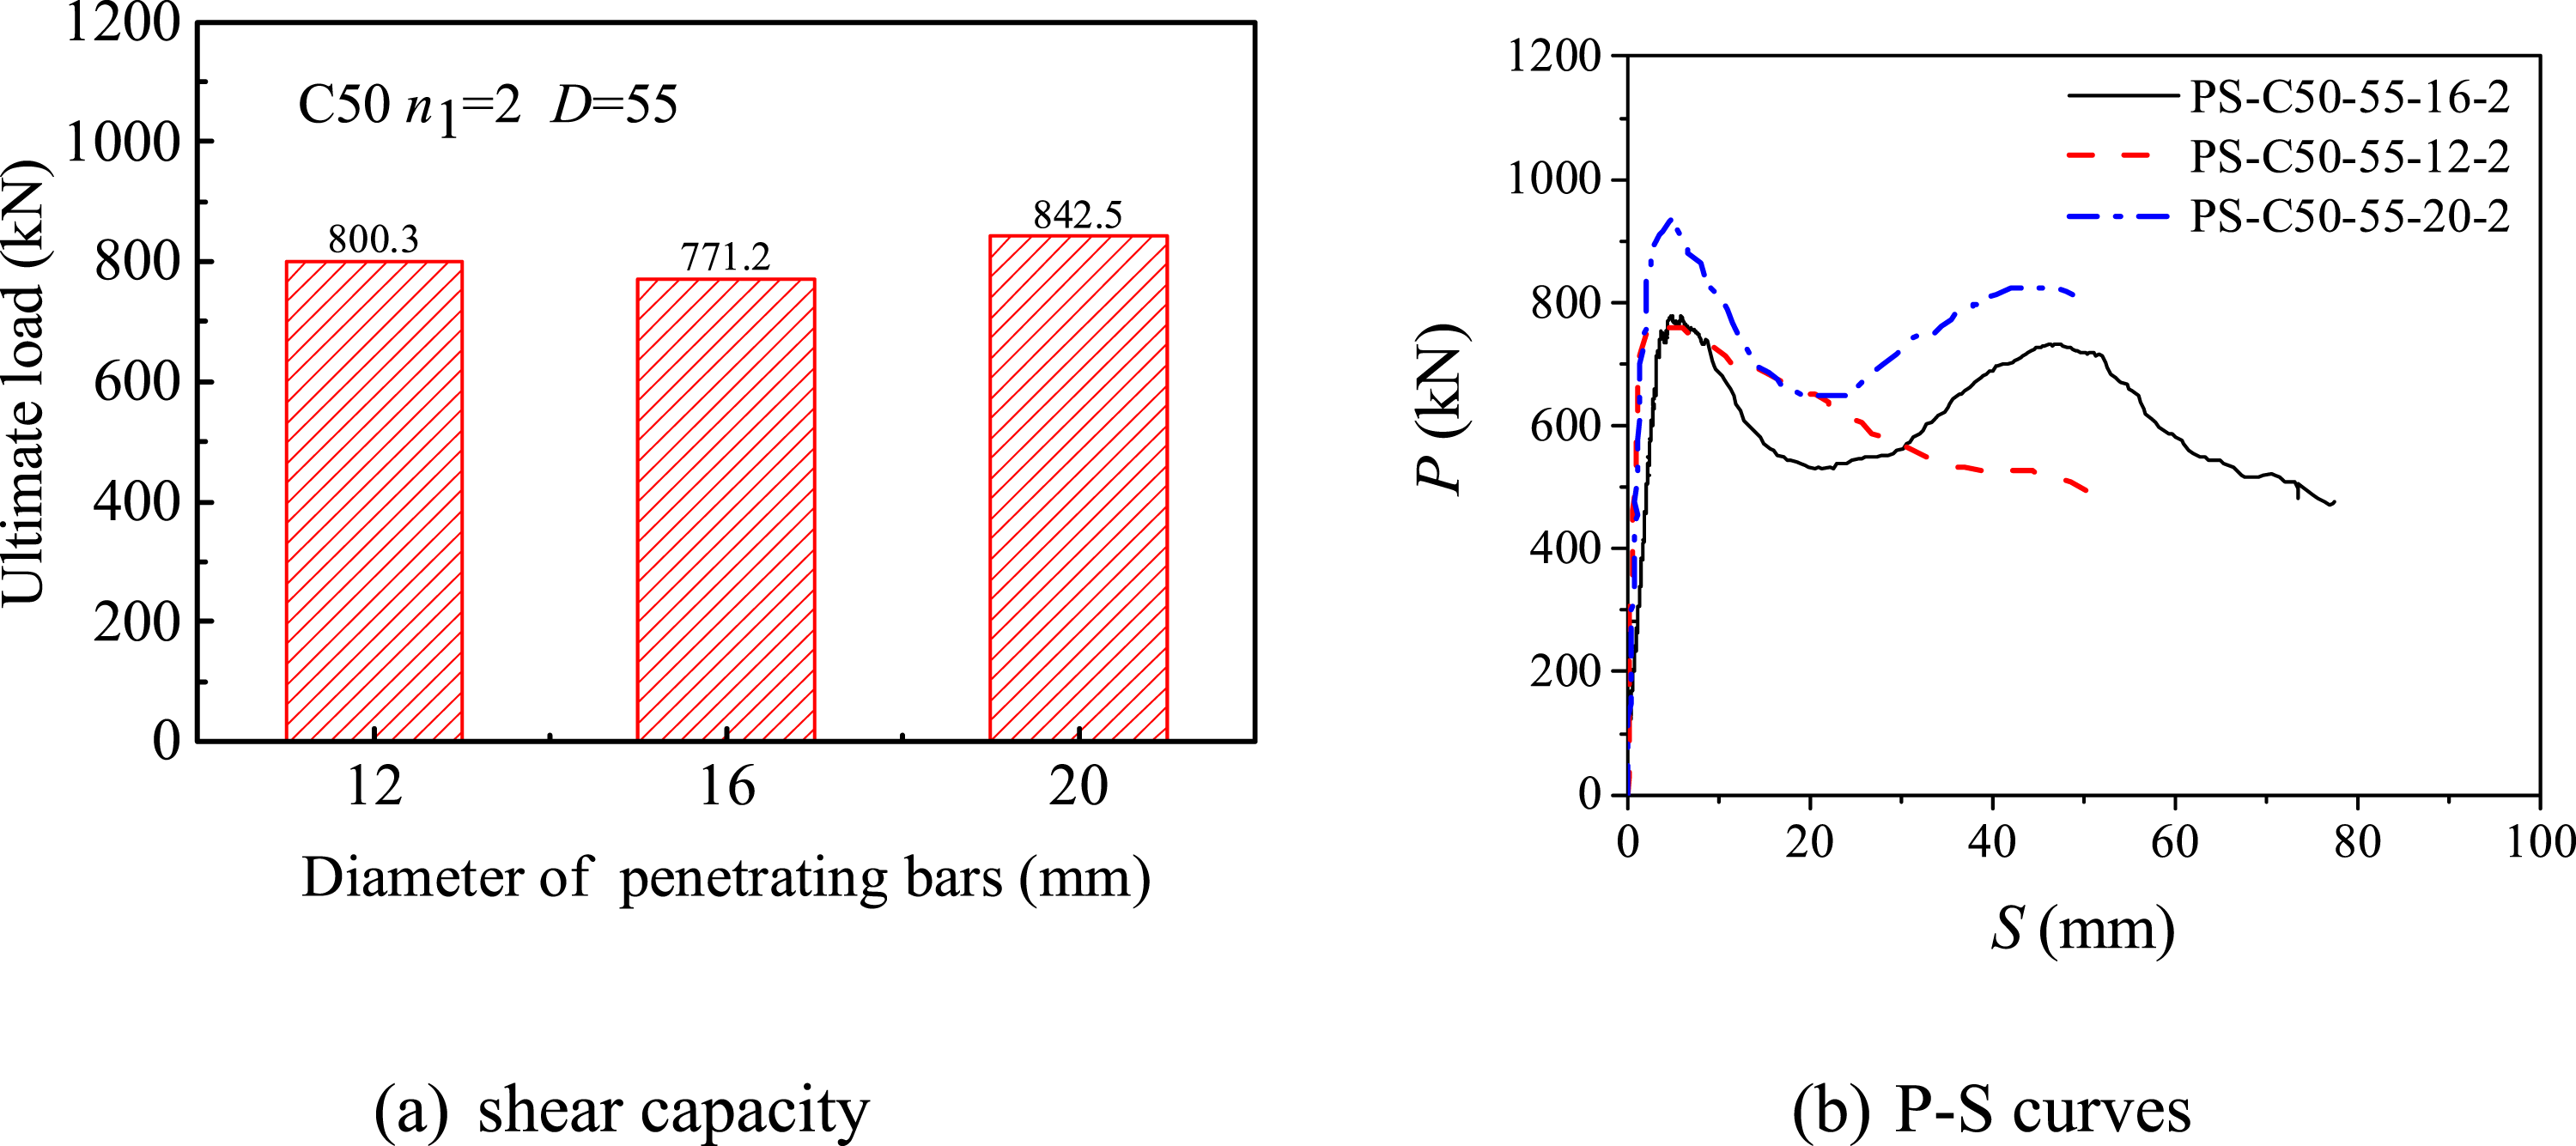
Overall, the variation in bar diameter showed only a minor effect on the shear strength of the PBLs. When the bar size increased from 12 mm to 16 mm to 20 mm, the ultimate shear capacity rose by approximately 9.24% and 5.27%, respectively. The difference between the 12 mm and 16 mm groups was merely 3.6%, suggesting that in this range the bar diameter had little influence on the dowel action of the concrete. This is attributed to the fact that the perforating bars were sheared off when PS-C50-55-12-2 and PS-C50-55-16-2 failed, while for PS-C50-55-20-2, the perforating bars did not yield.
Figure 9 illustrates the correlation between the measured resistance of the concrete dowels and their theoretical prediction. The shear contribution of a single concrete dowel was estimated as Pu/4. Accordingly, the net dowel resistance can be obtained by subtracting the portion carried by the perforating bars, n1Asfv. The theoretical resistance could be expressed as (2πD2-n1πd2)ft/4, where As, fv, and ft denote the perforating bar area, its shear strength, and the tensile strength of concrete, respectively. The experimental and theoretical dowel resistances exhibited a clear linear relationship, yielding a regression coefficient of 8.8 when the intercept was constrained to zero. This result suggests that perforating bars and concrete dowels predominantly failed in shear. Relationship of Pu/4-2Asfv and 2π(D2-d2)ft/4.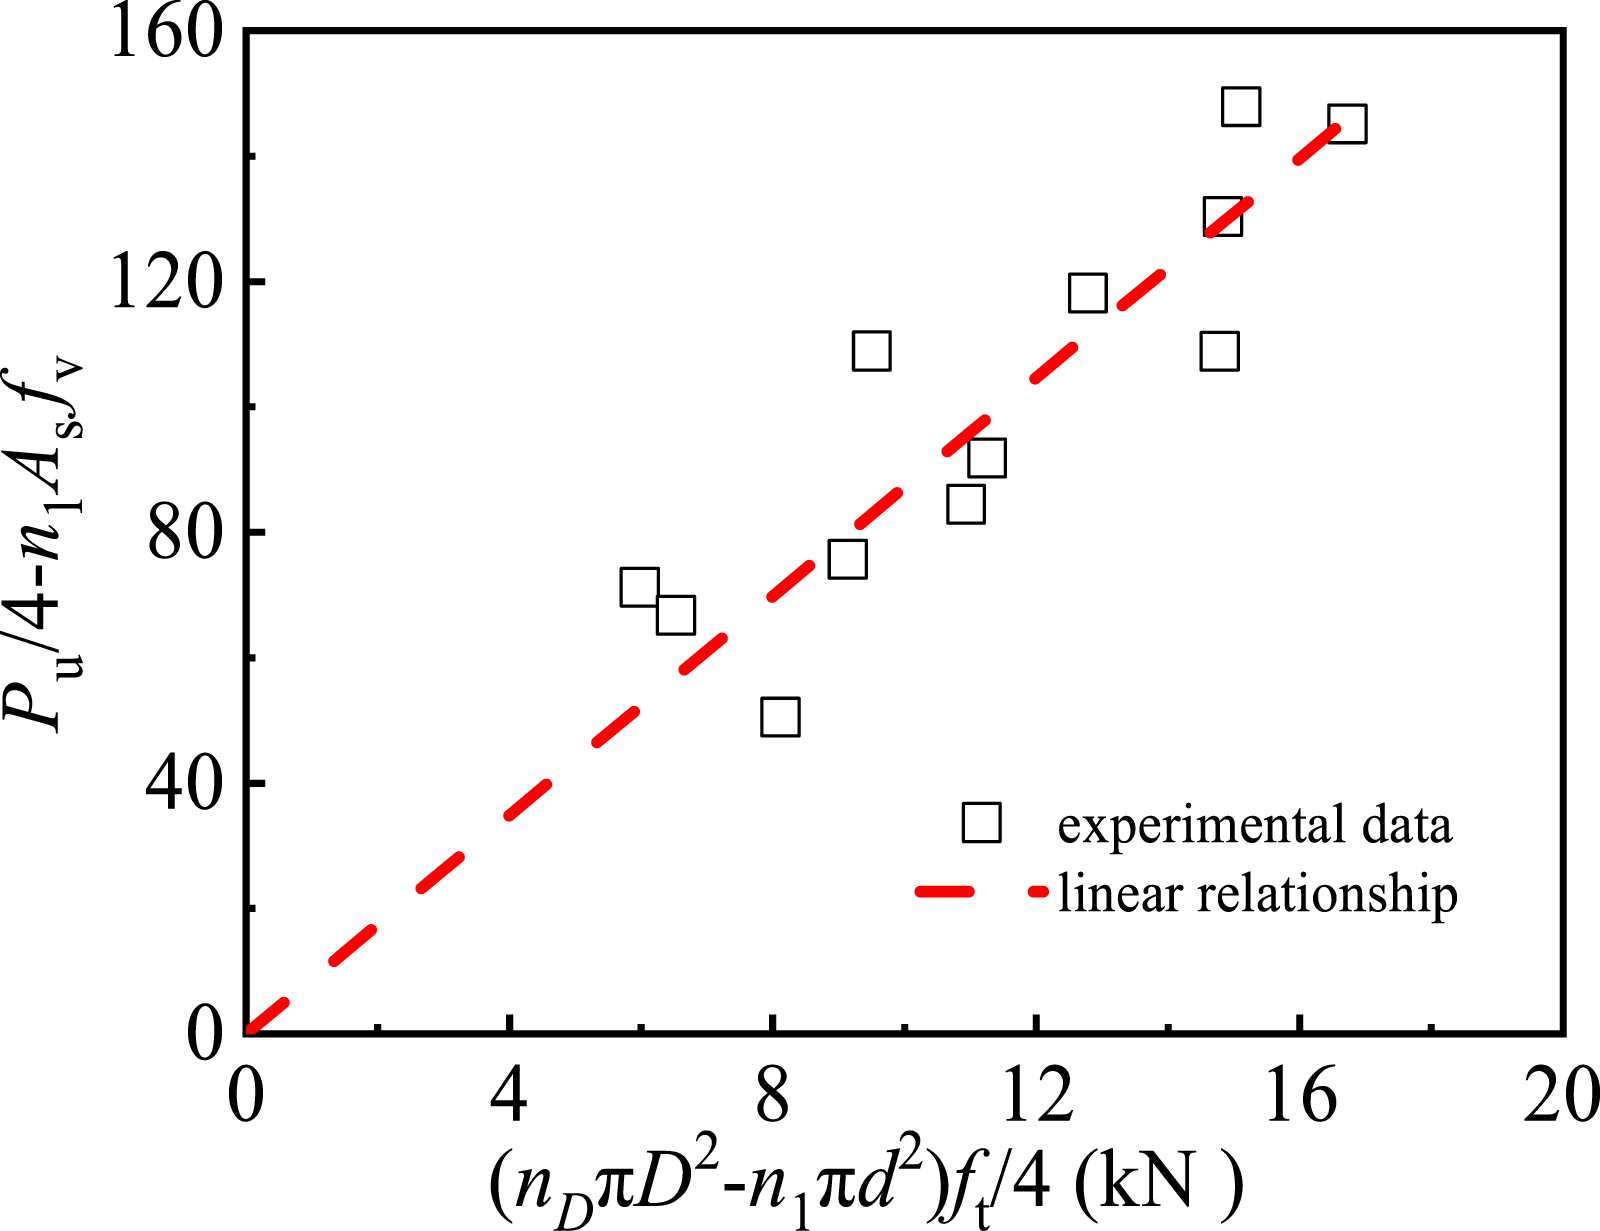
Influence of the number of perforating bars within the holes
The influence of the number of perforating bars (n = 0, 1, 2) on the P-S curves and shear strength of PBLs is shown in Figure 10, which compares the behaviors of specimens PS-C50-55-16-2, PS-C50-55-16-1, PS-C50-55-16-0, PS-C50-45-16-2, PS-C50-45-16-1, and PS-C50-45-16-0. Influence of the number of perforating bars within the holes on the shear capacity of PBL.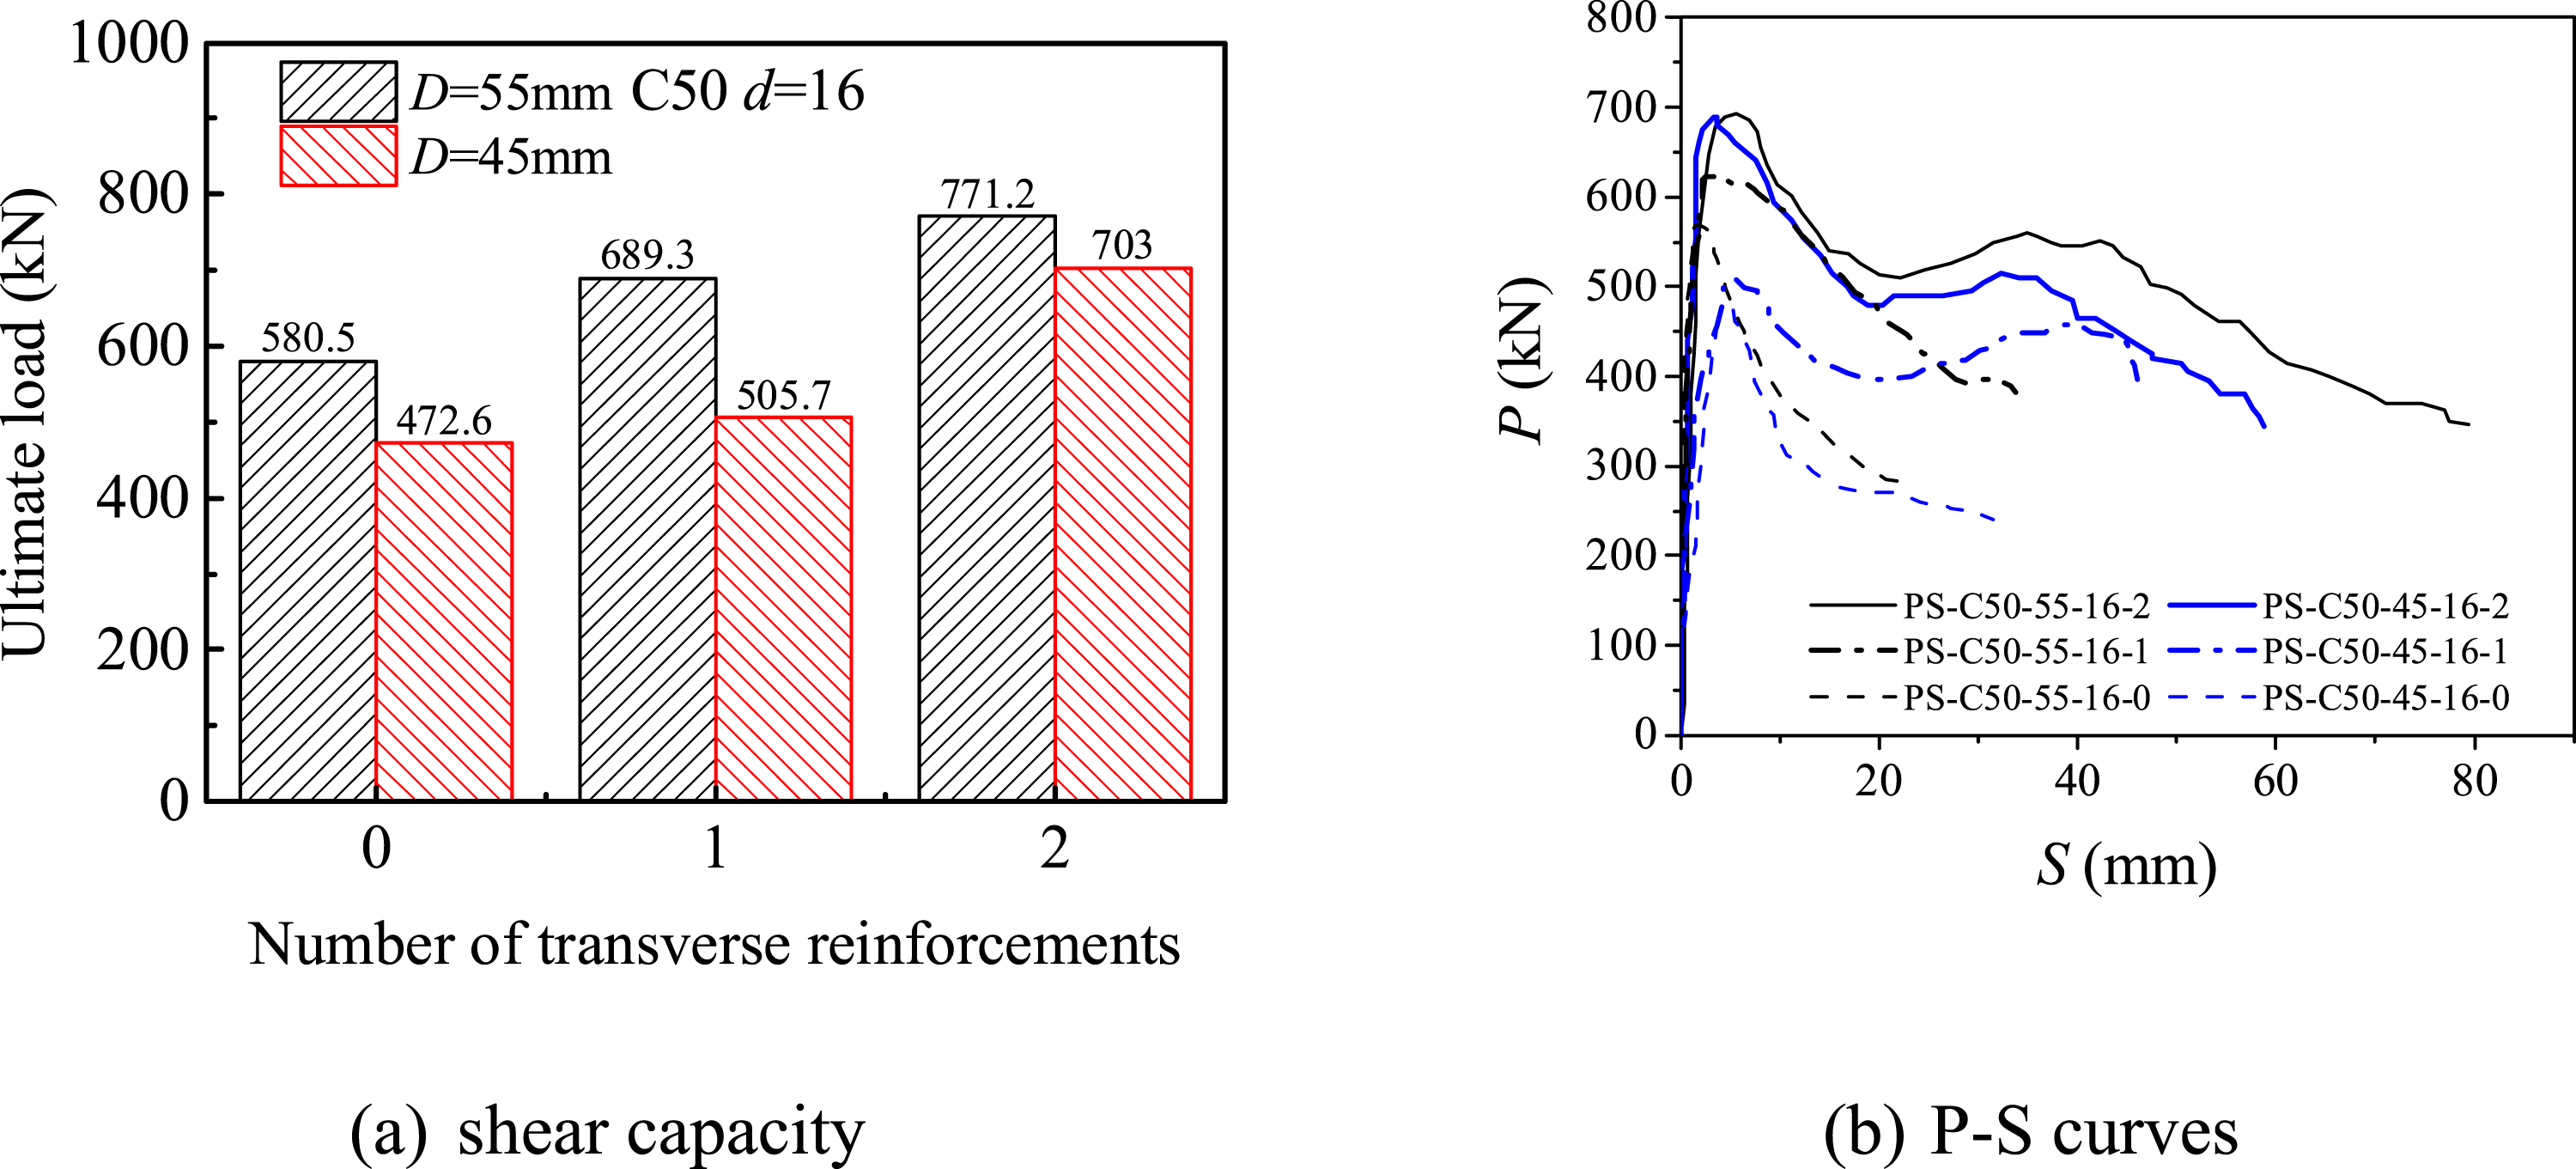
The number of perforating bars had a pronounced influence on both the failure pattern and shear strength of the PBLs. Specimens containing no or a single perforating bar mainly exhibited splitting failure of the concrete slabs, whereas those with two bars showed more severe splitting accompanied by transverse cracking, along with yielding or shear fracture of the bars. The presence of the perforating bars was found to effectively suppress slab splitting and prevent premature shear failure of the concrete dowels.
A clear strengthening effect was observed with the addition of perforating bars. For specimens made with C50 concrete, 16 mm bars, and 45 mm rib holes, the inclusion of two bars increased the ultimate shear resistance by about 39.0 % and 48.8 % relative to specimens with one or no bar, respectively. When the hole diameter was 55 mm, the corresponding increases were 11.9 % and 32.8 %. These findings confirm that the shear contribution of the perforating reinforcement is the primary factor governing the total shear capacity of PBLs. The improved behavior can be attributed to the additional restraint provided by the bars, which mitigates lateral concrete deformation and delays crack propagation, thereby further enhancing the overall shear performance. The presence of perforating bars led to an increase in the maximum slip observed in the load–slip response. With a greater number of perforating bars, the descending branch of the PBL curve transitioned from a smooth post-peak drop to a fluctuating decline.
Influence of the position of the bar in the rib holes
The influence of the transverse perforating bar position within the rib holes on the shear performance of PBLs is presented in Figure 11, where specimens PS-C50-45-16-2, PS-C50-45-16-2-T, PS-C50-45-16-2-B, and PS-C50-45-16-2-S are compared. Influence of the transverse perforating bar locations on shear behavior of PBLs.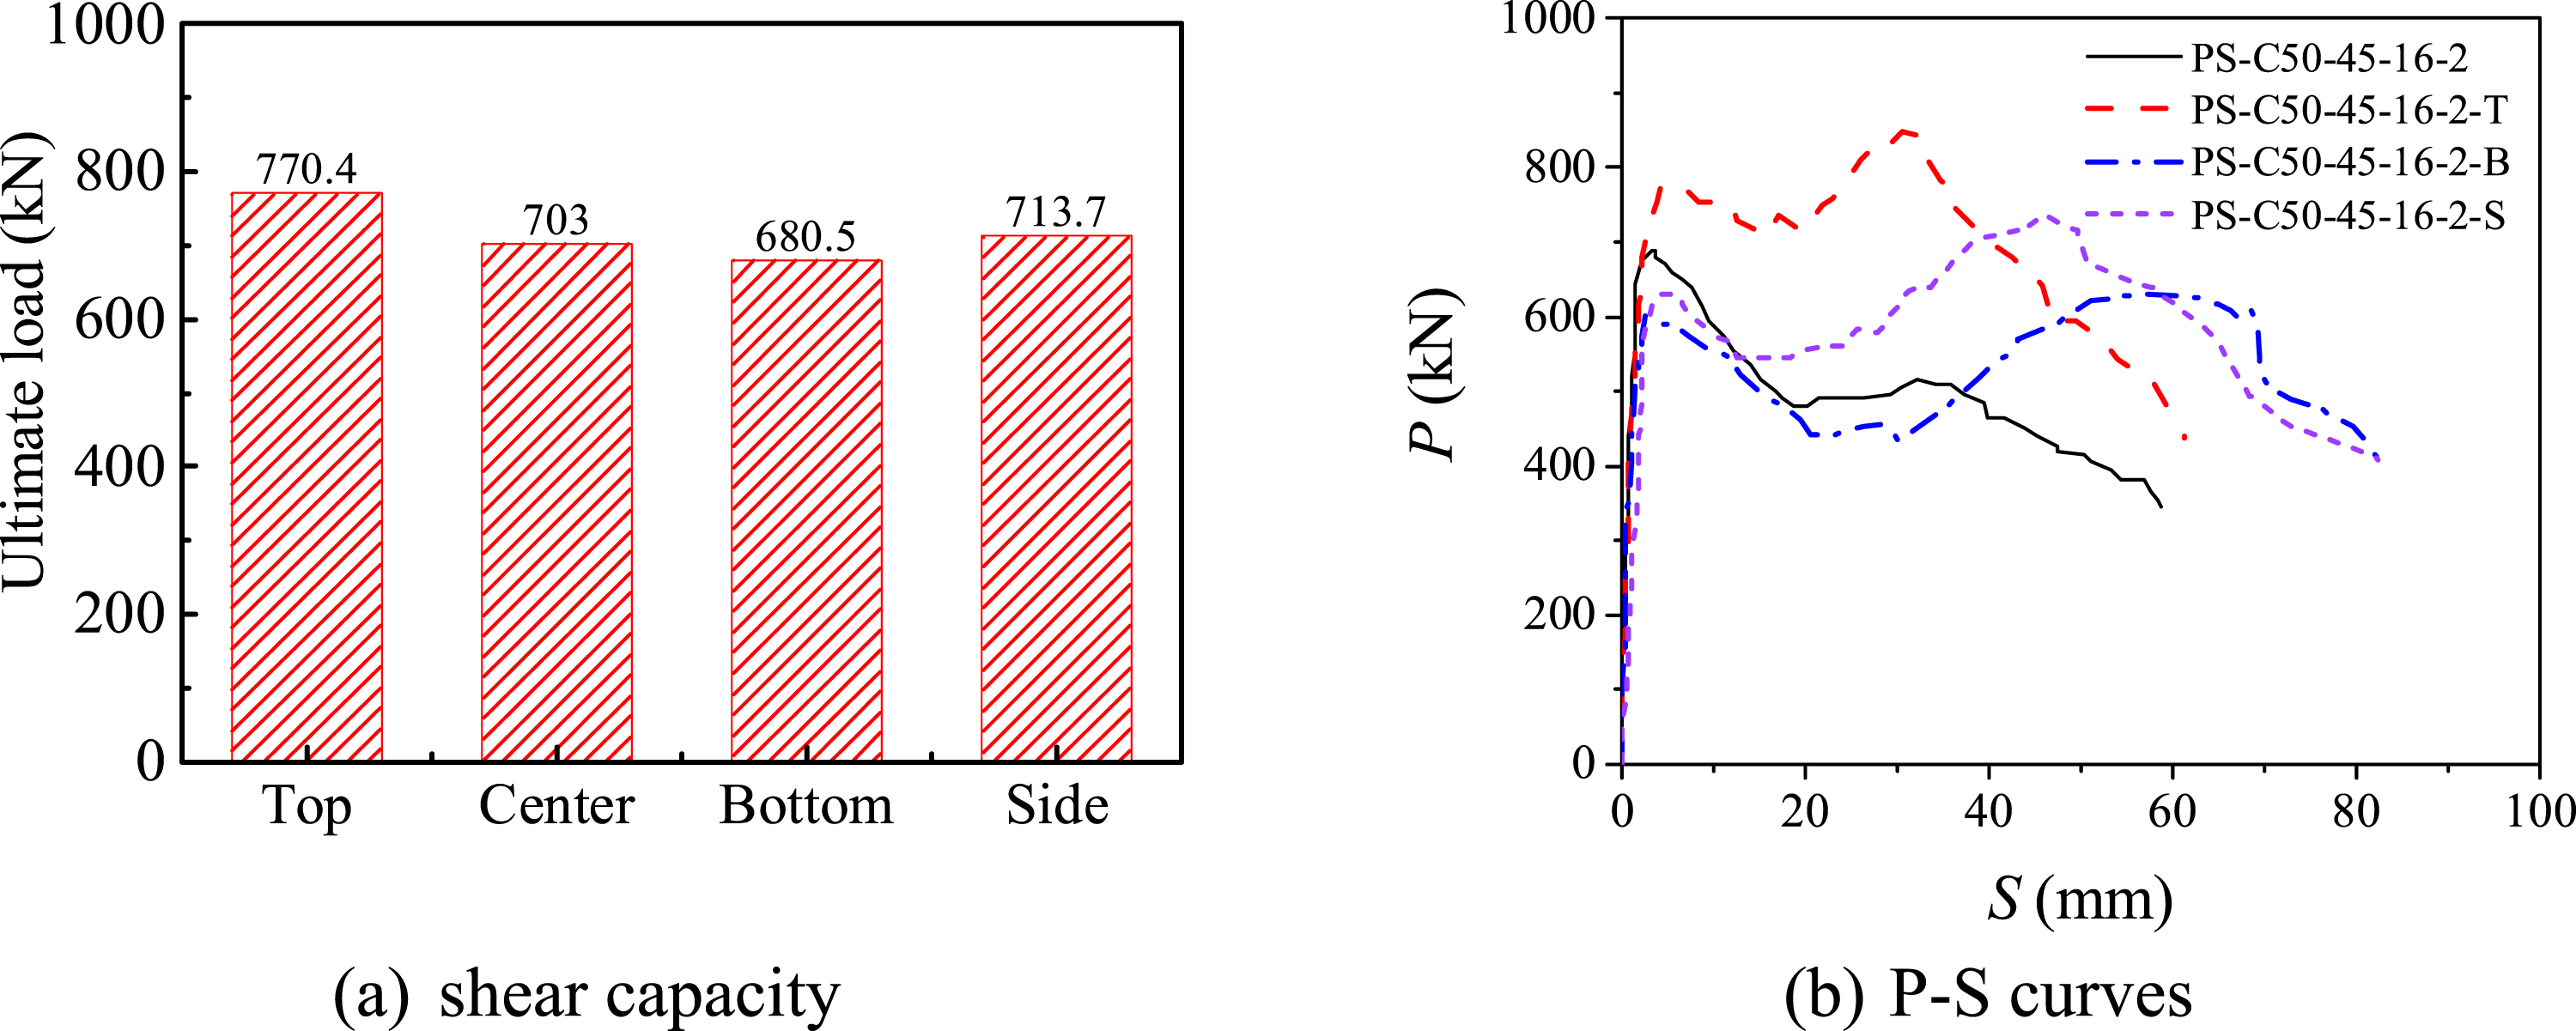
As illustrated in Figure 11, the shear capacity of the PBLs varied noticeably with the position of the transverse perforating bar inside the hole. The shear capacity of PS-C50-45-16-2-T increased by about 9.6% than that of PS-C50-45-16-2 and 13.2% than that of PS-C50-45-16-2-B. This indicated that an increase in shear capacity for specimens with the reinforcement at the top edge. This improvement occurs because the perforating bar at the top edge bears the load first, delaying the concrete dowel failure or the onset of concrete cracking, thereby enhancing shear resistance. Conversely, when perforating bars are positioned at the bottom, the concrete dowel initially resists the shear force, resulting in a relatively weaker restraining effect from the perforating bars and a greater likelihood of concrete cracking, which reduces shear capacity. The specimens with perforating bars at the steel beam side (PS-C50-45-16-2-S) have similar shear capacity compared to the PS-C50-45-16-2, with a data deviation of 1.5%. The location of perforating bars had little effect on the shear stiffness of the PBLs, as shown in Figure 11(b).
In order to further clarify how the position of the perforating bar affects the load-carrying capacity of the concrete dowels, the shear contribution of the perforating reinforcement in each specimen was isolated by deducting 2Asfv from the total capacity. Compared to the specimen PS-C50-45-16-2, the shear capacity contribution from concrete dowels in specimen PS-C50-45-16-2-B decreased by 6.1%, while in specimen PS-C50-45-16-2-T, it increased by 18.6%. This indicates that a reduction factor of 0.94 should be applied to account for the variability in concrete dowel contribution when perforating bars are not centrally positioned in the rib holes.
Calculation models to predict the PBL shear capacity
Existing models
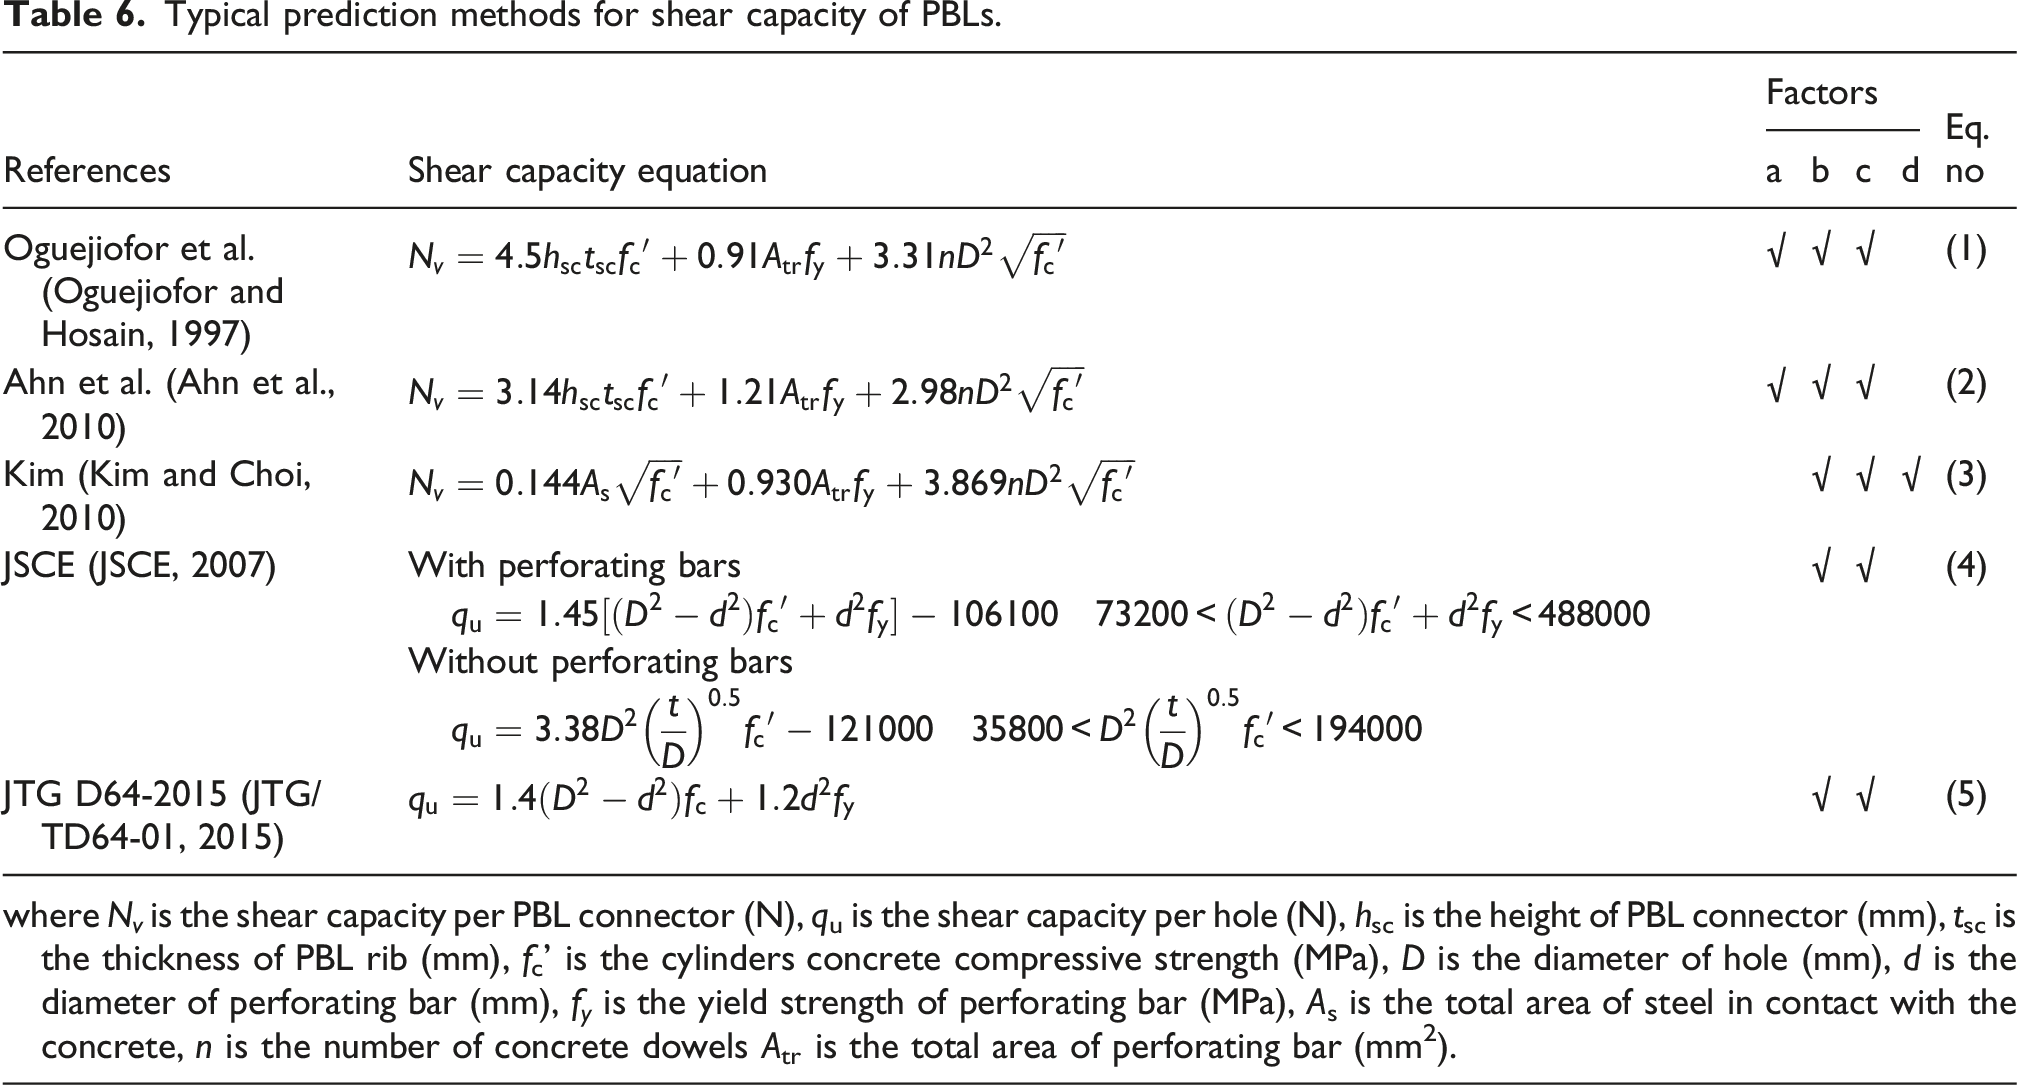
Reliable theoretical estimation of PBL connector capacity is crucial for their safe and efficient structural design. Over the years, numerous researchers have developed empirical expressions to evaluate the shear strength of PBLs. In addition, some design specifications, such as JSCE (JSCE, 2007) and JTG D64 (JTG/TD64-01, 2015), provide recommended calculation approaches for practical use.
Typical prediction methods for shear capacity of PBLs.
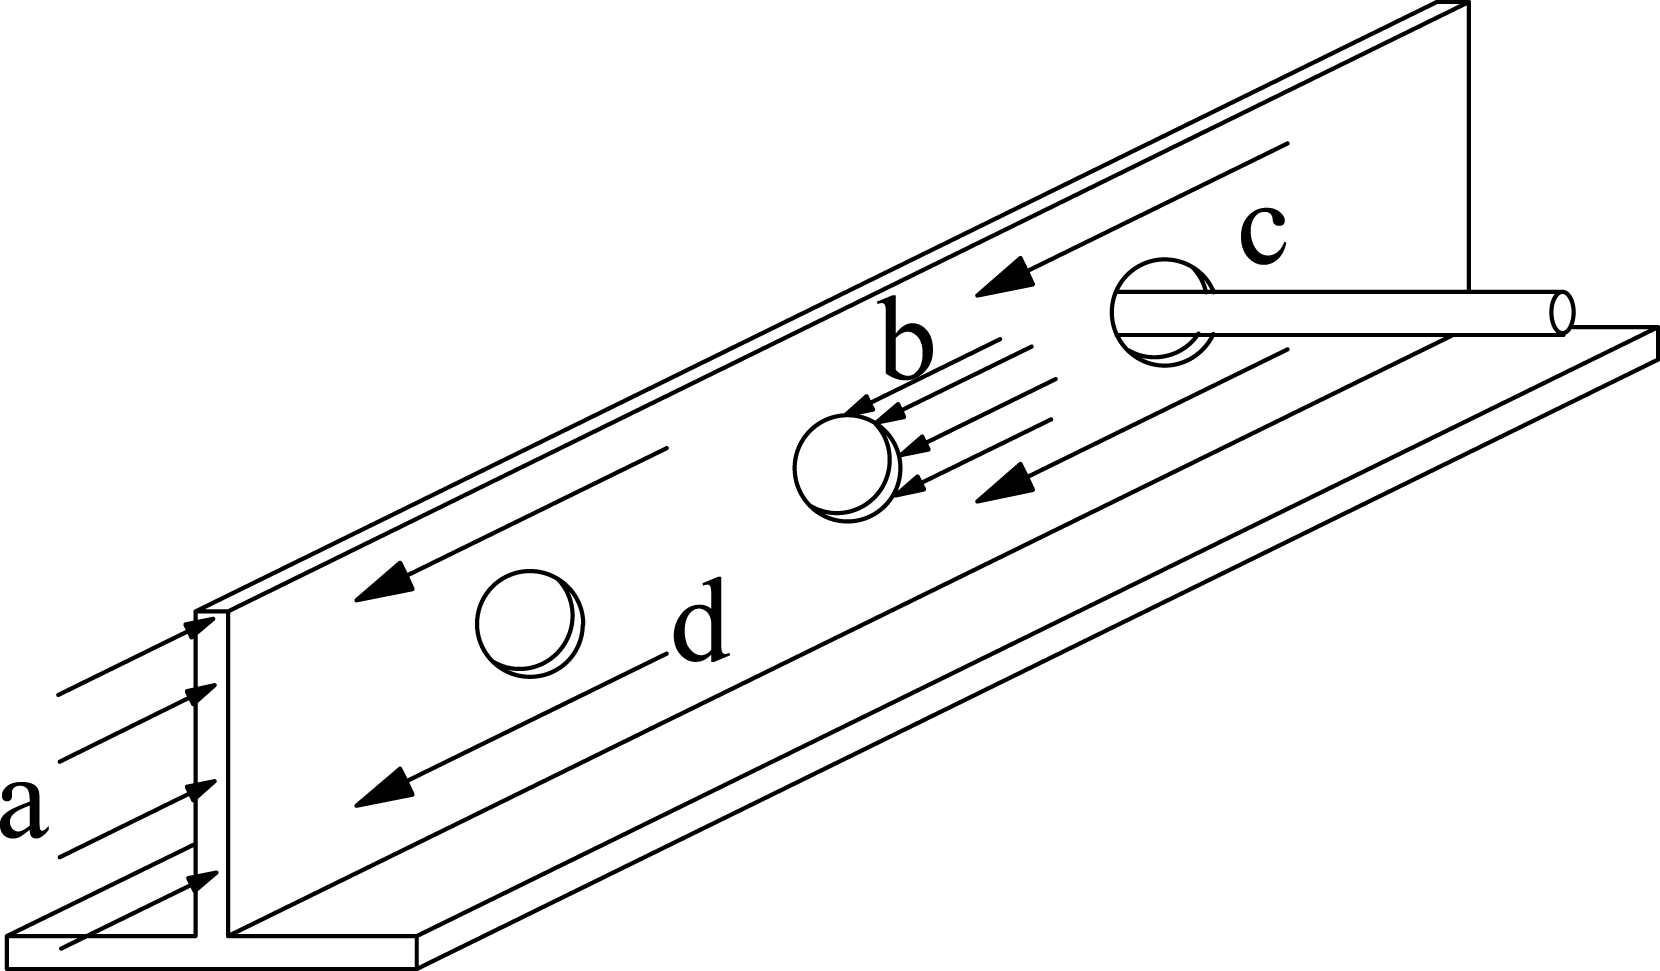
Force resisting mechanism.
As displayed in Figure 13, comparisons between the predicted and push-out test results for the ultimate capacity of PBLs reveal that existing equations (Equations (1)∼(5)) often fail to provide accurate predictions. The ratio of predicted to experimental values varies widely, ranging from −23% to 57%. This discrepancy largely arises because the tests used to derive these formulas differ in key aspects from the specimens tested in this study, such as the absence of concrete end-bearing in the specimens used to develop equation (4). Consequently, it is important to propose a more accurate equation to provide better capacity estimation for PBLs. Comparison between tests and calculations.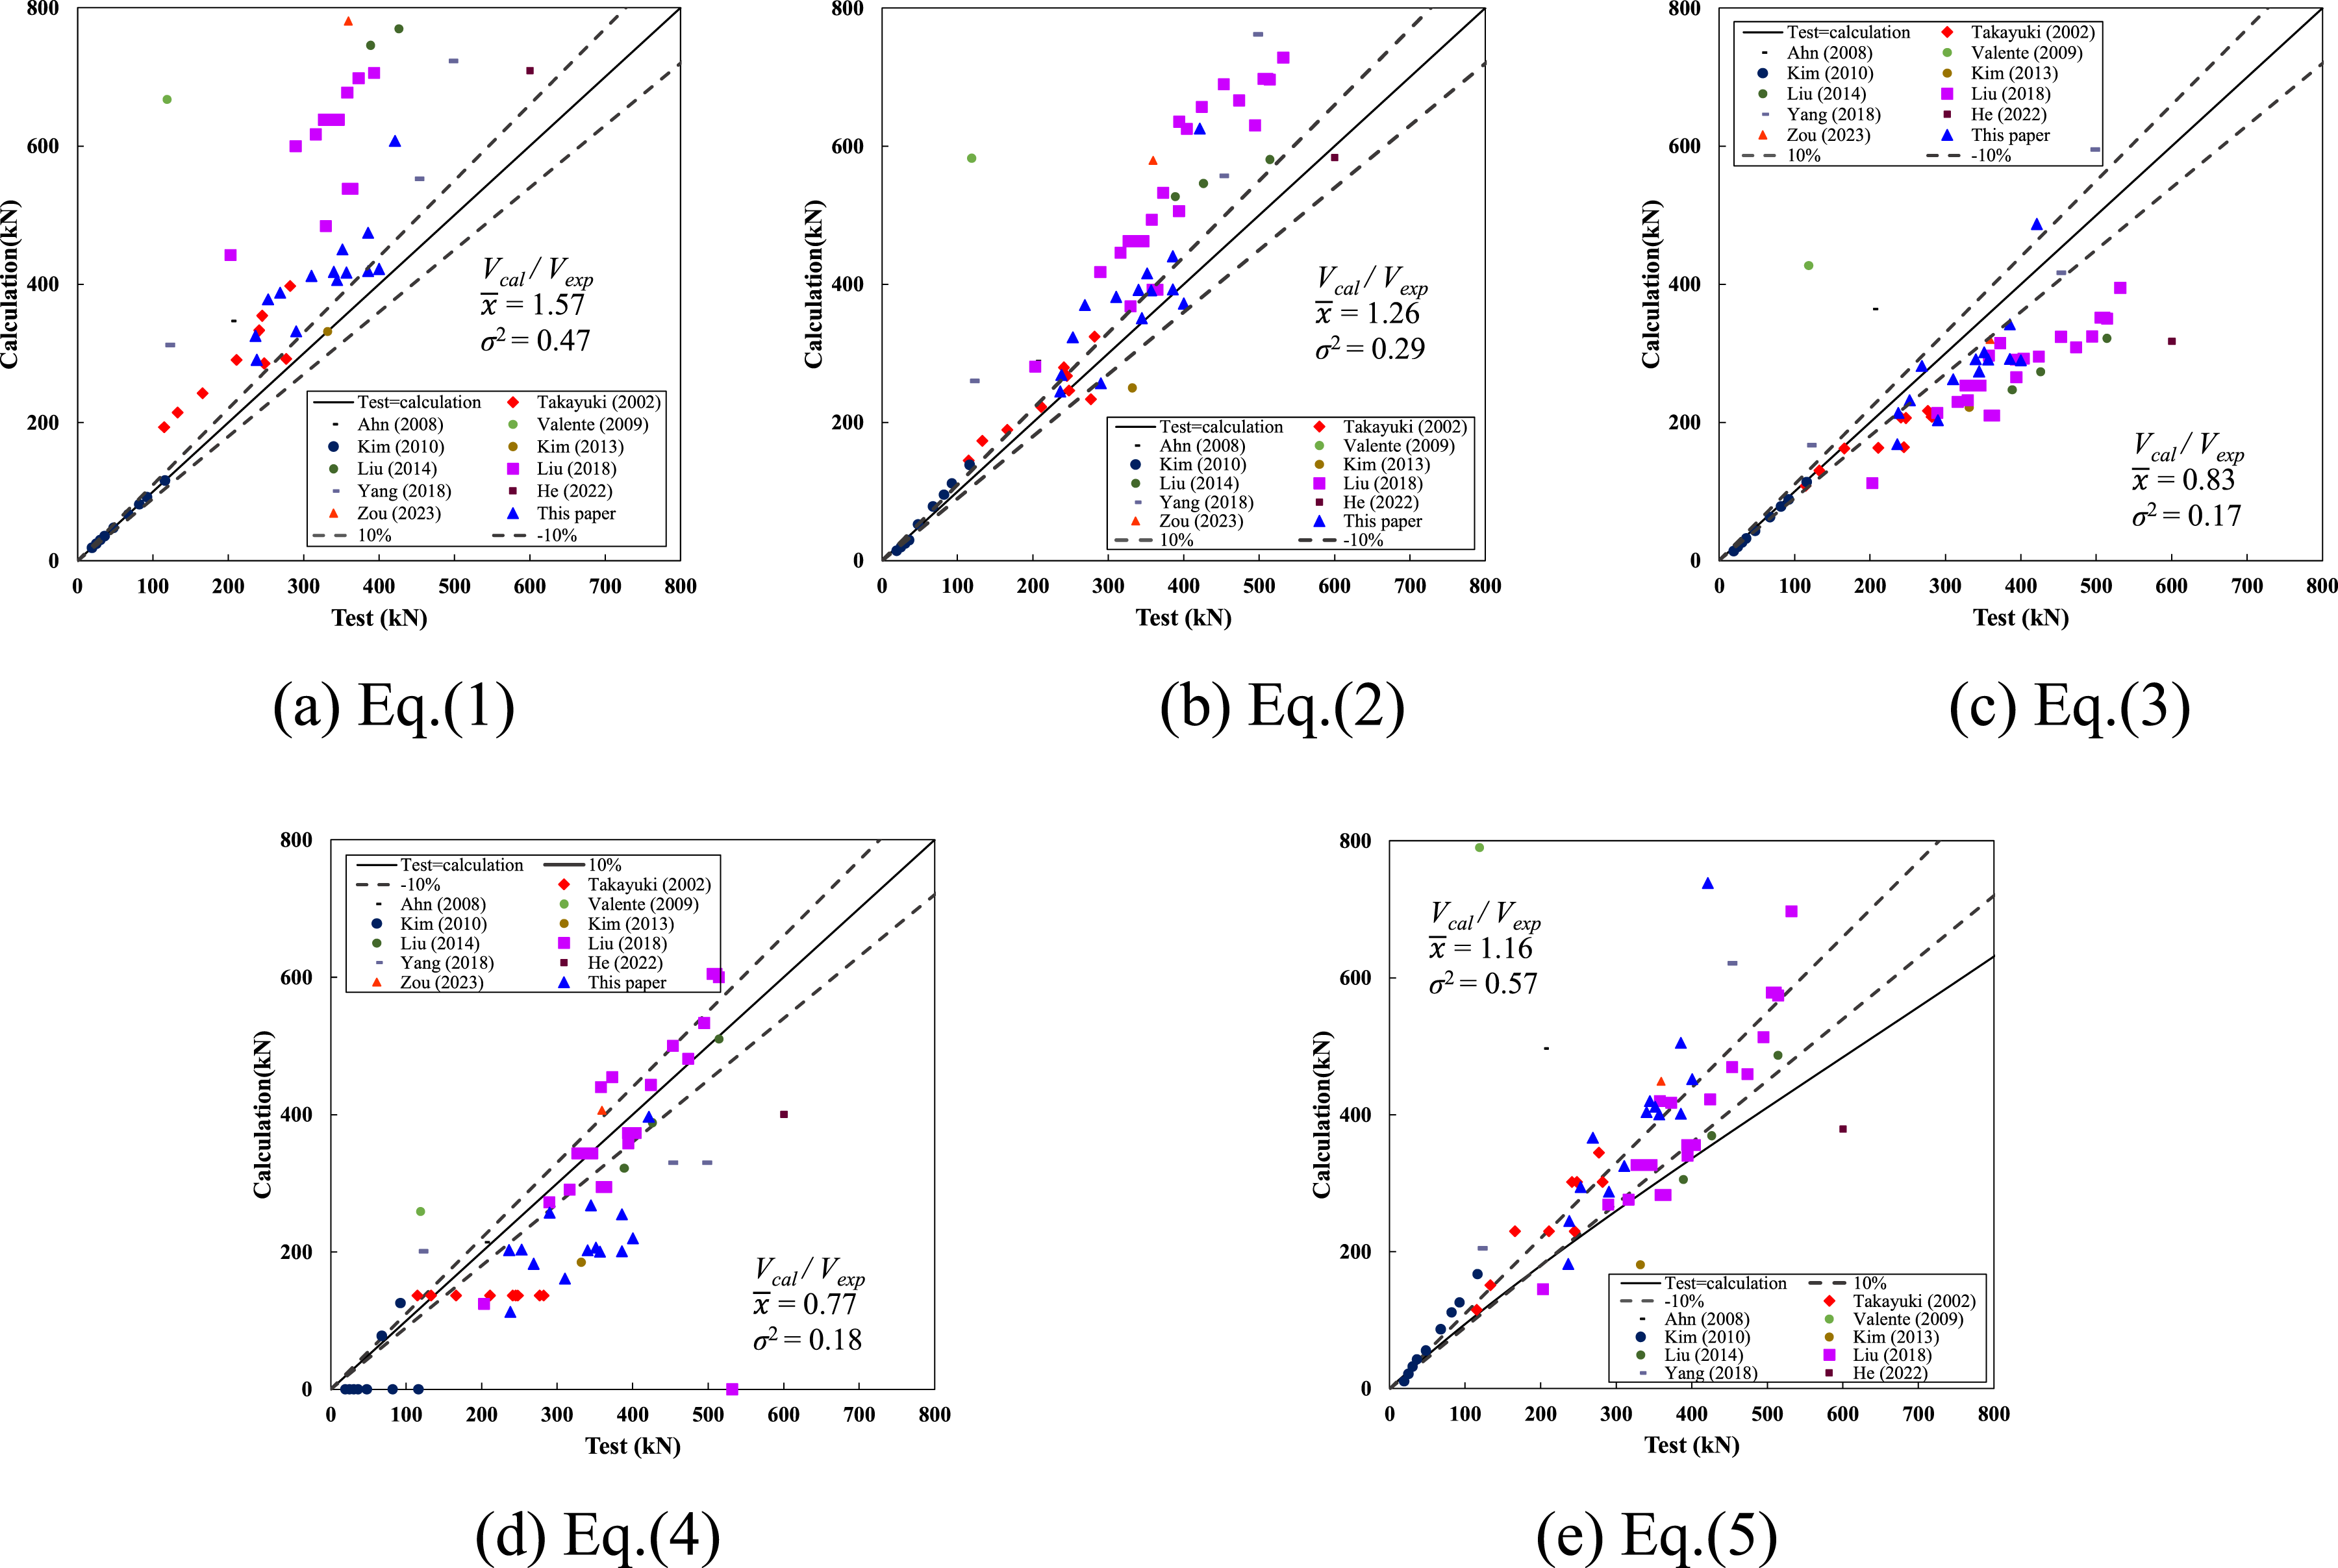
Composition of shear capacity for PBLs
Continued investigation is necessary to establish a more precise analytical approach for estimating the shear resistance of PBLs without the concrete end-bearing effect. This need arises from the noticeable inconsistencies between experimental observations and existing predictive models, together with the absence of explicit guidelines for determining the ultimate shear strength of PBLs.
The overall shear resistance of the PBL connectors is primarily controlled by the joint contribution of the perforating reinforcement and the concrete dowels. Therefore, the ultimate shear strength of the PBLs can be expressed using equation (6):
As depicted in Figure 14, the concrete dowel is subjected to a double-shear state. Consequently, the strength of the concrete dowel can be evaluated by equation (7): Analytical diagram for concrete dowel.
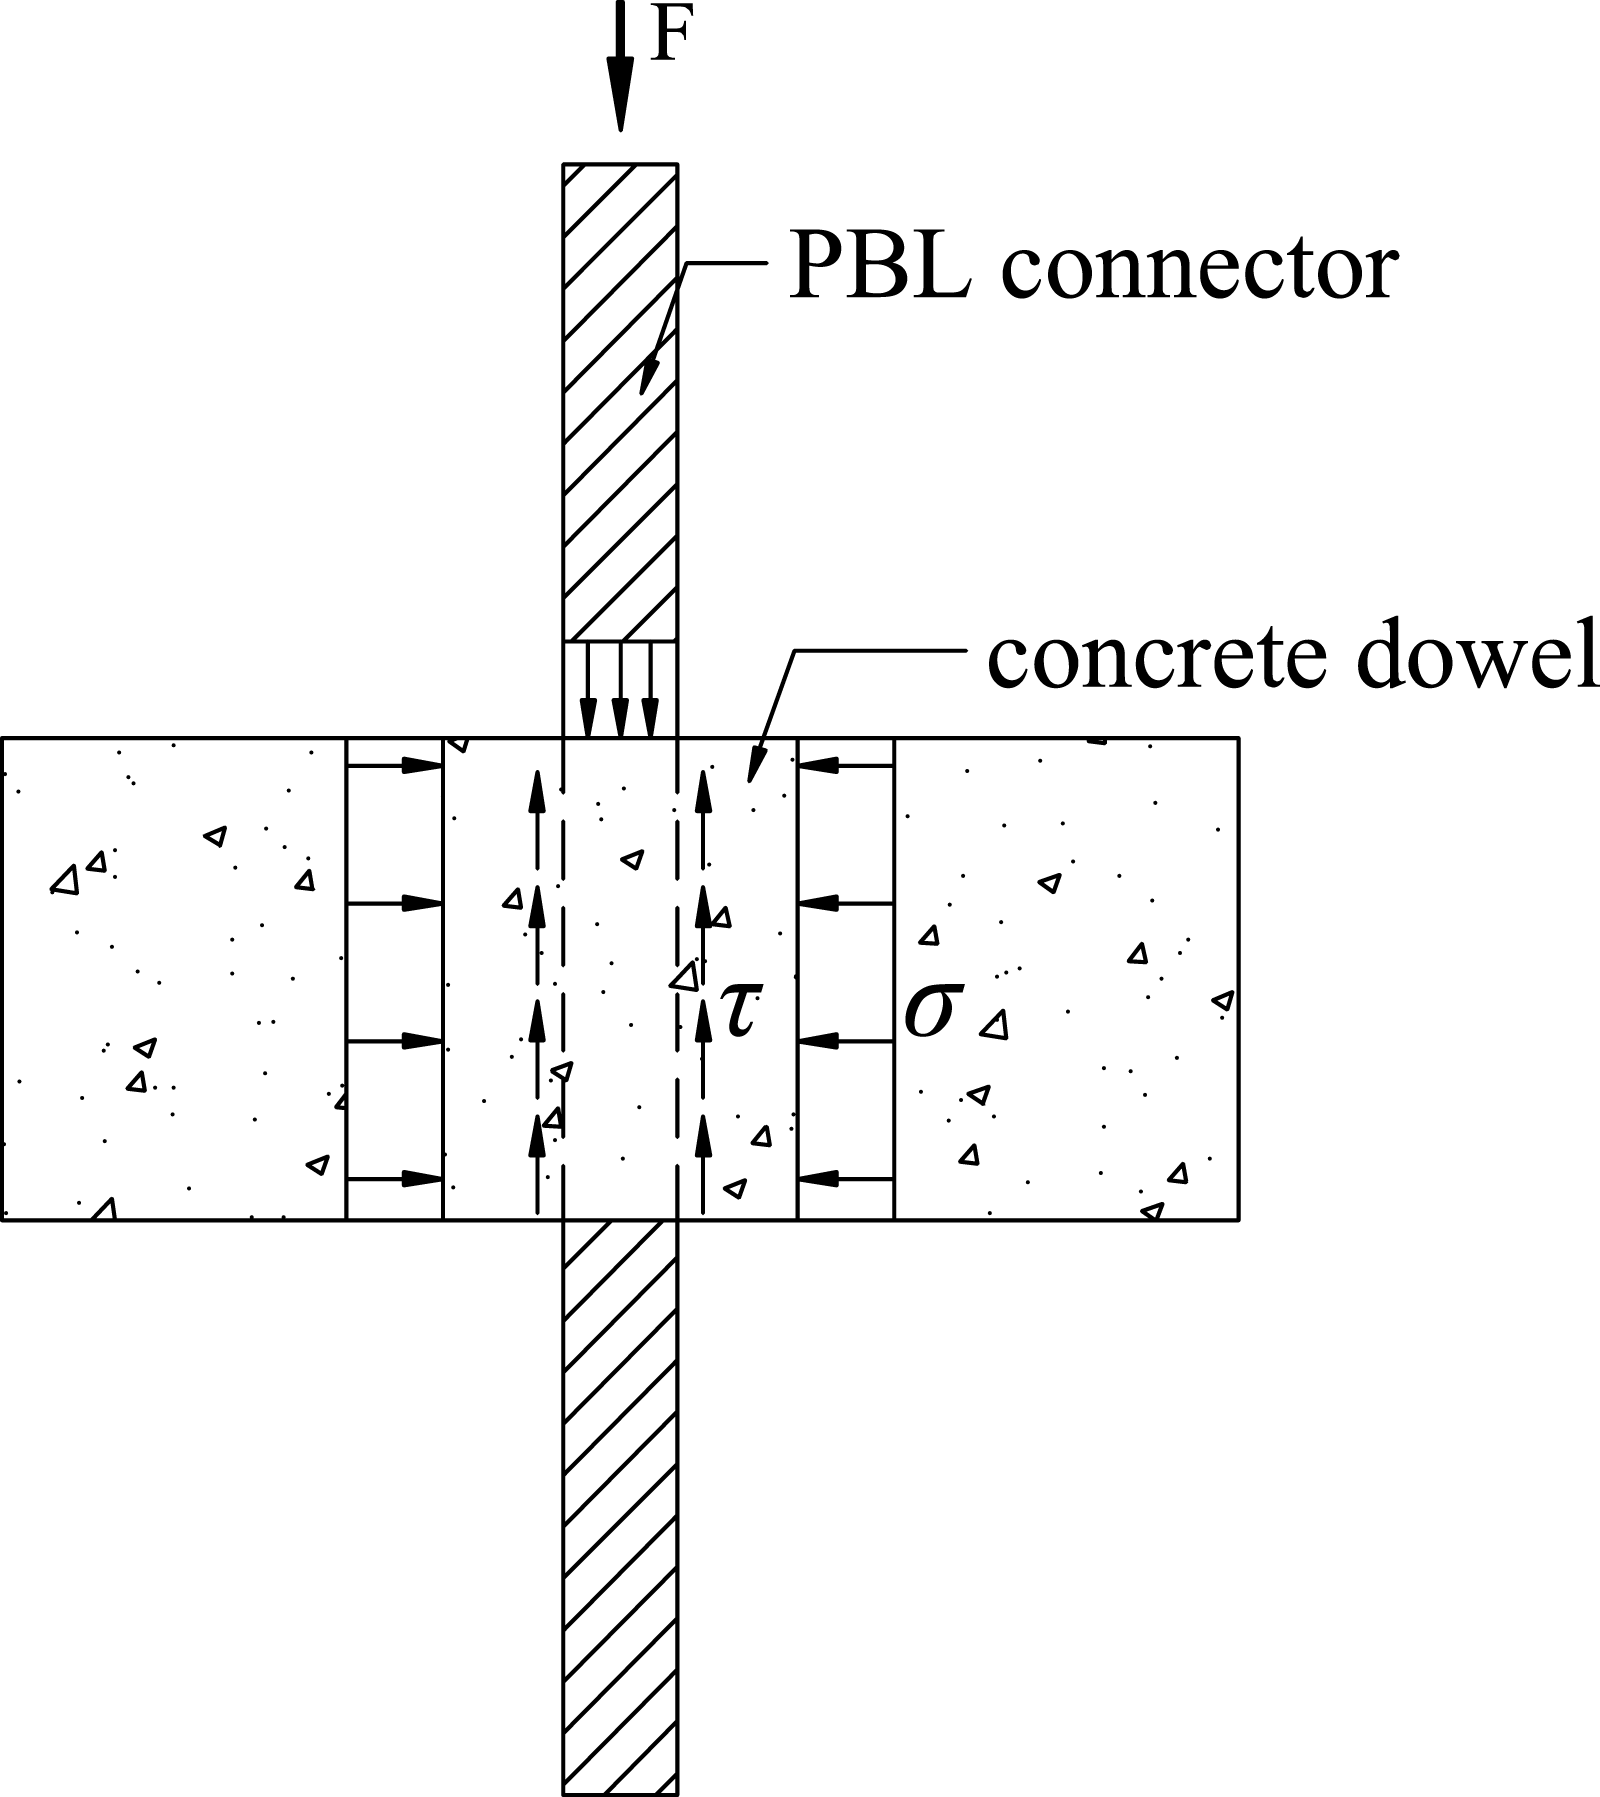
To incorporate the influence of the perforating bar’s location within the hole on the shear strength of the PBL connectors, a reduction factor (ψ2 = 0.97) was applied to adjust the contribution of the concrete dowels, representing the positional effect of the reinforcement. Accordingly, the shear resistance of a single concrete dowel passing through the hole can be determined by equation (8):
Results from the push-out tests indicate that the perforating bars, which are subjected to a combination of tensile, bending, and shear actions, tend to fail in shear. According to (Yang and Chen, 2018), the shear contribution of these bars mainly depends on their cross-sectional area and shear strength. Accordingly, the shear resistance provided by the perforating reinforcement, as illustrated in Figure 15, can be expressed as: Stress diagram for transverse rebar.
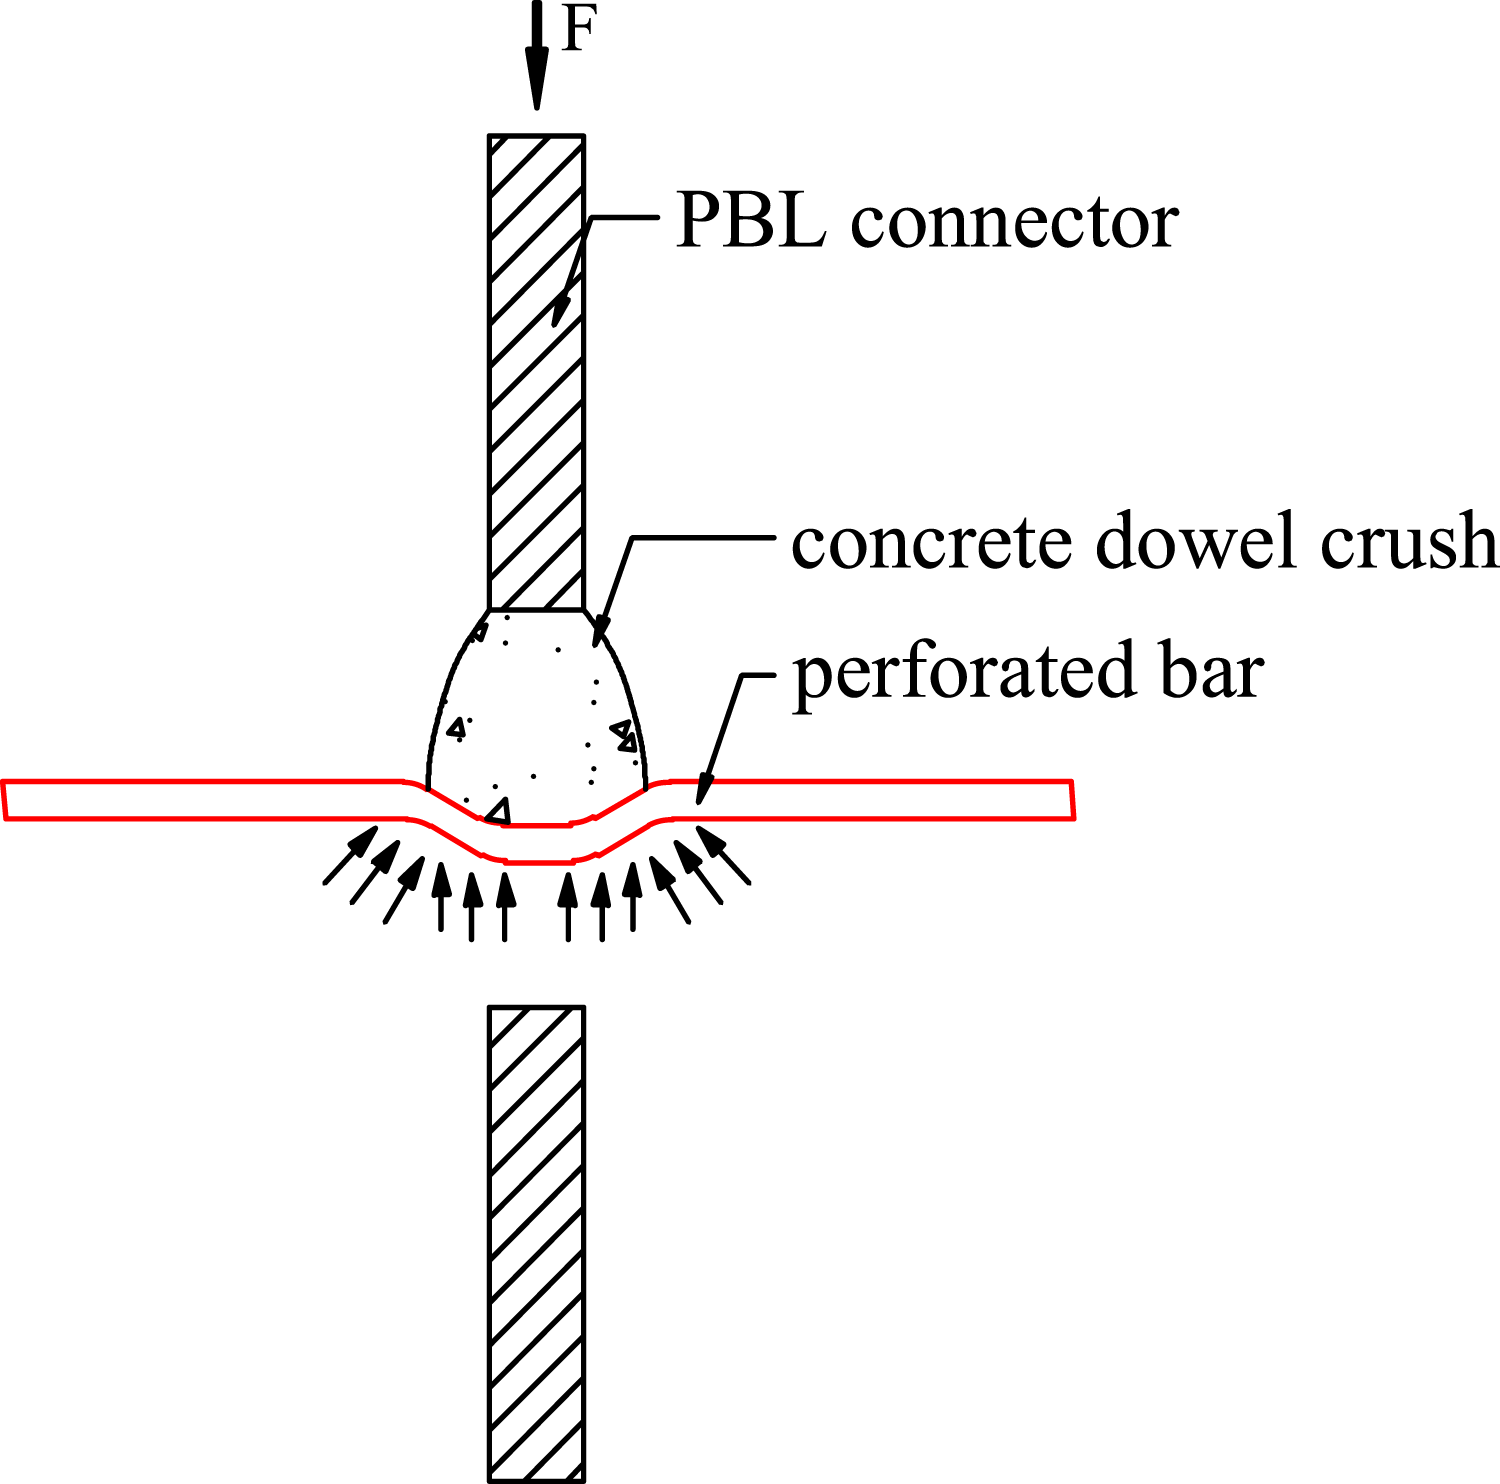
Consequently, the ultimate shear capacity of the PBL connector can be calculated by equation (10):
The accuracy of the proposed equation (10) was assessed by comparing the predicted shear capacities with the corresponding experimental measurements, as illustrated in Figure 16. Comparison between tests and calculations of equation (10).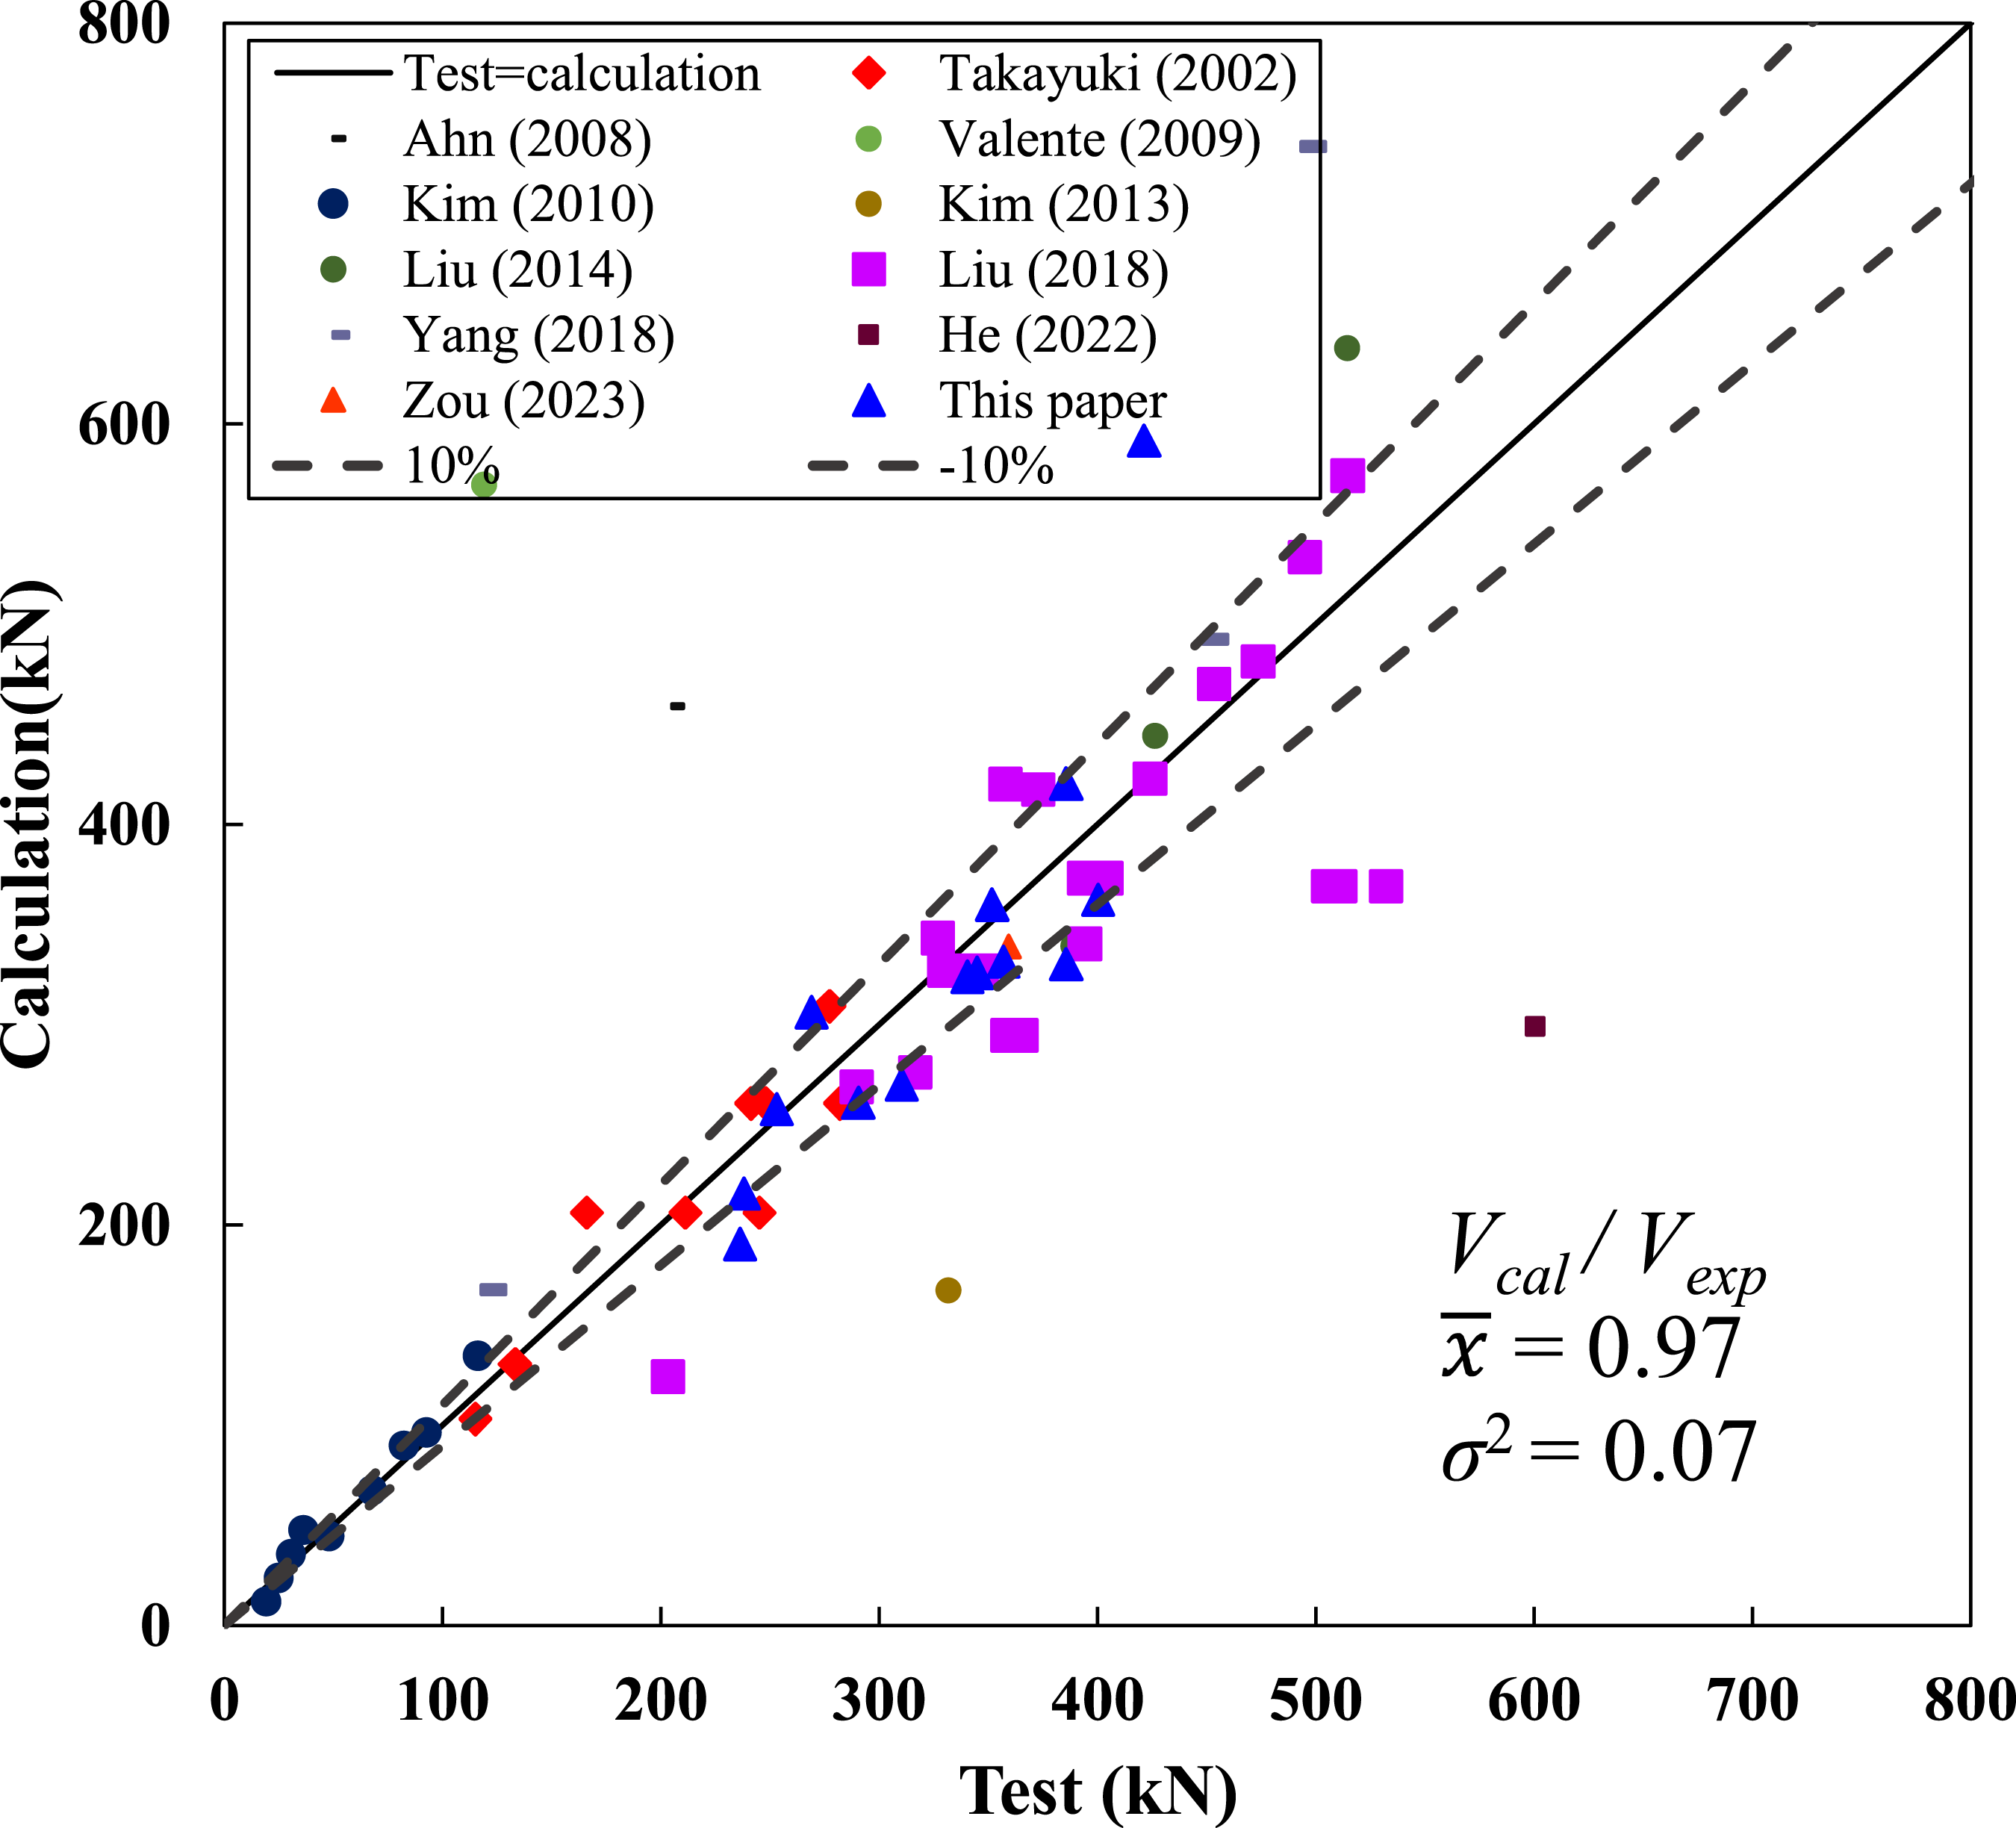
All data were obtained from PBL specimens that exhibited the same failure mechanism observed in this study, namely, shear failure of the concrete dowels. The calculated mean and standard deviation are 0.97 and 0.07, respectively, confirming that the proposed equation (10) provides an accurate estimation of the shear strength of PBLs. Since equation (10) is derived through regression analysis, its applicability should be limited to configurations similar to those investigated herein: concrete slabs with a thickness of 150-200 mm, PBL plates with a thickness of 5-16 mm, a ratio of perforating bar area to concrete dowel area ranging between 0.04 and 0.71, and concrete compressive strengths from 35.7 to 58.9 MPa. It is also noteworthy that the outcomes of this research have been incorporated into the revised edition of the Chinese national standard “Code for design of steel and concrete composite bridges” (GB 50917).
Expression of P-S curves
The P-S relationship of shear connectors is essential for evaluating the interfacial load transfer between the steel and concrete components of composite beams (Cao et al., 2022). While substantial progress has been made in estimating the P-S curves of weld studs, research on the P-S curves of PBLs remains limited. Further studies are necessary to derive the P-S curves for PBLs.
Ollgaard et al. (Ollgaard et al., 1971) proposed an exponential formula (Equation (11)) to simulate the P-S curves of the weld stud, which has become the most widely used model.
Buttry (Buttry, 1965) suggested a fractional function (equation (12)) to describe the P-S relationship of welded stud connectors.
Zou (Yang and Chen, 2018) developed a P-S model (equation (13)) for PBLs, accounting for the influence of the concrete end-bearing effect.
The shear connectors were designed to remain intact under the flexural failure of the steel-concrete composite beams. Consequently, the analysis concentrated on the ascending segment of the load–slip (P-S) response of the PBL connectors. Considering the complex interaction among the perforated rib, concrete dowels, and perforating bars, an empirical fitting approach based on the experimental P-S curves was used to establish the ascending branch of the P-S relationship.
This form satisfies the basic features of the ascending branch: the curve starts from the origin, the load increases nonlinearly with slip, and the normalized load gradually approaches the peak value. In this expression, b is related to the initial slope of the curve and can therefore reflect the initial shear stiffness of the connector. Based on the test results, the pre-peak load–slip response was mainly influenced by the concrete compressive strength, the diameter of the rib holes, and the dimensions of the perforating bars. Accordingly, b was expressed as a function of these parameters, and the coefficients were determined by the least-squares fitting method. The final expression is given as (equation (15)):
Figure 17 illustrates the predictive and experimental curves of specimens. The results calculated using equation (15) demonstrate good agreement with the test results. The proposed model can be used as a practical input for finite element modelling and theoretical analysis of steel–concrete composite beams with PBL connectors. Test results and regression curves.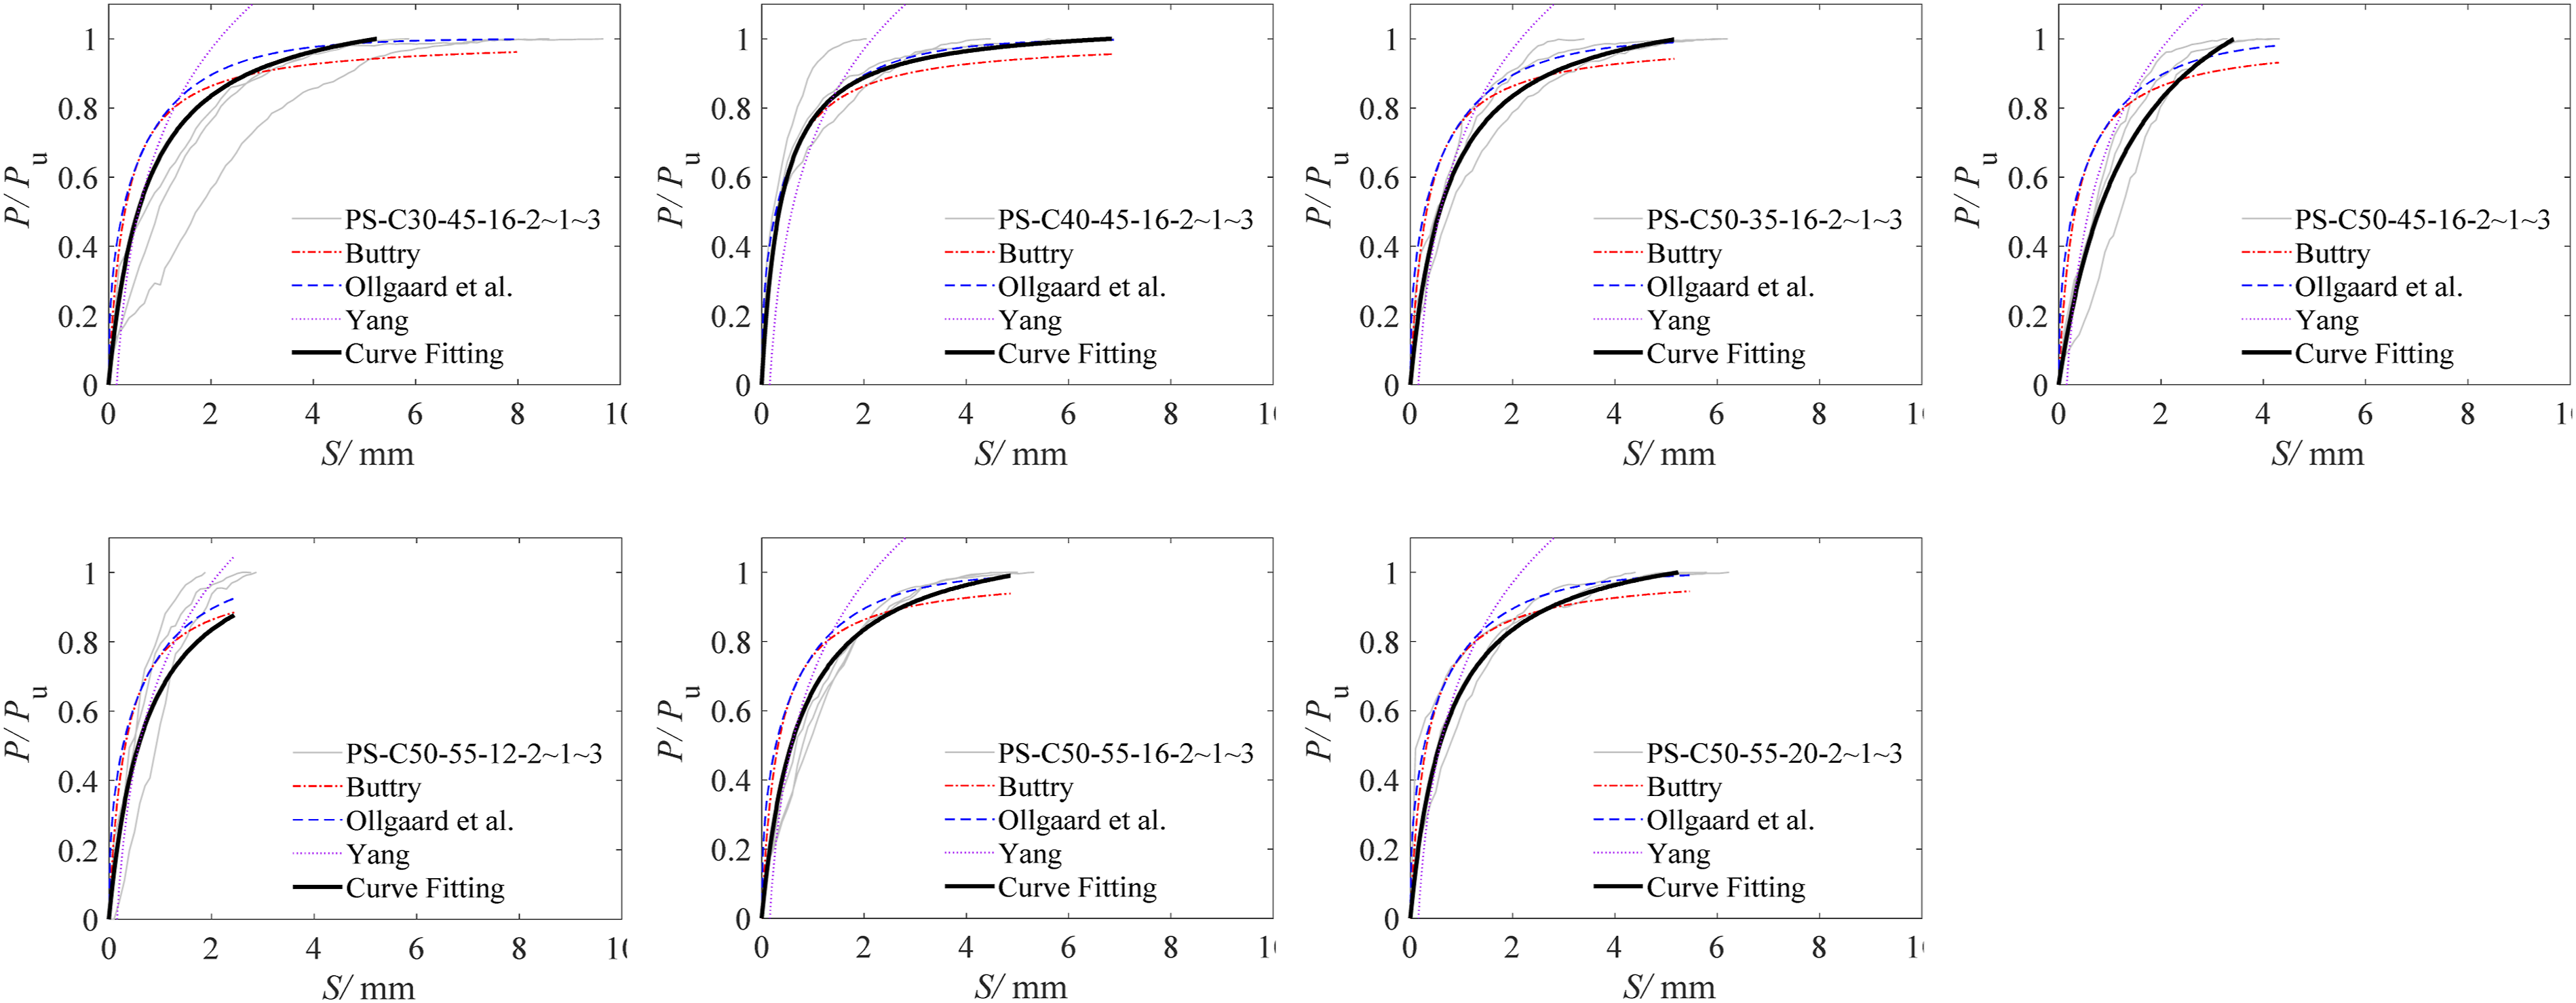
Conclusions
A total of 42 push-out tests were conducted to investigate the shear performance of PBLs without the concrete end bearing effect, and the results obtained led to the following conclusions: (1) Two failure patterns were observed, including concrete slab splitting failure for specimens with one or no perforating bar and splitting failure with transverse cracks of the concrete slab for specimens with two perforating bars. (2) The P-S curve of the PBLs exhibited three distinct stages: an elastic ascending phase, a plastic ascending phase, and a descending phase. The maximum slip values exceeded 60 mm, confirming that the PBLs behave as ductile shear connectors. (3) The ultimate shear resistance of the PBL connectors increased with improvements in concrete strength, enlargement of rib-hole diameter, and the use of either a greater diameter or additional transverse perforating bars. Specimens containing perforating reinforcement consistently achieved higher shear capacities than those without, even when smaller-diameter transverse bars were used. (4) The reduction of shear capacity should be considered due to the difference in the position of the transverse perforating bar. The average strength gradually decreased as the bar position shifted upward from the bottom to the top of the hole. For specimens with reinforcement located at the top, the shear capacity was approximately 12% higher than that of specimens with bars at the mid-height and about 29% higher than those positioned at the bottom. (5) A new expression for the load-slip (P-S) relationship was developed, and a calculation model for shear capacity was proposed. The proposed calculation model demonstrated a better match with test results compared to existing models. And the shear capacity calculation model has been adopted in the Chinese standard (GB 50917).
Footnotes
Acknowledgments
The authors acknowledge the financial support from the Key International (Regional) Joint Research Program (No. 5251101318) and Science and Technology Innovation Plan of Shanghai Science and Technology Commission (No. 22dz1203100).

Author contributions
Weichen Xue: Conceptualization, Methodology, Supervision, Writing - review & editing. Dawei Yan: Investigation, Formal analysis, Writing - original draft. Yan Dai: Investigation, Formal analysis, Supervision, Writing - review & editing.
Funding
The authors disclosed receipt of the following financial support for the research, authorship, and/or publication of this article: The authors acknowledge the financial support from the Key International (Regional) Joint Research Program (No. 5251101318) and Science and Technology Innovation Plan of Shanghai Science and Technology Commission (No. 22dz1203100).
Declaration of conflicting interests
The authors declared no potential conflicts of interest with respect to the research, authorship, and/or publication of this article.
Data Availability Statement
All data, models, and code generated or used during the study appear in the submitted article.