






Abstract
The purpose of the current study is to reveal the effect of corrosion on seismic performance of a self-centering (SC) beam-to-column connection, and thus to provide guidance on durability design of such kind of connections. Accelerated corrosion test was first conducted on the energy dissipation components (dog-bone plates). Extra round bar coupons cut off from the plates were also tested considering the effect of corrosion, cyclic tests at structural member level were then carried out. The effect of the generation of rust layer on friction coefficient of plate surface was studied. Finite element (FE) model was built to predict the seismic behavior of the connection considering corrosion. On the basis of simulation results, the influence of friction coefficient on the seismic performance of the connection was analyzed. The experimental and numerical analysis show that the friction coefficient between the replaceable component and adjacent components increases after corrosion, and thus leads to increased load-carrying and energy dissipation capabilities of the SC connection, but the self-centering ability is compromised. When the friction coefficient is increased from 0.33 to 0.8, the increase of equivalent yield force, equivalent yield displacement, peak load, initial stiffness, cumulative energy dissipation, and residual deformation are 2.71%, 0.26%, 3.12%, 7.28%, 6.88%, 14.52%, respectively.
Keywords
Introduction
In 2003, Bruneau et al. (Bruneau et al., 2003) firstly proposed the concept of seismic resilience of communities. In 2009, at the NEES/E-defense Second-stage Cooperative Research Plan Conference on Earthquake Engineering, American and Japanese scholars first proposed “recoverable functional cities” as the general direction of earthquake engineering cooperation (Lü et al., 2014, 2017). China also regards the construction of resilient cities and the enhancement of modern urban risk prevention and control capabilities as one of the development goals of the 14th Five Year Plan. Therefore, the construction of buildings with low damage or even no damage during earthquakes, which can continue to operate after earthquakes (i.e., earthquake resilient structures), and thus reduce the impact of earthquake disaster on society to the maximum degree, is an important development direction in structural research, and is also an indispensable and critical segment in achieving the goal of resilient city construction. According to the new concept of seismic resilient structure, scholars have equipped steel frame structures with the ability to quickly restore predetermined functions after earthquakes by setting up self-centering energy dissipation devices. Self-centering structure refers to a structure that can automatically return to its initial equilibrium position without residual deformation after the elimination of external forces, and can be realized by: ① using the super-elasticity of shape memory alloy (SMA) to realize self-centering (Chen et al., 2020, 2021, 2022, 2023, 2025a, 2025b, 2022; Fang et al., 2019; Hu et al., 2024; Wang et al., 2021; Wang and Zhu, 2018); ② using pre-stress to return the structure to its initial condition (Chu et al., 2020, 2021, 2022; Wang et al., 2017). Post-tensioned (PT) frame is a kind of frame that realizing self-centering ability by applying pre-stress on the structure. Under earthquake loads, the main structure of a PT frame almost keeps elastic and can’t dissipate energy. So, energy dissipative components should be mounted on PT frames, and thus form structural systems with replaceable damage-concentrated elements. Ricles (Ricles et al., 2001, 2002) and Christopoulos (Christopoulos et al., 2002a, 2002b) firstly proposed the idea of dissipating energy by setting angles on top and bottom flanges of PT connections. Earthquake energy can be dissipated by a gap opening and closing at the beam-column interface, and the angles yielding under cyclic loads. In 2002, Garlock (Garlock, 2003; Garlock et al., 2005) conducted pertinent theory and test investigations on PT connections that dissipate energy by angles. During experiment, the maximum drift ratio was 4%, and the moment-rotation curve obtained by experimental results exhibit typical “flag-shape”.
Recently, LU and SUN (Lu and Sun, 2024) established a simplified analysis model of a friction type SC connection, and verified the rationality of the model. Friction type SC frame structures with four different stories (4, 6, 8, and 10 story) were designed, and incremental dynamic analysis (IDA) was utilized to study the seismic safety and earthquake resilient performance of the SC frame structures with different stories. CAI et al. (Cai et al., 2012) firstly designed a SC prestressed pre-fabricated concrete frame connection on the basis of energy dissipation of steel angles (PTED). To understand mechanical performance of such kind of connections, a systematic experimental study was conducted. After experiment, hysteresis curves, skeleton curves, stiffness degradation, energy dissipation, residual deformation of the specimens were analyzed to characterize the seismic performance of PTED. Experimental results indicate that energy dissipation capacity of the PTED connection is worse than that of ED connection (ED connection refers to as a connection without pre-stressed tendon, and just connected by steel angles). However, the energy dissipation capacity of ED connections is realized at the cost of larger residual deformation. Dissipating earthquake-induced energy by ductility of structural members is not the sole object in seismic design, besides, reducing the residual deformation and hence improve the repairability after earthquake is of equal importance. From this point of view, PTED connection has good SC competence and seismic performance, and has broad development prospects (Cai et al., 2014). According to low-cycle reciprocating loading test results of seven PTEDs, Cai and Meng also investigated the restoring model (Cai and Meng, 2018). Although researchers from various countries have developed many forms of post tensioned prestressing self-centering structure, most of them must be tensioned with prestressed steel bars on construction site. The quality of tensioning cannot be guaranteed, and the engineering efficiency will be impacted. To solve this problem, the team of Prof. Wang at Tongji University (Li and Wang, 2018) proposed a new self-centering steel frame form, in which the pre-stressed steel tendon can be tensioned at factory, and only bolt connection is needed in-situ. In addition, seismic performance of the newly-proposed self-centering beam-to-column connection was studied comprehensively and systematically (Lou et al., 2022; Lou and Wang, 2022; Lou et al., 2023b; Lou et al., 2023a).
Even though self-centering structures have been proposed for several decades, their engineering application is still much limited. Except for cost unfriendly and installation complexity, suspicions of stakeholders and engineers on the reliability and durability is also a critical factor that impede their mass fabrication and application (Fang, 2022). Especially the long-term durability of self-centering structures, has not been thoroughly explored. Among various environmental factors, corrosion is the main problem for such structures after prolonged exposure to the environment (Wang et al., 2022a; Youssef et al., 2019; Zhang et al., 2022b). Compared with conventional structural members such as rigid beam-and-column connections, whose mechanical performance will deteriorate due to corrosion-induced geometrical loss, the load transfer mechanism of self-centering structures is far more complex, and the effect of corrosion may be more unpredictable and pivotal. For instance, the contact and friction conditions between self-centering components could change, which may have a significant impact on the capability of the self-centering device. It should be noted that anti-corrosion means such as coating and greasing are not often effective to be applied on self-centering devices. On one hand, dissipating energy by friction is often an important operating mechanism of most self-centering devices, so roughness of the component surface should be retained. On the other hand, friction will induce coating detachment. Therefore, investigating the basic performance of corroded self-centering structures will not only help to understand their potential long term behaviour and the risk of seismic failure, but also provide guidelines for the maintenance and multi-hazard design of such structures. To the authors’ best knowledge, currently there is only one available study on the performance of self-centering structures after corrosion (Fang et al., 2023). In order to fill this gap, a full-scale experiment is carried out to show how corrosion can alter the hysteretic behavior and failure patterns of typical SC devices. Accelerated corrosion test was first conducted on energy dissipation components (dog-bone plates) of the connection, as well as corresponding round bar coupons cut off from the plates. Cyclic behavior tests at material level and member level were then carried out. In addition, effect of the generation of rust layer on friction coefficient of the plate surface was studied. At last, finite element (FE) model to predict seismic behavior of the connection considering corrosion of the replaceable component was set up. On the basis of simulation results, influence of friction coefficient on seismic performance of the beam-to-column connection with energy dissipative components was analyzed.
Overview of the subject
General configuration
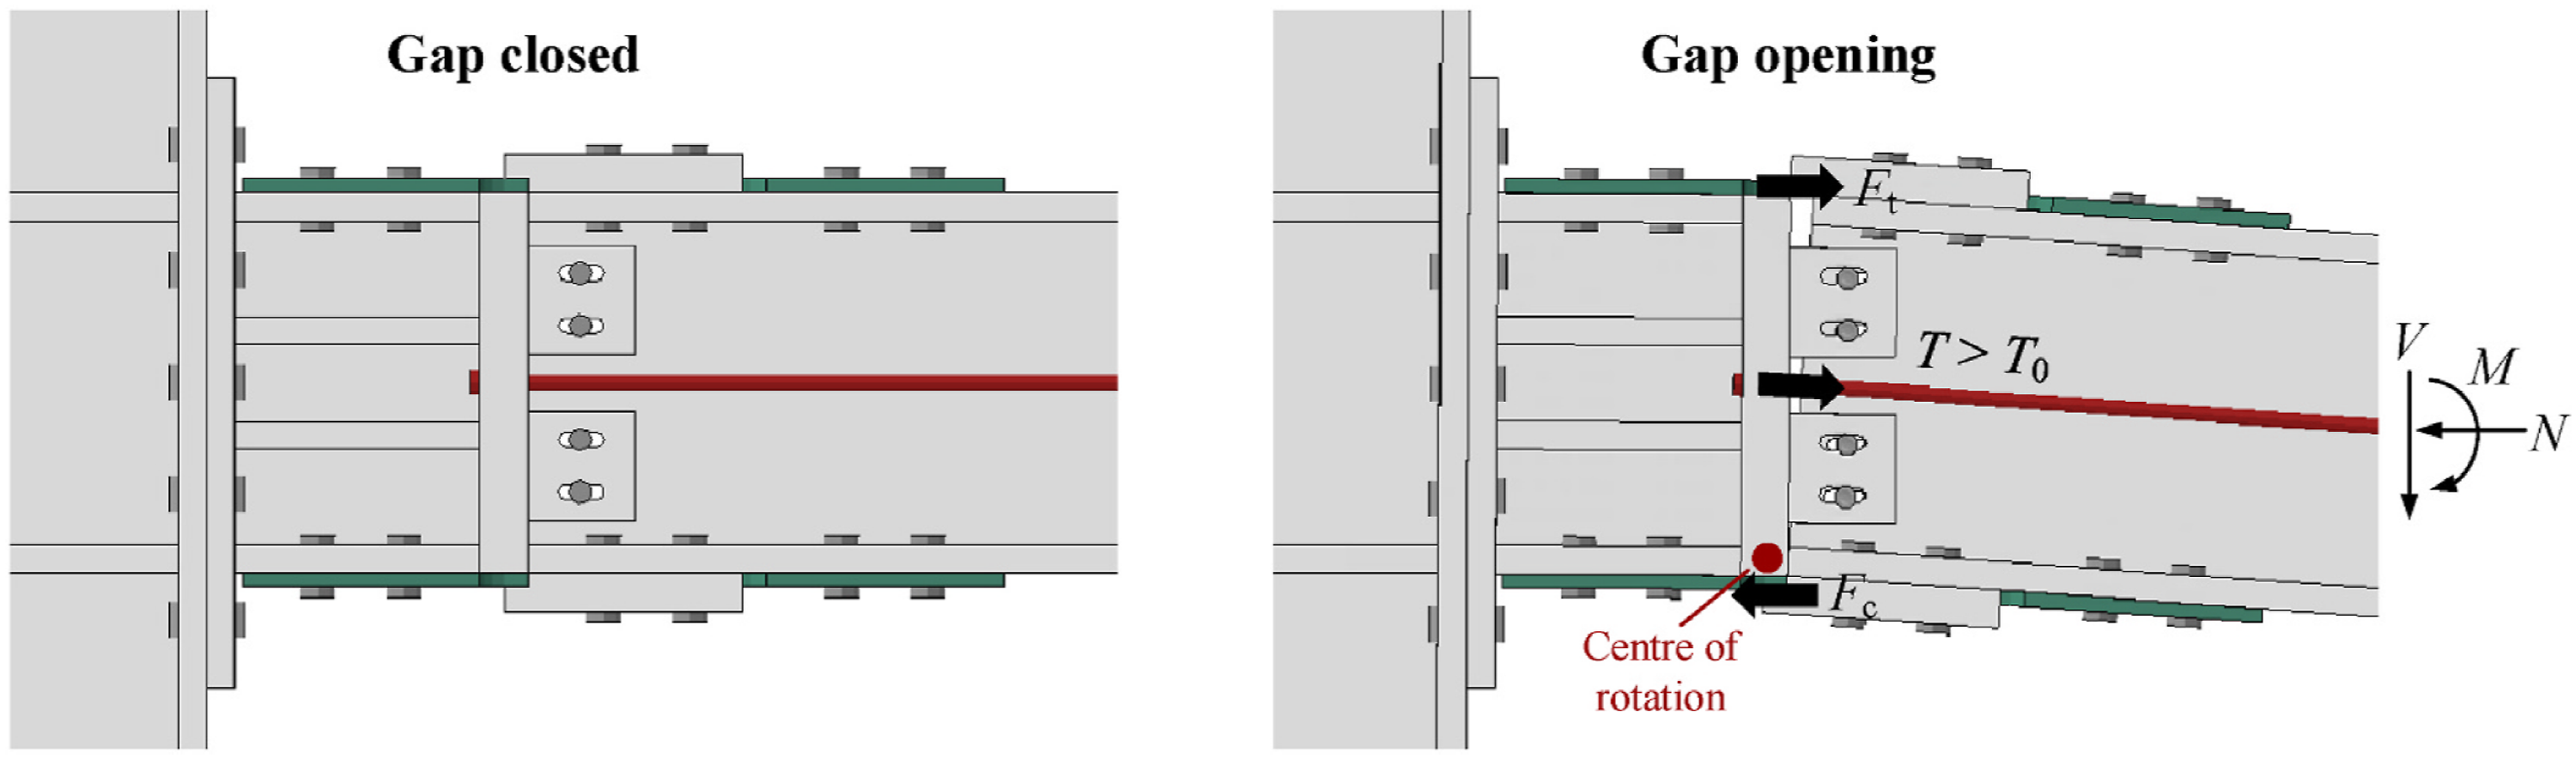
The specimen to be tested is a new-type self-centering beam-to-column connection, which is mainly composed by five parts: H-section steel beam, H-section steel column, pre-stressed tendon, dog-bone energy dissipative plate (replaceable component), and buckling restraint cover plate. Among these components, the pre-stressed tendon provides self-centering capability, the dog-bone plates are designed to absorb the energy generated by earthquake. The energy dissipation is achieved through the friction between the dog bone energy dissipation plate and surrounding components, as well as by converting kinetic energy into its own plastic strain energy under large deformation. To better realize the development of plasticity, instability of the dog-bone plates under large deformation is confined by buckling-restraint cover plates. Configuration of the connection is shown in Figure 1(a) and (b) illustrates assembly process of the whole connection: Step 1, assemble the short transfer beam between the column and the main beam. Step 2, connect the main beam to the assembled connection beam by bolting. Step 3, place the high-strength tendon on the main beam and apply pre-stress. Step 4, install the dog-bone energy-dissipation plates on the beams. Step 5, locate the buckling restraint cover plates outside the energy dissipation plates. Step 6, attach the whole beam to the H-section steel column. The deformation principle of the newly proposed self-centering connection is shown in Figure 2. Under loads with small amplitudes, the pre-assembled main beam and transfer beam perform as an integral part, and the interface between the main beam and the transfer beam remains closed. When external force of the beam end is large enough and the bar force T exceeds the prestressing force T0, a gap between the main beam and the transfer beam is formed, and the center of rotation is located on the flange ends of the beams. The dog-bone energy dissipative plates enter plasticity under tensile/compressive loads with the increase of the gap length, to dissipate the energy generated by earthquake. During the process of unloading, the gap is closed again due to the SC force provided by the PTs. Schematic of the self-centering beam-to-column connection: (a) Configuration (b) Installation procedure. Deformation mechanism of the self-centering connection.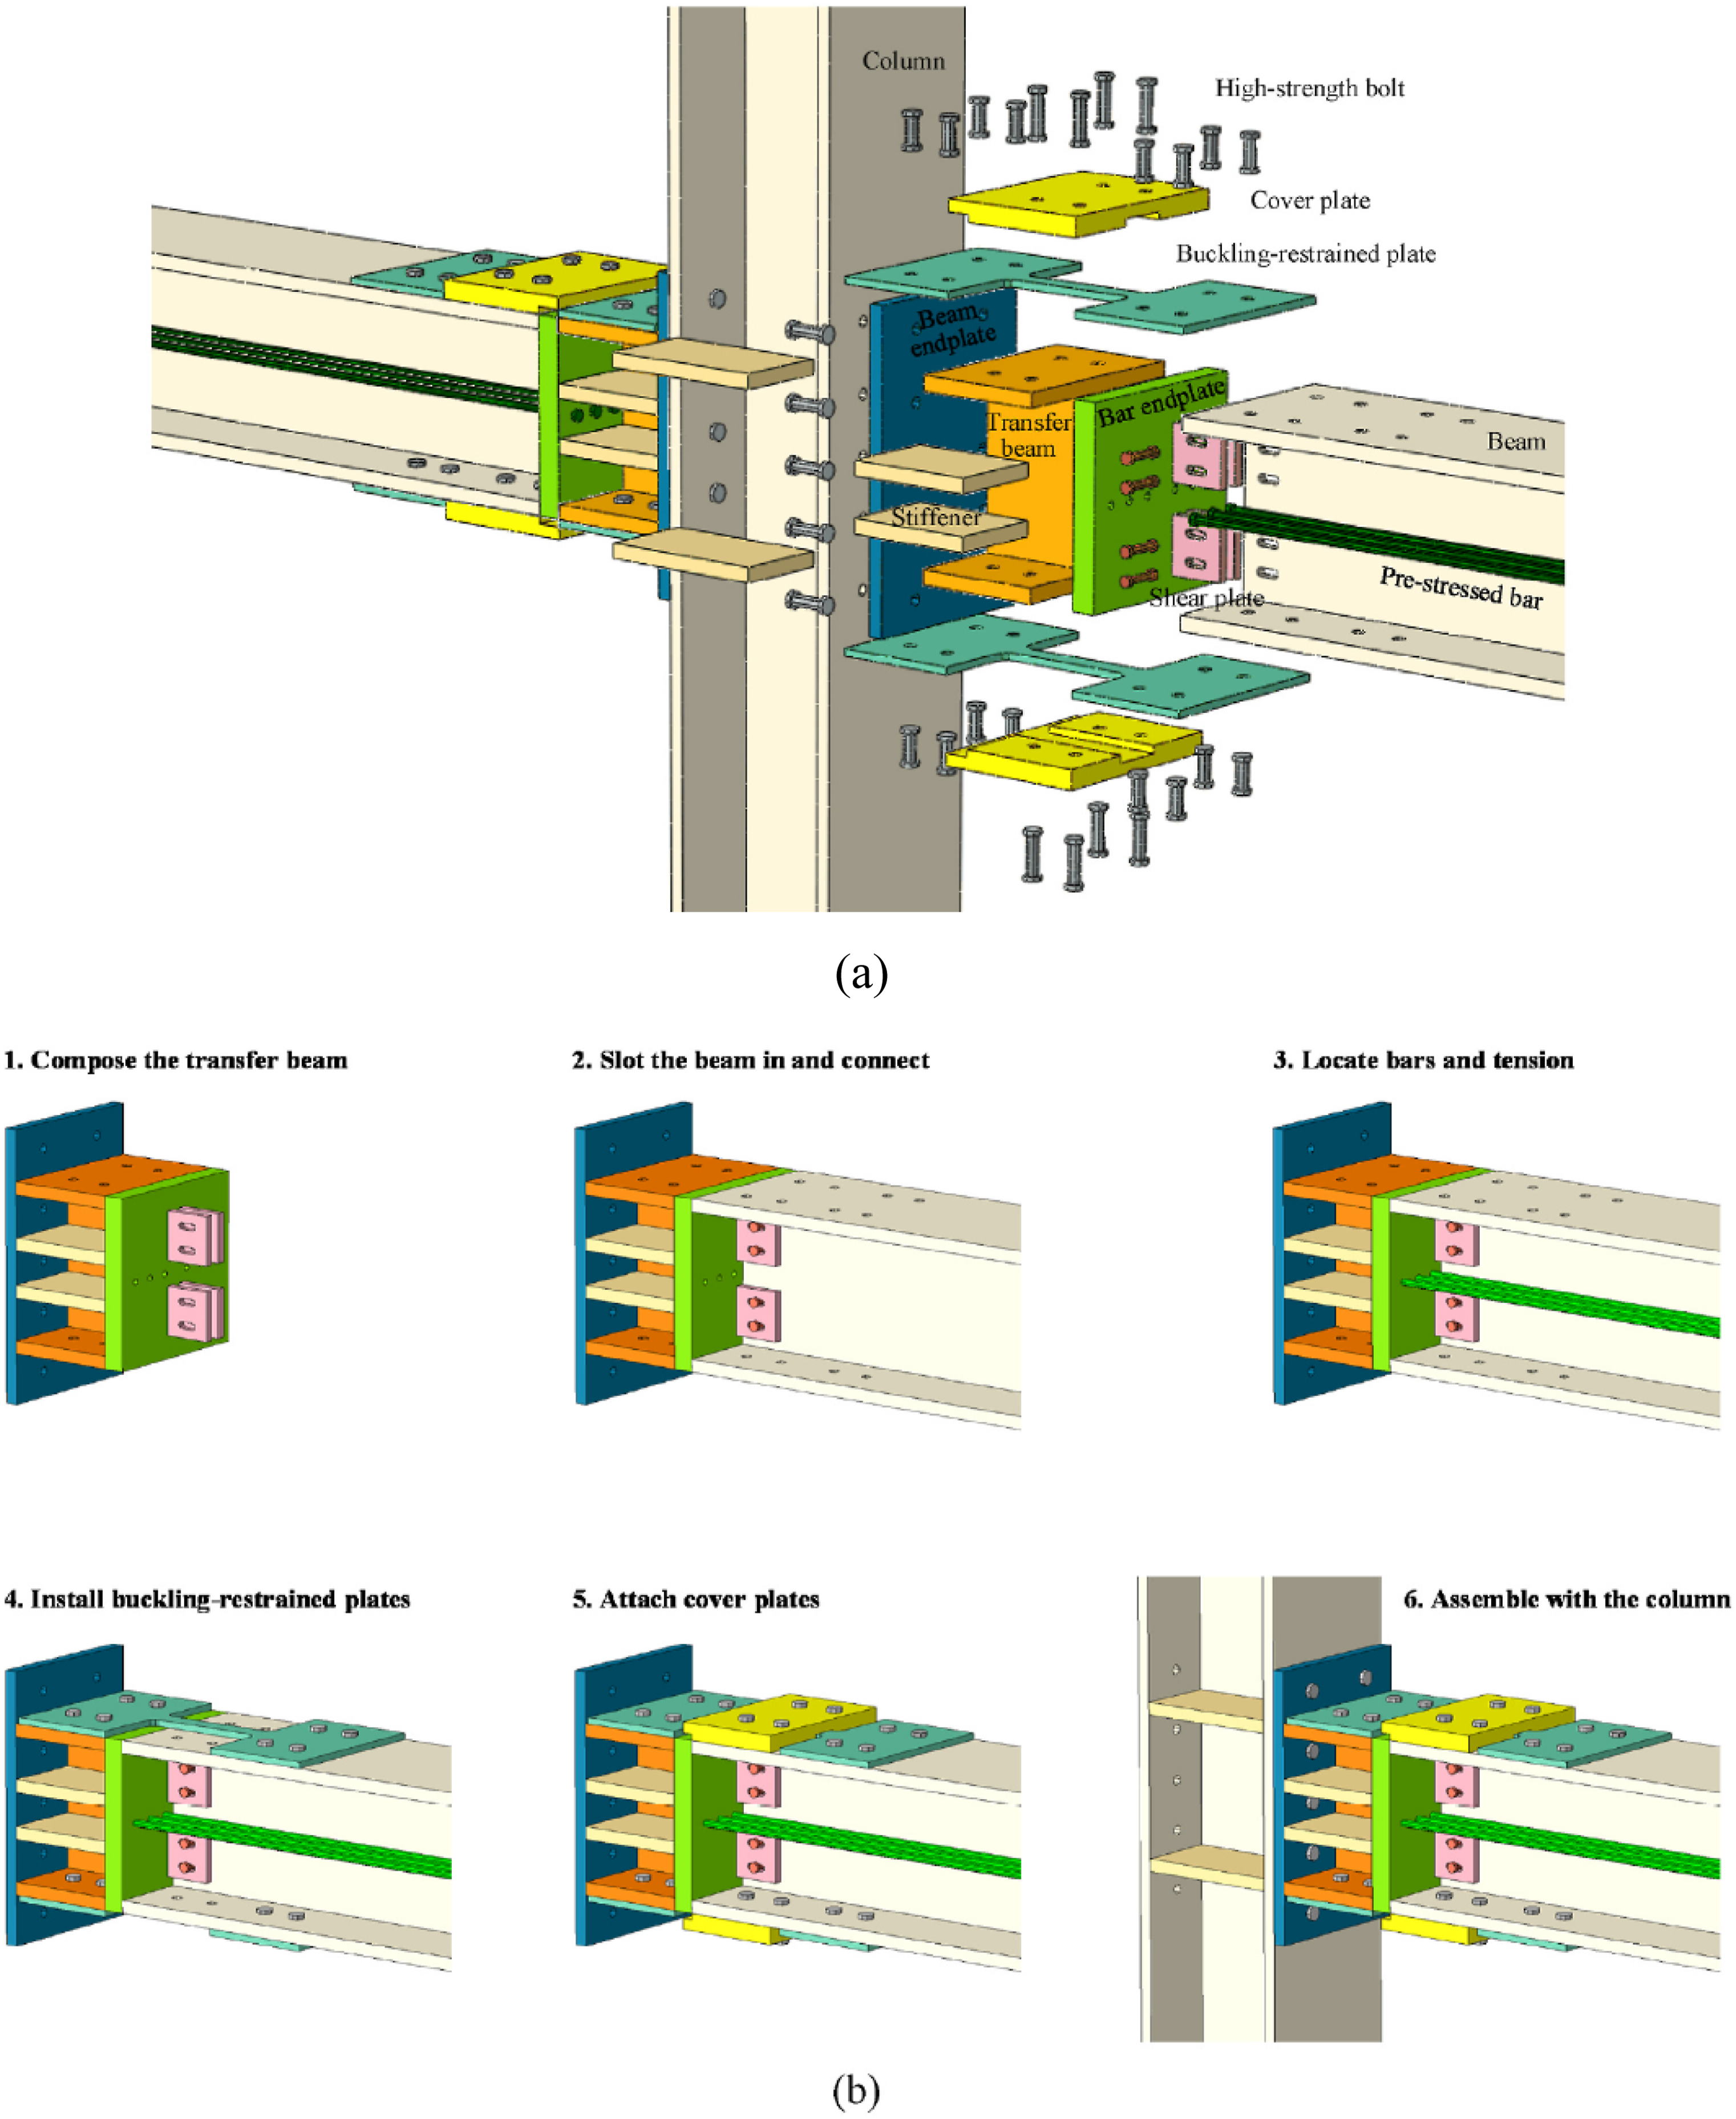
Theoretical performance
On the basis of conceptual design, a simplified analytical model is established to derive the theoretical performance of the proposed connection. The analytical model of a cross-shaped connection in target configuration is illustrated in Figure 3, with pinned boundaries at the column ends and displacement applied anti-symmetrically at the beam ends. It should be noted that all the stiffness discussed below refers to the shear force at the beam end divided by the vertical translation. Before the gap opens, the self-centering connection can be regarded the same as a conventional moment-resisting beam-column connection. Therefore, the initial stiffness k1 of the connection can be directly determined by equation (1): Diagram of analytical model: (a) Overall elevation; (b) Close-up of the gap.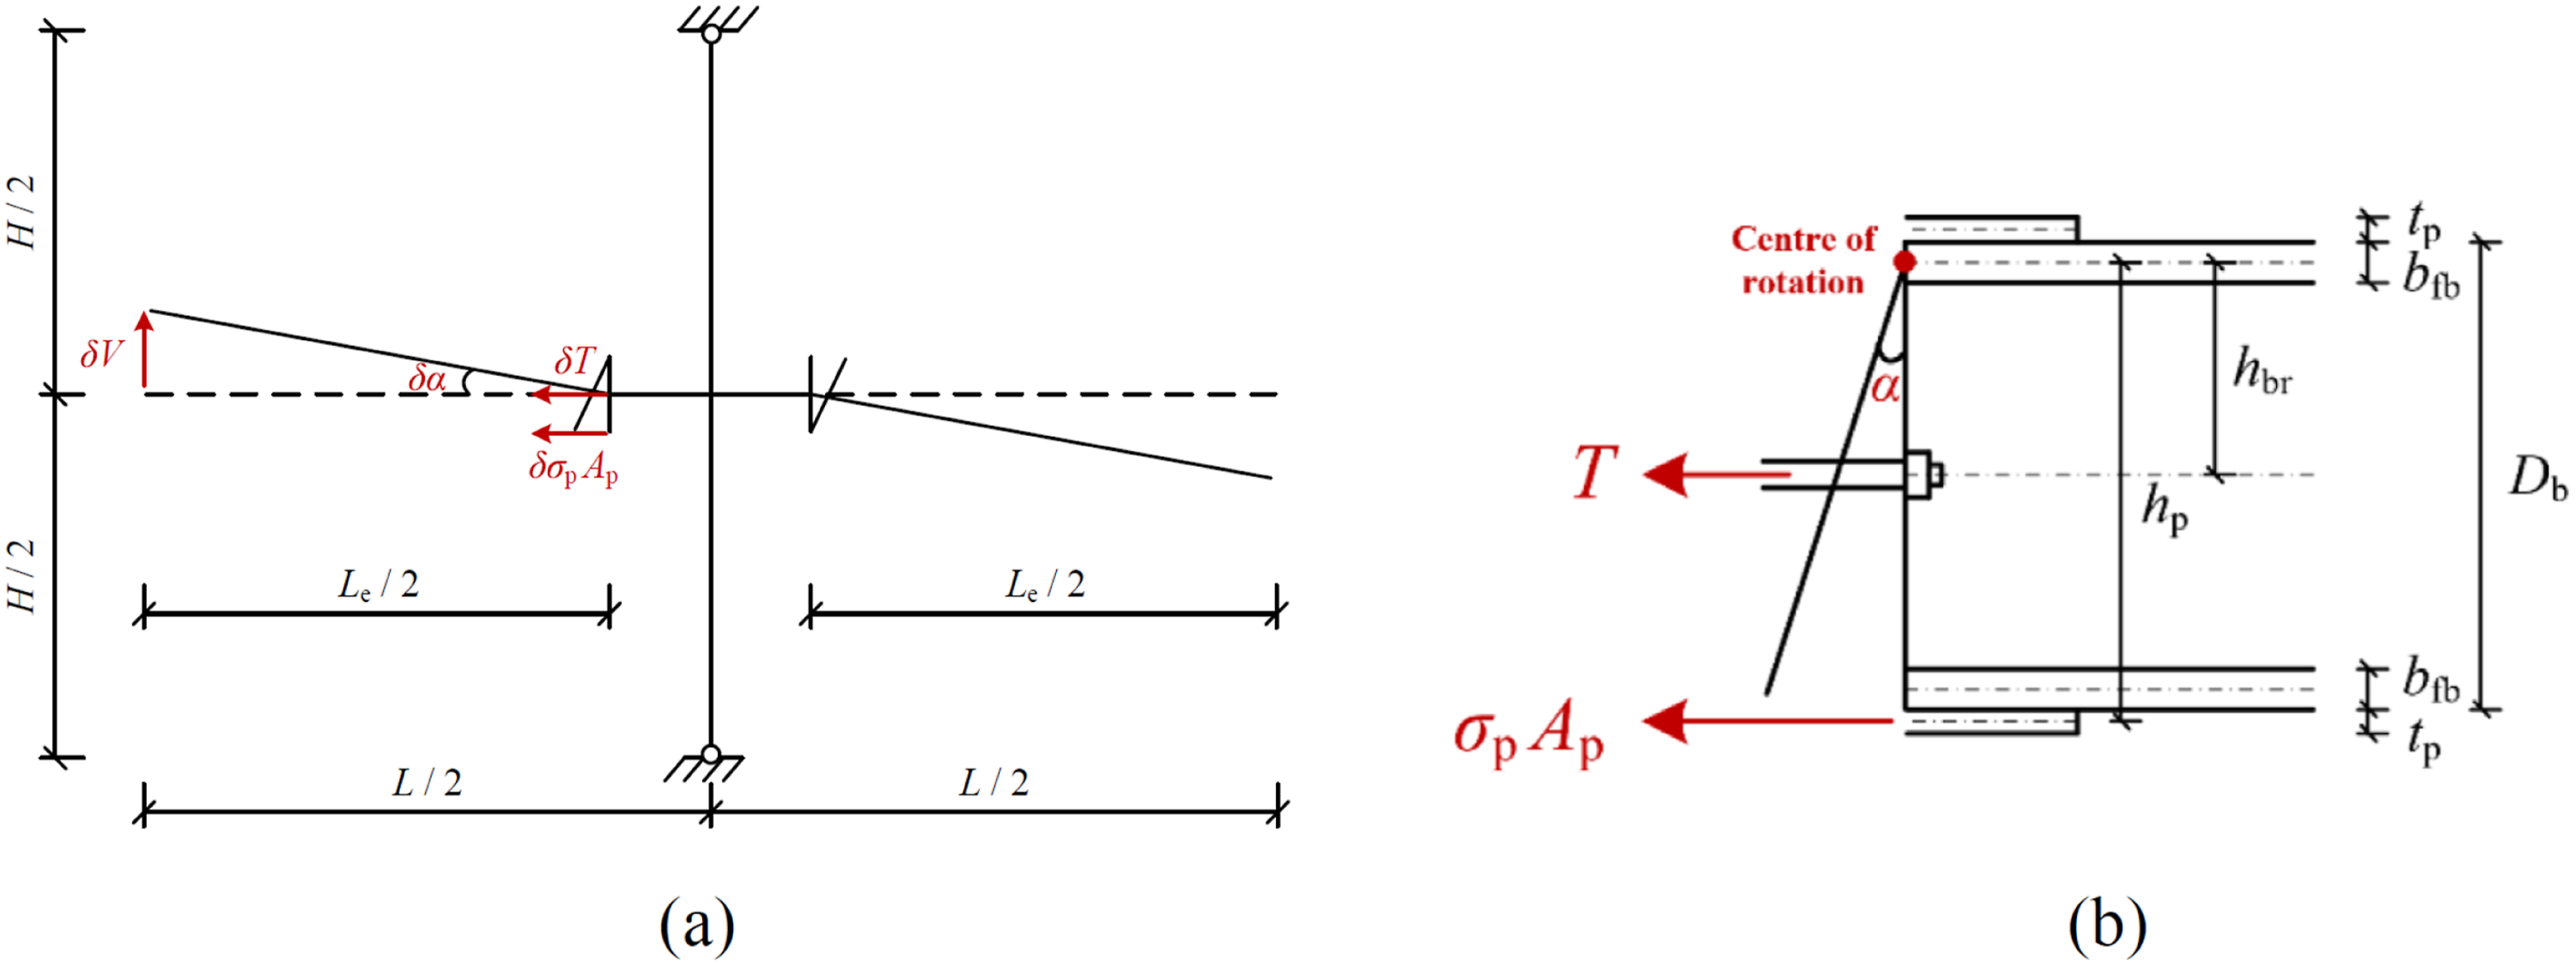



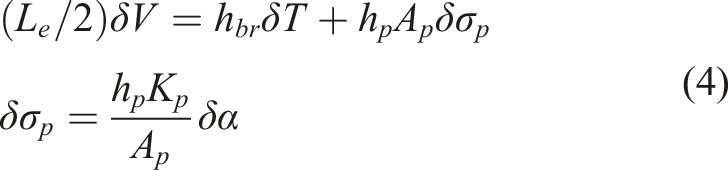
As the gap continues to open, the energy dissipation plate begins to yield instantaneously, and hence provides an additional contribution to the stiffness after yielding. The plate on the tension side of the beam dominates the additional moment at the gap, while the contribution of the plate under compression is neglected for simplification, so the equilibrium can be replaced by:


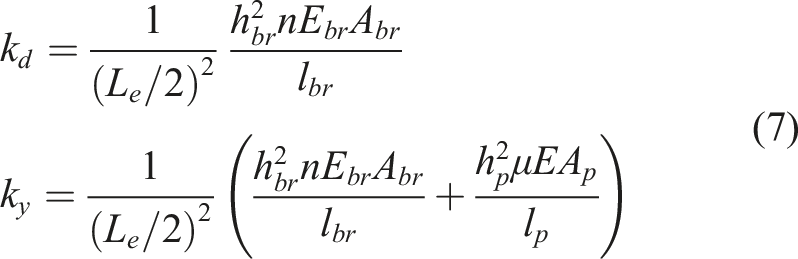


According to the analytical method introduced above, the theoretical behavior of the target connection can be estimated, and predictions will be validated by actual results in the following sections.
Detailed dimensions
A cross-shaped connection with the aforementioned details acts as the specimen to be tested, and the overall dimension is shown by Figure 4(a). The H-section beam and column share the same dimension of H400 × 400 × 20 × 30. Six plain and round pre-stressed bars with a diameter of 16 mm were installed on the beams at both sides, and a pre-stress of 724 MPa was applied to each bar. During the pre-stress application procedure, the process was stopped when the hydraulic pressure of the loading machine reached a certain value, and the relationship between the hydraulic pressure and pre-stress of the tendon has been calibrated by the factory. In addition, to verify if the pre-stress reaches the designated magnitude, a case without energy dissipative plates is included in Ref. (Lou et al., 2023a). In this case, a bilinear load-displacement curve was obtained, and the pre-stress level can be inversely deduced from the inflation of the bilinear curve. Four shear plates with the dimension of 115 × 112 × 20 (Length × Width × Thickness) were welded to the end plate of the transfer beam, and slotted to the web end of the main beam. Notably, the shear plates were only designed to confine the vertical displacement of the main beam, and thus ensure the rotation center is located at the intersection between the main beam and the transfer beam ends. The existence of the shear plates must not change the deformation mechanism of the whole connection. For this purpose, long slotted holes were made in the shear plates and corresponding positions of the beam web, so as to prevent the gap from being blocked. All connections among the cover plate, the energy dissipation plate, the beam flange, the shear plate, and the beam web are made using high-strength bolts. The grades of the bolts selected, as well as the preloads applied on the bolts were set in accordance with those stipulated in Chinese code JGJ 82 (JGJ 82-2011: Technical Specification for High Strength Bolt Connections of Steel Structures, 2011), and more details can be found in (Lou et al., 2023). Figure 4(b) illustrates the detailed sizes of the energy dissipation plate and the buckling restraint cover plate, where the groove width of each cover plate is 10 mm greater than that of the corresponding restraining plate, so as to provide sufficient space for measuring the axial strain. Dimensions of the specimen (a) Overall (b) Local.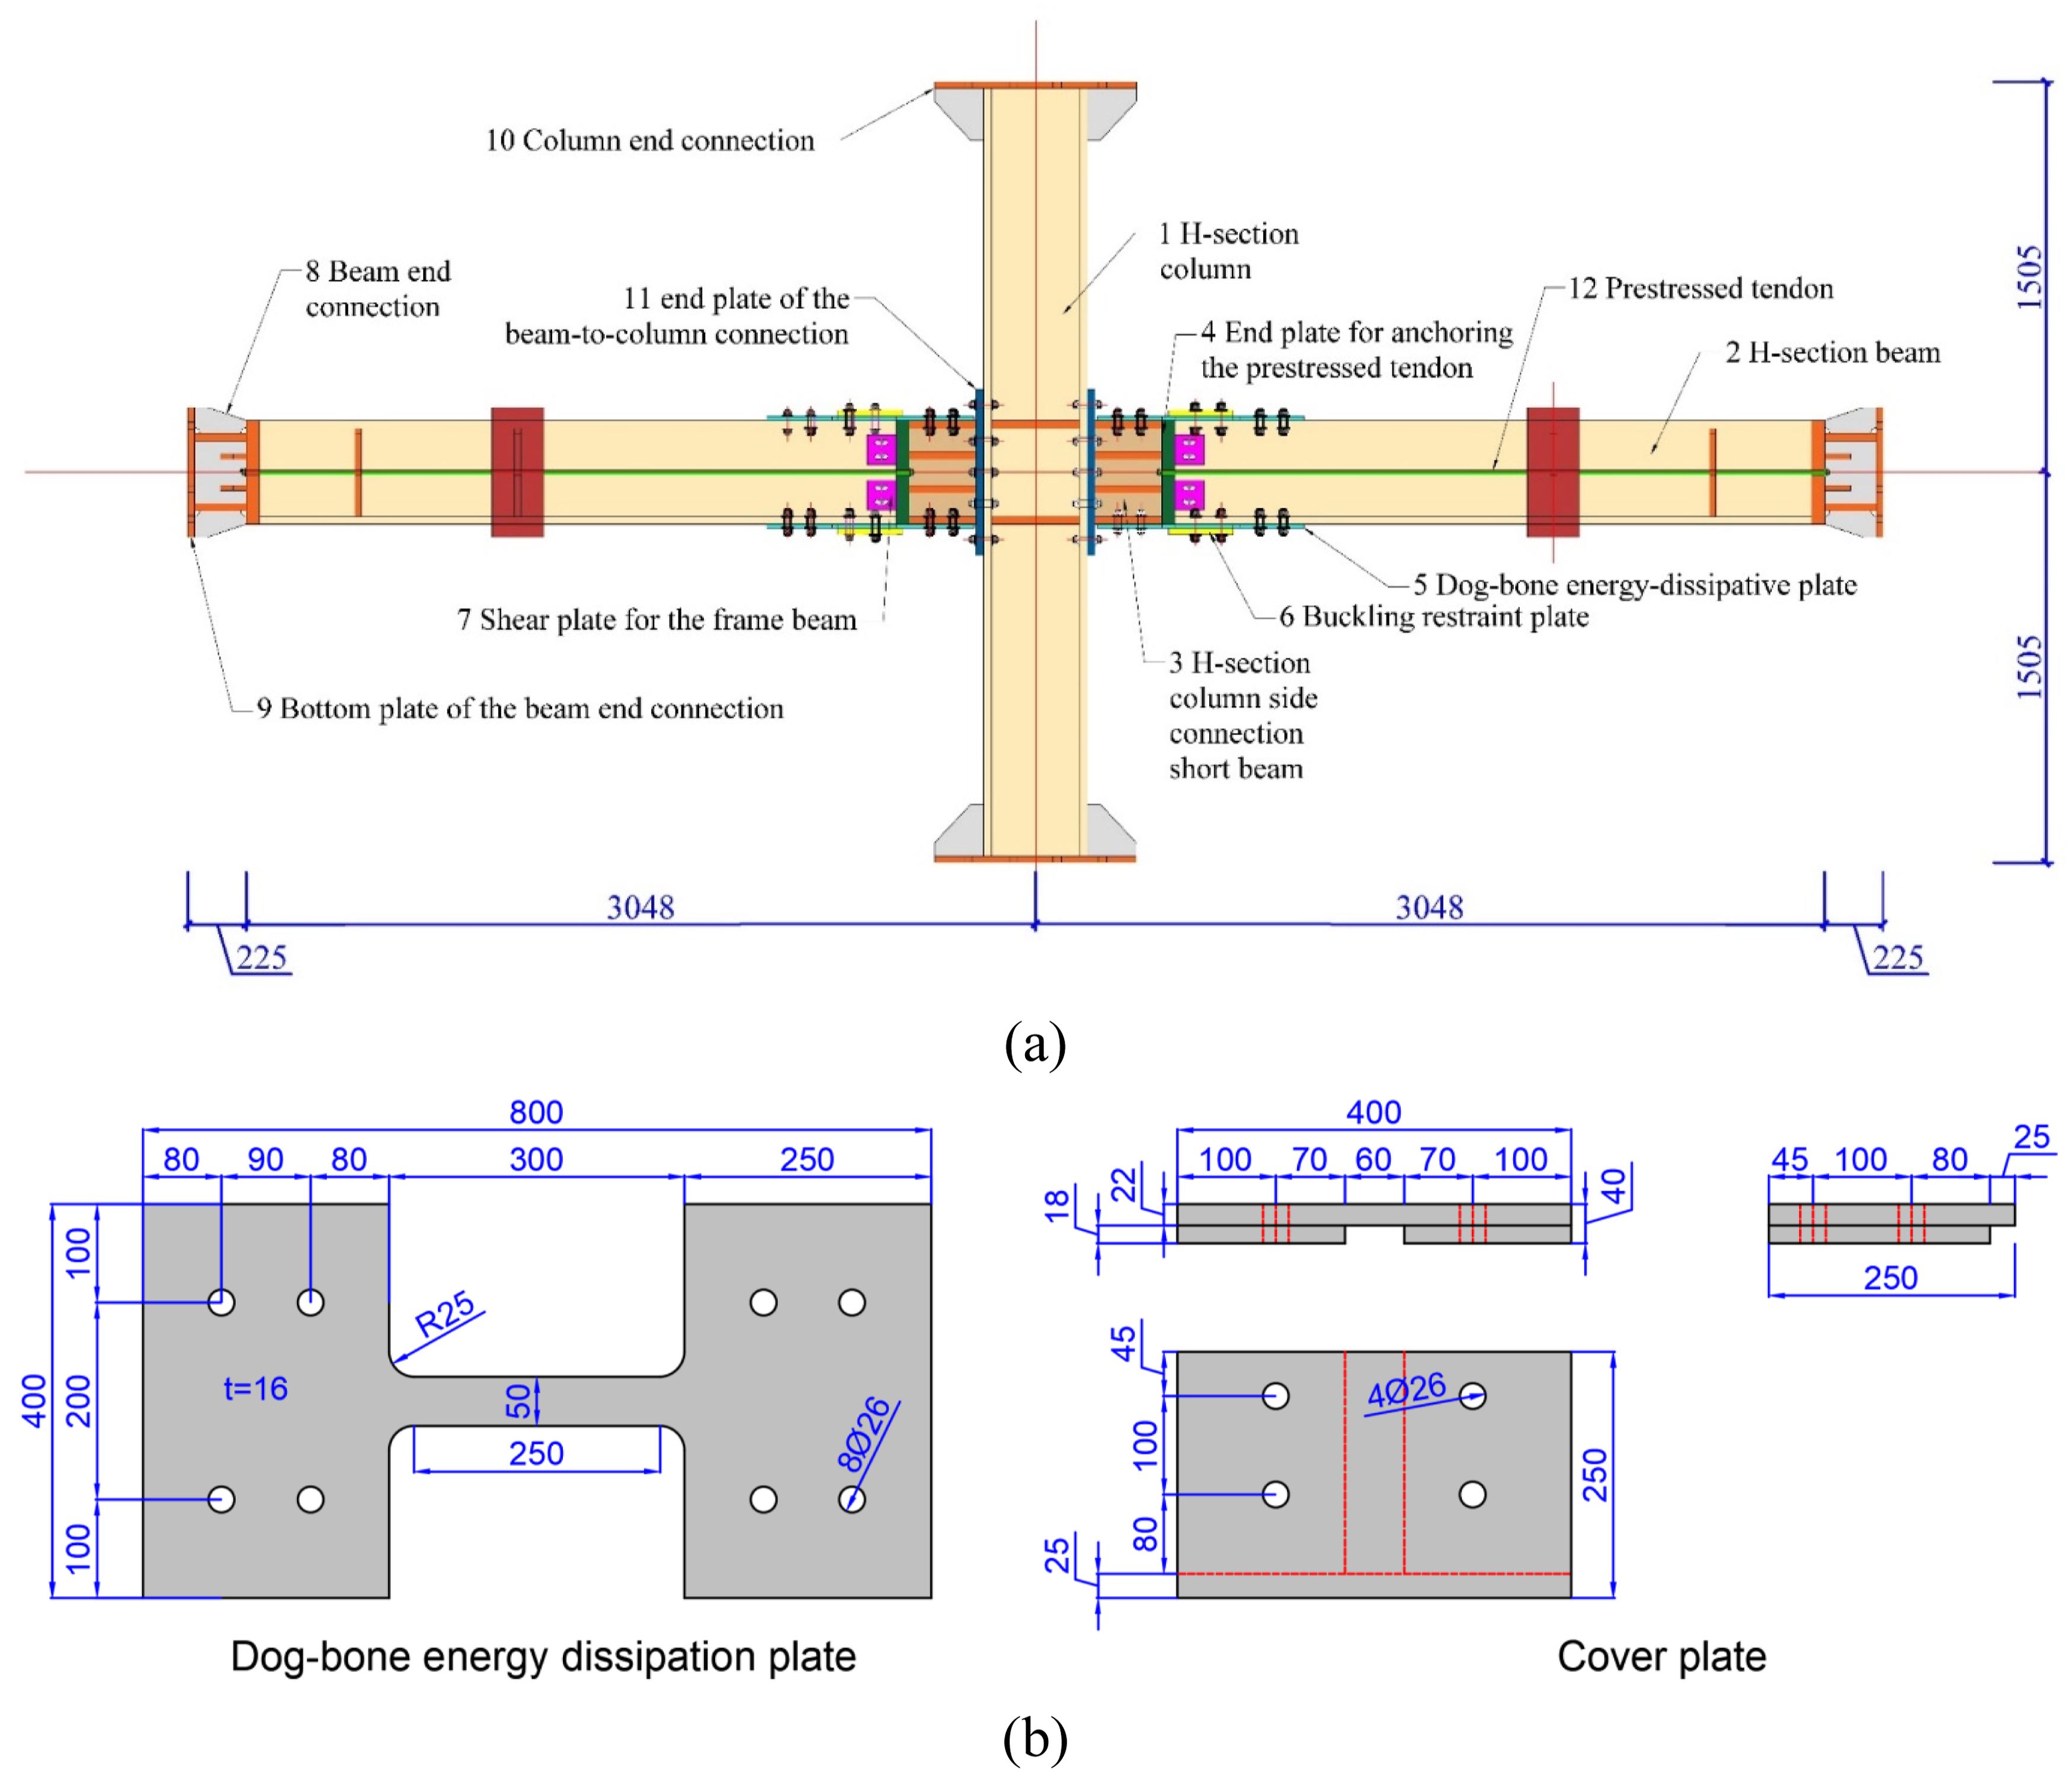
Experimental procedure and results
Accelerated corrosion test
Core assumption
The accelerated corrosion test was only conducted on the energy dissipative plates due to following considerations: (1) Generally, a series of anti-corrosion measurements such as coating will be performed on steel structures before in service. However, since friction-based energy dissipation mechanism exists between the dog-bone energy dissipative plate and the cover plate or the beam flange, so coating protection is not available for the energy dissipative plate. Even if there is coating on the energy dissipative plate, it will also detach under friction. As a result, it is assumed that except for the position of frictional energy dissipation, other positions of the connection are not vulnerable to corrosion. (2) According to previous studies (Lou et al., 2022; Lou and Wang, 2022; Lou, Wang and Izzuddin, 2023; Lou, Wang and Li, 2023), damage of the proposed connection under cyclic loads mainly concentrates on the energy dissipation plates, while other components of the connection, such as the beams, the column, and the pre-stressed tendons can keep elastic. Therefore, it is assumed that these components are rigid enough, even if after slight corrosion. (3) Only performing corrosion on the dog-bone energy dissipative plates, rather than the entire specimen can significantly reduce experimental cost on the condition of compromising a slight degree of experimental accuracy. In light of the above, the accelerated corrosion test was only conducted on the energy dissipative plates.
Testing details
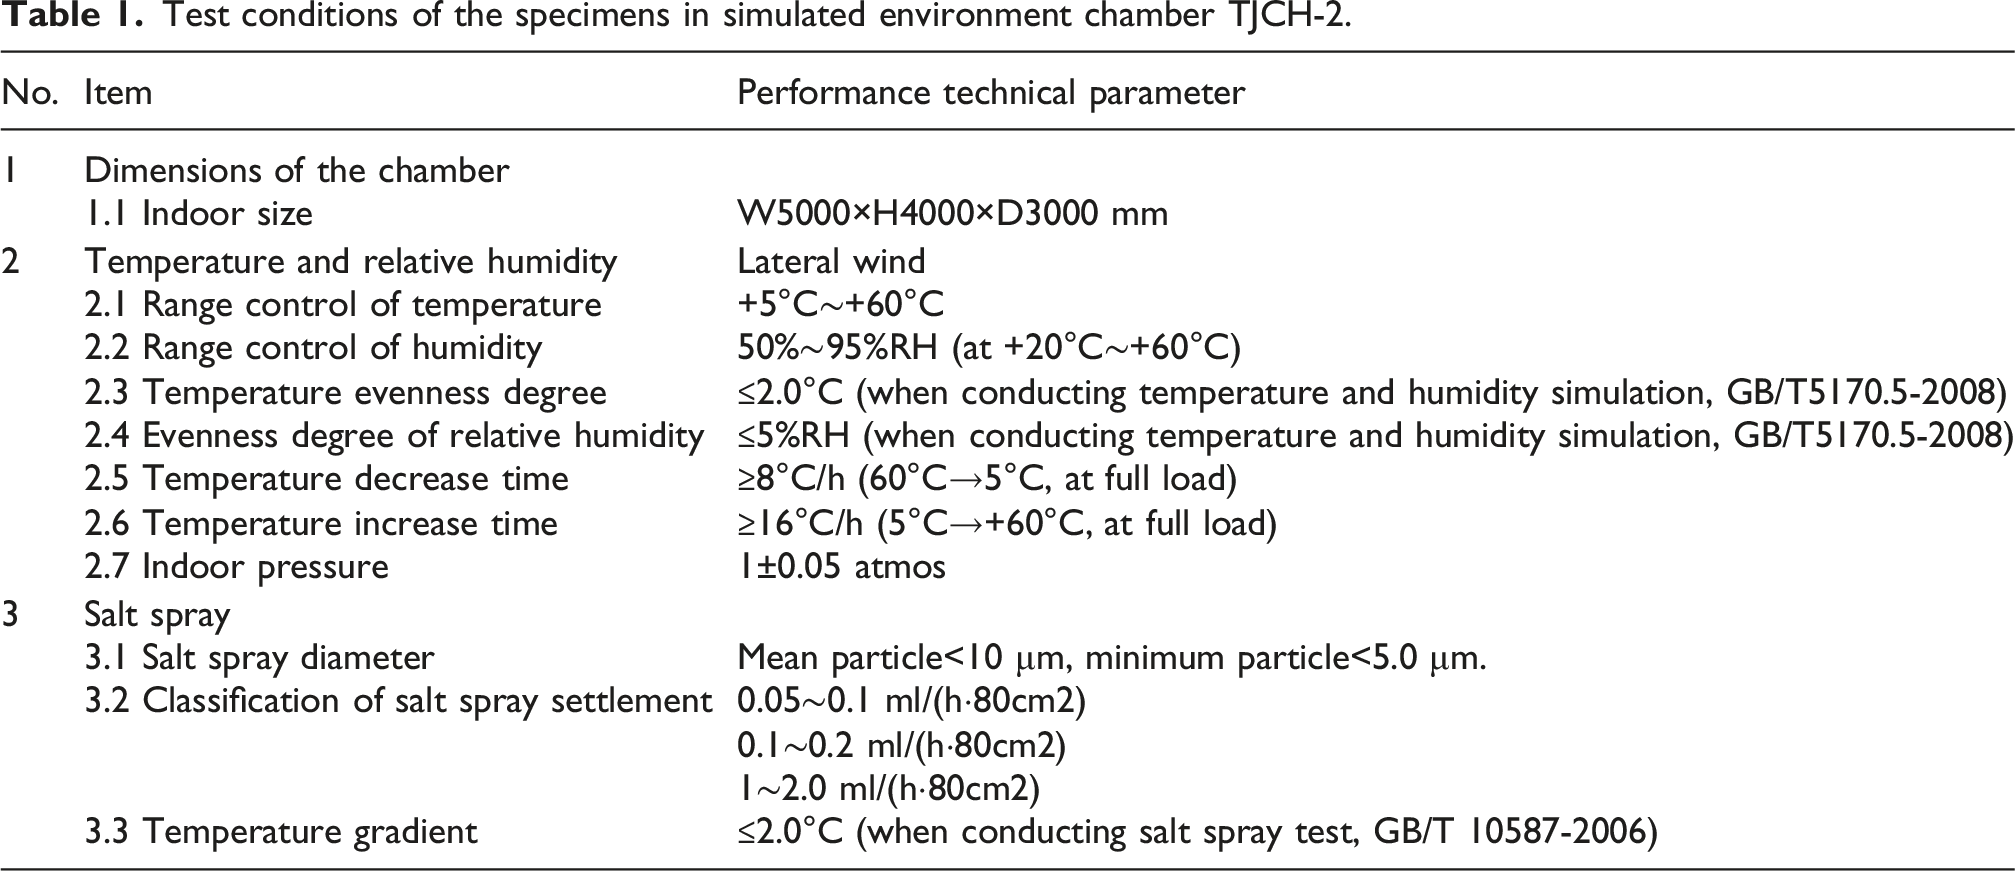
Four plates and six round bar coupons for material property test were placed in an environment chamber, namely, TJCH-2. The round bar coupons were cut from the redundant part of the rectangular plates for fabricating the dog-bone plates, to ensure that the material test results can reflect the true material property of the steel plate precisely. Detailed dimensions of the round bar coupons are demonstrated in Figure 5. Two longer bars and four shorter bars were designed for monotonic tension test and cyclic loading test, respectively. The environment chamber used to conduct the accelerated corrosion tests mainly simulates marine atmosphere environment, and the simulated environment factors include temperature, humidity, and salt spray. Detailed testing conditions are listed in Table 1. The test started from Jan 13, 2023, and ended at April 13, 2023. Subtracting the shutdown time of the salt spray chamber, the effective corrosion time period is about 1,600h. Topographies of the specimens before and after neutral salt spray (NSS) tests can be found in Figure 6. Dimensions of the coupons for material property test (a) Monotonic tensile coupon (b) Cyclic loaded coupon. Test conditions of the specimens in simulated environment chamber TJCH-2. Photos of the specimens before and after corrosion.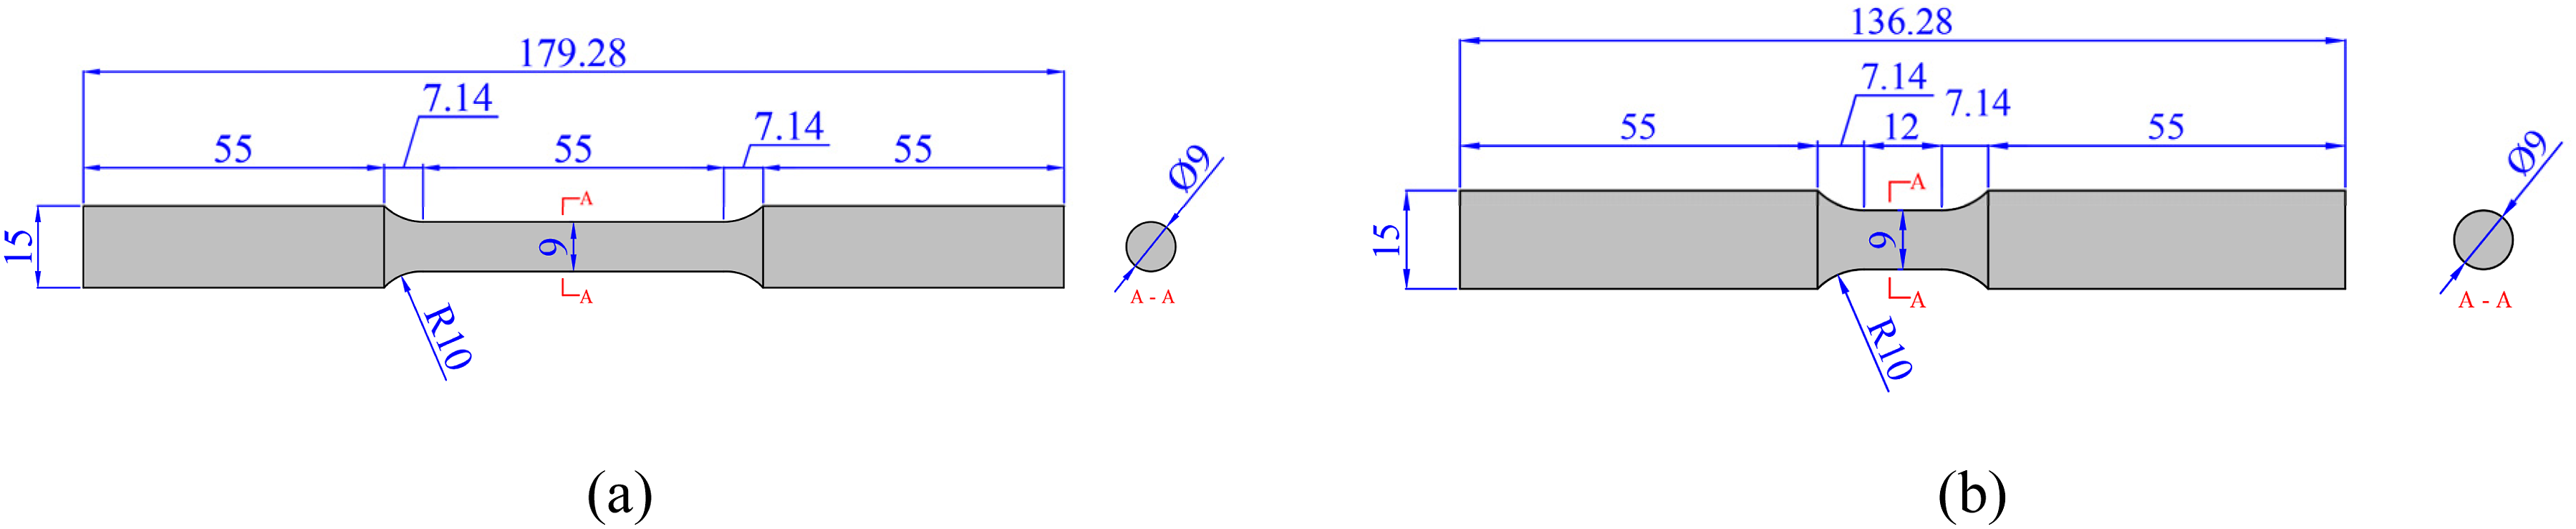

Material property test
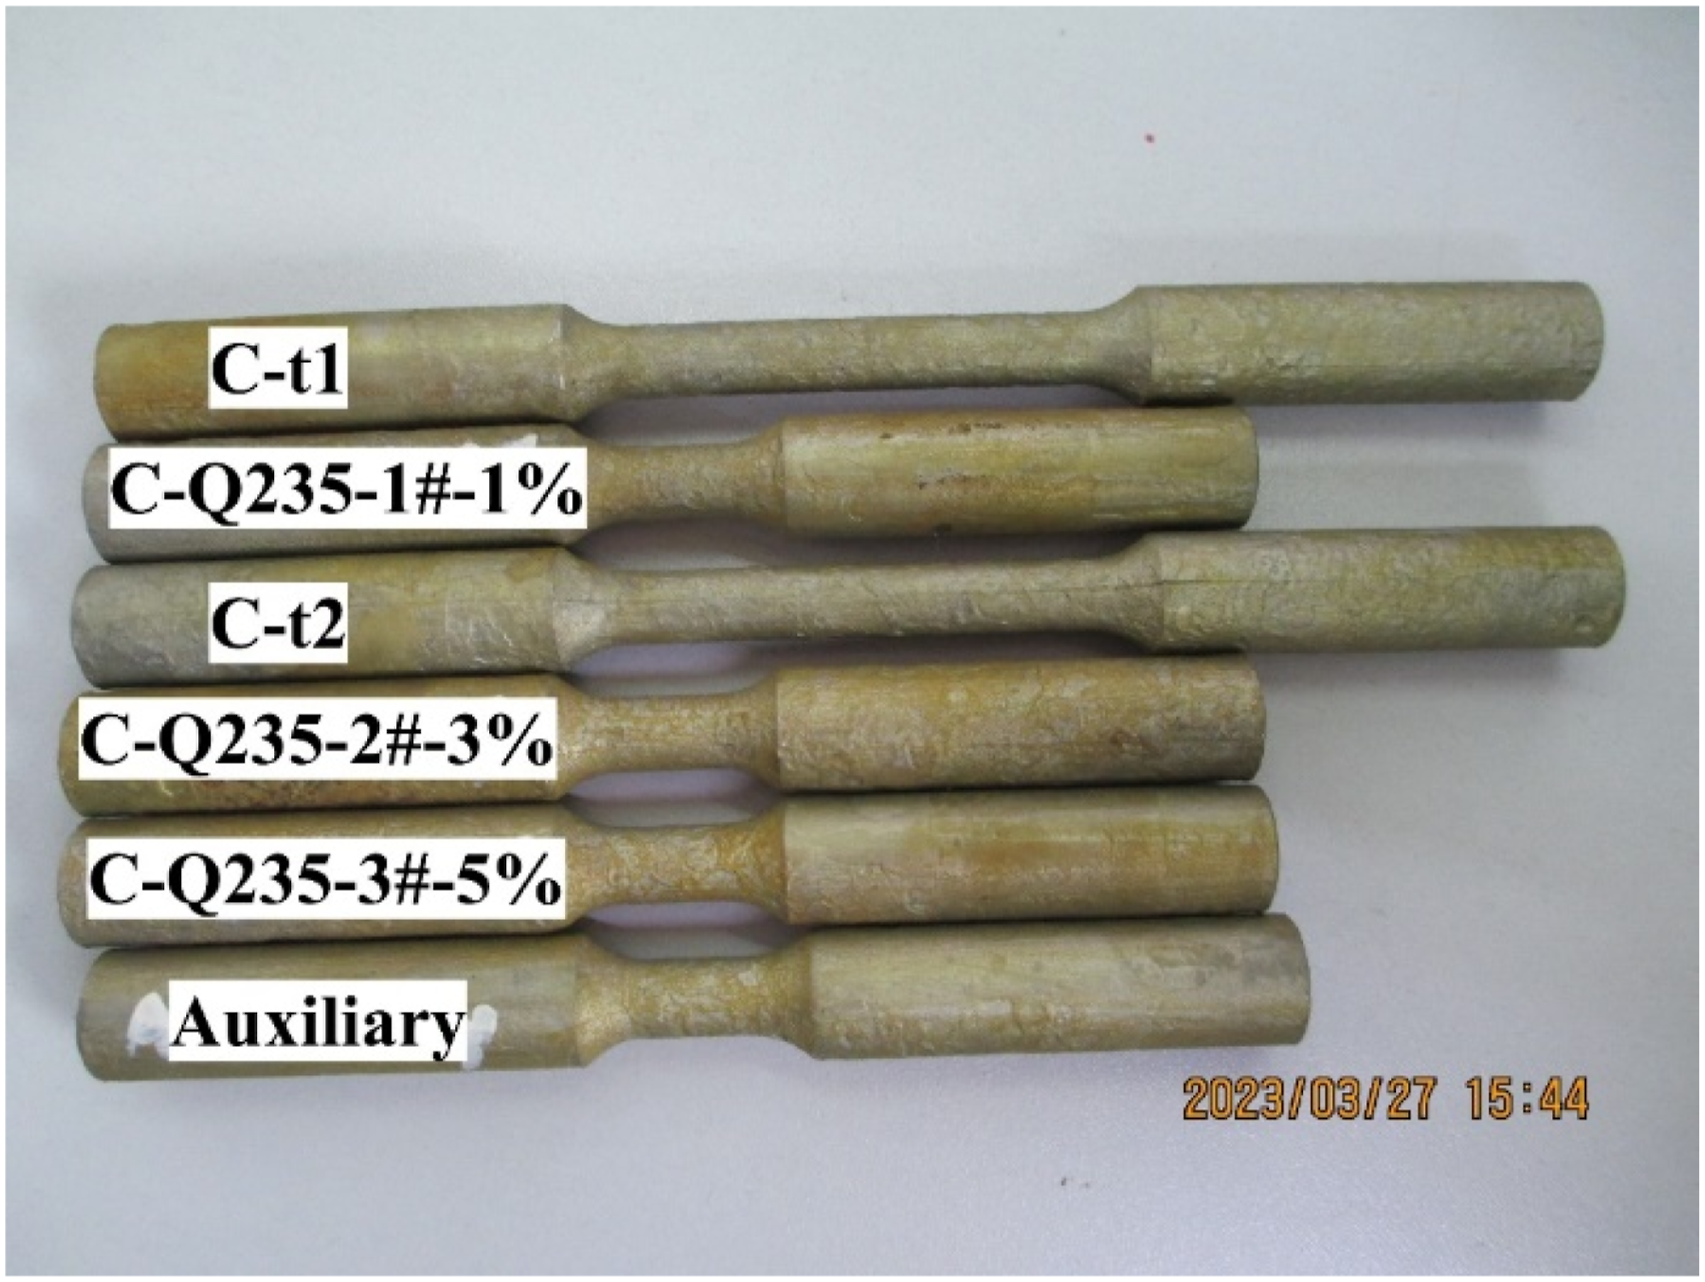
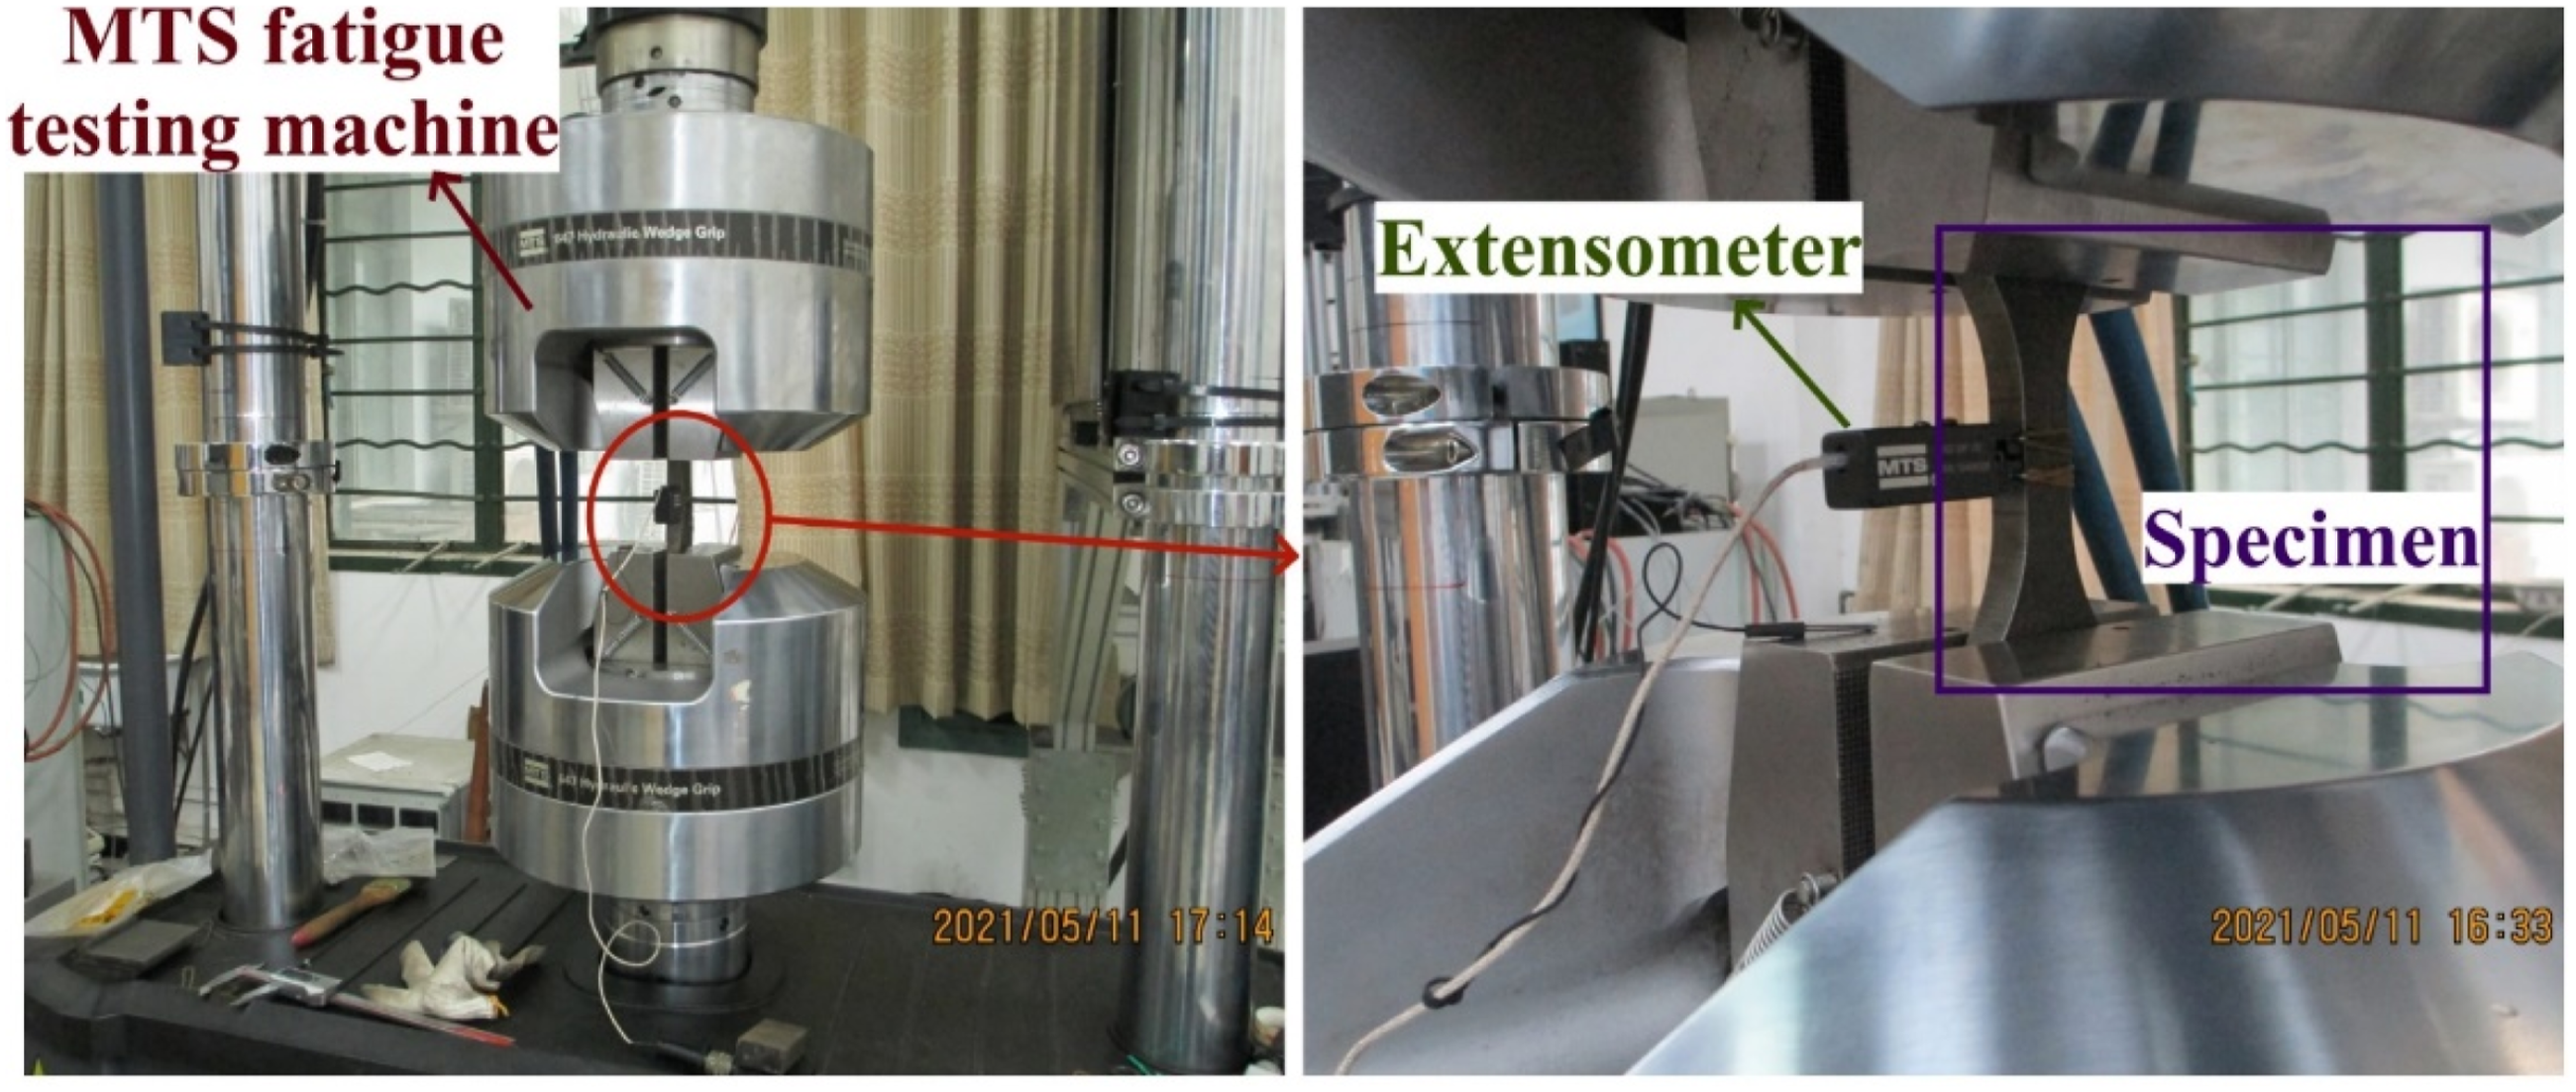
The Q235 round bar coupons are labelled as t1, t2, Q235-1#, Q235-2#, and Q235-3#, where t1 and t2 were designed for monotonic tensile tests, while Specimens Q235-1#, Q235-2#, and Q235-3# were designed for cyclic tests, with loading amplitudes of ±1%, ±3%, and ±5%, respectively (Figure 7). The corroded counterparts are labeled as C-t1, C-t2, C-Q235-1#, C-Q235-2#, and C-Q235-3#, and are subjected to the same loads of the uncorroded coupons. It is noted that the rust layers of the corroded coupons were removed carefully before mechanical testing (Figure 8). See the authors’ previous works (Zhang et al., 2022a, 2024) for more details about the rust removal process. The material property tests were carried out at the School of Ocean and Civil Engineering (OCE), Shanghai Jiao Tong University, and the cyclic loading processes were carried out by an MTS fatigue testing machine with the ultimate capacity of 500 kN. Strain control method was adopted to conduct the loading process, with an approximate loading velocity of 0.3%/s, the strain data was measured and recorded by an extensometer (gauge length = 8 mm), as displayed in Figure 9. Loading protocol. Specimen preparation. Experimental setup.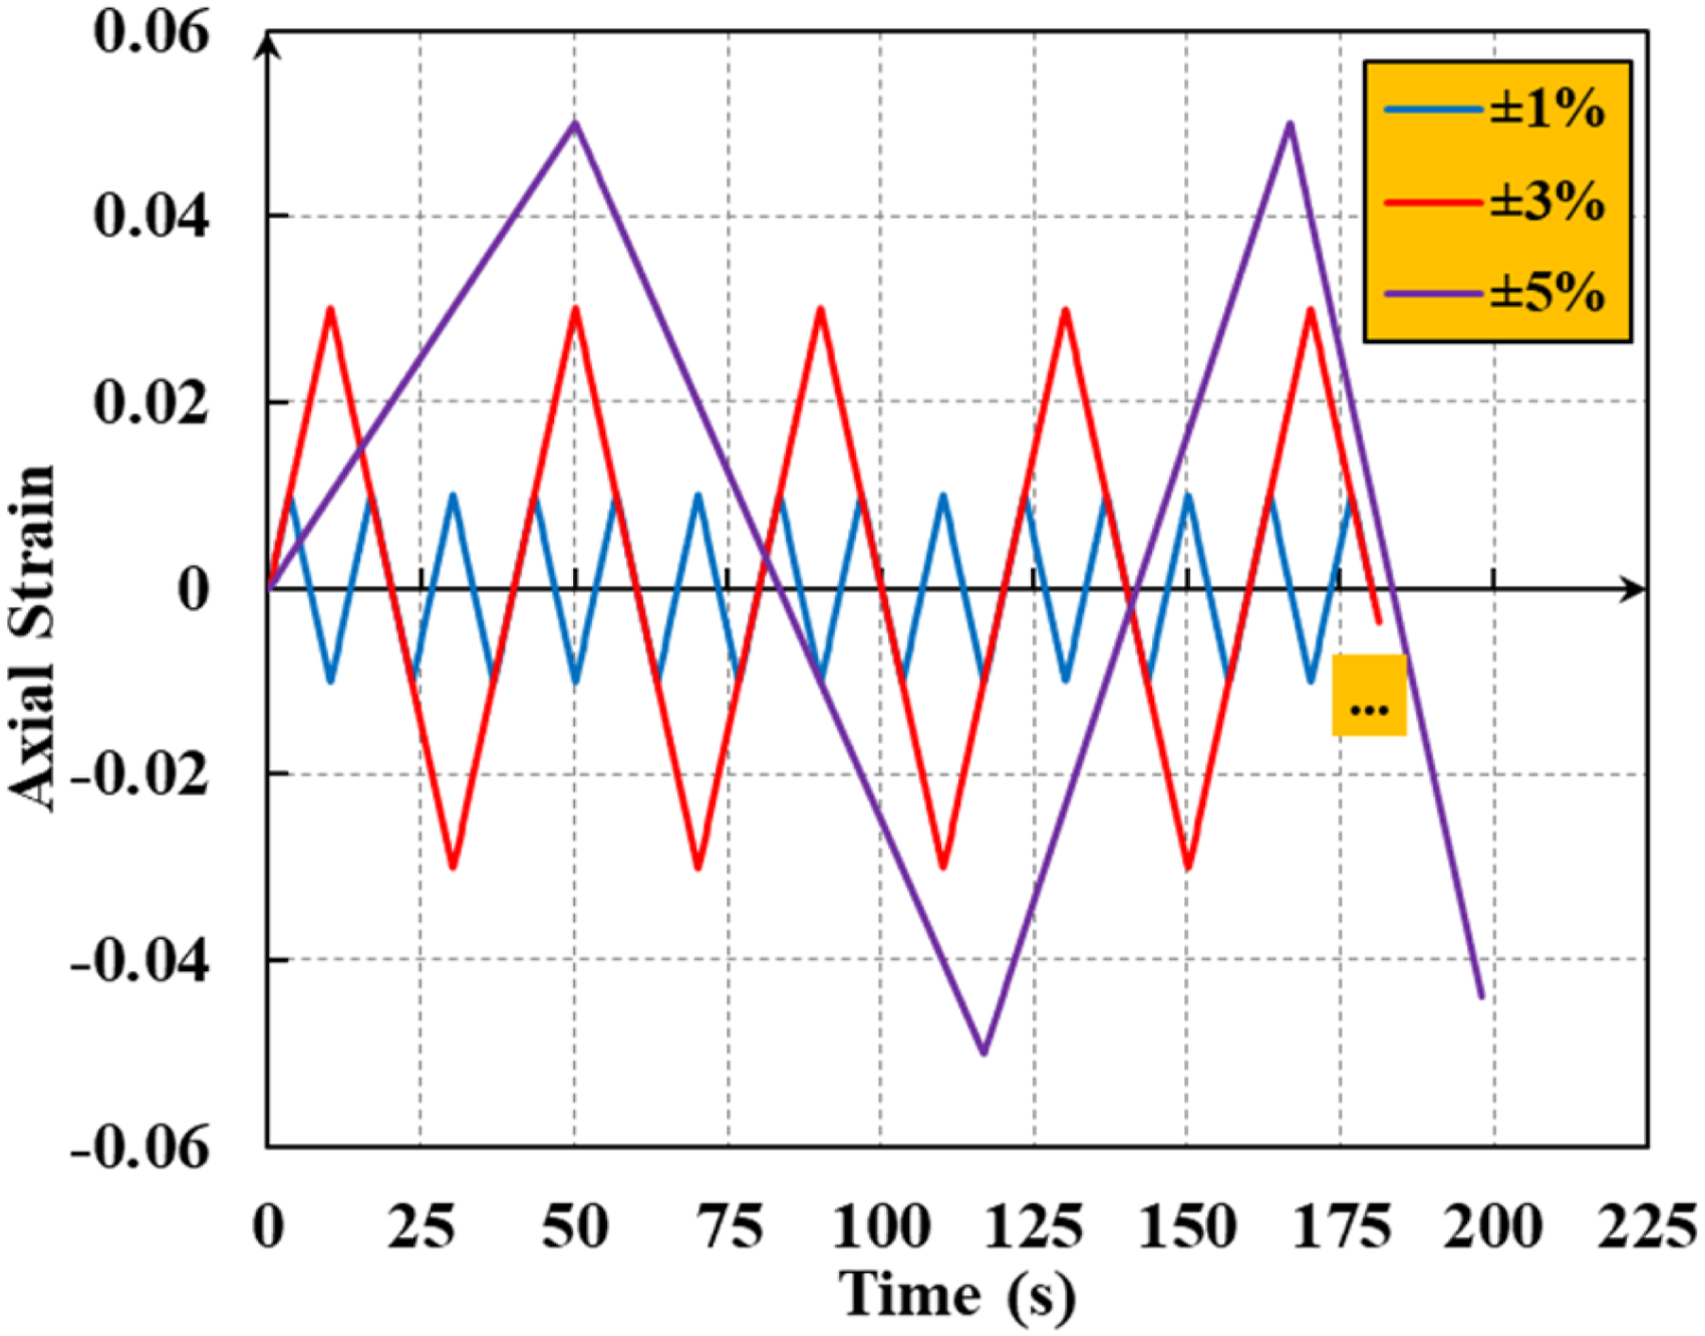
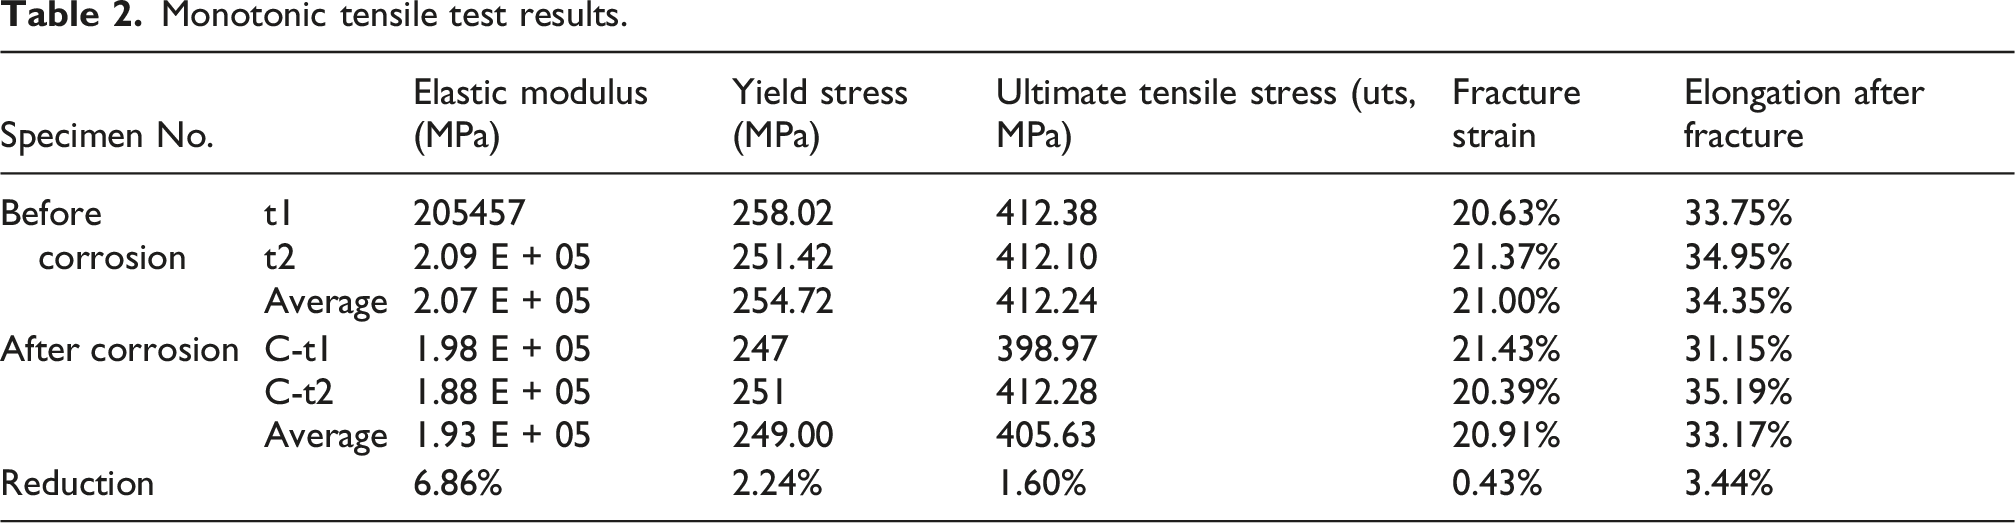
After testing, stress-strain curves of the gauged regions of the four uncorroded coupons and four corroded coupons are plotted in Figure 10(a) –(d) and (a1)–(d1), respectively. For the cyclic loaded cases, since the stress hardening phenomenon vanishes gradually and the hysteresis curve tends to stabilization after the 2nd cycle, so only the first two cycles of stress-strain data were shown in Figure 10. According to Figure 10(a) and (a1), which depict the complete stress-strain curves of the two monotonic loaded coupons, the basic mechanical property parameters of Q235 steel before and after corrosion were calculated and summarized in Table 2, it can be found that after 1,600h accelerated corrosion, all mechanical property indices of the steel experience a certain extent of degradation, where Young’s modulus exhibits the greatest deterioration degree, with the value of 6.86%, followed by elongation ratio after fracture (3.44%), while the influence of corrosion on fracture strain is much marginal, only 0.43% of deterioration is observed after corrosion. In addition, the stress-strain curves of t1 and t2 almost overlap with each other. However, the curves of C-t1 and C-t2 show larger discrepancy, indicating corrosion will lead to uncertainty and discreteness of mechanical performance. For the six coupons subjected to cyclic loads (Figure 10(b)∼(d) and (b1)∼(d1)), the hysteresis relationship will be discussed further in following sections. Stress-strain curves of the round bar coupons under monotonic and cyclic loads. Monotonic tensile test results.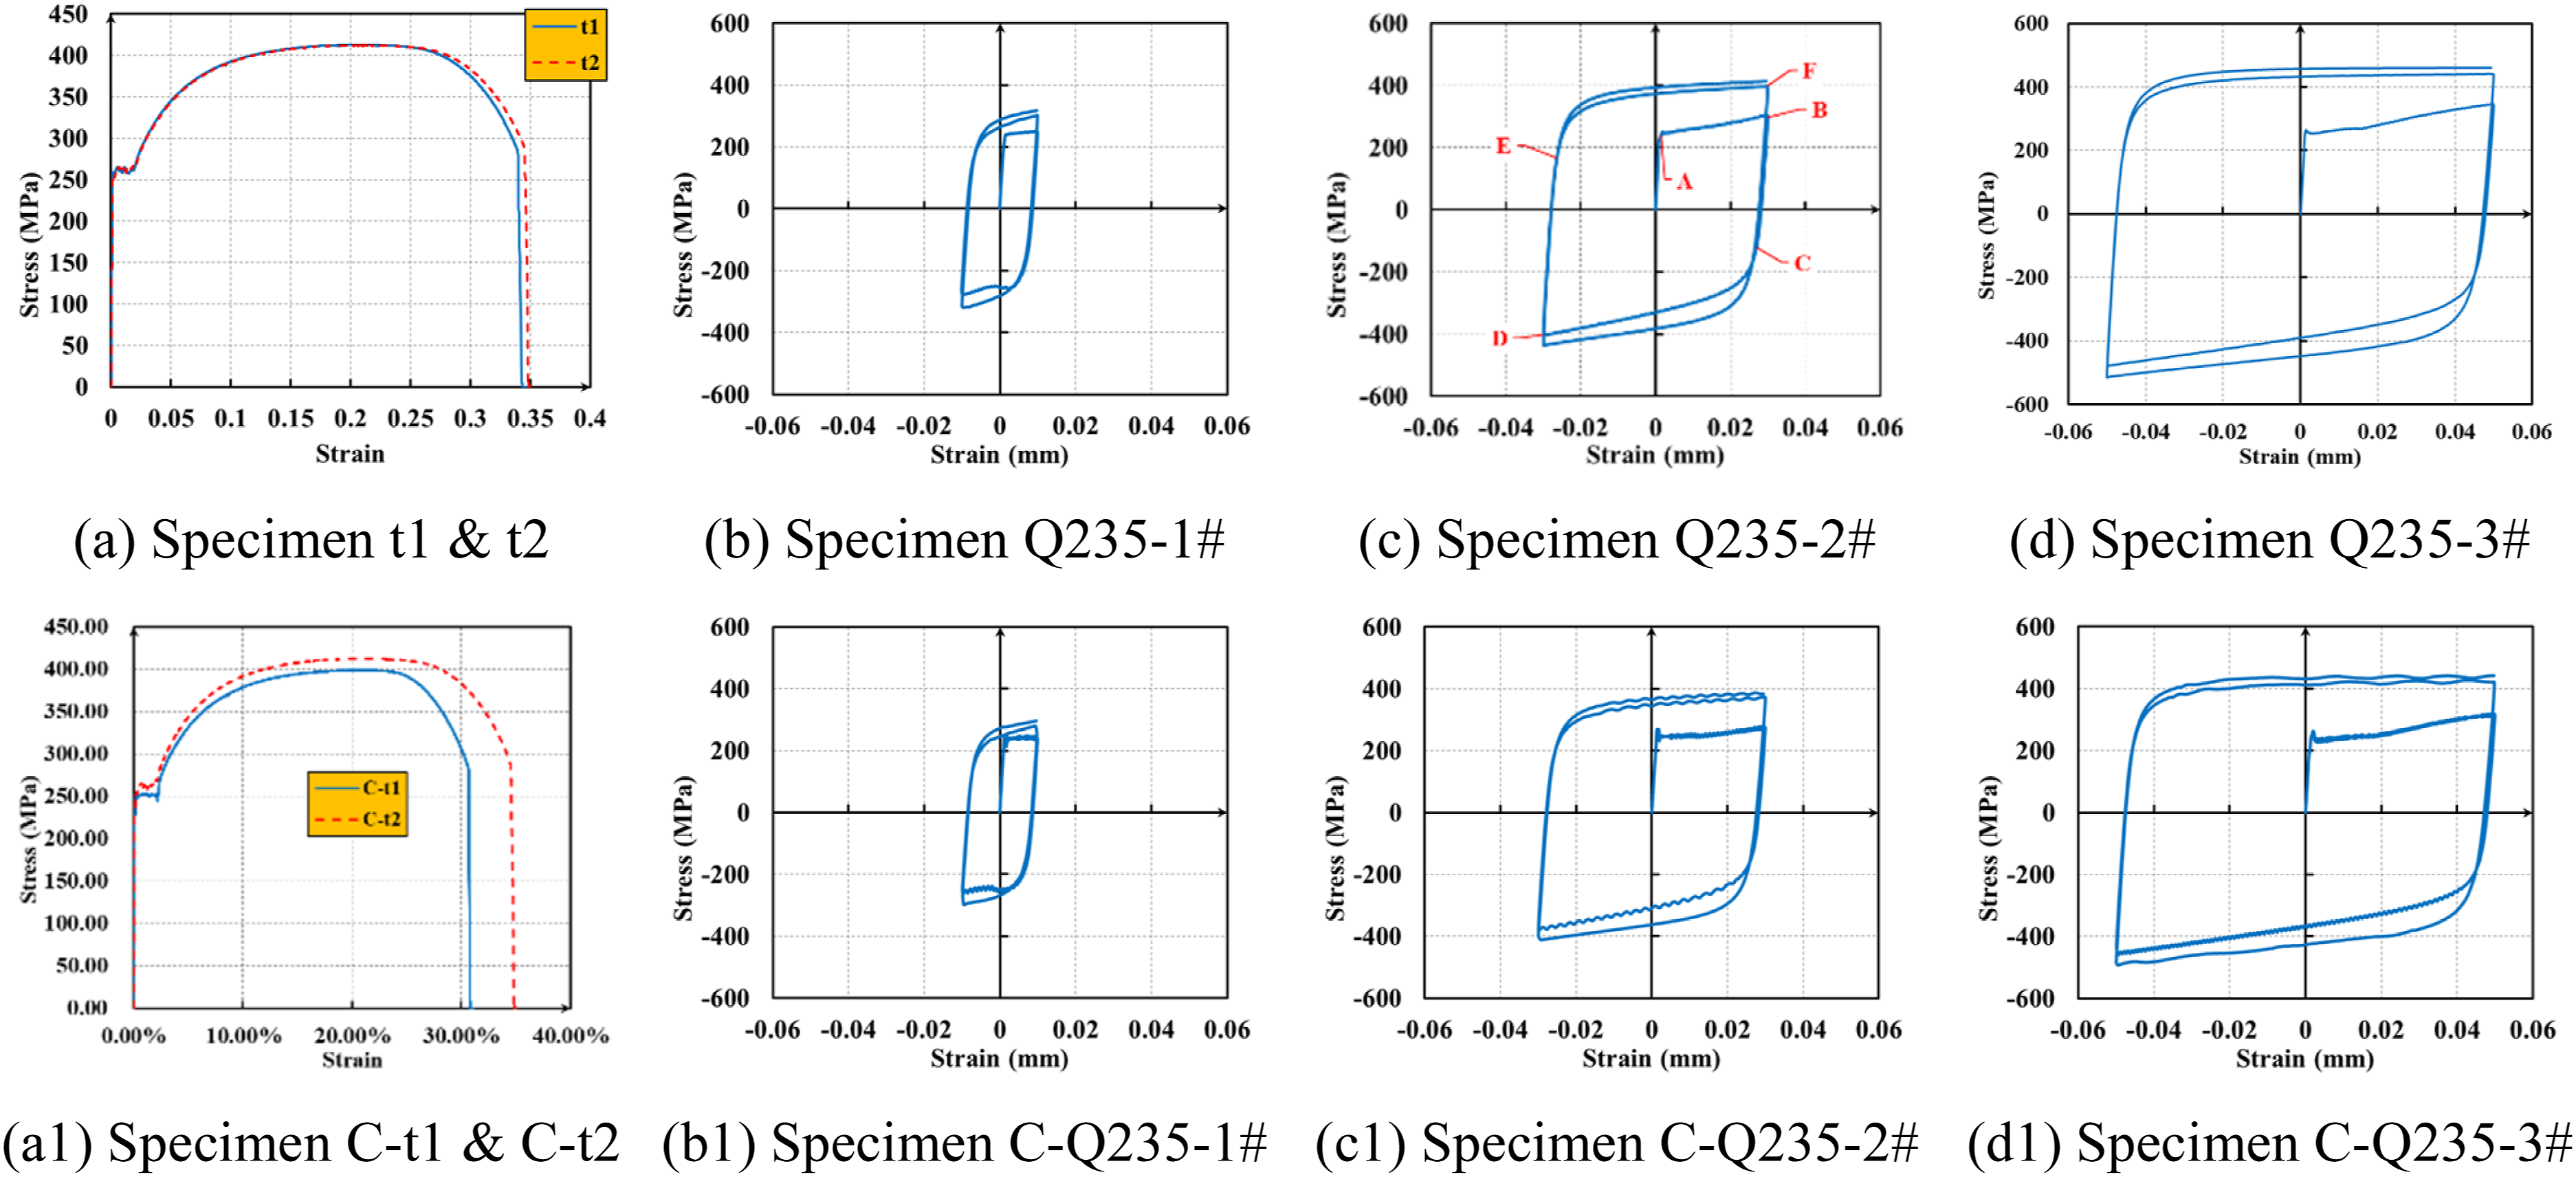
Measurement of friction coefficient
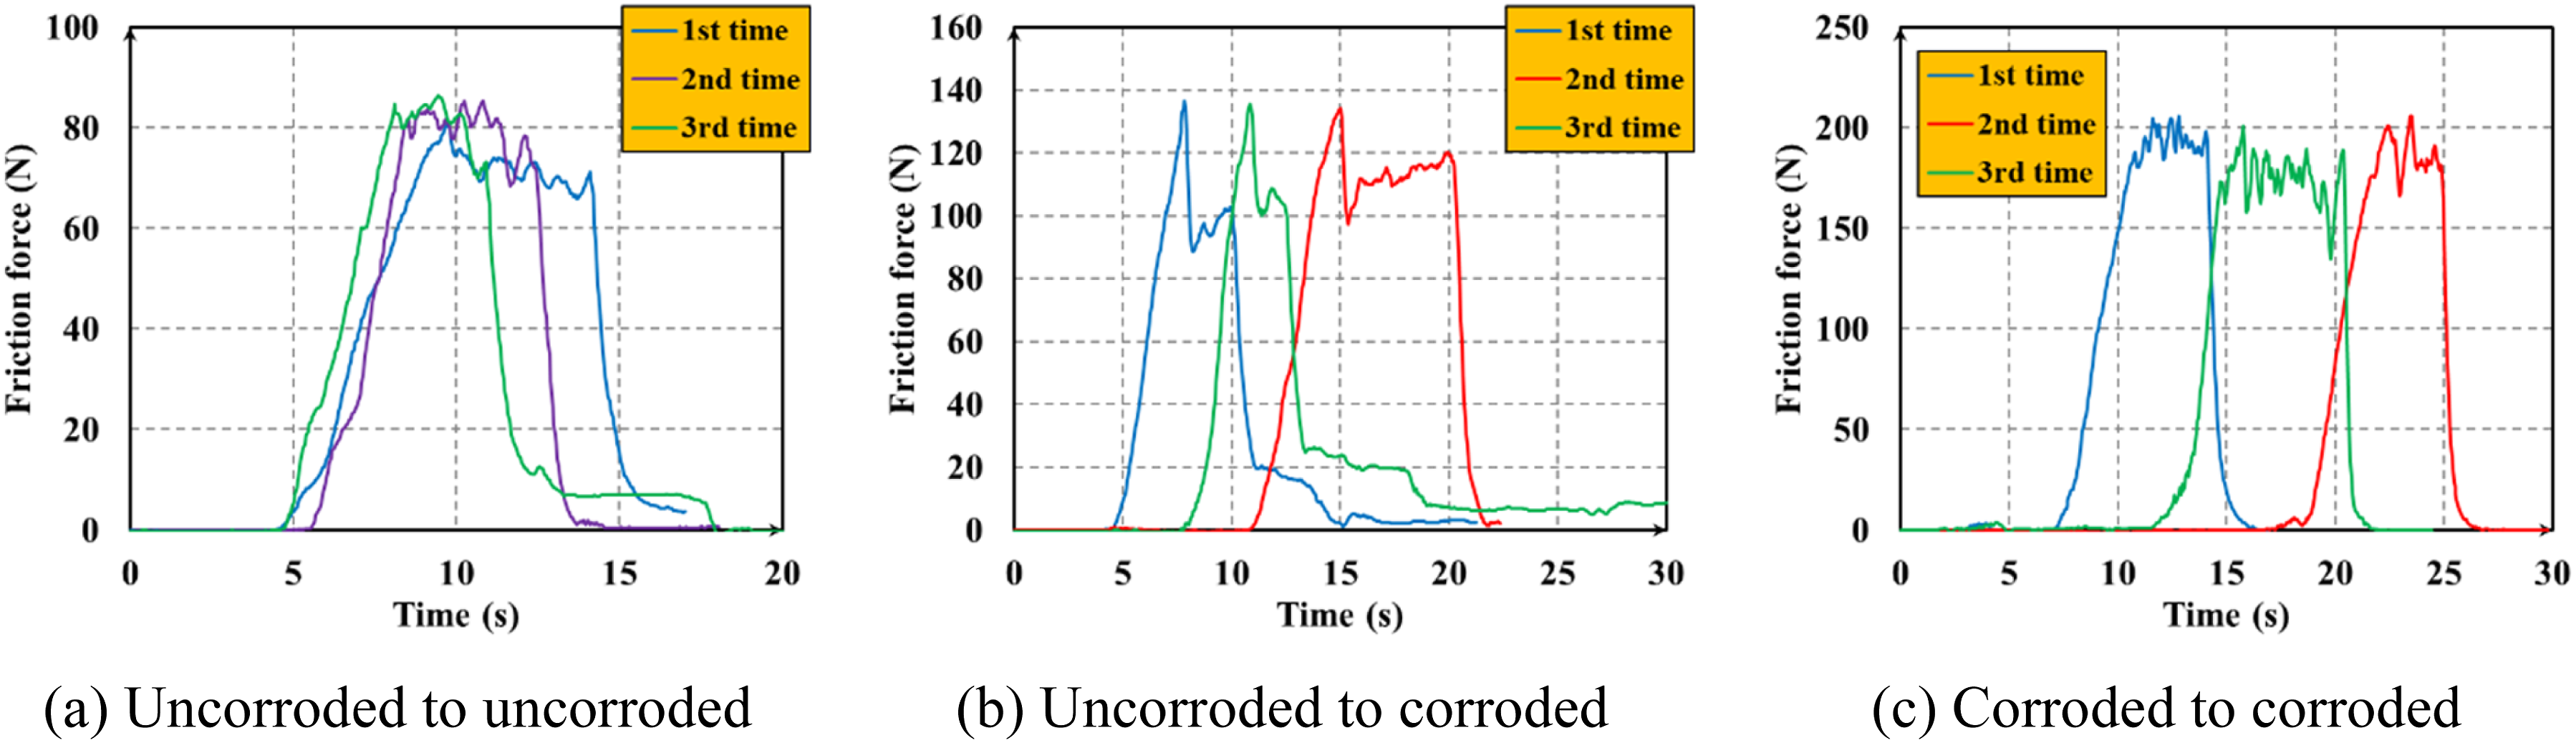
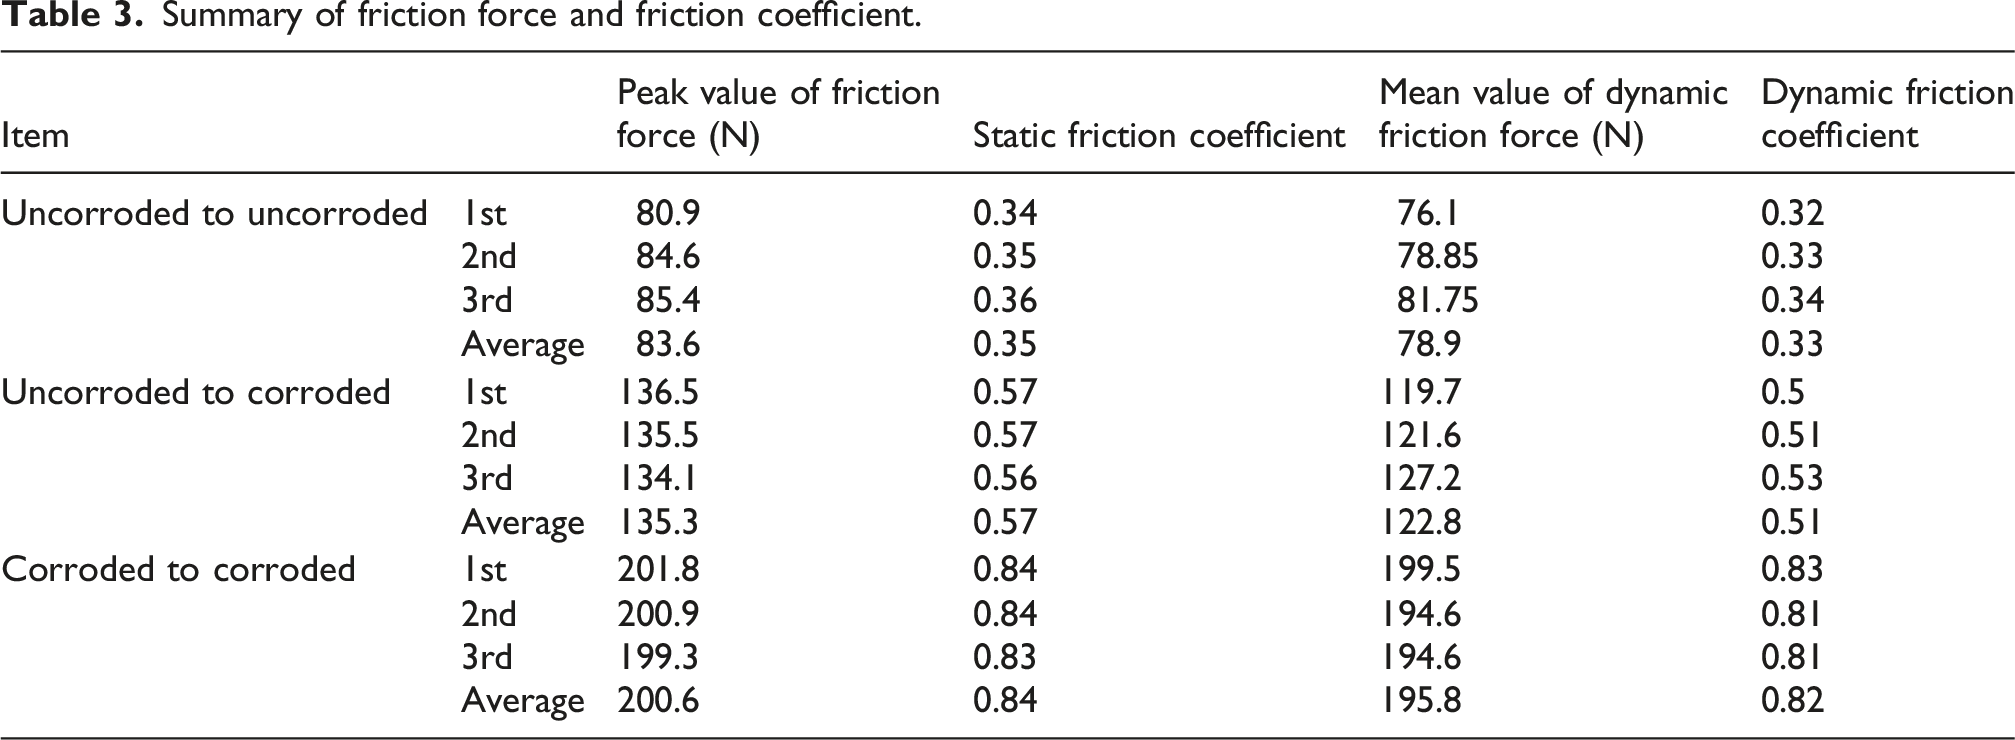
One of the most important operational mechanisms of the replaceable dog-bone plates is dissipating earthquake energy by friction, and after corrosion, the generation of rust layer will change the friction coefficient of the plate surfaces. To quantify the effect of corrosion on surface friction of mild steel, the friction coefficients before and after corrosion were measured, at OCE, Shanghai Jiao Tong University. First, the friction pairs were stacked together, and the plate below was fixed to the end of a platform. Simultaneously, the other end of the plate above was connected to STC-250 kg dynamometer. After preparation, the other end of the dynamometer was pulled manually. The friction force was observed and recorded during the sliding process of the plates, as shown in Figure 11. The procedure described above for measuring the friction coefficient is a practical and commonly used method in experimental mechanics, particularly for studying frictional behavior in structural components. While it may not be a standardized test like ASTM or ISO procedures, it aligns with general principles of friction measurement and is justified by the following points and relevant literature. The method is consistent with fundamental friction measurement techniques described in tribology literature. In addition, studies on self-centering structures and energy dissipation devices often measure friction coefficients using comparable methods. For instance, Christopoulos et al. (Christopoulos et al., 2008) described friction measurements in energy dissipative devices using direct force-displacement methods. Three measurements were conducted on each friction pair, the measured results are summarized in Figure 12. Peak value of the friction force, mean value of dynamic friction force, and static/dynamic friction coefficients are listed in Table 3. According to test data, influence of corrosion on friction coefficient of mild steel is much significant, 1,600h of accelerated corrosion can cause a 148.48% increase of friction coefficient (from 0.33 to 0.82). Experimental setup of the friction coefficient measurement. Friction force during pulling process. Summary of friction force and friction coefficient.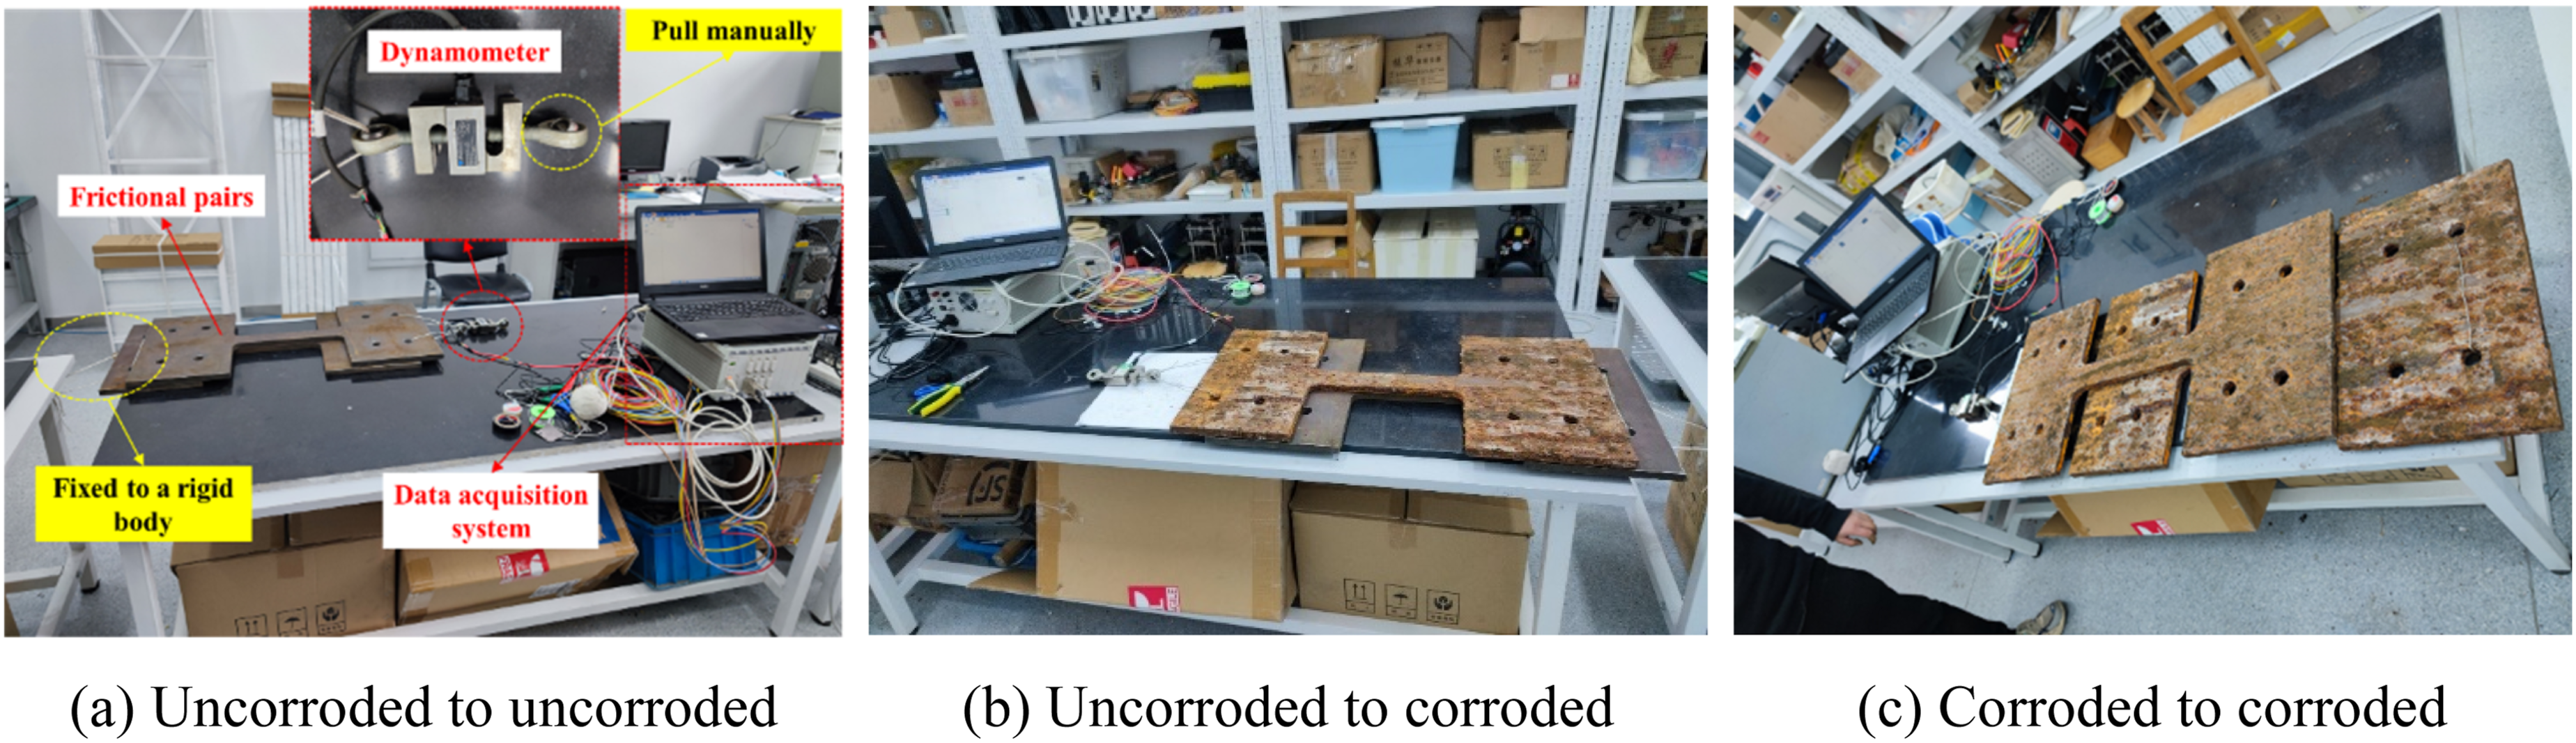
Seismic performance test
Test program
The seismic behavior tests of the specimens were conducted at the Laboratory of Building Structures, Department of Building Engineering, College of Civil Engineering, Tongji University. The specimens and assembled experimental setup are shown in Figure 13. A 100 t vertical reaction frame was used to refrain the displacement of the column at perpendicular direction. A hydraulic jack was placed between the vertical frame and the column end, to apply the axial compressive force with the ratio of 0.05 (531 kN). A 50 t servo actuator was adopted to conduct the hysteretic loading process, with a loading rate of 16-80 mm/min. A pair of spherical hinges were placed at both ends of the column to allow the rotation of column ends (inflection points). A pair of lateral bracing was installed at both sides of the beam to prevent the beam from torsion and out-of-plane instability. The ends of the beam and the actuator were connected by pin shaft. The column end was connected to a horizontal reaction frame through a linking beam to eliminate the horizontal displacement of the steel column. Experimental setup (a) schematic (b) photo in-situ.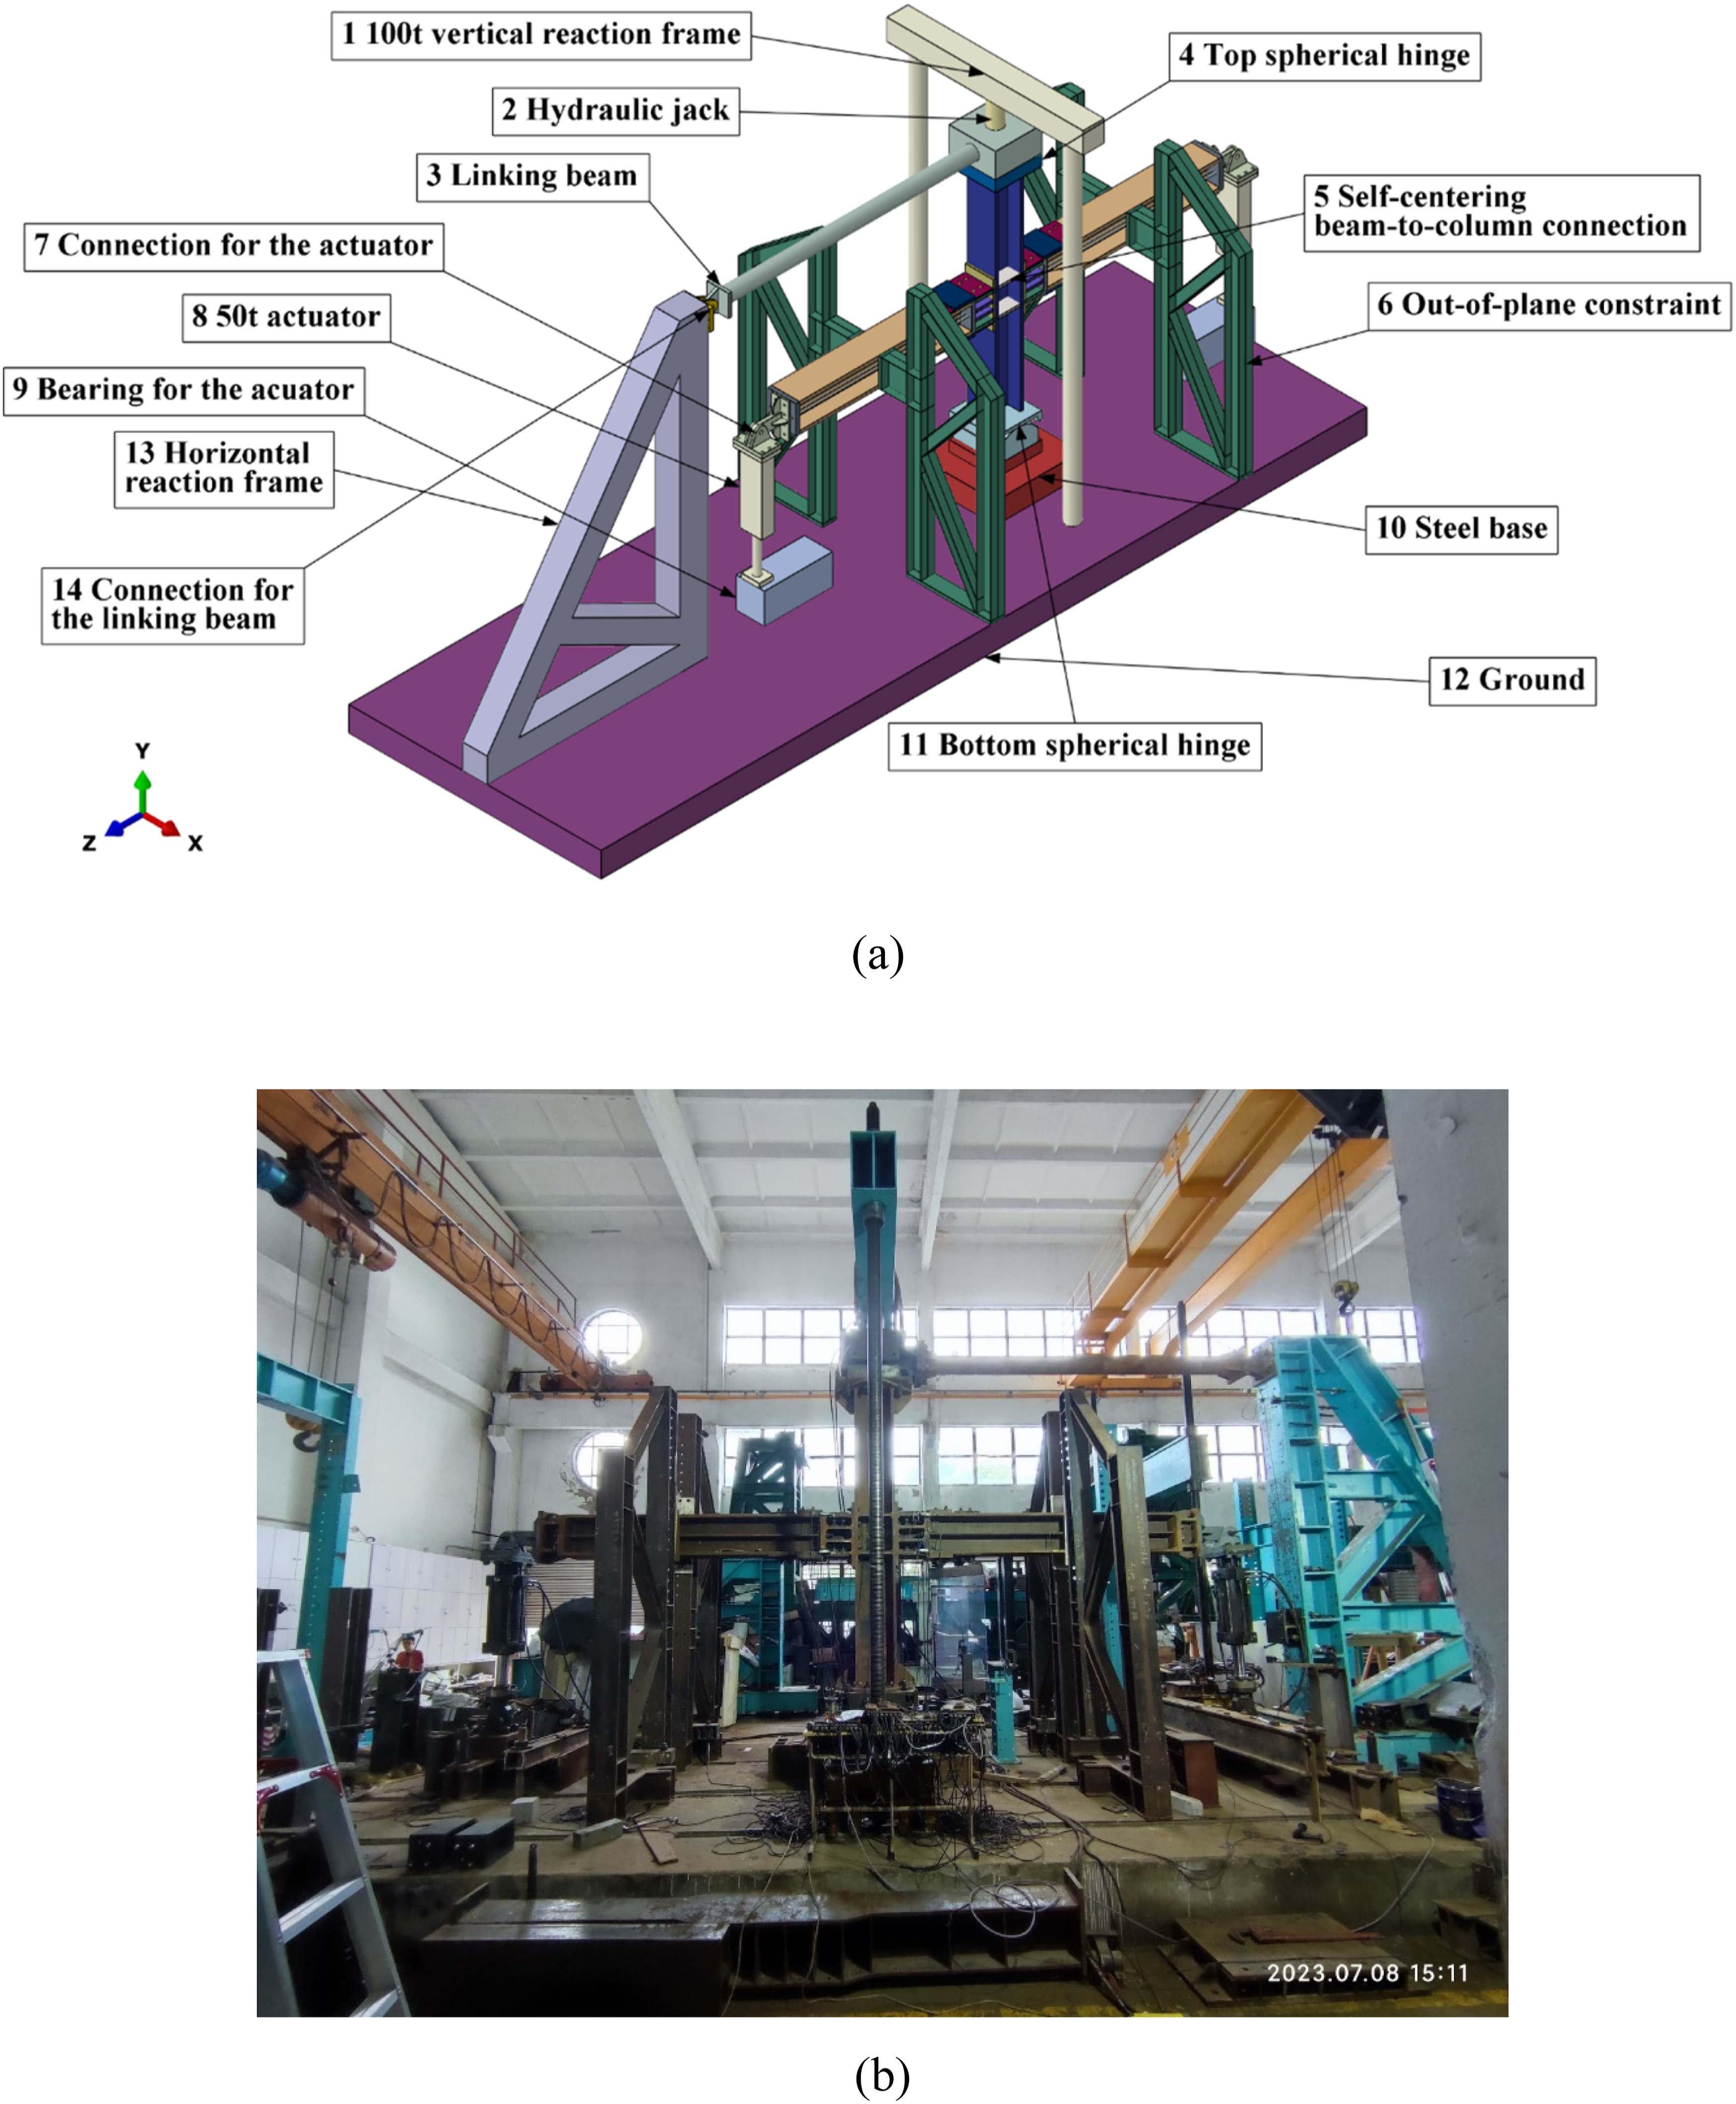
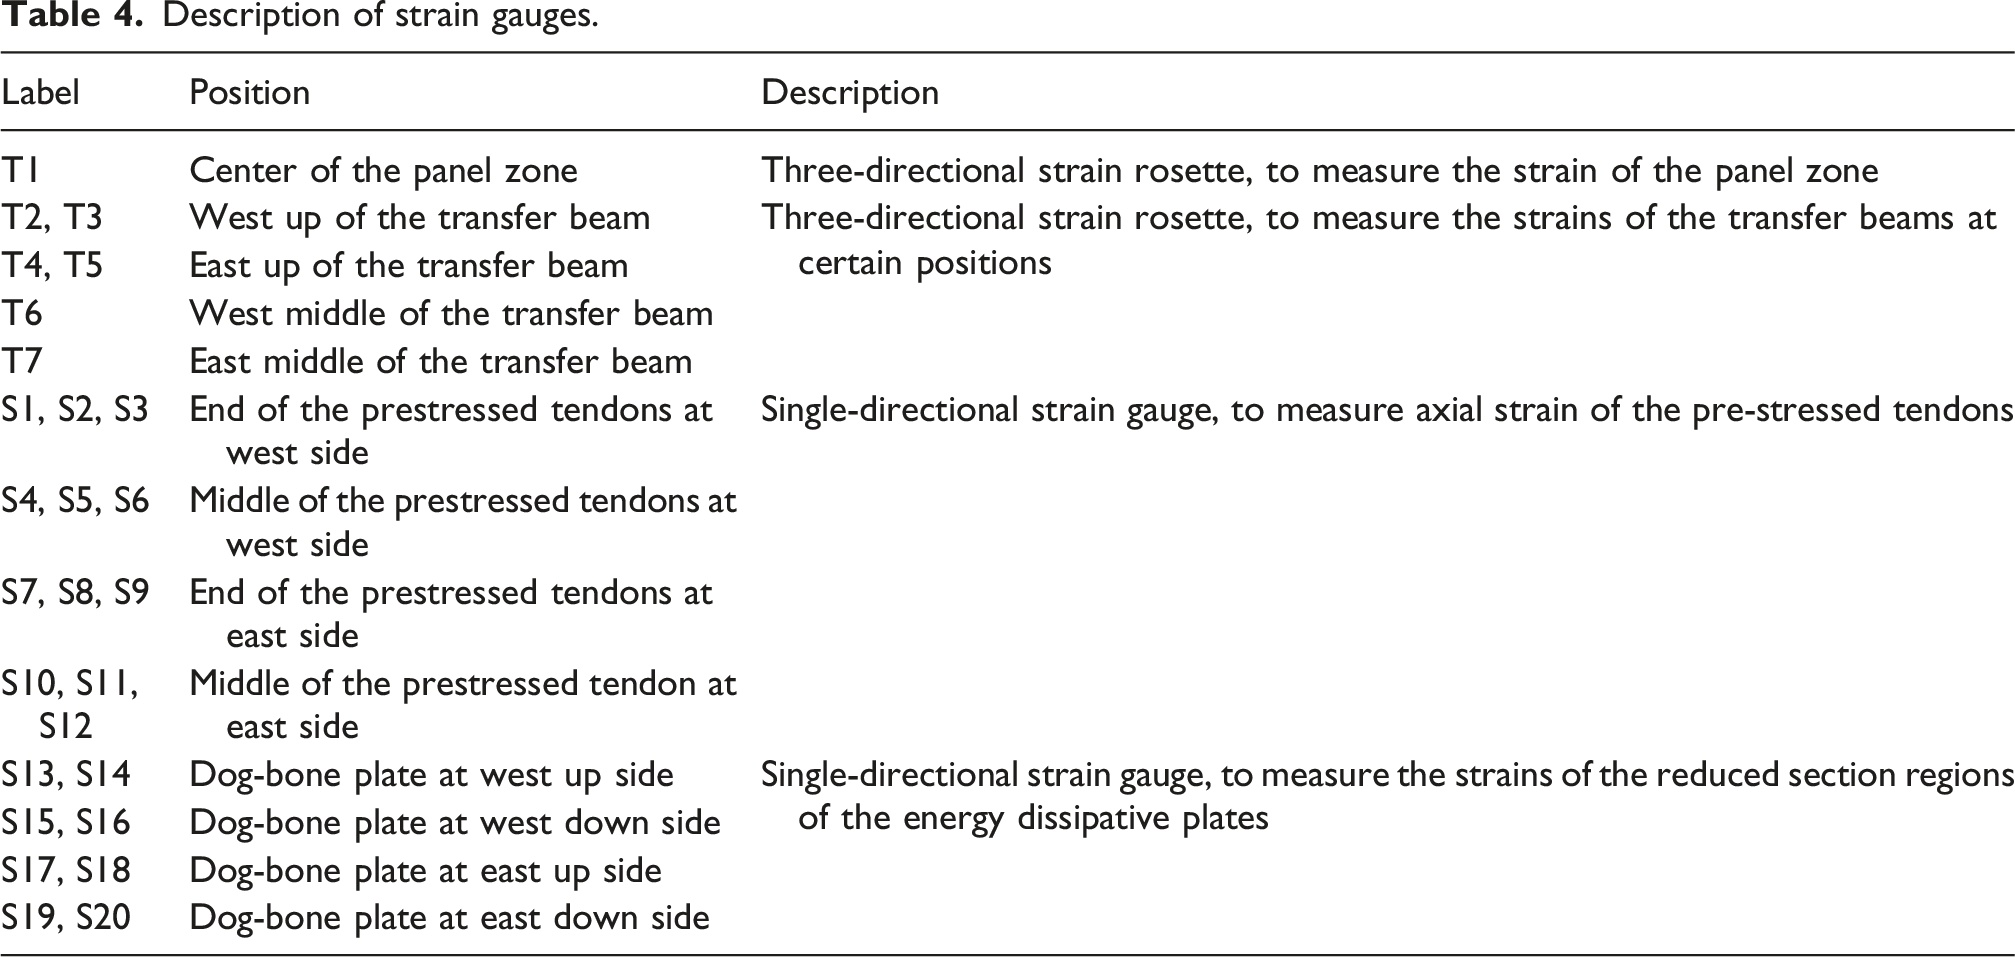
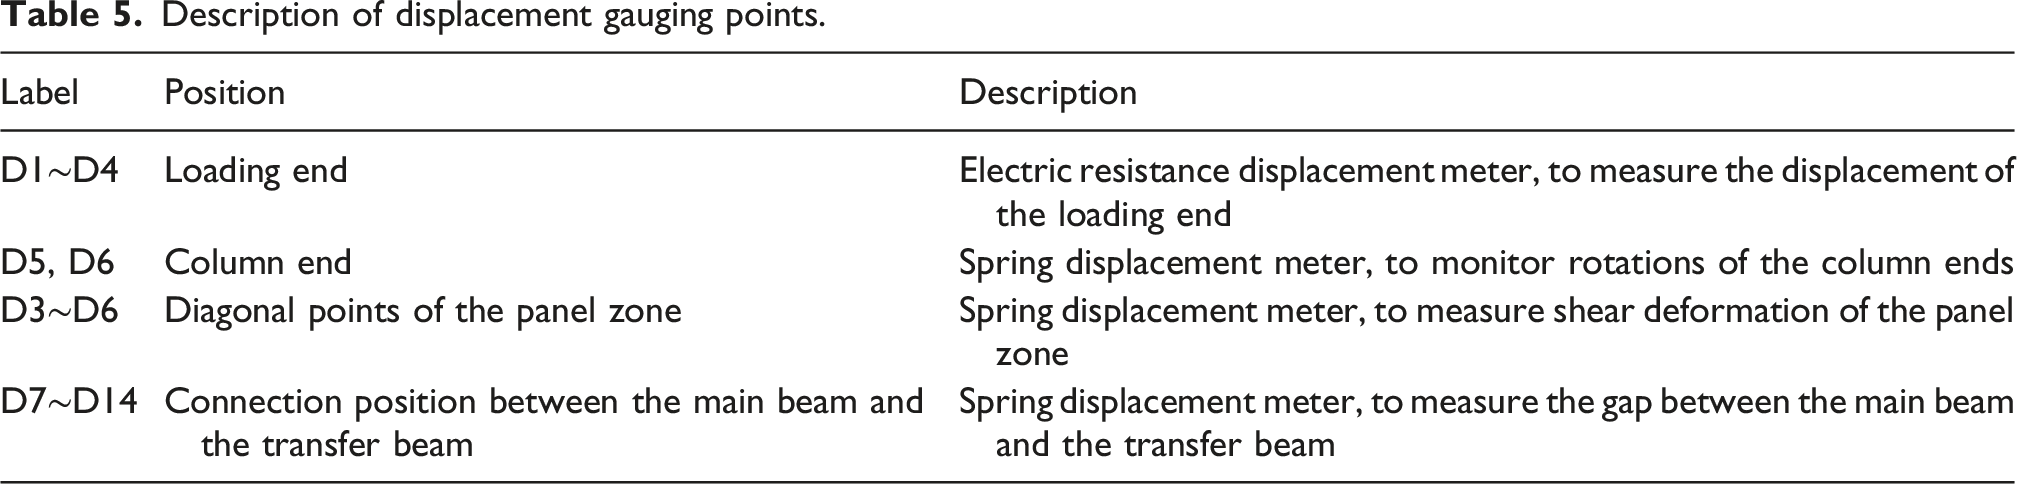
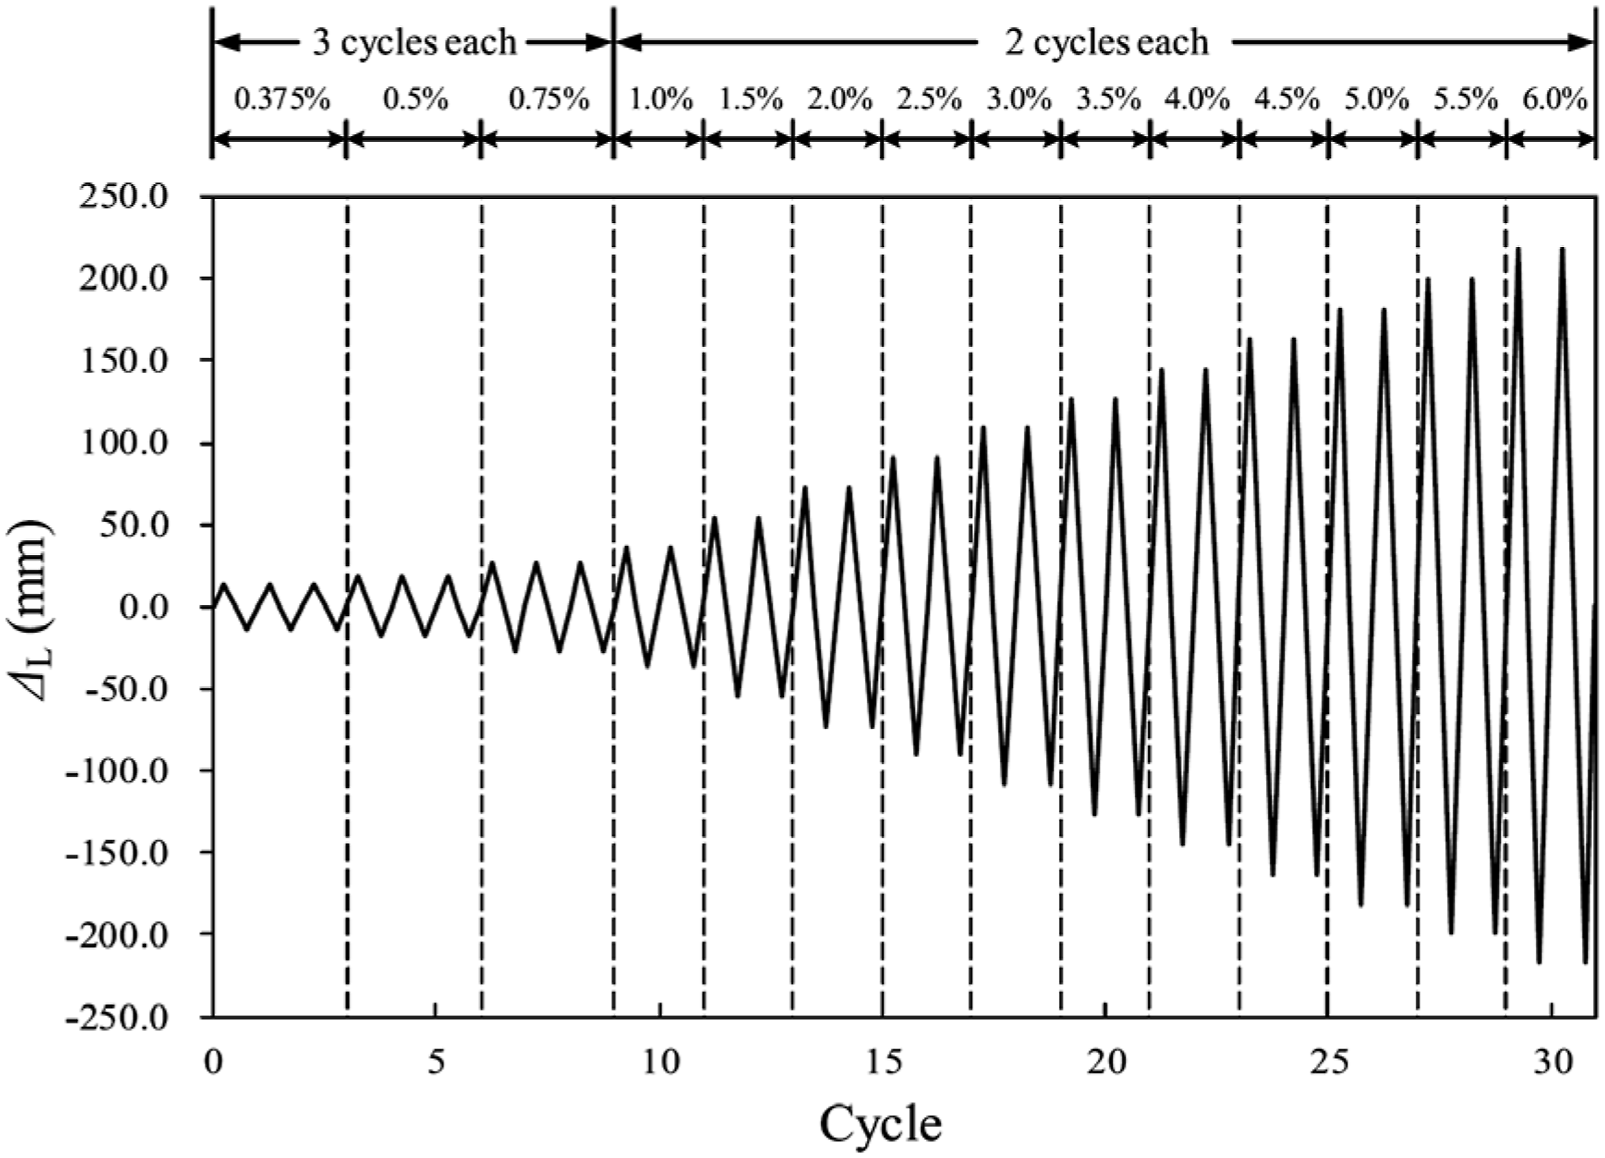
A total of 24 gauged points was designed, as shown in Figure 14, where DX represents gauged points of displacement, with the total number of 10; SX denotes gauged points of strain, with the number of 12; TX stands for strain rosette, with the number of 2. Detailed measuring target of each gauging point is summarized in Tables 4 and 5. Reciprocating load with increased amplitude of displacement at each level was adopted (Figure 15), and the loading protocol was set in accordance with that stipulated by code AISC 341-16. Overall rotational angle of the sub-structure of the connection (ratio of vertical displacement of the beam end to the distance between the beam end and the center of the column) was utilized to convert displacement of the servo actuator. Each loading level is repeated for three cycles when rotation of the connection is less than or equal to 0.75%, while when the drift ratio is greater than or equal to 1%, each loading level is repeated for two cycles. The maximum loading amplitude is 6%, which corresponds to the ultimate value when the actuator reaches its maximum stroke. Arrangement of gauging points. Description of strain gauges. Description of displacement gauging points. Loading protocol.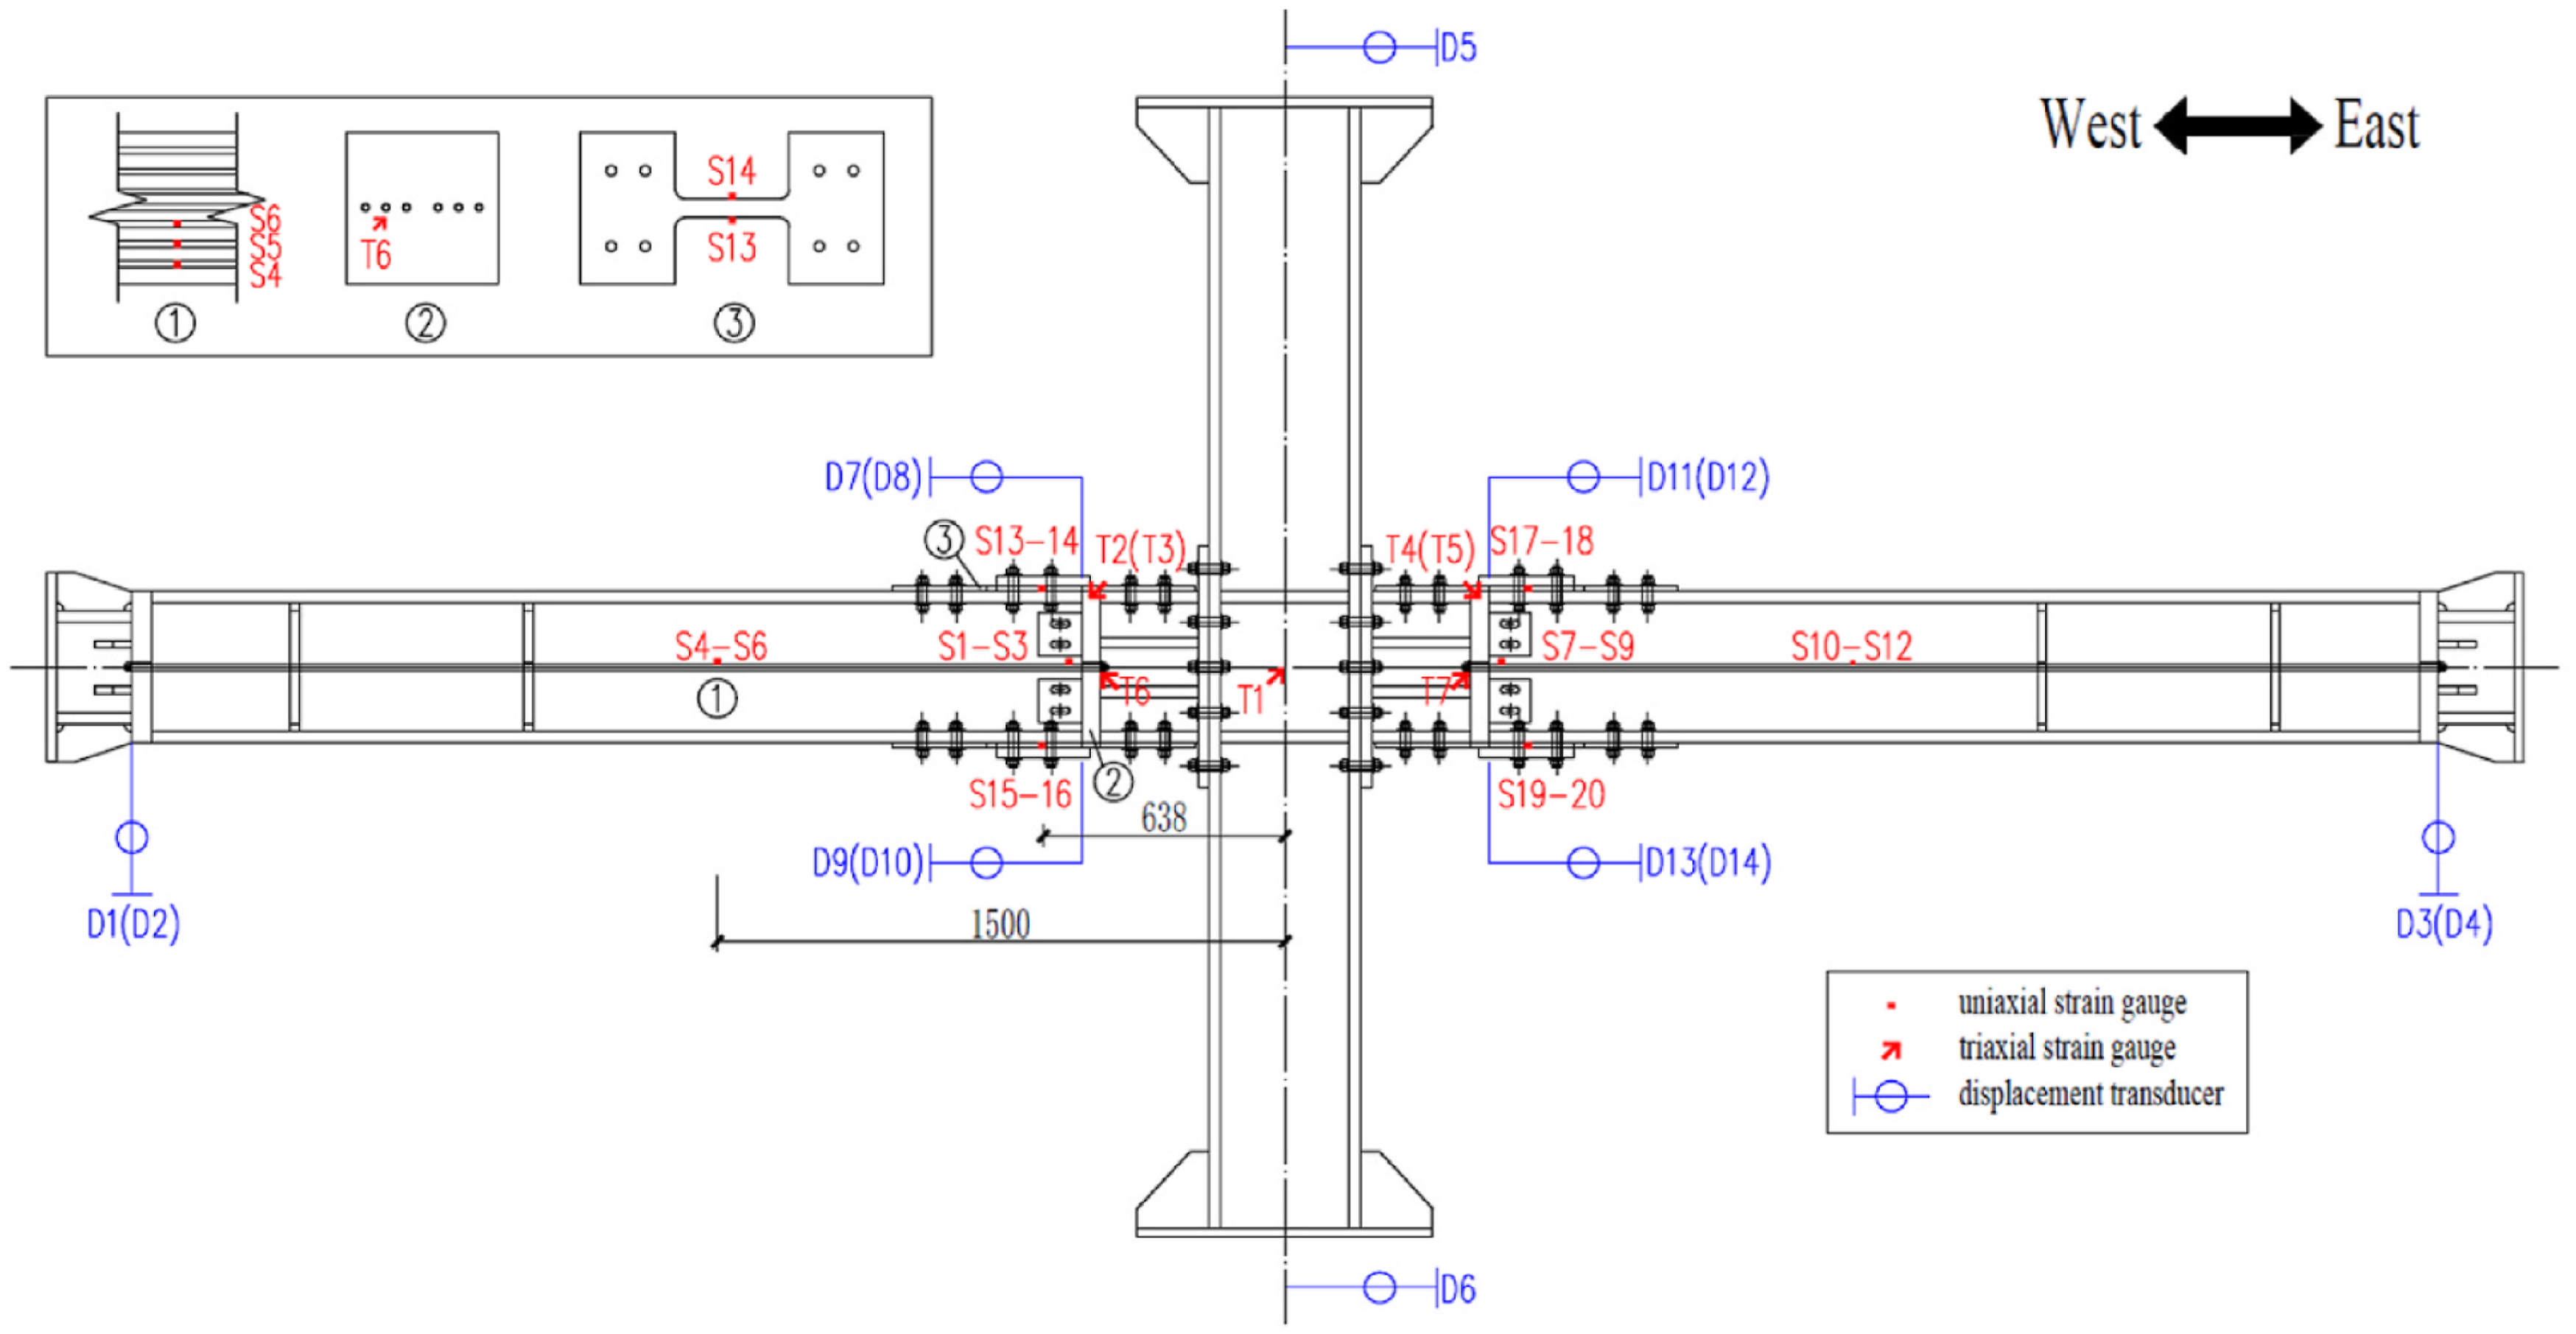
Hysteresis curve
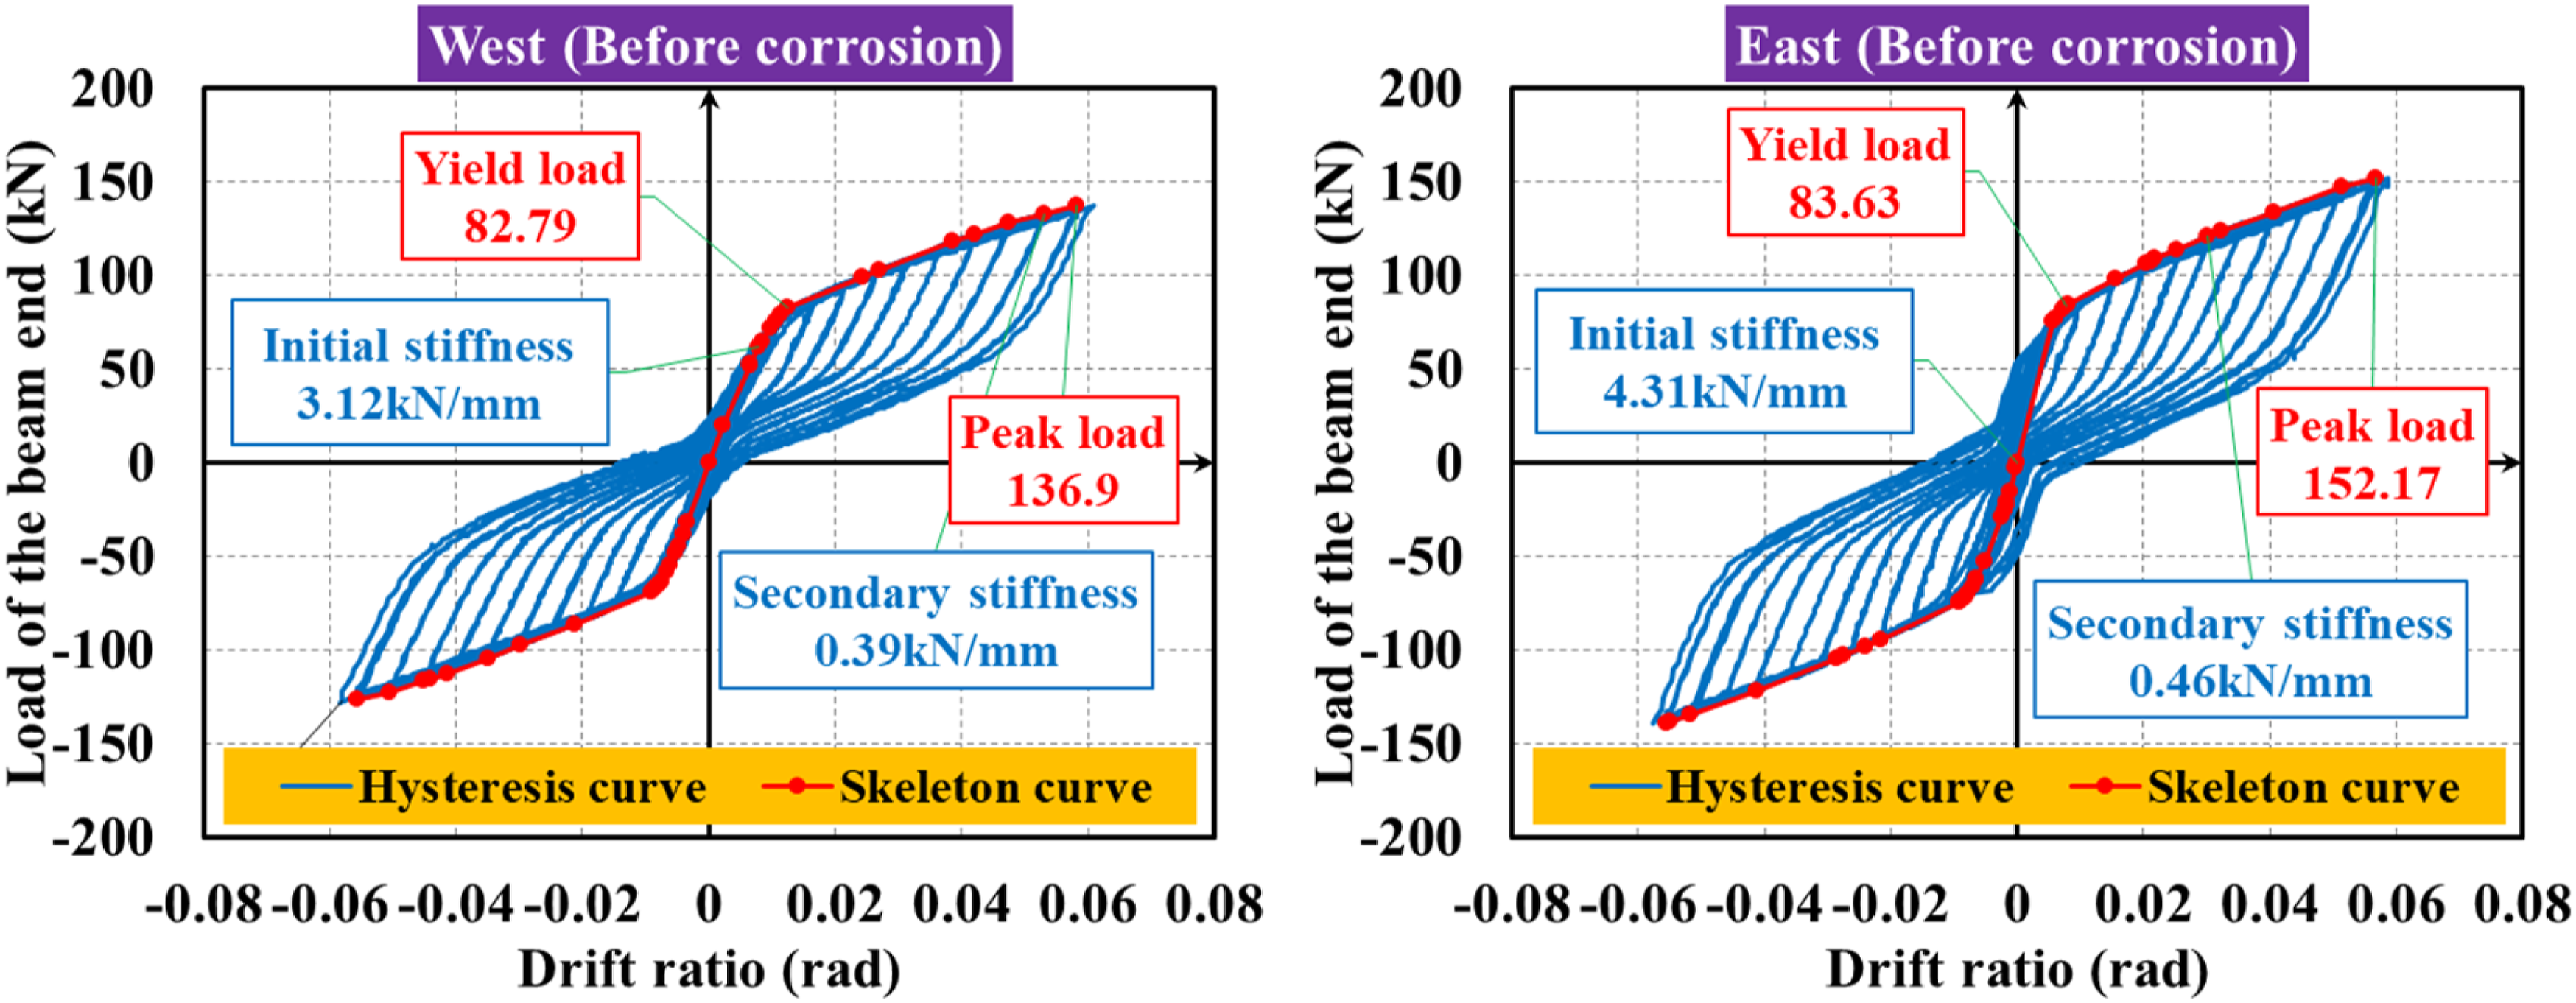
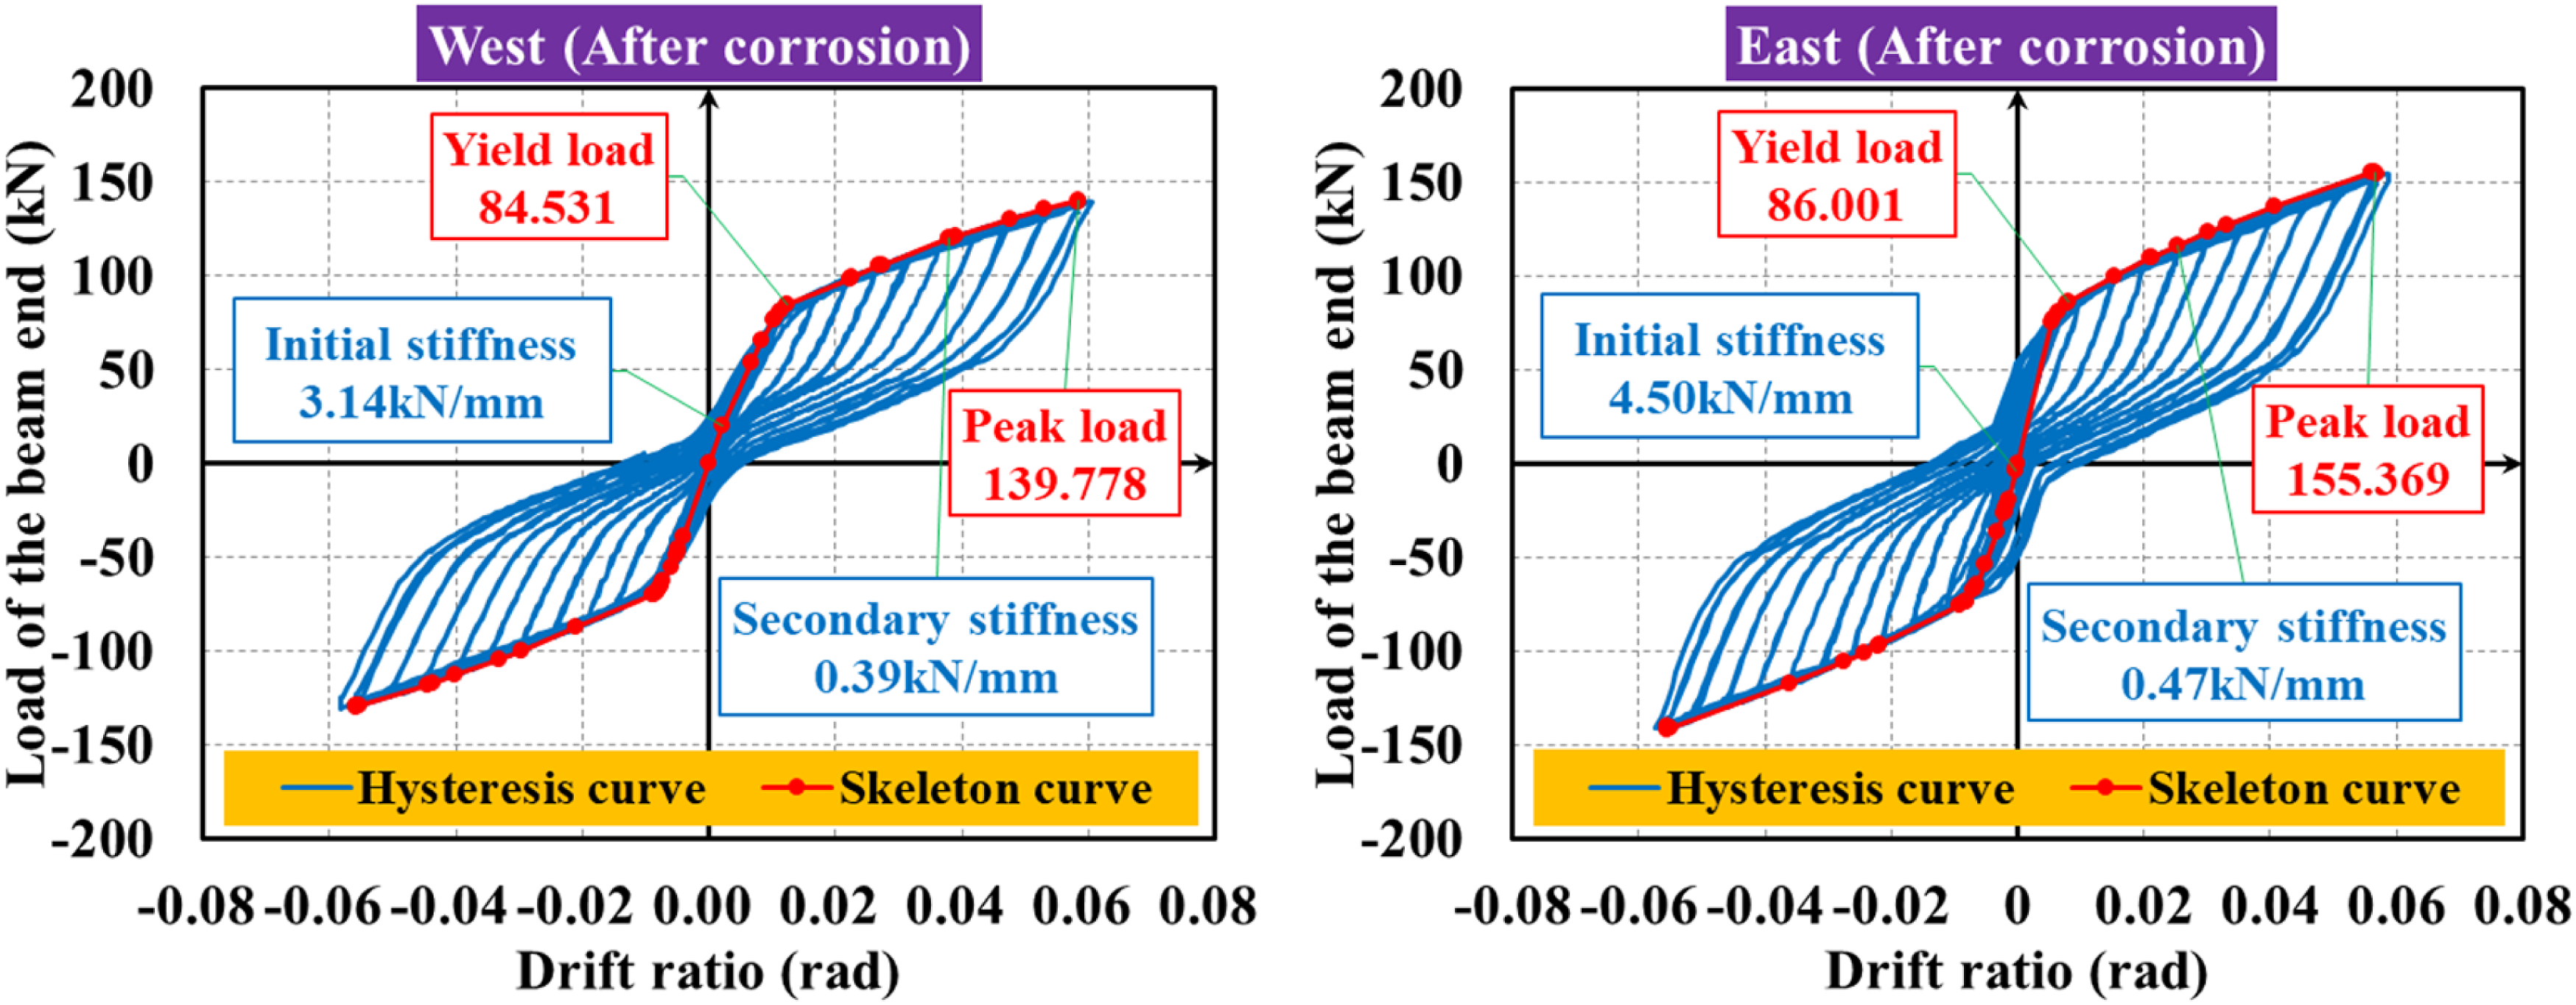
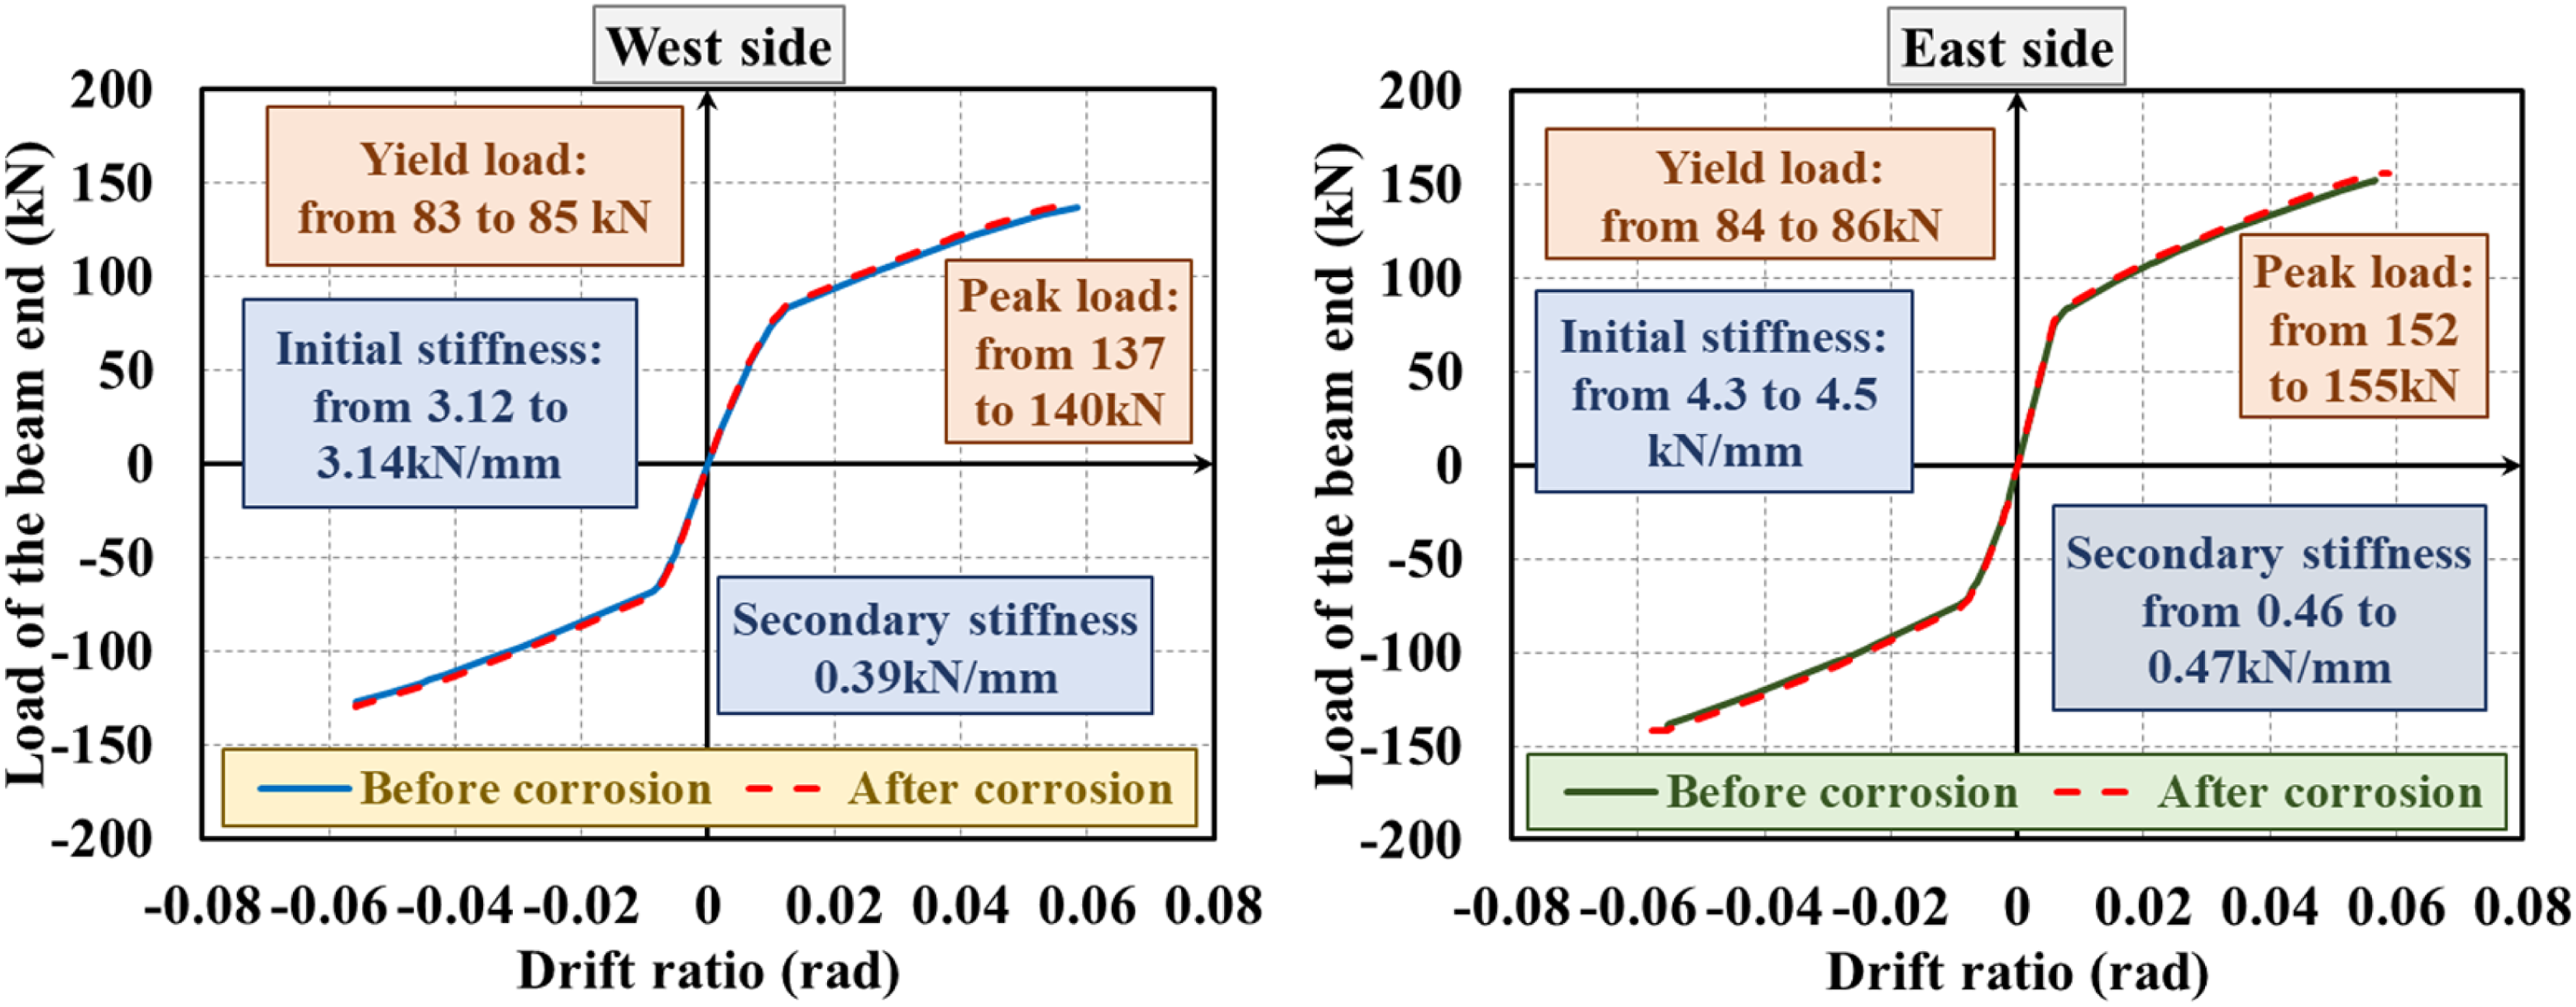
Load-rotation curves and corresponding skeleton curves of the self-centering connection before and after corrosion of the dog-bone energy dissipative plates are demonstrated by Figures 16–18. In can be found that after corrosion, cyclic behavior of the whole connection is not significant different from that before corrosion. Theoretically, the effect of corrosion at the energy dissipation plate on the hysteresis behavior of the entire connection mainly exhibits in two aspects: On one hand, mechanical properties of the dissipative plates degrade after corrosion, and thus decrease related seismic performance indices of the whole connection, such as energy dissipation, peak load, and residual deformation. On the other hand, the friction force between the energy dissipative plate and adjacent components increases after corrosion, in which way increase these indices. As a result, when the influence of corrosion on mechanical property of the dog-bone plates is greater than the influence on friction, parameters that characterize seismic performance of the connection decrease, and vice versa. Quantitatively, the variation in friction force of an individual energy dissipative plate caused by 1,600h accelerated corrosion is calculated as: Hysteresis and skeleton curves of the connection before the corrosion of energy dissipative plates. Hysteresis and skeleton curves of the connection after the corrosion of energy dissipative plates. Comparison between the skeleton curves of specimens before and after corrosion.
The variation in load-carrying capacity of an individual energy dissipative plate after corrosion is:
Assuming the deformation of the energy dissipation plate is d, the energy dissipated by friction is calculated as:
While the energy dissipation induced by plastic deformation can be approximately estimated as:
By comparing the calculation results of equation (12) & (13), it can be found that the plastic deformation is the dominant factor of dissipating energy.
Summary of seismic performance indices.
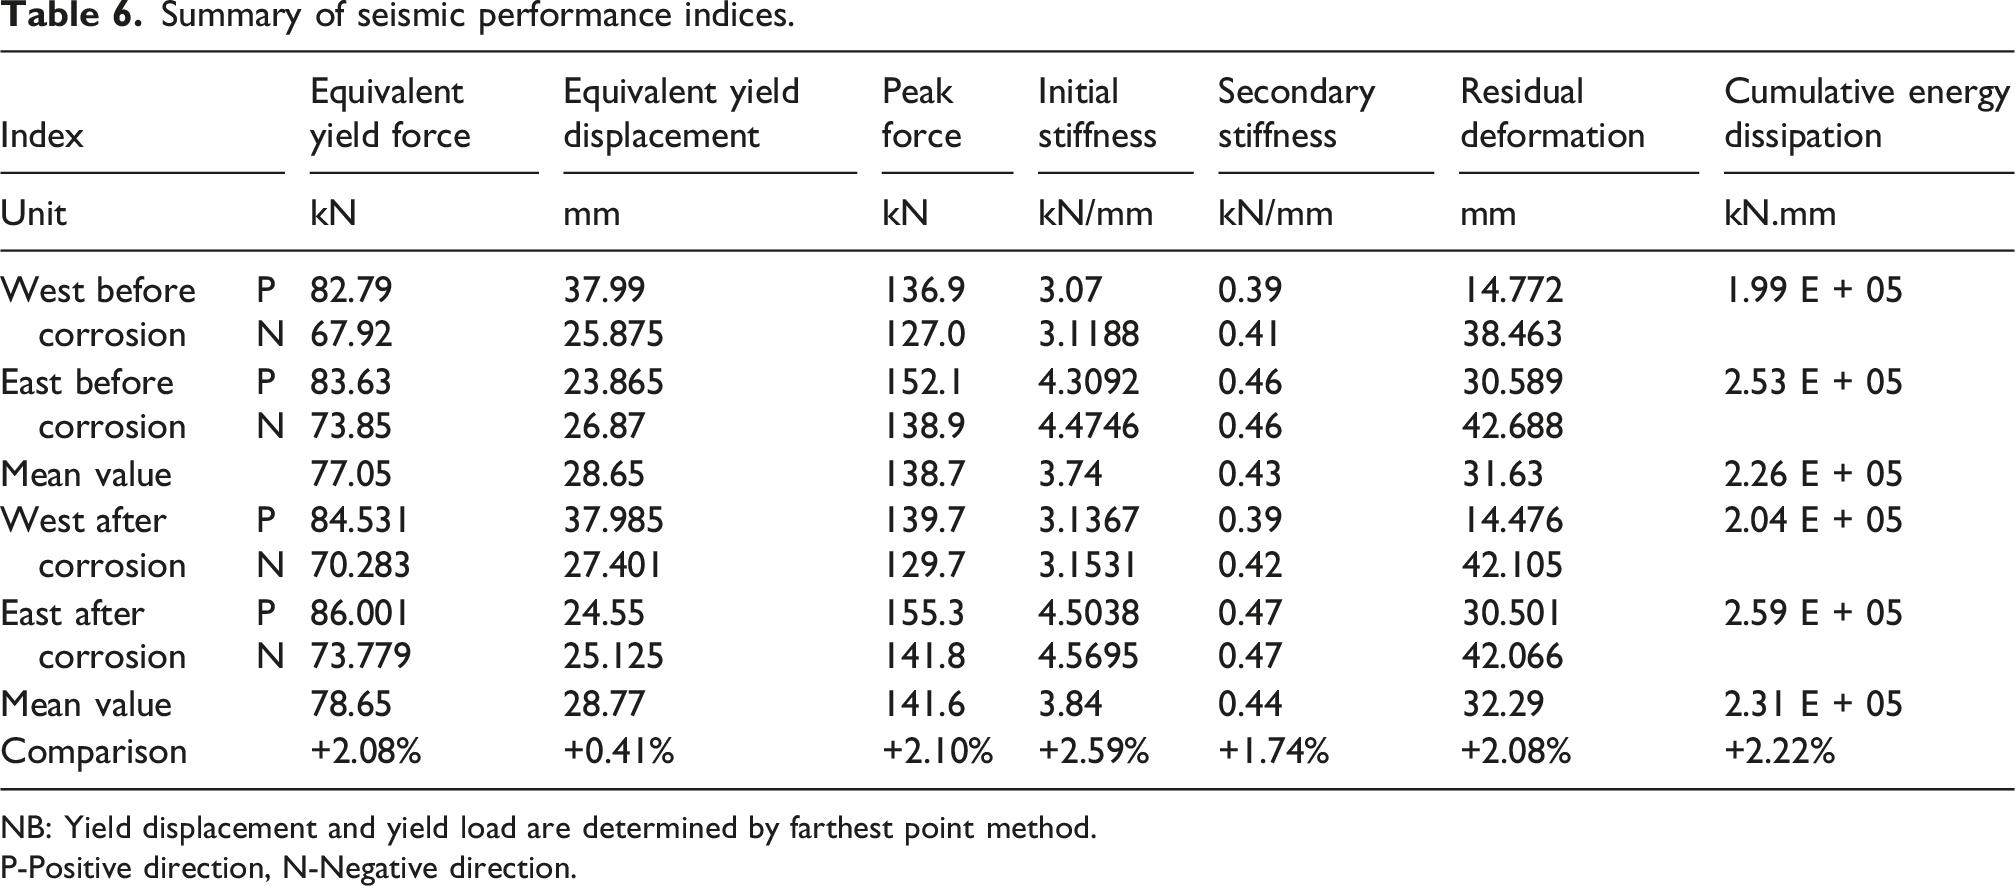
NB: Yield displacement and yield load are determined by farthest point method.
P-Positive direction, N-Negative direction.
Rotation analysis
According to Eurocode 3 (European Committee for Standardization CEN, 2005), the total beam end displacement of a beam-to-column connection subframe consists of six parts: elastic bending deformation of beam (Δ1), elastic bending deformation of column (Δ2), shear deformation of panel zone (Δ3), local deformation of the transfer beam (Δ4), rigid rotation due to possible base sliding (Δ5), and possible axial compression deformation (Δ6), as shown in Figure 19 (Es is Young’s modulus of the beam, Ib denotes inertia moment of a beam section, and Lb represents the length of the beam). Rotation components.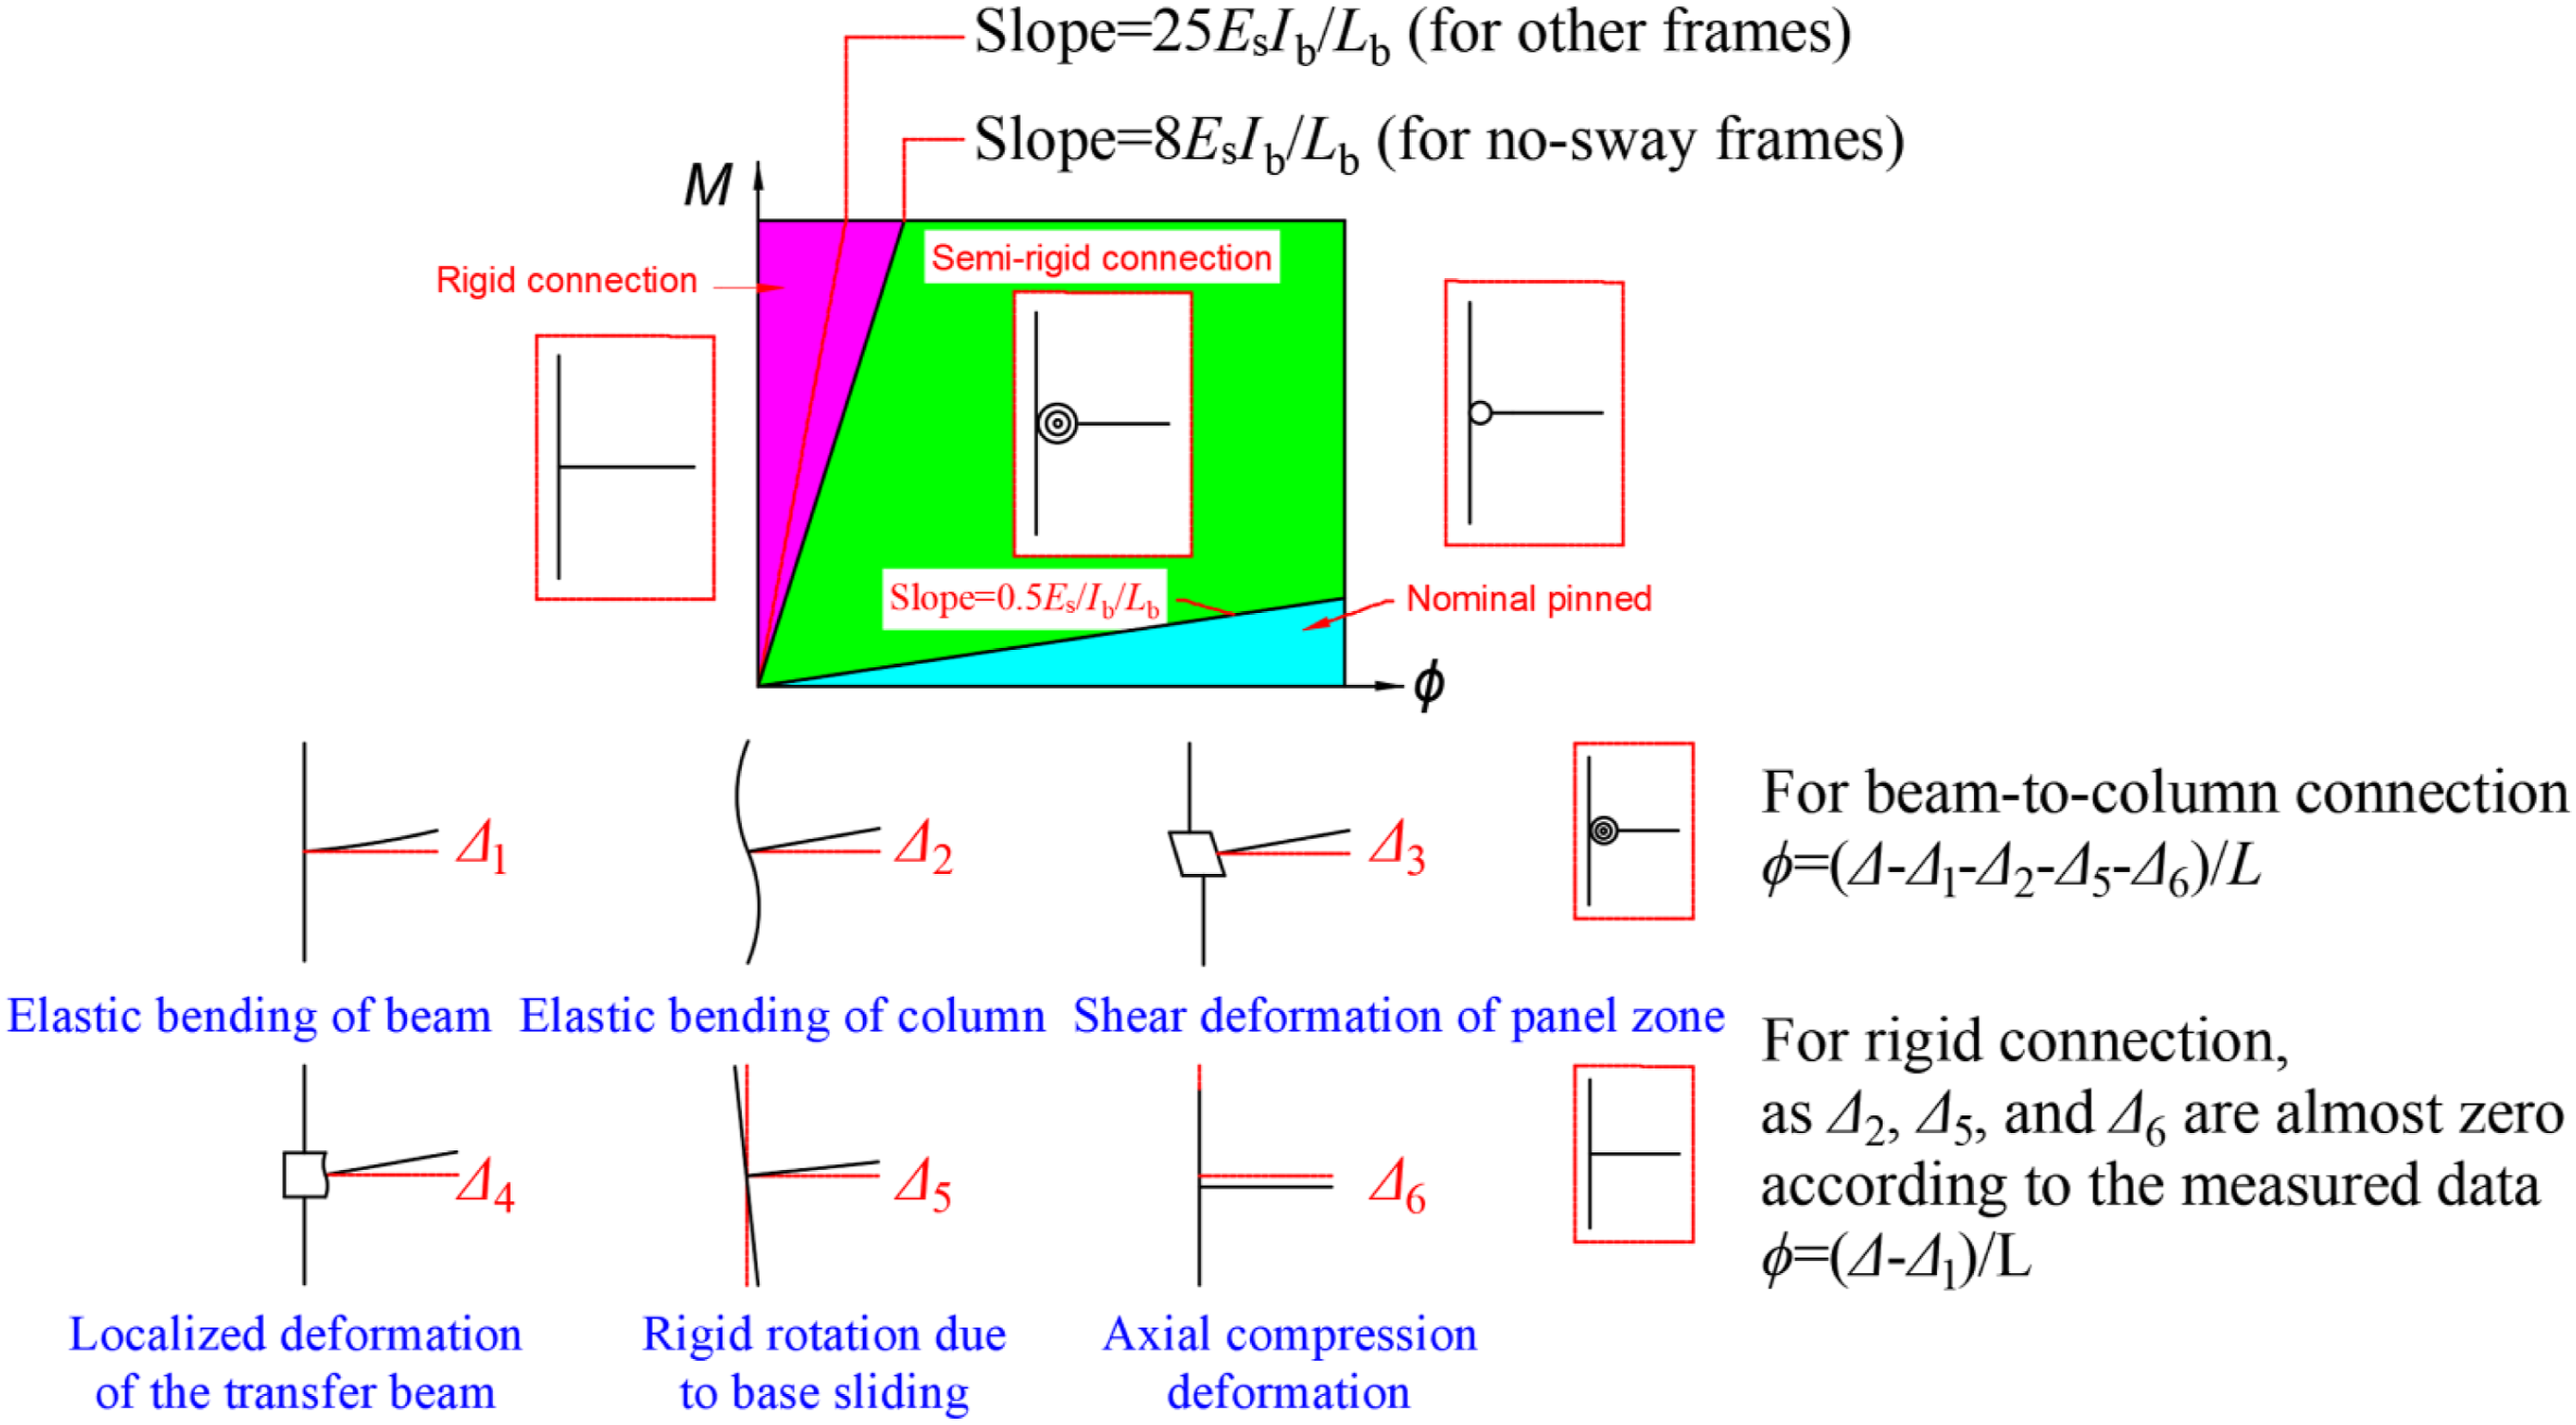
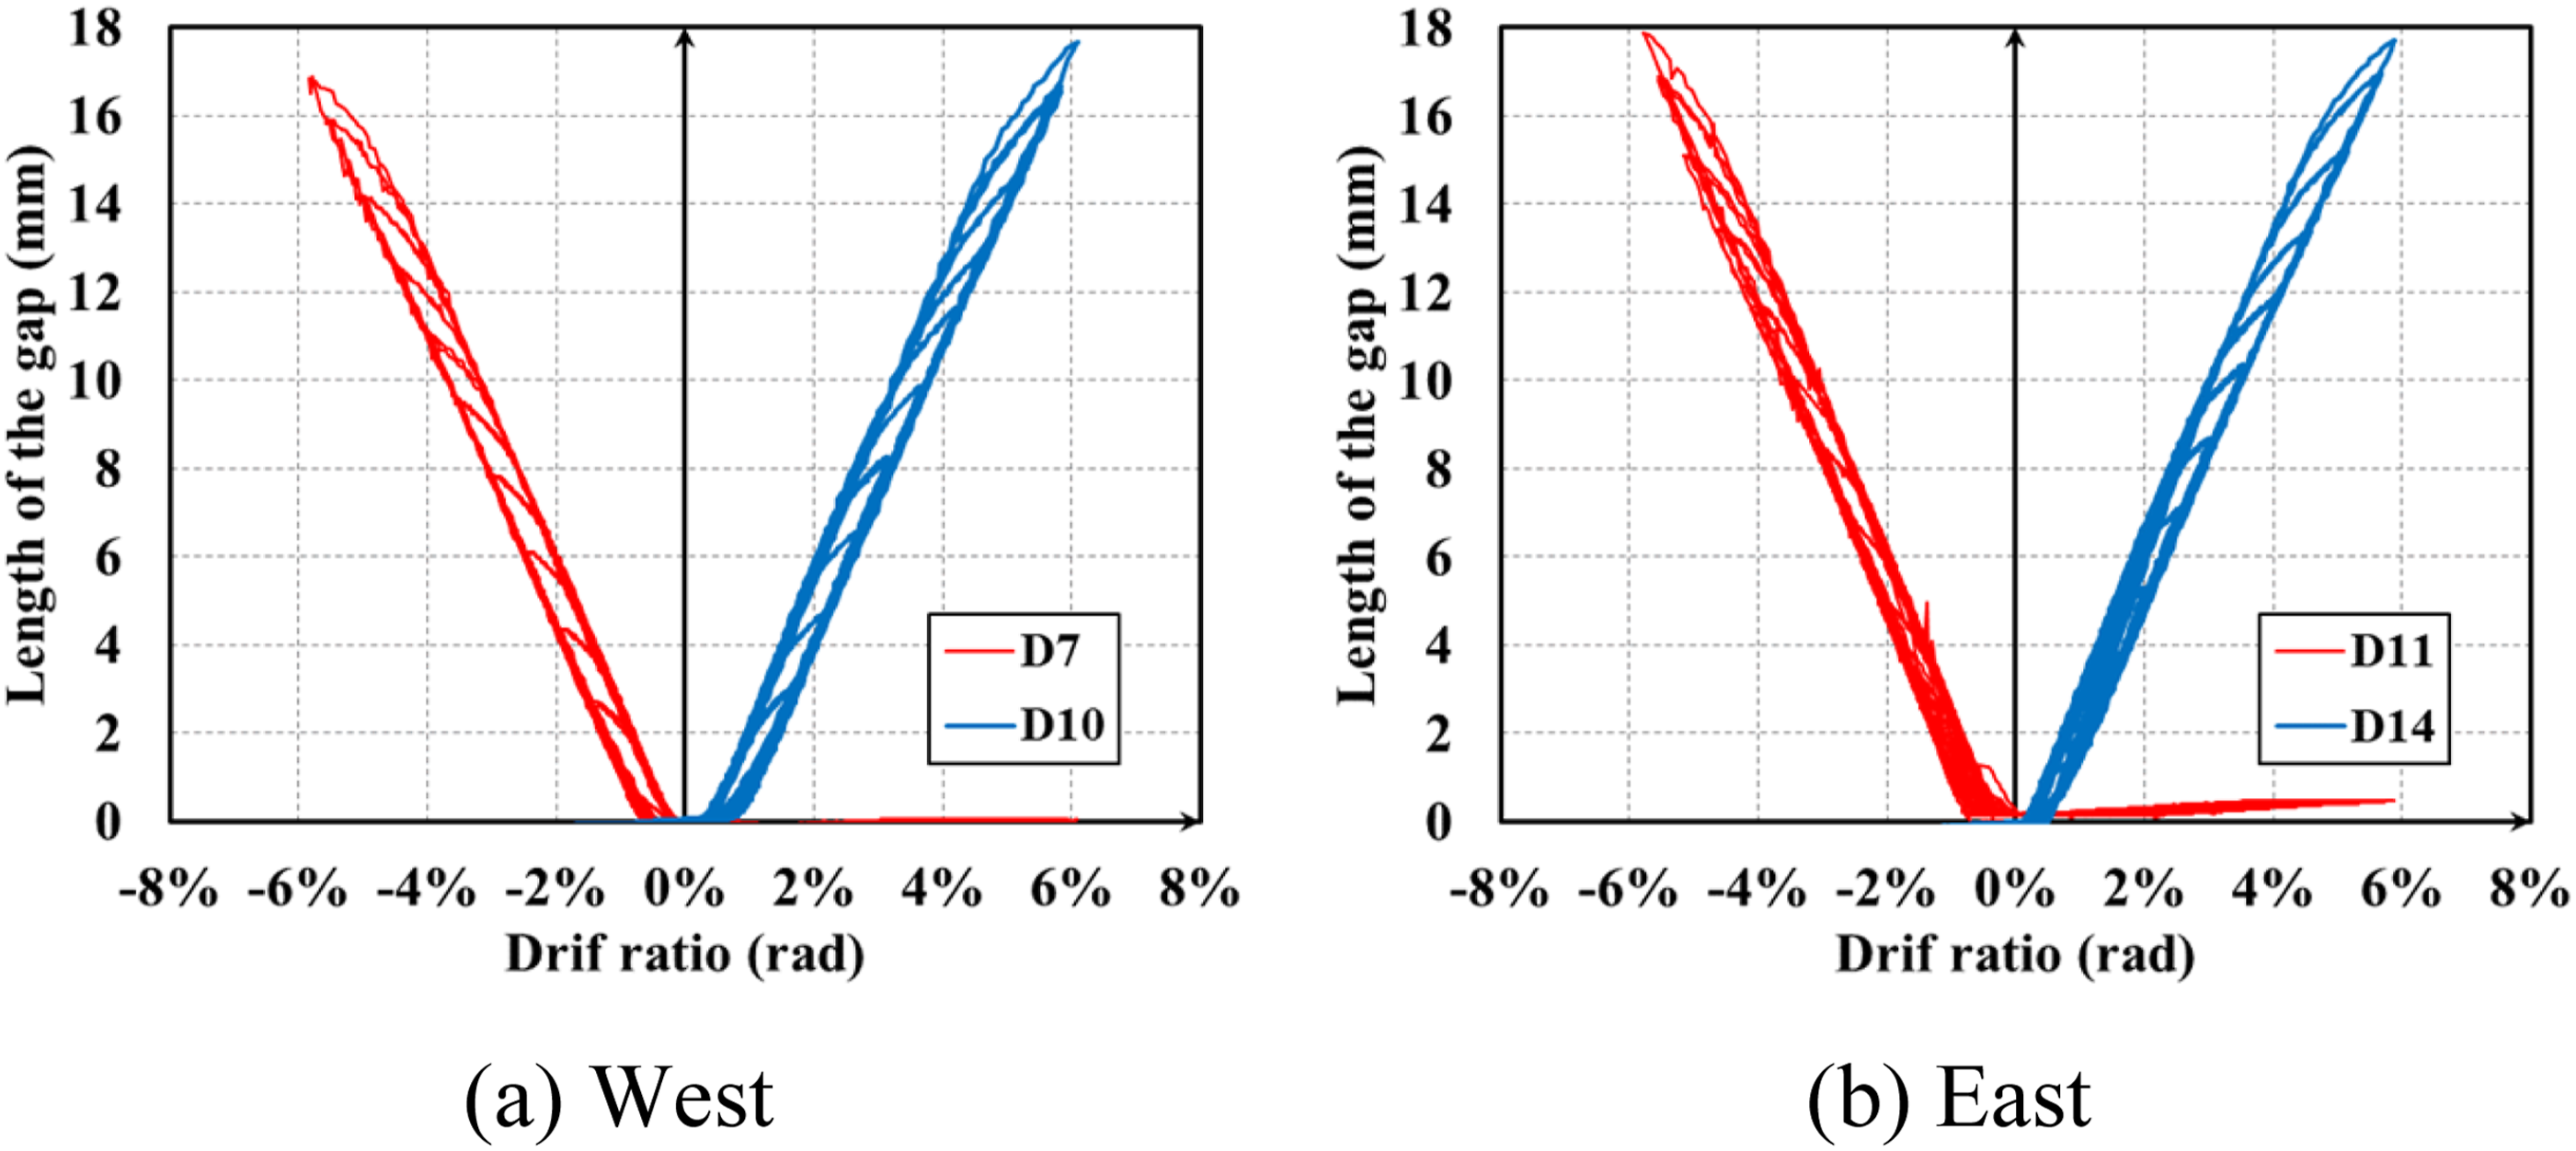
Rotation of the column end (Δ5) can be calculated by the measurement of column end deformation, as shown in Figure 20. When loaded to 6% drift ratio, the maximum loading level, the value of rigid rotation is about 0.45%, accounting for 7.51% of the total rotation. The rotation between the main beam and the transfer beam (Δ4) can be calculated by the length of the gap opening (Figure 21). The length of the gap almost increases linearly with the increase of drift ratio, and when loaded to 6% drift ratio, the average length of the upper and lower gaps is about 17.21 mm. If the length is divided by the beam height, it can be obtained that the relative rotation between the main beam and the transfer beam is about 4.3%, which accounts for 71.7% of the beam end’s total rotation. The proportion of other rotations relative to the total rotation at the beam end is approximately (1-7.51%-71.7% = )20.78%, including the rotation caused by elastic bending of the beam and column (Δ1 and Δ2), and the rotation induced by the shear deformation of the panel zone (Δ3). Rigid rotation. Variation of gap length with drift ratio.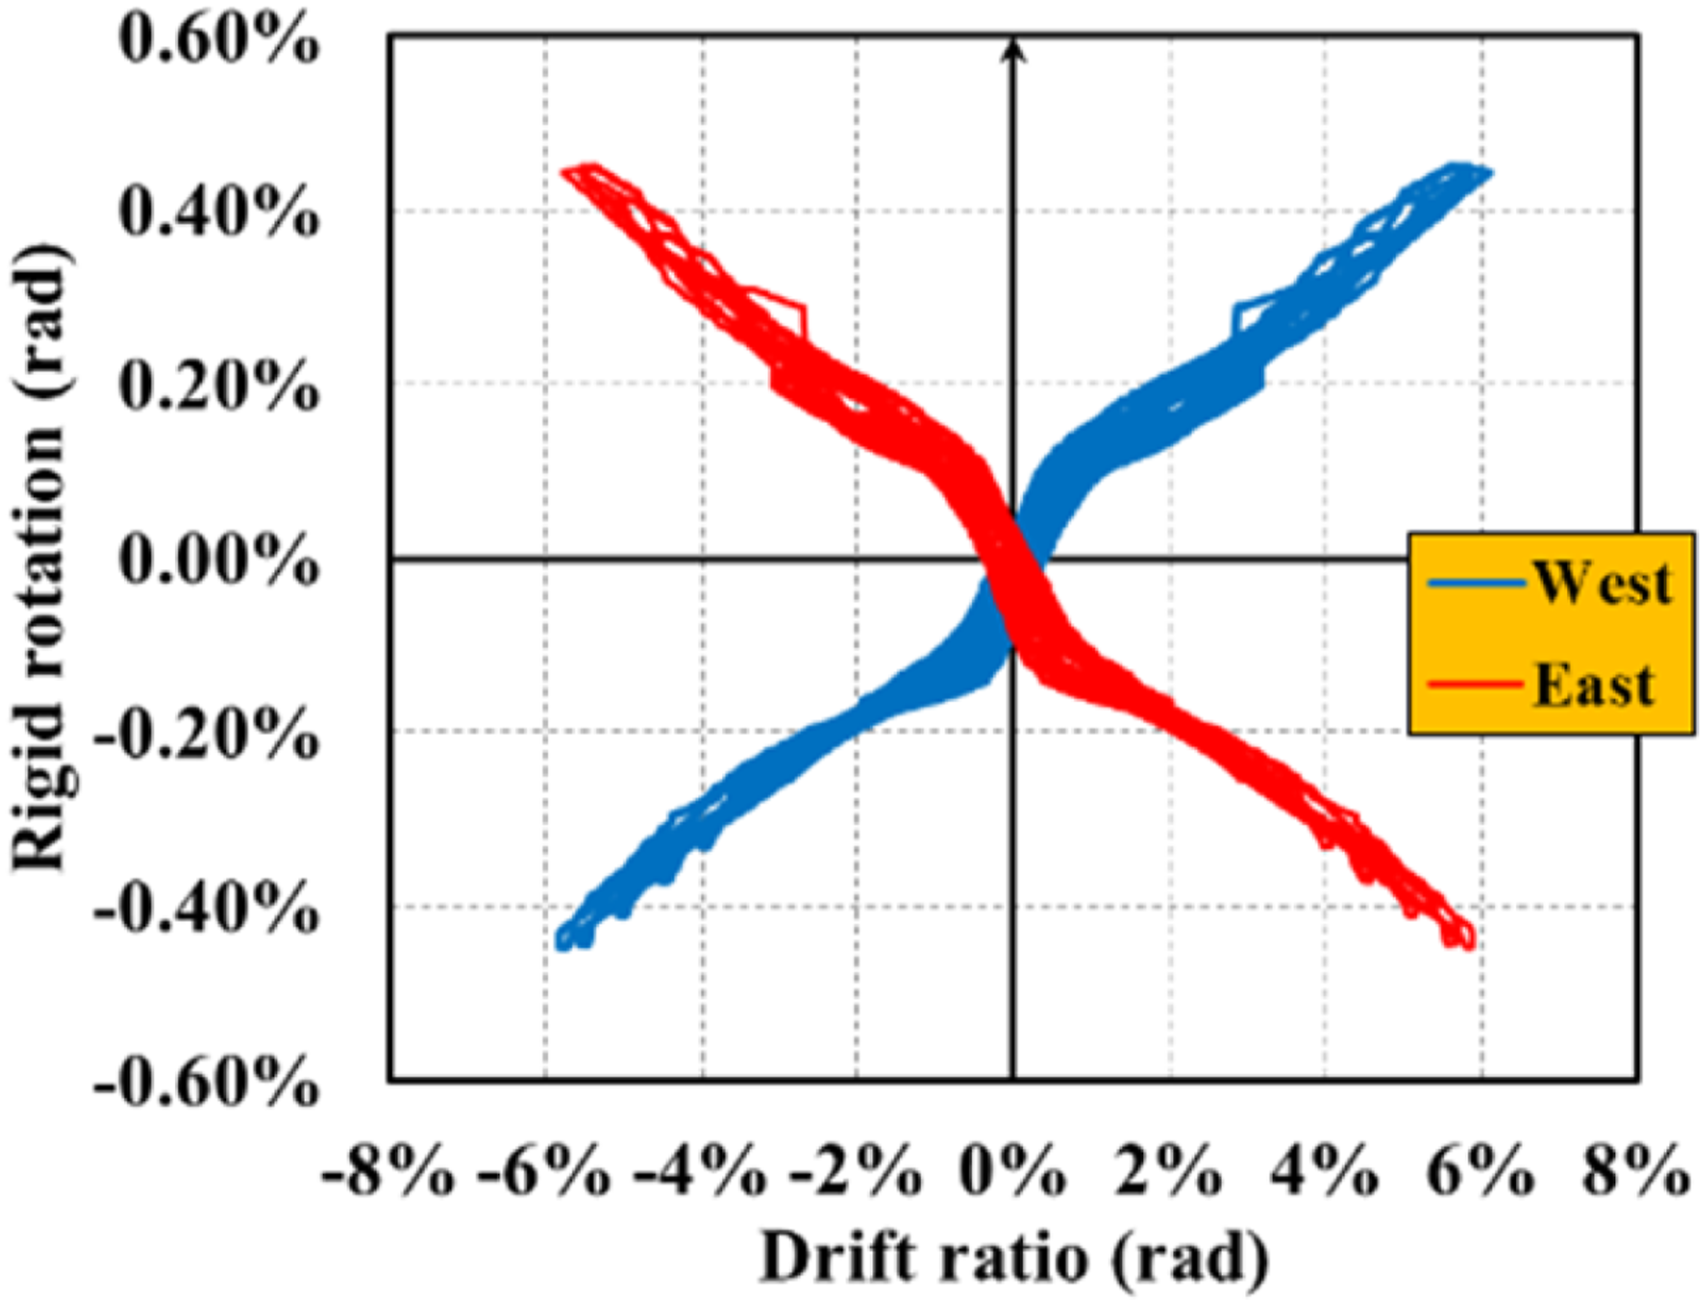
Strain analysis
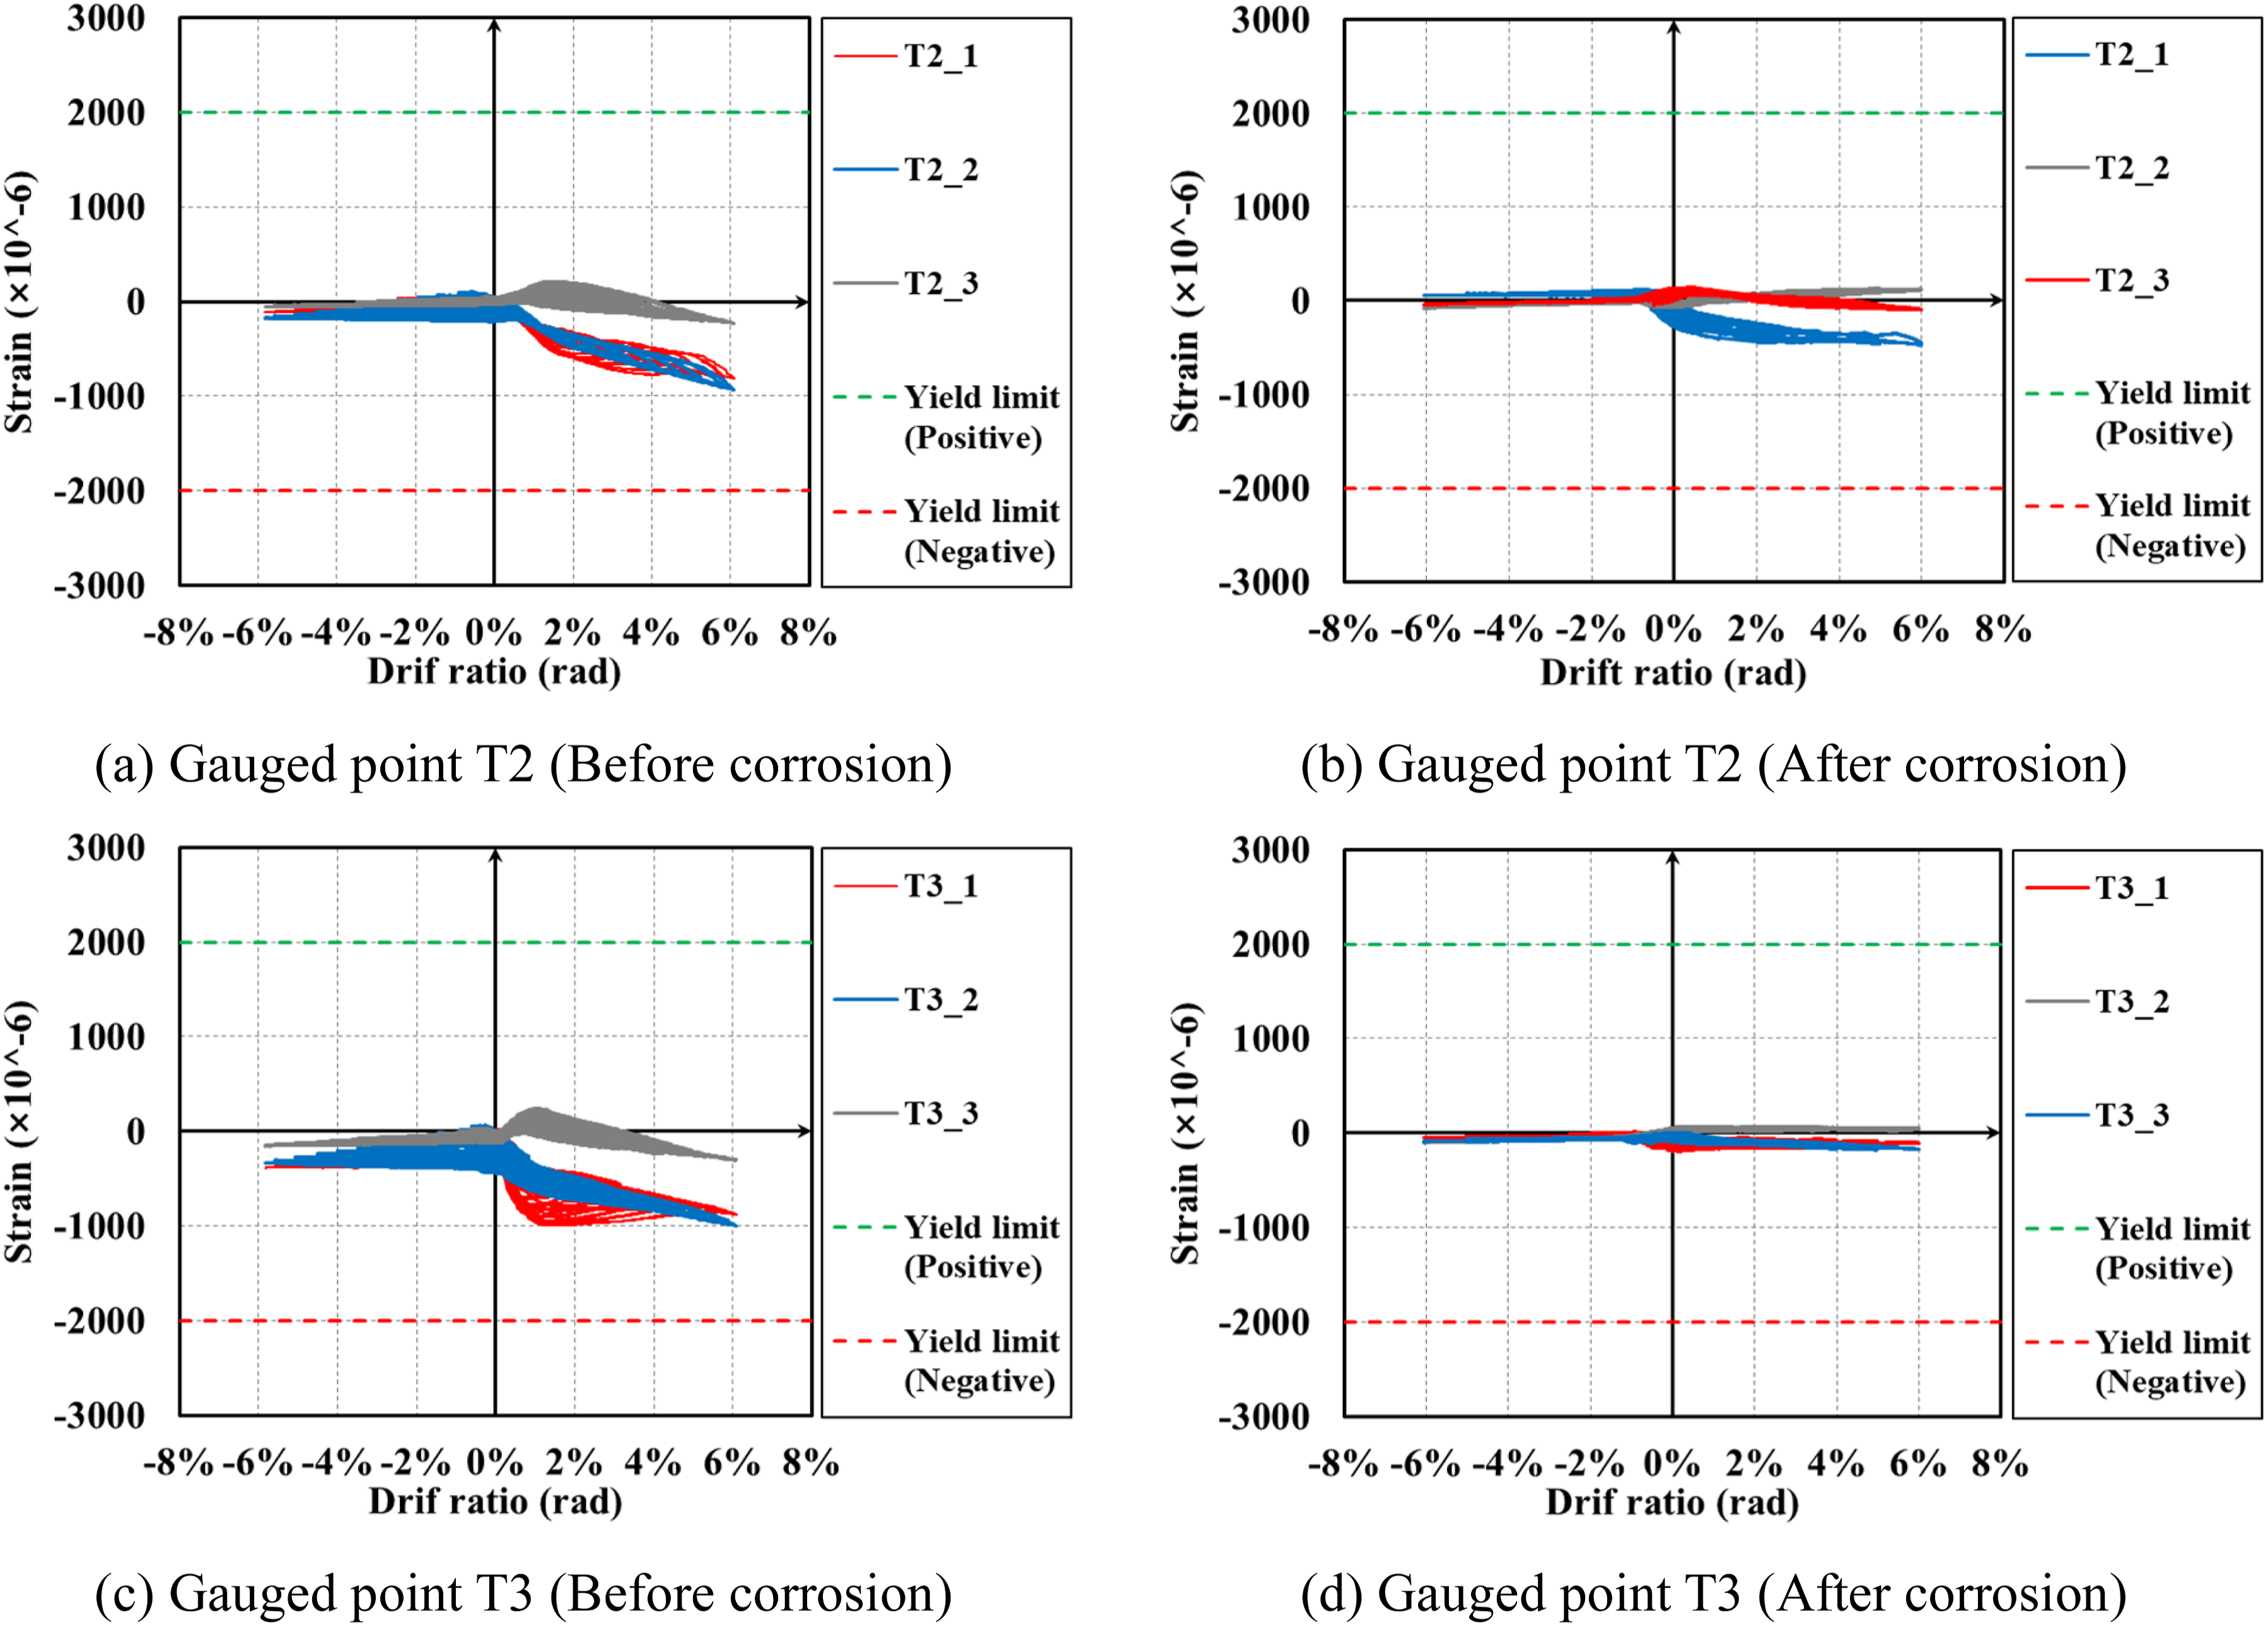
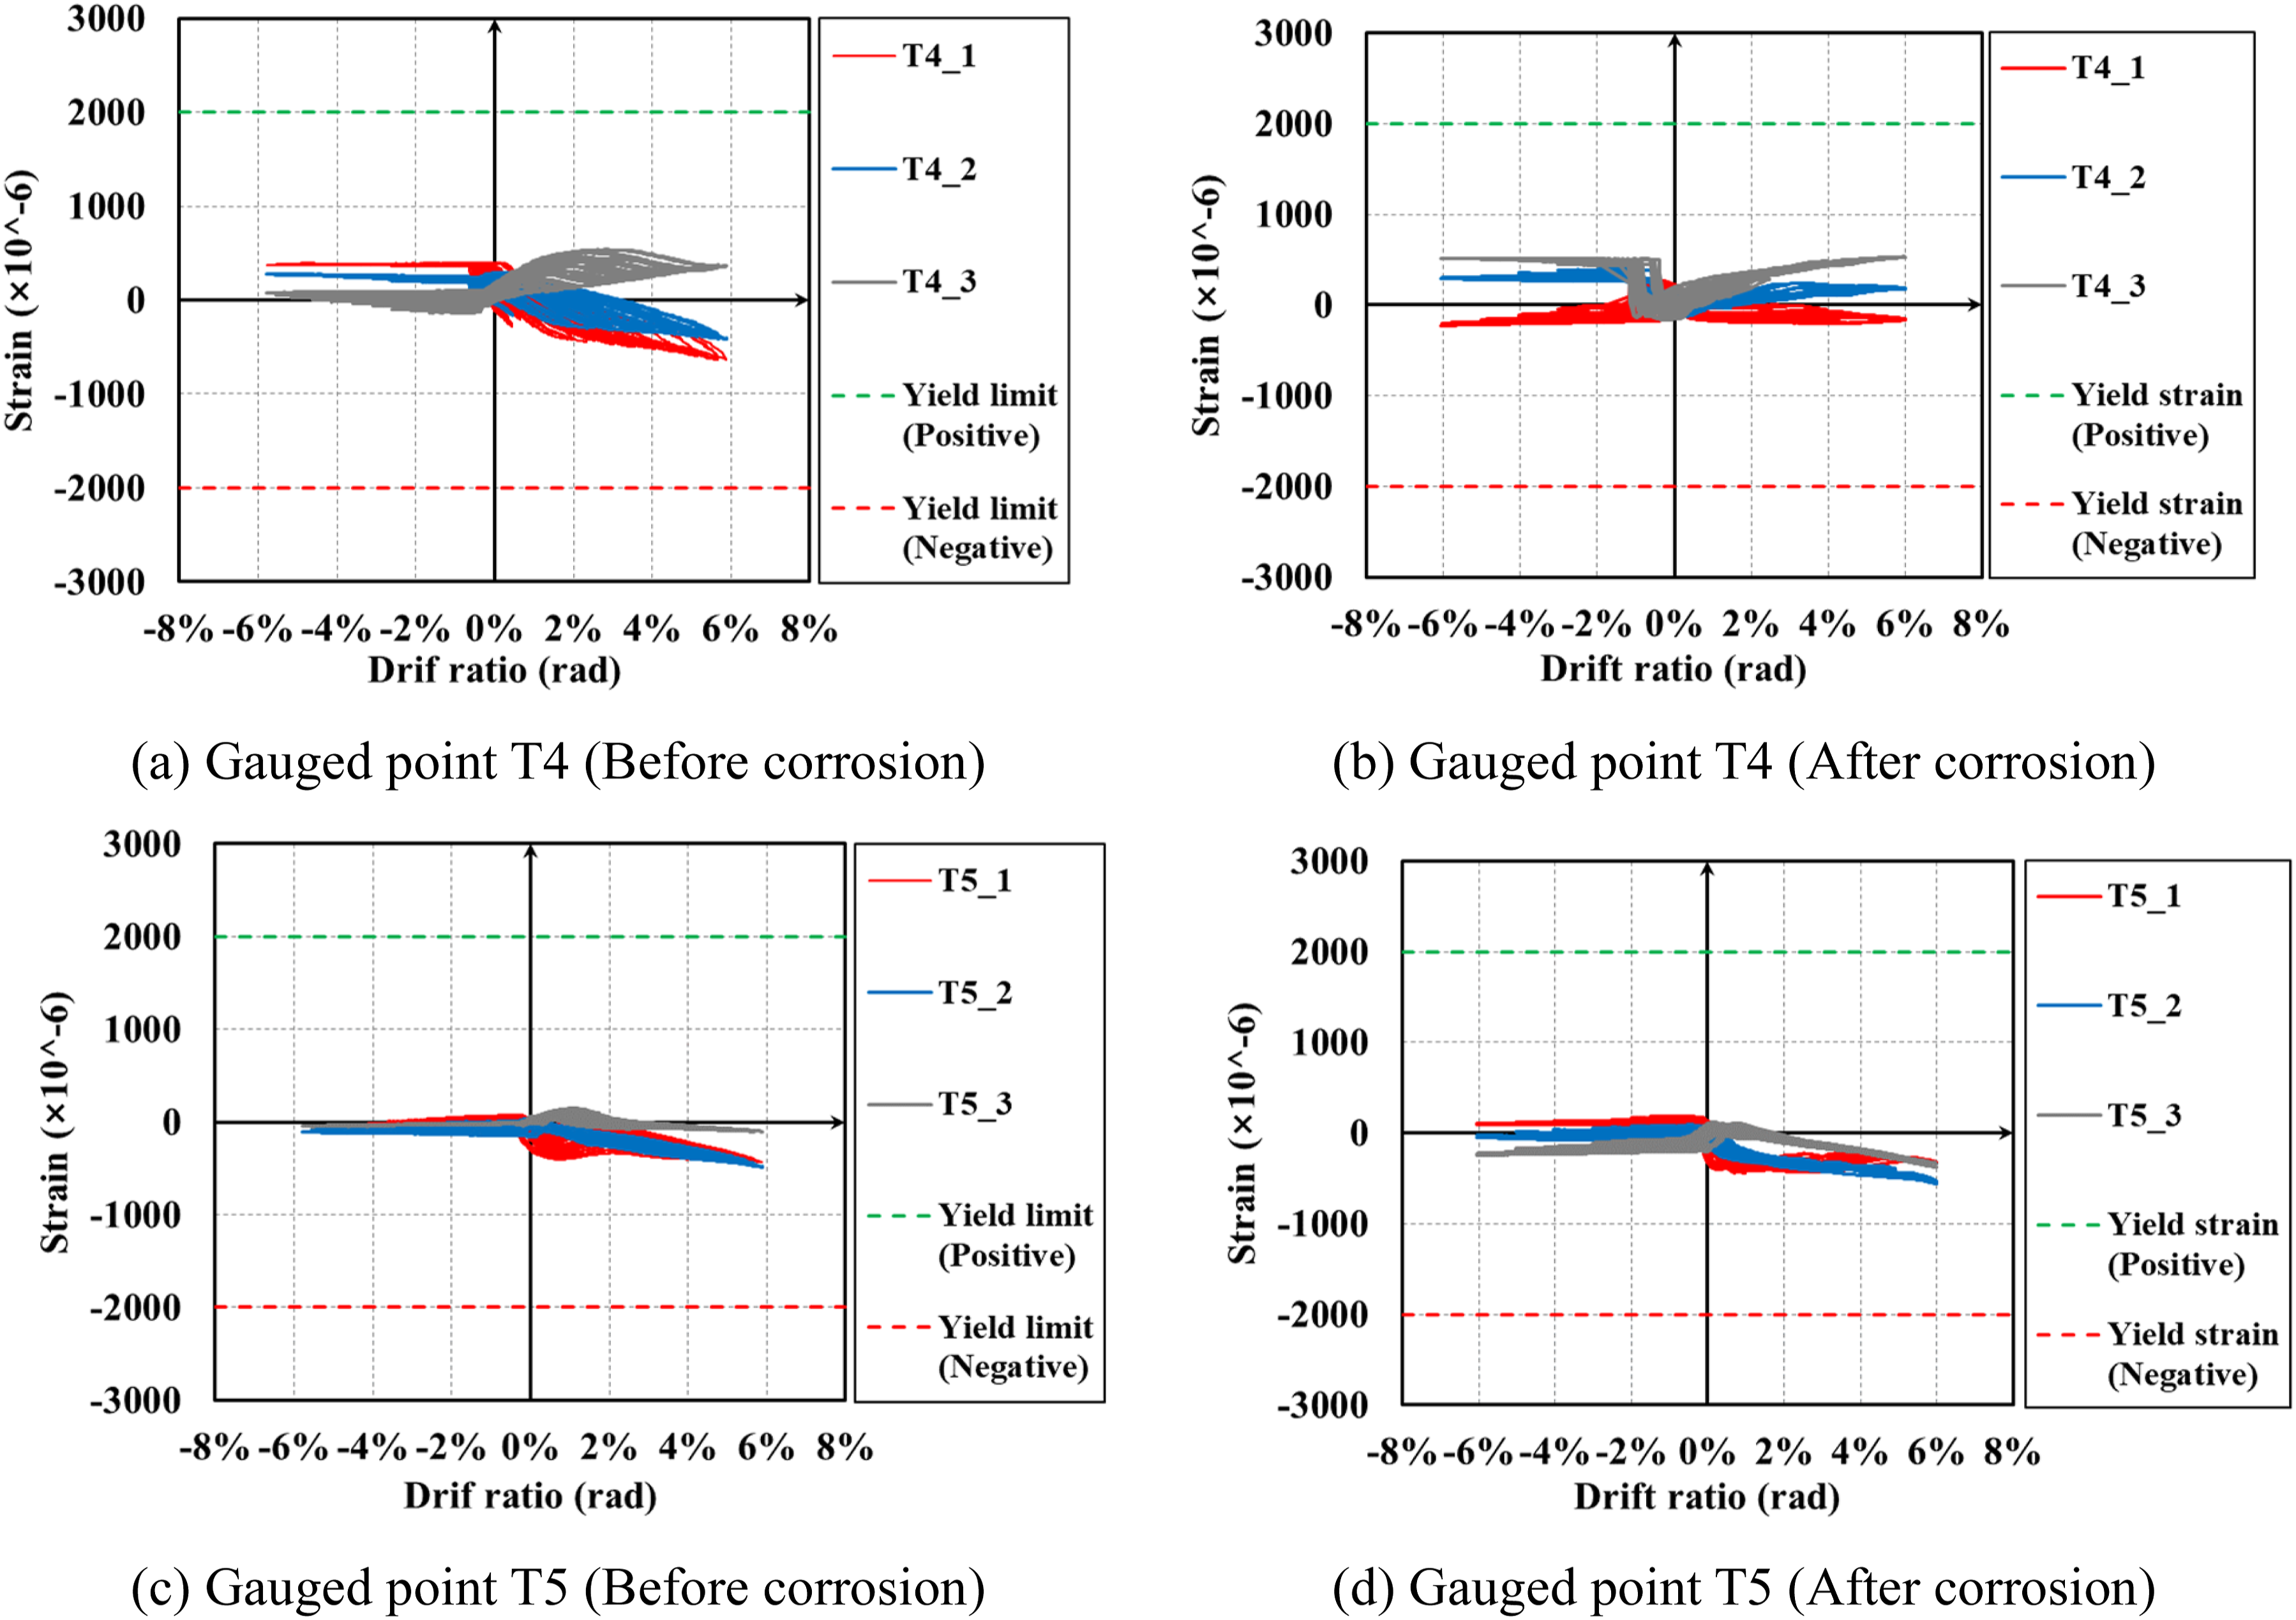
For the pre-stressed tendons, though their strain responses are similar to each other, the apparent difference is observed between measurements at different locations, as illustrated in Figure 22. The strain obtained in the middle section of bars (S10∼S12) shows a symmetrical response under cyclic loads, whereas an asymmetry is detected in the measurement of the end of the tendon (S1-S3). This is because that there is not only axial expansion but also local bending in the section near the gap, which makes the position easier to yield than other positions. For the gauged points at the transfer beam (Figures 23 and 24), the strain values didn’t exceed corresponding yield limit during the whole loading process, indicating an enough stiffness of the transfer beam. In addition, corrosion of the energy dissipative plate has no influence on the transfer beam (Figures 23(b) and (d) & 24(b) and (d)). It is evident that the main body of the newly-proposed self-centering connection can keep elastic during earthquake scenarios. Strains of the pre-stressed tendon. Strain readings at the end of the transfer beam (West). Strain readings at the end of the transfer beam (East).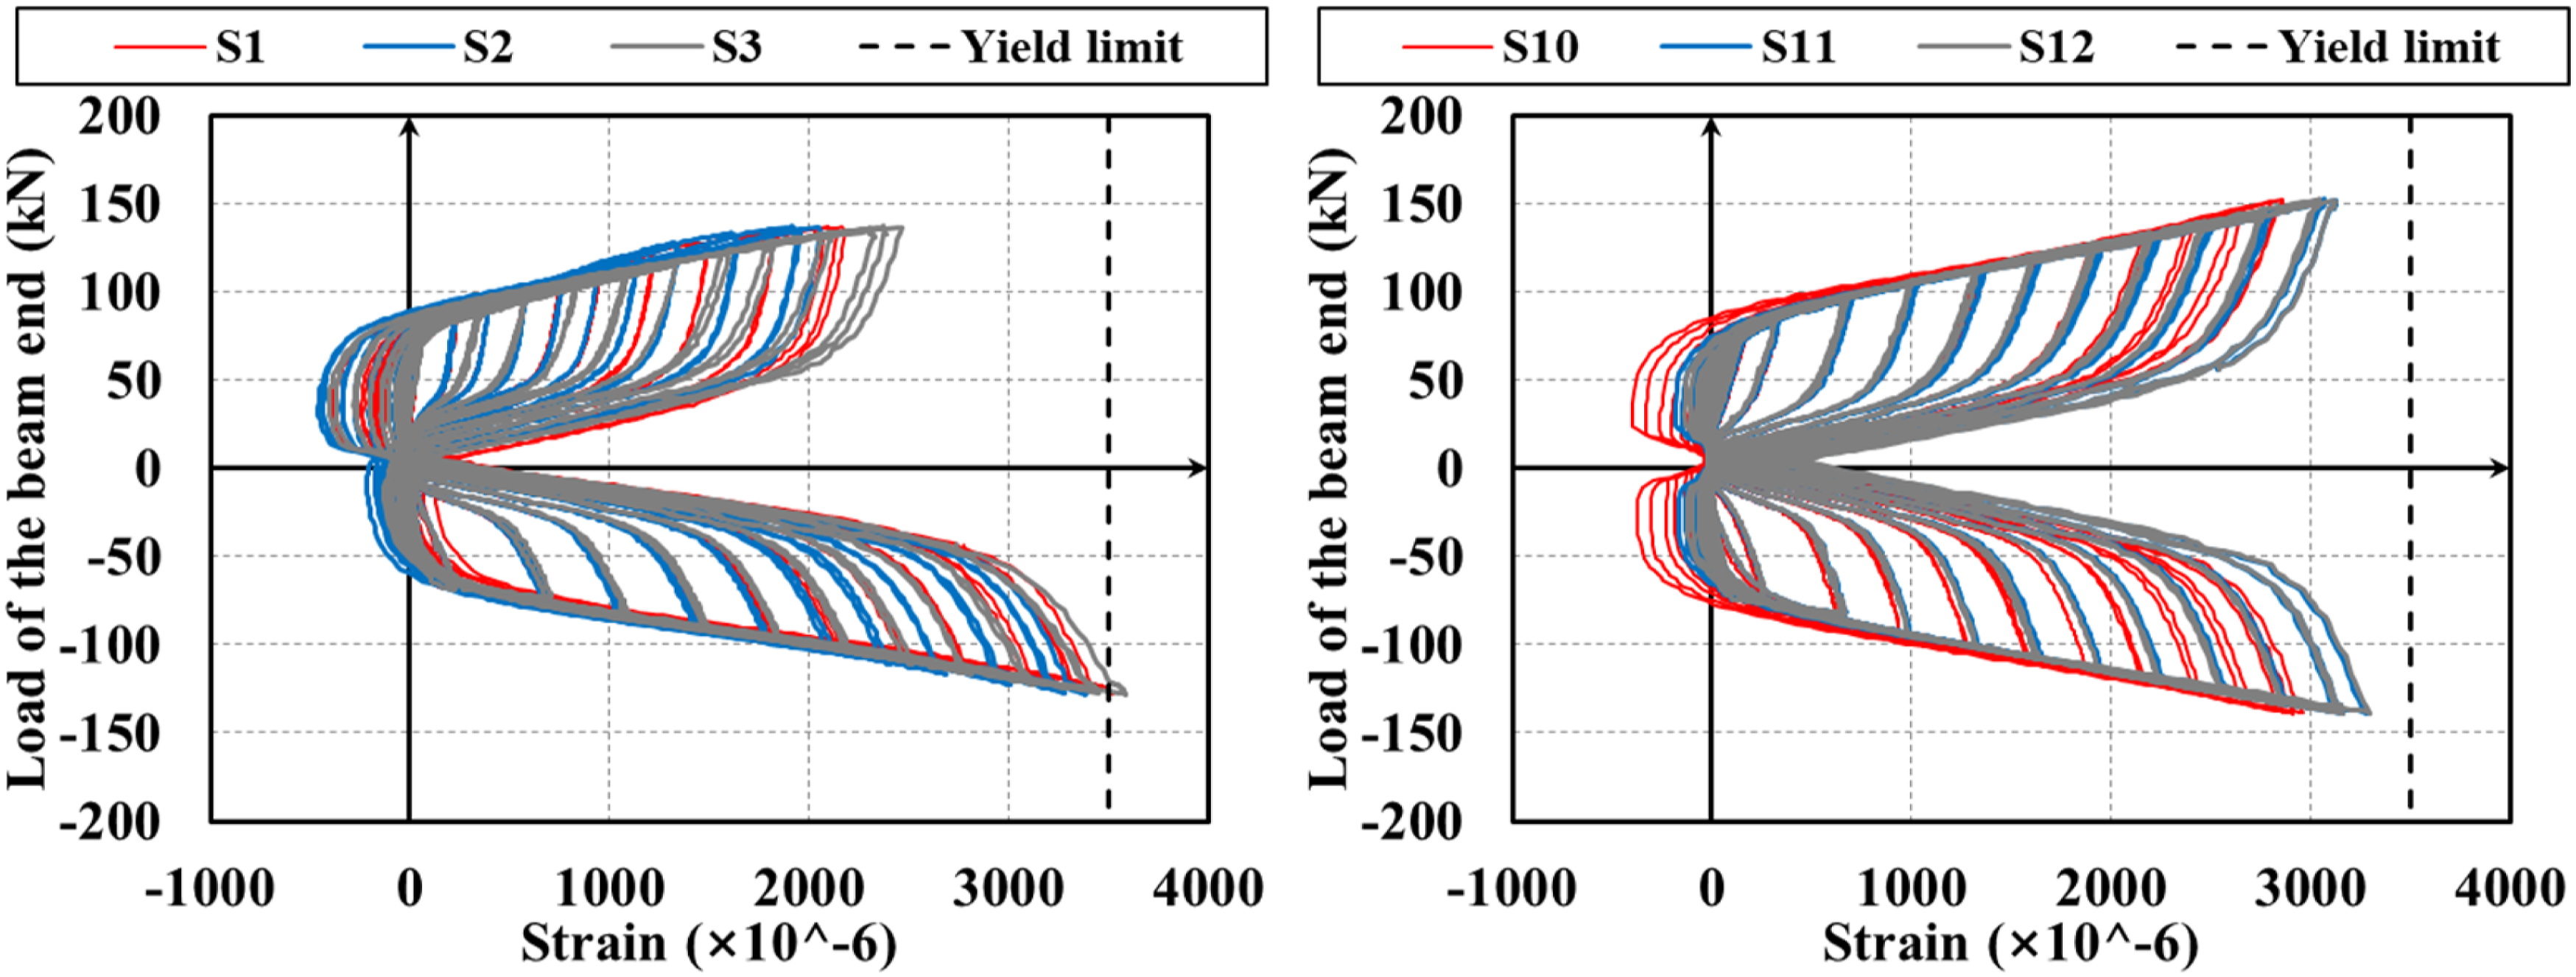
Numerical simulation
Geometrical model
To enhance calculation efficiency, following simplifications were considered for the finite element (FE) model: (1) Due to symmetry of the specimen, only half of the subject was modeled. (2) The shear plates and long circular holes between the main beam and the transfer beam, as well as corresponding bolts were neglected. Instead, constraint effect of the shear plates on the main beam was simulated by confining the displacements of X and Y directions of the main beam end center. The applications of necessary loads and boundary conditions (BCs) are shown in Figure 25(a): The ends of the column and the beam are first coupled to three reference points (RPs), so that corresponding load and BCs can be applied to these RPs. Also, the force-displacement of the beam end can be output by the corresponding RP. The preloads of the tendons and the bolts were applied with the type of “bolt load”, specific value of the preload on each tendon is 724 MPa, in consistent with that in the experiment (see section of Detailed dimensions). C3D8R elements were adopted to discretize the whole member, as illustrated by Figure 25(b). FE model of the self-centering connection (a) Loads and BCs; (b) Mesh.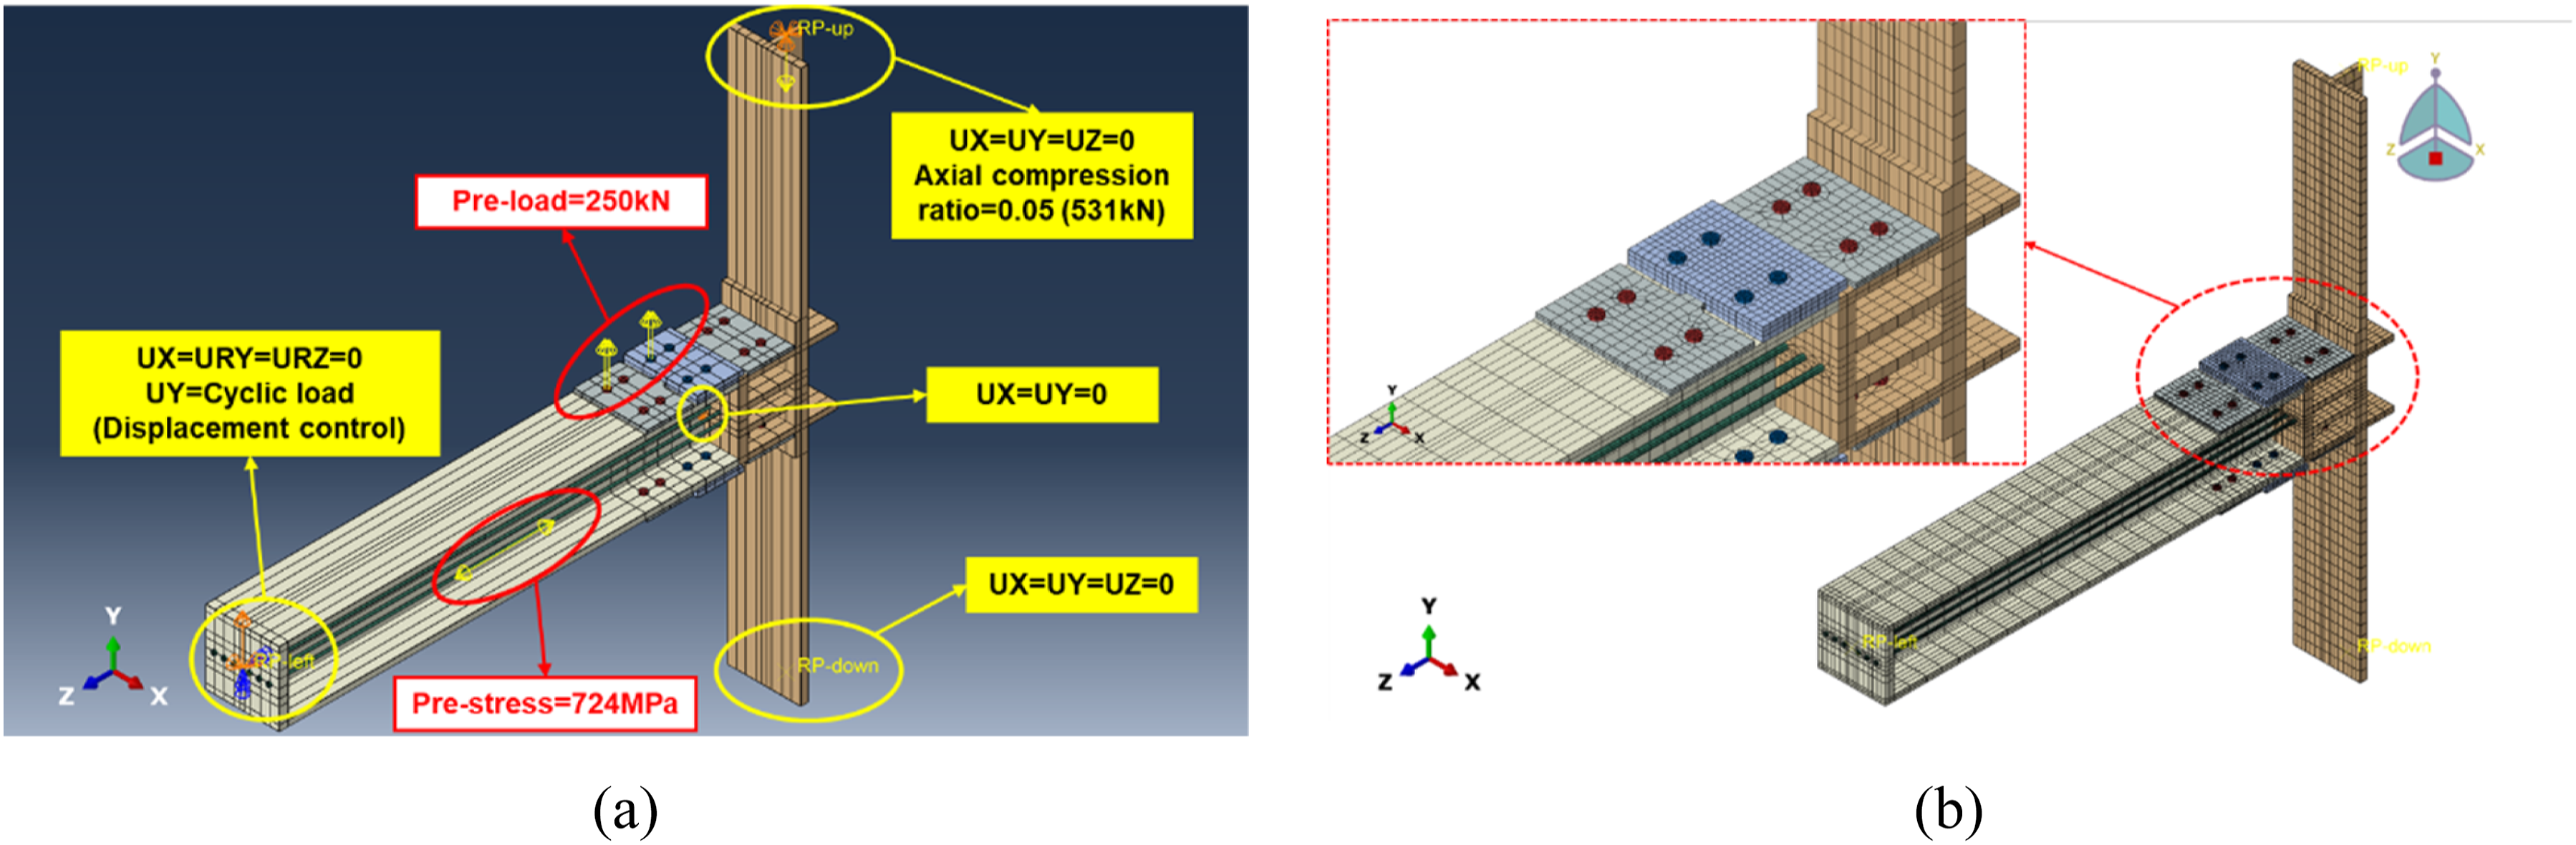
Constitutive model of the material
Chaboche combined hardening constitutive model (Chaboche, 1986, 1989, 1996; Chaboche and Rousselier, 1983) is used to characterize the cyclic plasticity behavior of the steel material. In this model, total stress is regarded as a summation of elastic stress, back stress, and isotropic stress. Accordingly, two kinds of hardening (i.e., nonlinear kinematic hardening and isotropic hardening) are included in the combined hardening model. For isotropic hardening part, following relationship exists (Voce, 1948):
For kinematic hardening part: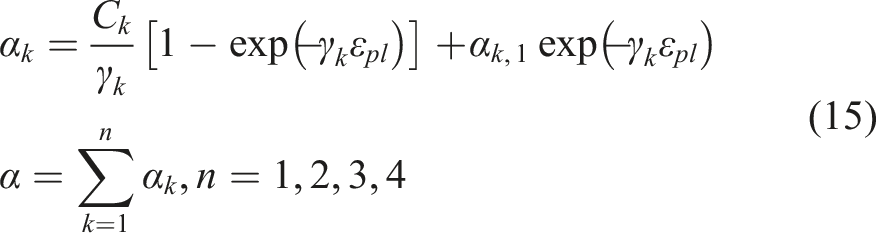
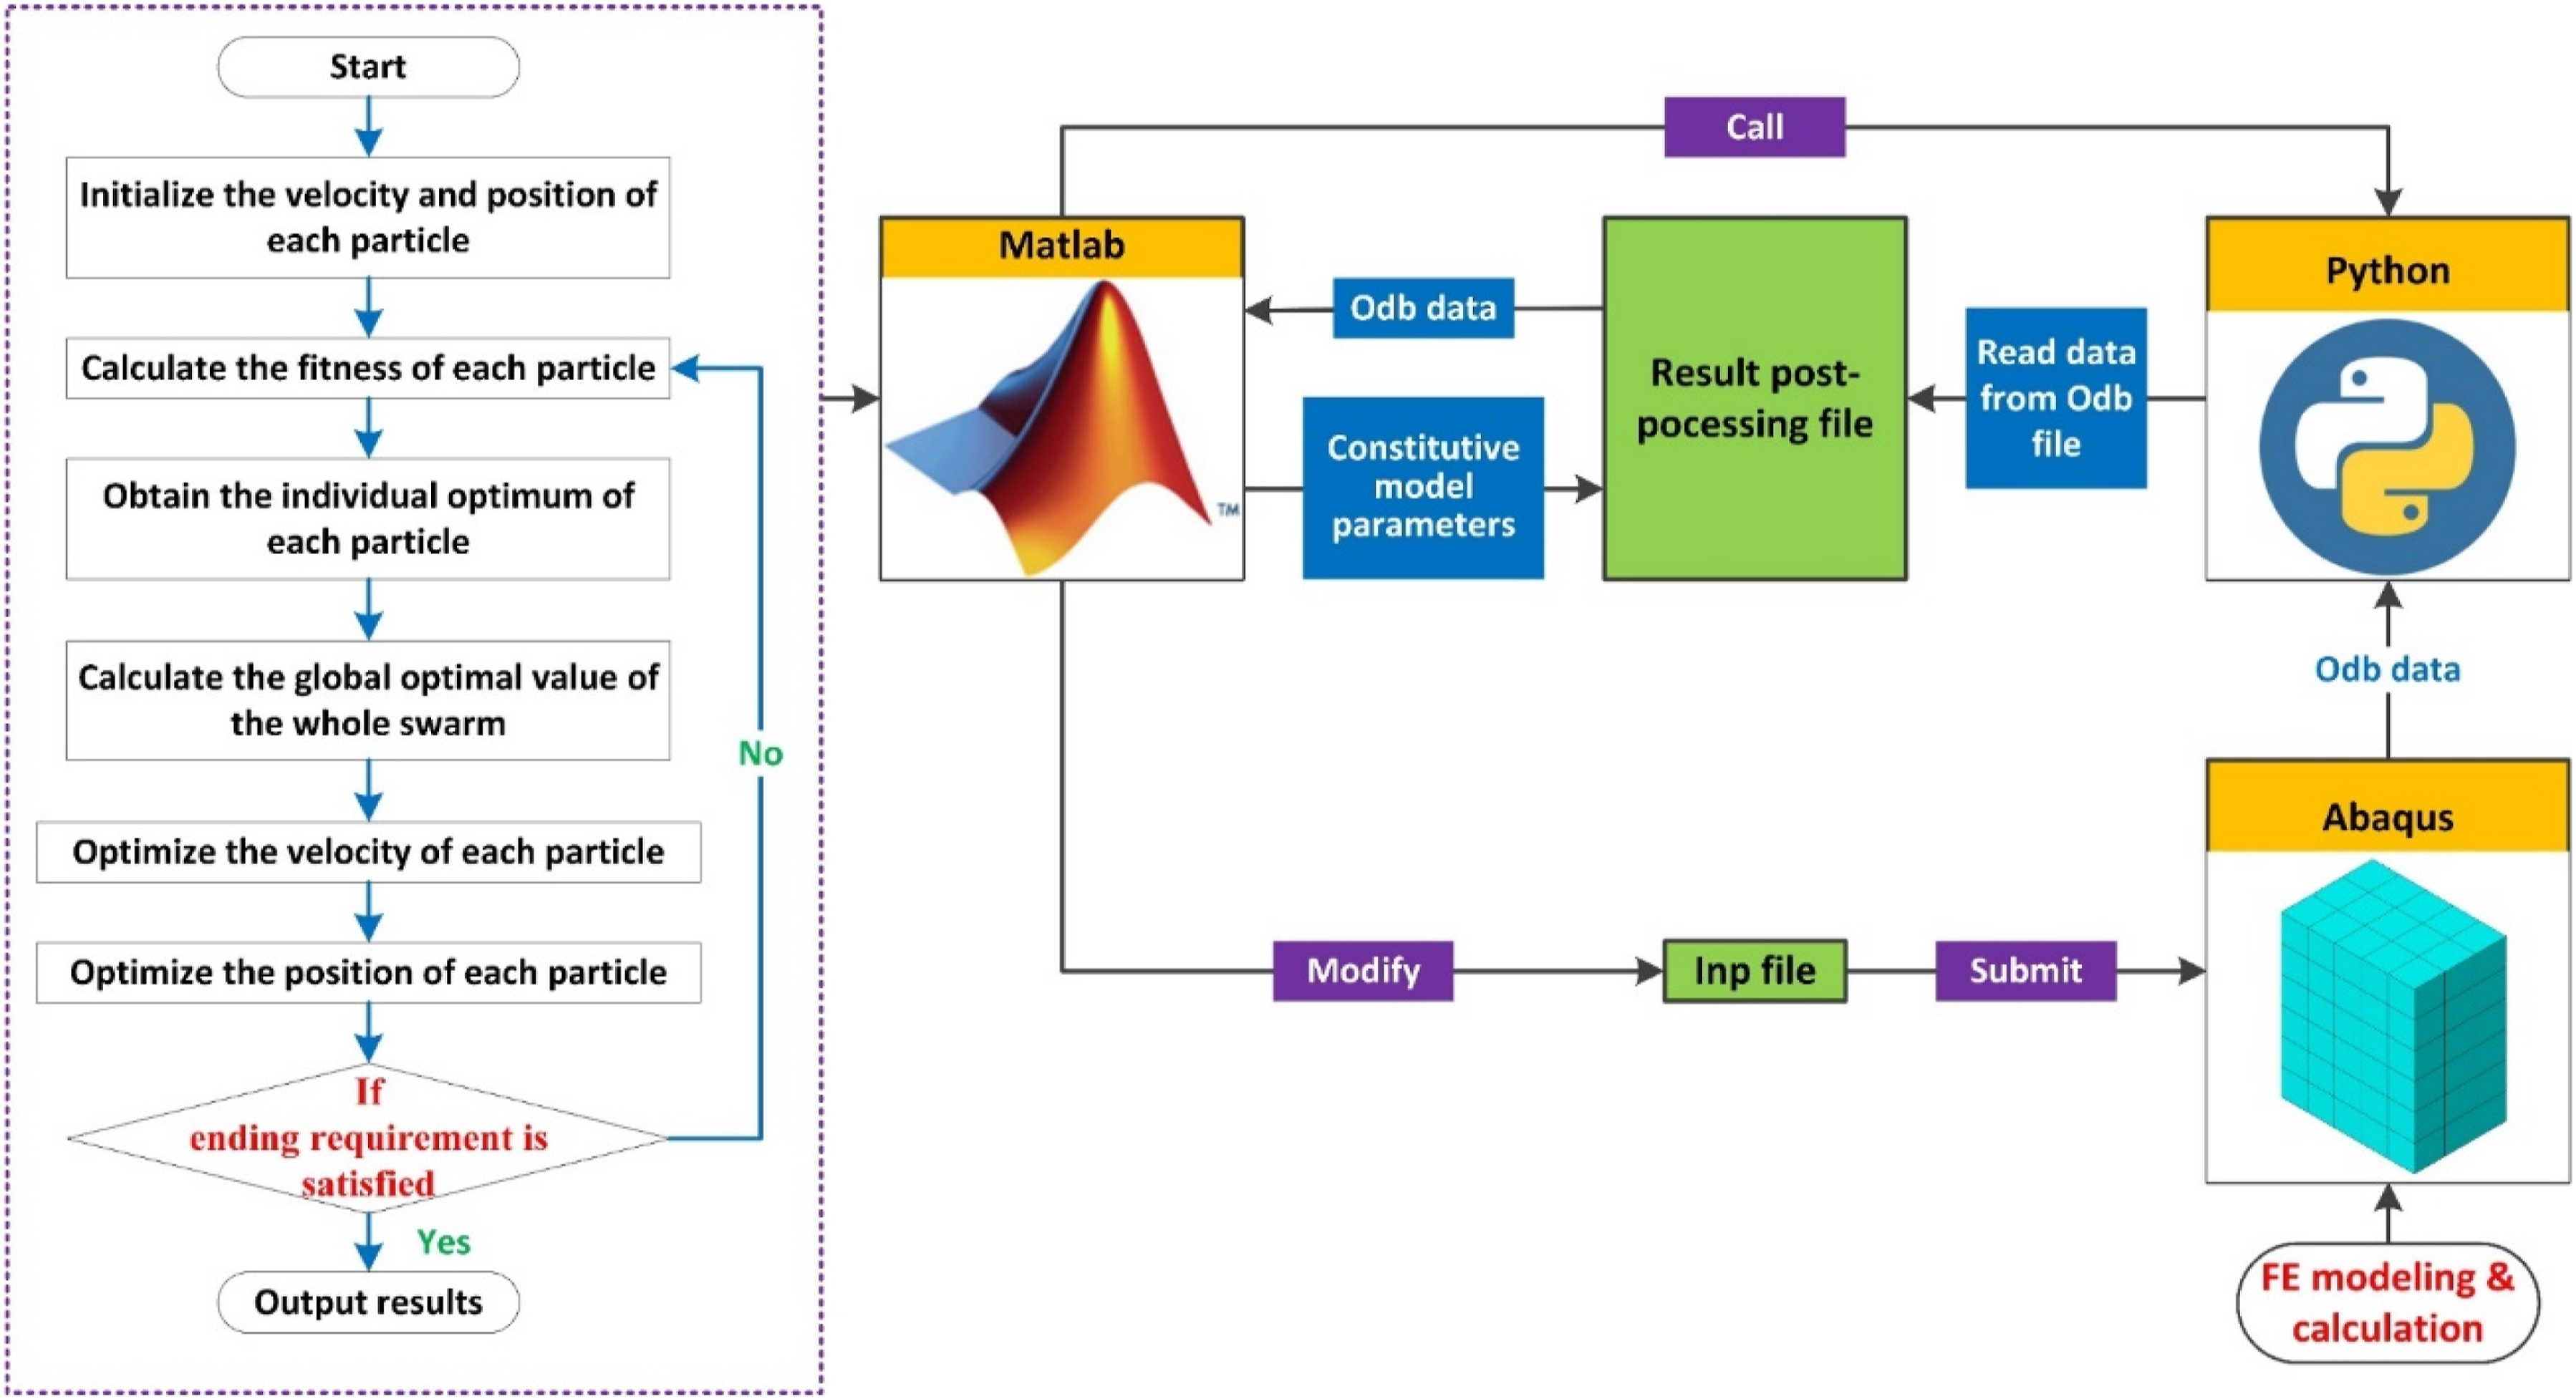
Several parameters such as Young’s modulus, yield stress, isotropic hardening parameters, and kinematic hardening parameters should be determined for the aforementioned constitutive model. Since times of trial-and-error processes are involved in conventional calibration method, automatic inversely calibration approaches on the basis of optimization algorithms are gaining popularity recently (Smith et al., 2017; Wang, 2021; Yao and Wang, 2022). The first step of inverse calibration is to create the finite element (FE) model of the gauged region by simulation software (taking Abaqus for example in this paper), and generate an inp. file, and then Matlab software can be used to call Abaqus and run the inp. file, so as to obtain the result post-processing file with the format of odb. The next step is to read the force-displacement data of the coupon’s gauged region from the result post-processing file by the built-in Python interface of Abaqus, and convert the load-displacement data to stress-strain data, in which way the simulated value of stress can be compared with the measured value. Notably, simulation values and experimental values do not correspond to each other, due to the difference in data collection frequency between simulation and experiment processes. To overcome this problem, different methods can be used to match the simulation values and experiment values: The first one is adjacent point searching method. However, a certain degree of difficulty exists with regards to coding in this method, due to subjectivity in the selection of error tolerance; The second one is defining data output frequency in Abaqus software, to make the FE calculation output one-to-one corresponding data points with experimental values; The third one is to interpolate the experimental curve and the simulation curve into two new curves with identical abscissa. Here the last method was adopted. The comparison between simulation value and experiment value should be quantified by an error function (also called as objective function or fitness function), which has various forms. To enhance calculation efficiency, residual sum of squares (RSS) is utilized as the fitness function in this paper:
The error function can be reduced gradually by PSO algorithm (Kennedy and Eberhart, 1995), which is a searching algorithm to solve optimization problems in numerical mathematics. Convergence rate of the algorithm is fast, and the calculation cost is relatively small (Lalwani et al., 2013; Wang et al., 2022b; Xiao et al., 2022; Yang et al., 2019). The working procedure of PSO, as well as the whole calibration procedure is demonstrated in Figure 26. First of all, initial parameters are randomly assigned to each particle, and the objective function value of each particle can be calculated. The historical best parameter group of a single particle is updated according to the value of fitness function. The next step is to judge whether the convergence condition is met, if not, the parameter group of each particle and parameter changing velocity should be further updated. The loop is repeated until the maximum iteration number or the convergence condition is reached. The formulas for updating velocity and parameters can be generally expressed as: Flow chart of inverse calibration procedure.
Local optimum can be avoided by using a larger inertia factor at the initial stage of the algorithm, while a smaller inertia factor can lead to a more stable convergence outcome. Therefore, linear decreasing weighting method is adopted to adjust the inertia factor:
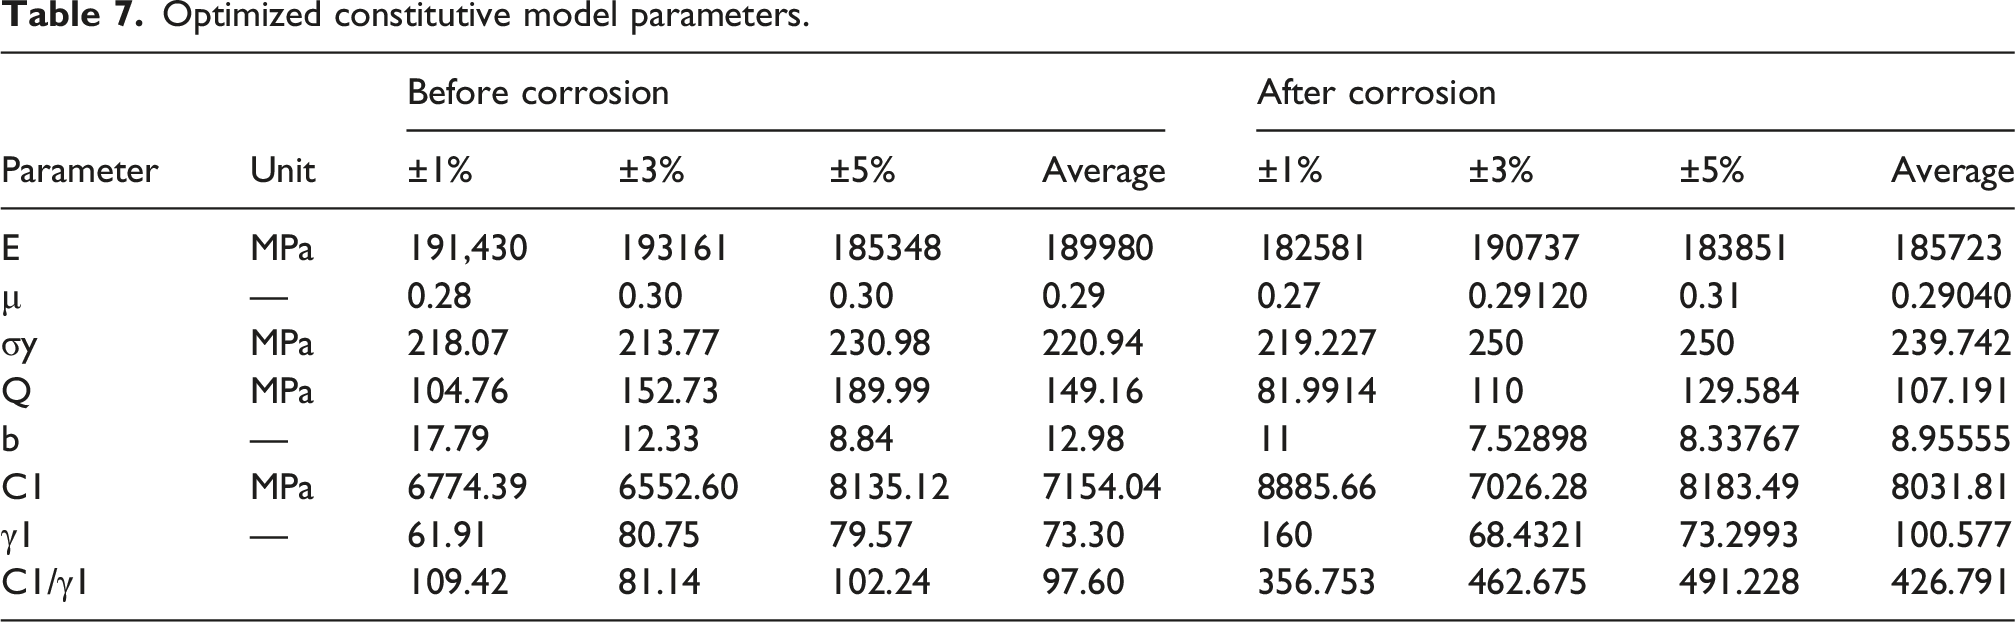
Optimized constitutive model parameters.
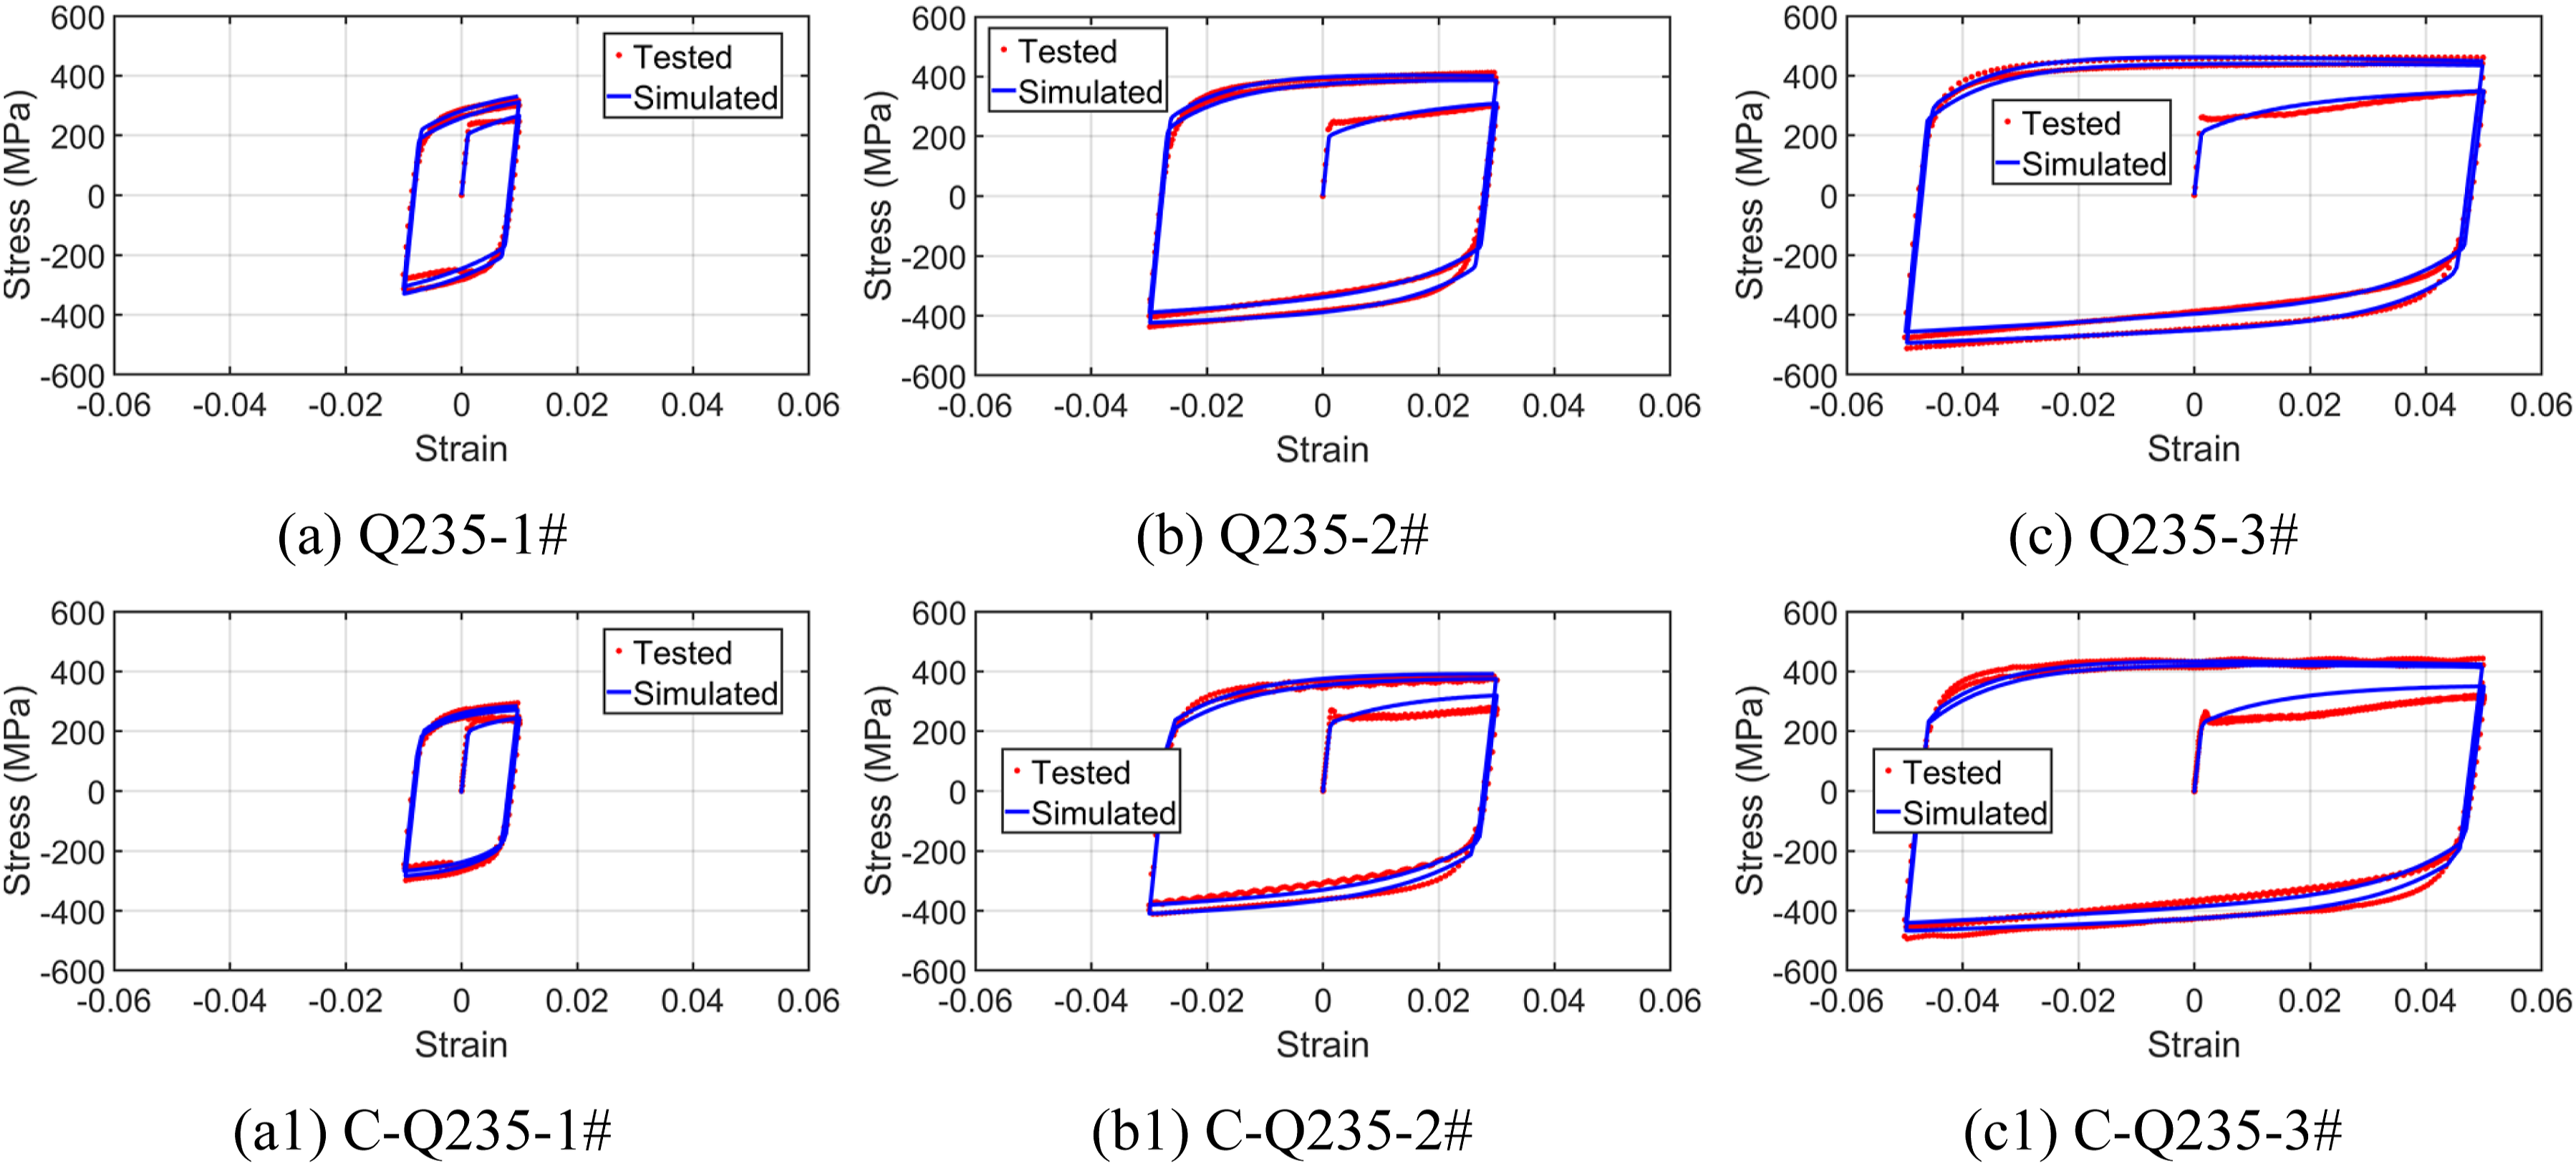
Comparisons on the hysteresis curves of Q235 round bar specimens simulated by the optimized constitutive model parameters and experimental results.
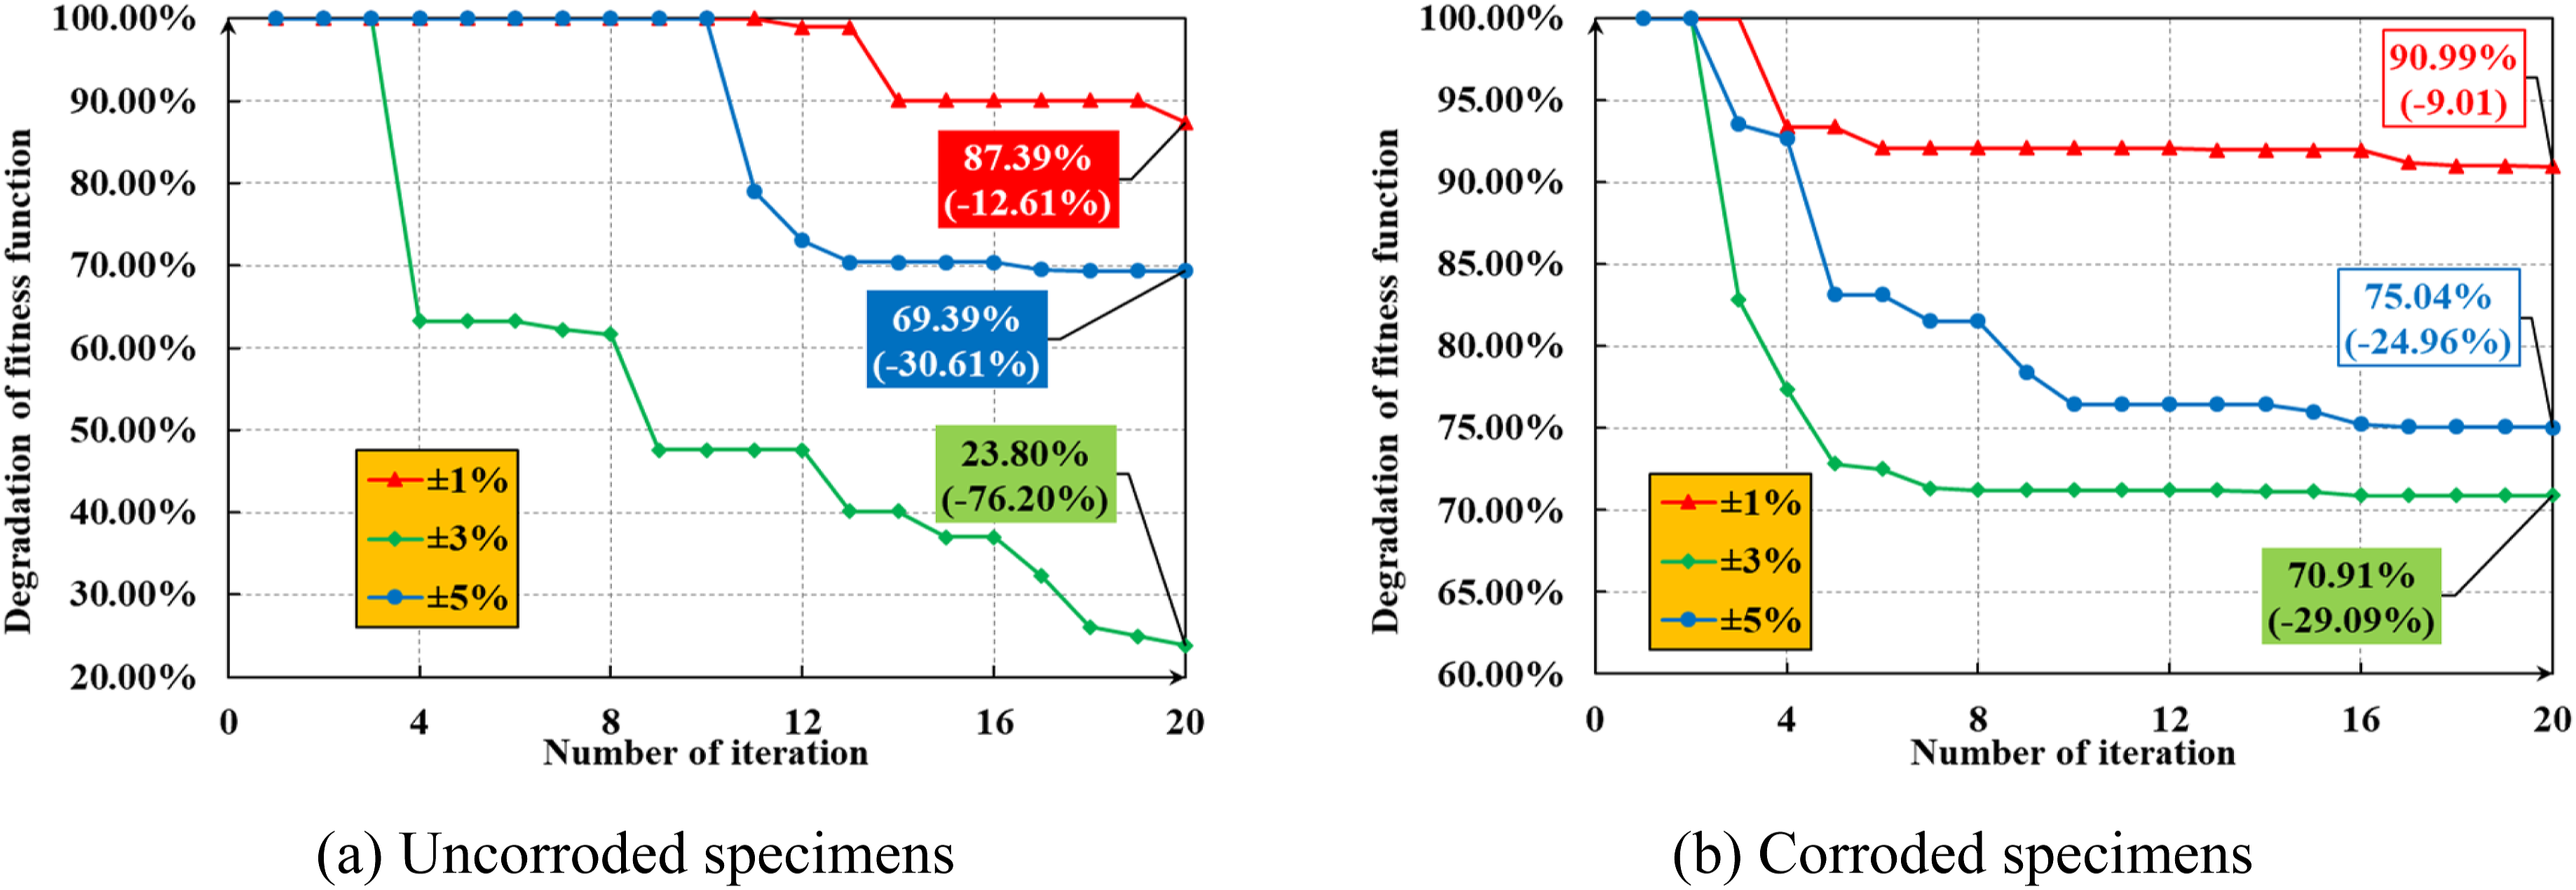
Decrease of the objective function with iteration number.
Simulation results
Figure 29 compares the hysteresis curves calculated by different material constitutive models (kinematic hardening, isotropic hardening, and combined hardening) and the experimental curve (taking the west part before corrosion for example). According to the experimental curve, the whole specimen exhibits a certain degree of isotropic hardening. Especially during the unloading excursion, the hysteresis loop shows a tendency of expansion gradually. Therefore, kinematic hardening is inappropriate to be used to conduct FE simulation (Figure 29(a)). However, when only isotropic hardening is involved, the peak load, residual deformation, and the area of hysteresis loop will be overestimated (Figure 29(b)). As a result, combined hardening was used to calculate seismic behavior of the self-centering beam-to-column connections before and after corrosion of the energy dissipative plates (Figure 29(c)). Figure 30 shows the comparison between the hysteresis curve calculated by FE and that obtained by experiment. It can be found that the simulated curve agrees well with the experimental one, verifying the effectiveness of the simulation model. As declared in the section of Experimental procedure and results, the stiffness and strength of the whole joint and the PT cables are assumed to be high enough to resist slight corrosion, i.e., earthquake forces will be transferred to the dog-bone plates effectively even after slight corrosion of the whole joint. Therefore, it is anticipated that the influence of slight corrosion of the whole joint and the PT cables on the overall performance of the connection can be neglected. On the other hand, it is difficult to conduct this in tests. To compensate this limitation of the test, the corrosion of the whole joint and the PT cables are considered in the simulation. The deteriorated performance of the main components induced by corrosion can be considered by reducing the material properties (Zhang et al., 2024): Comparison of the hysteresis curves calculated by different material constitutive models with the experimental curve. Comparison between FE calculated hysteresis curves and experimental ones. Numerical results under the conditions whether corrosion of the main components is considered.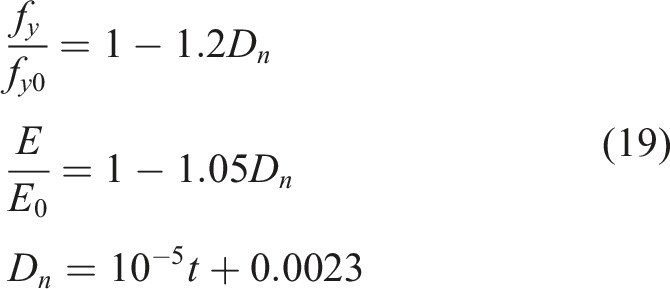
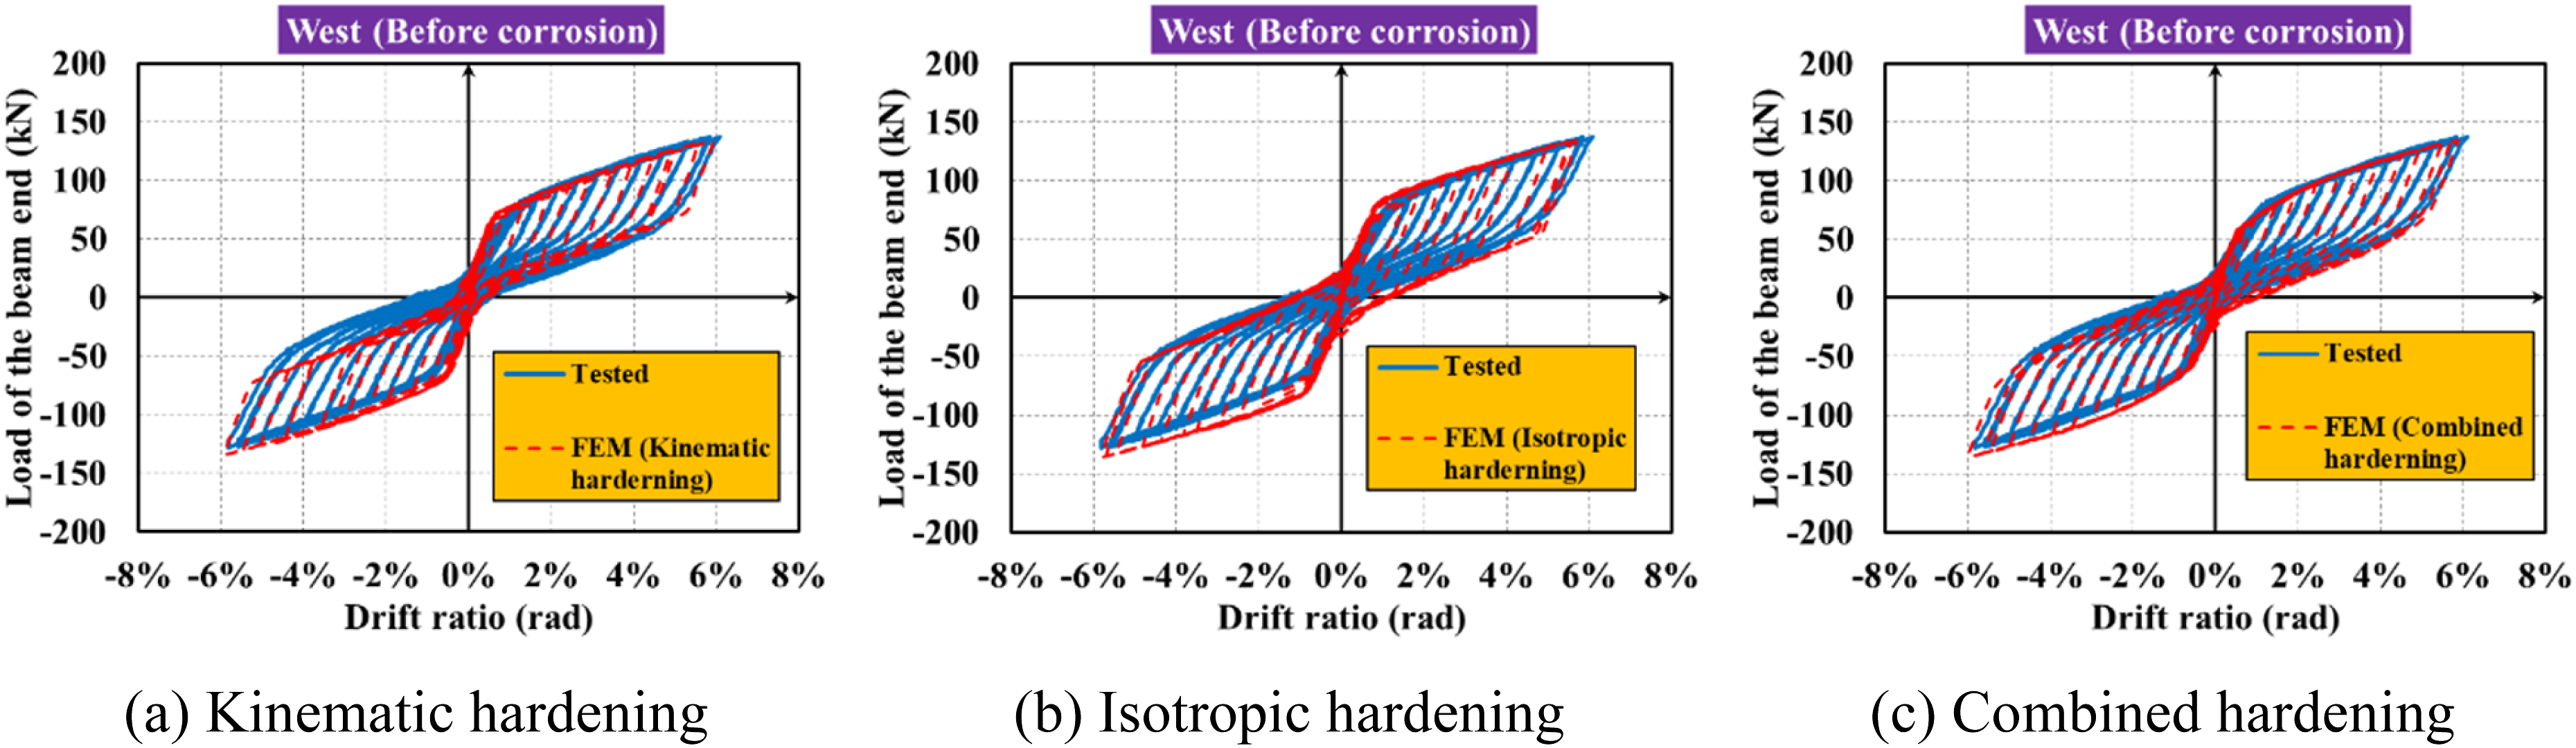
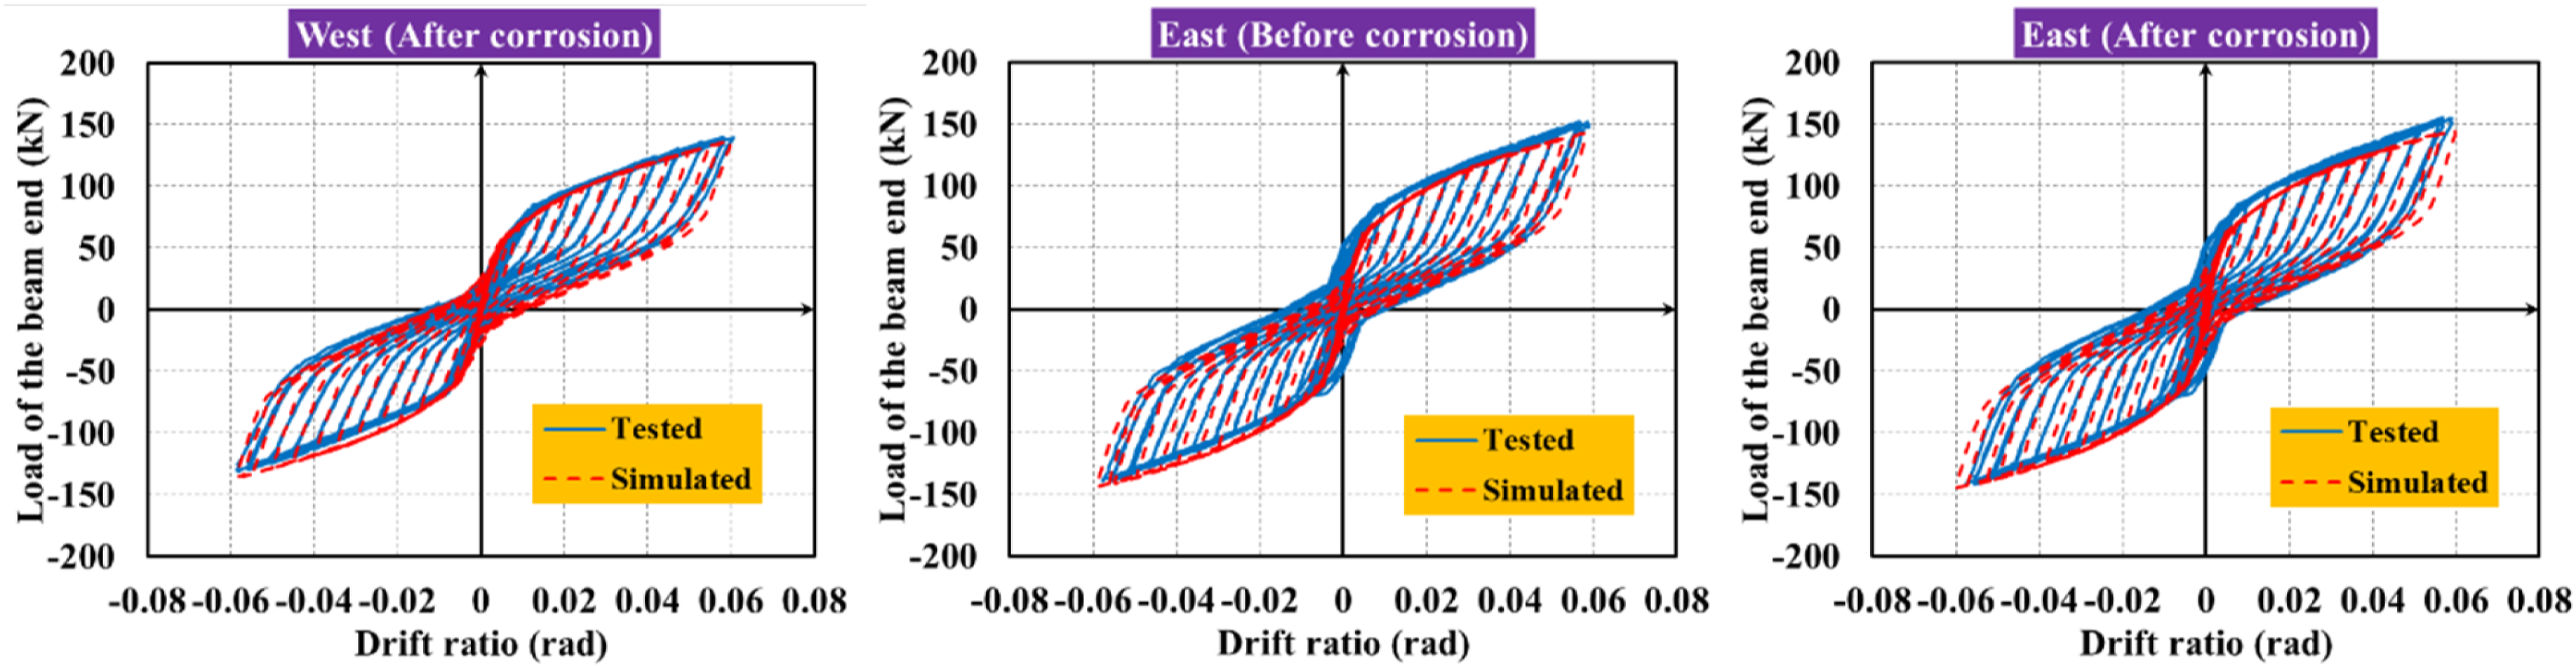
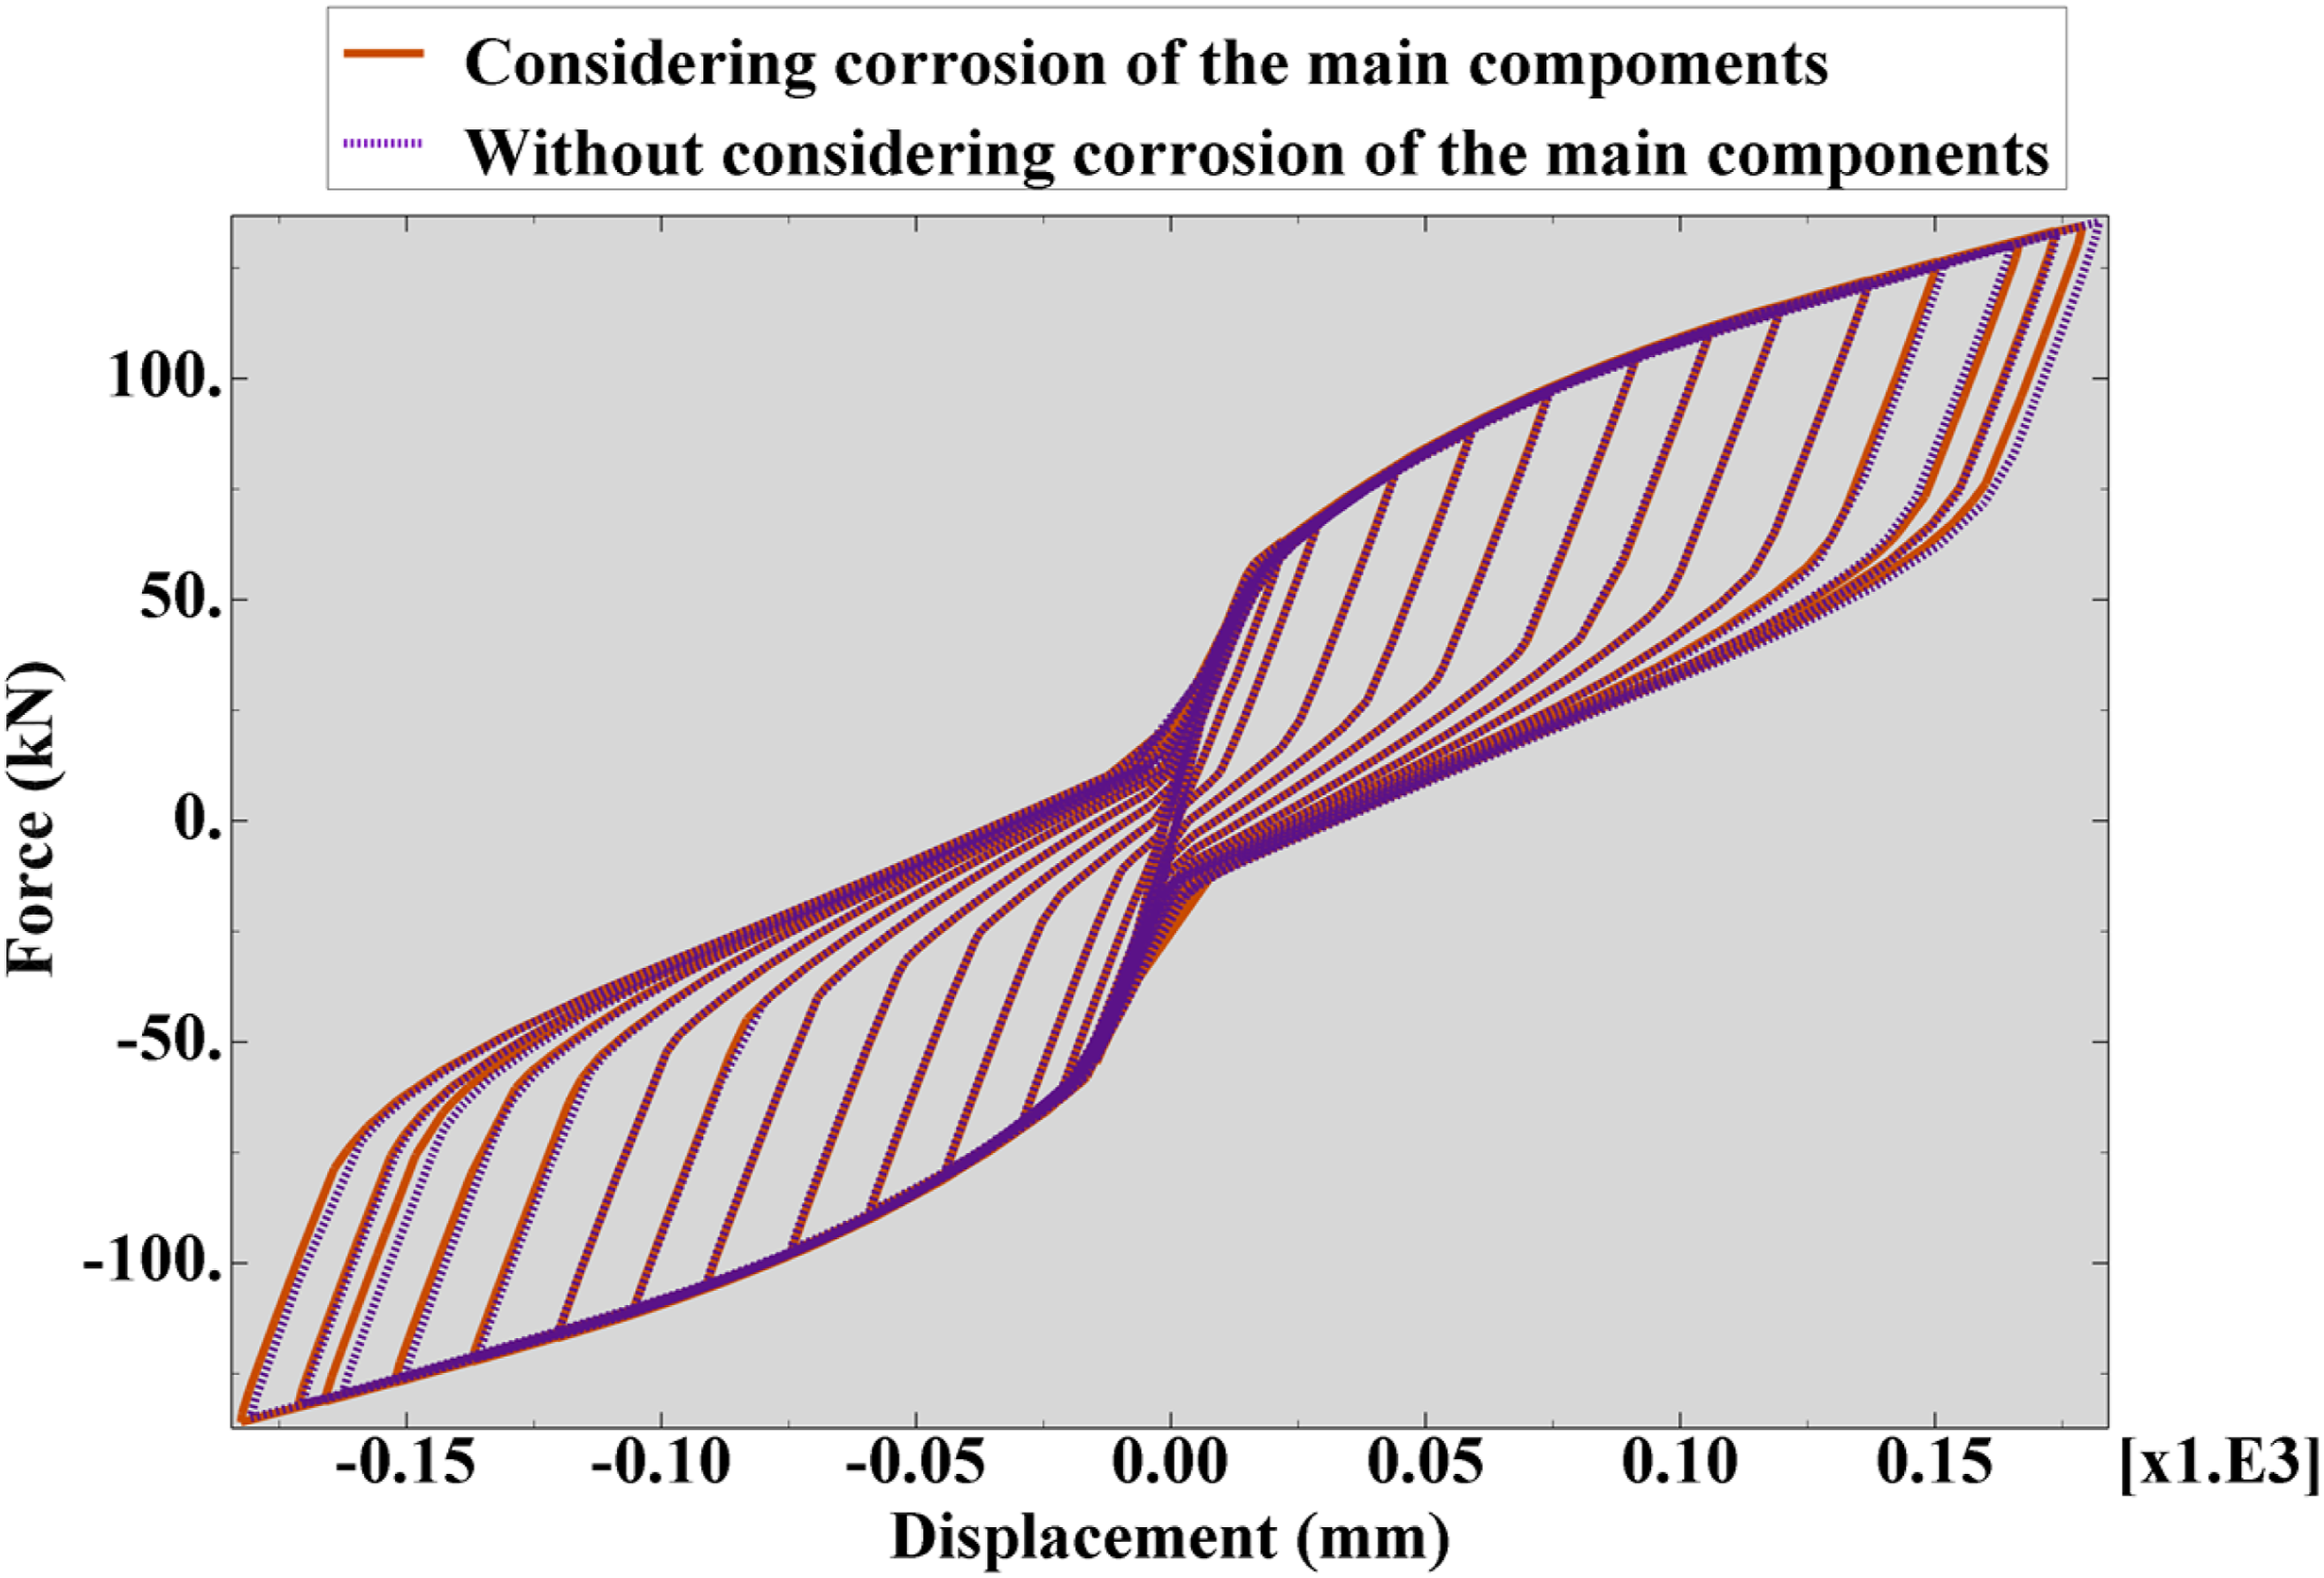
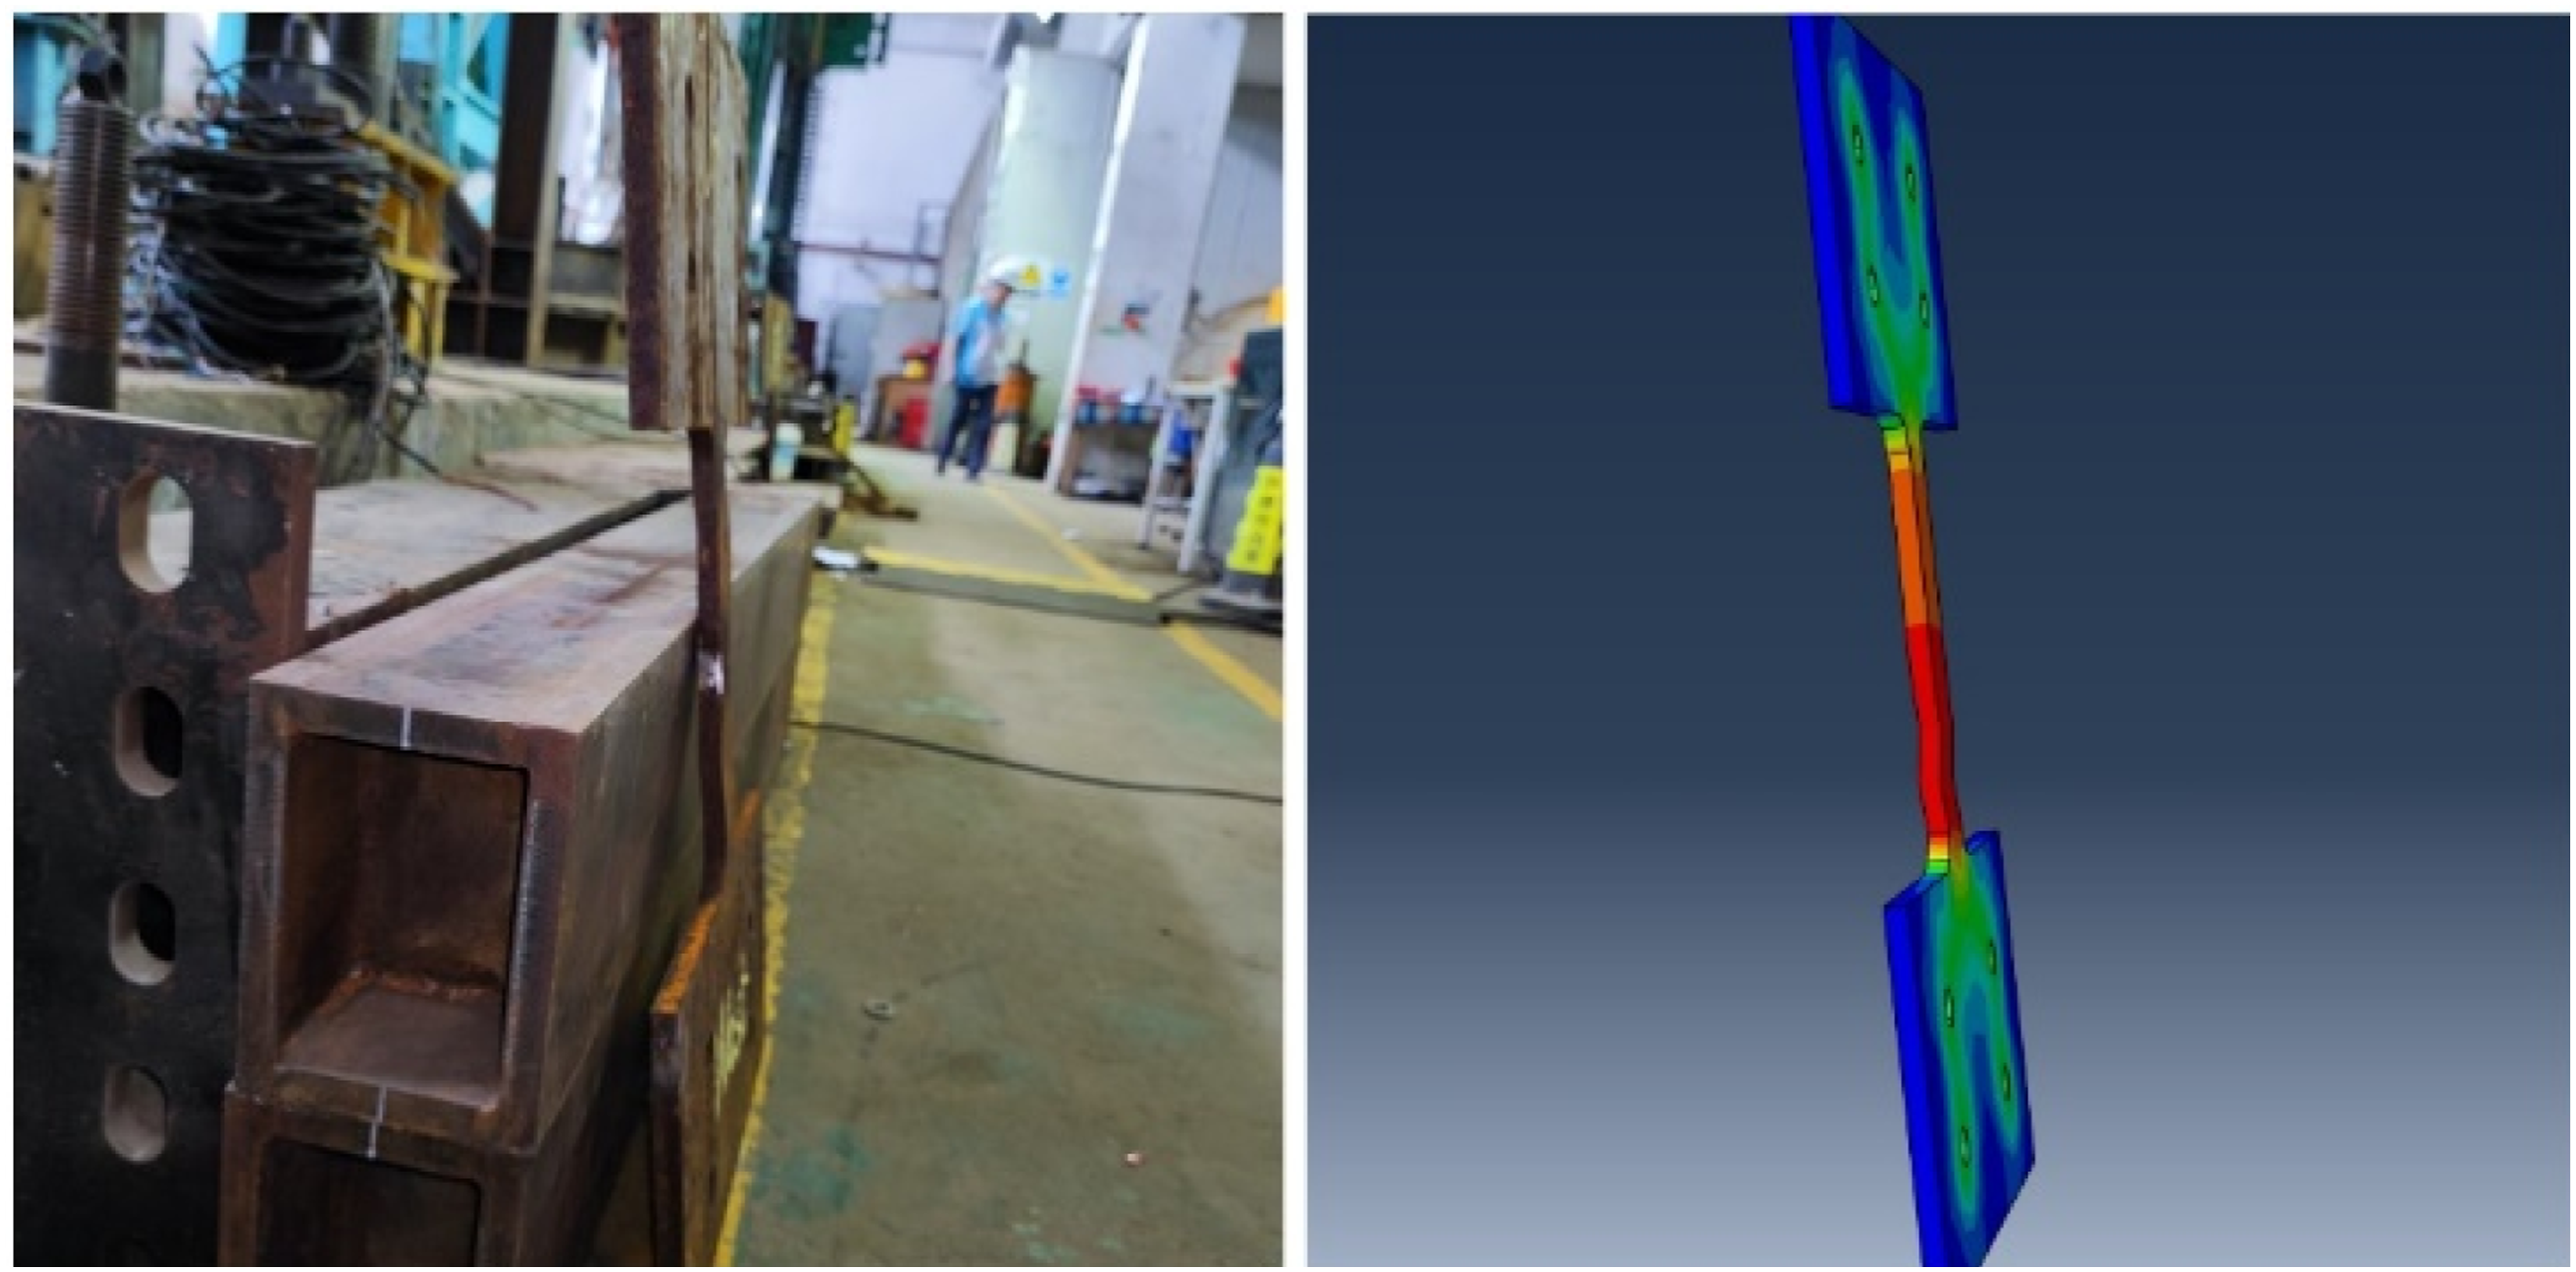
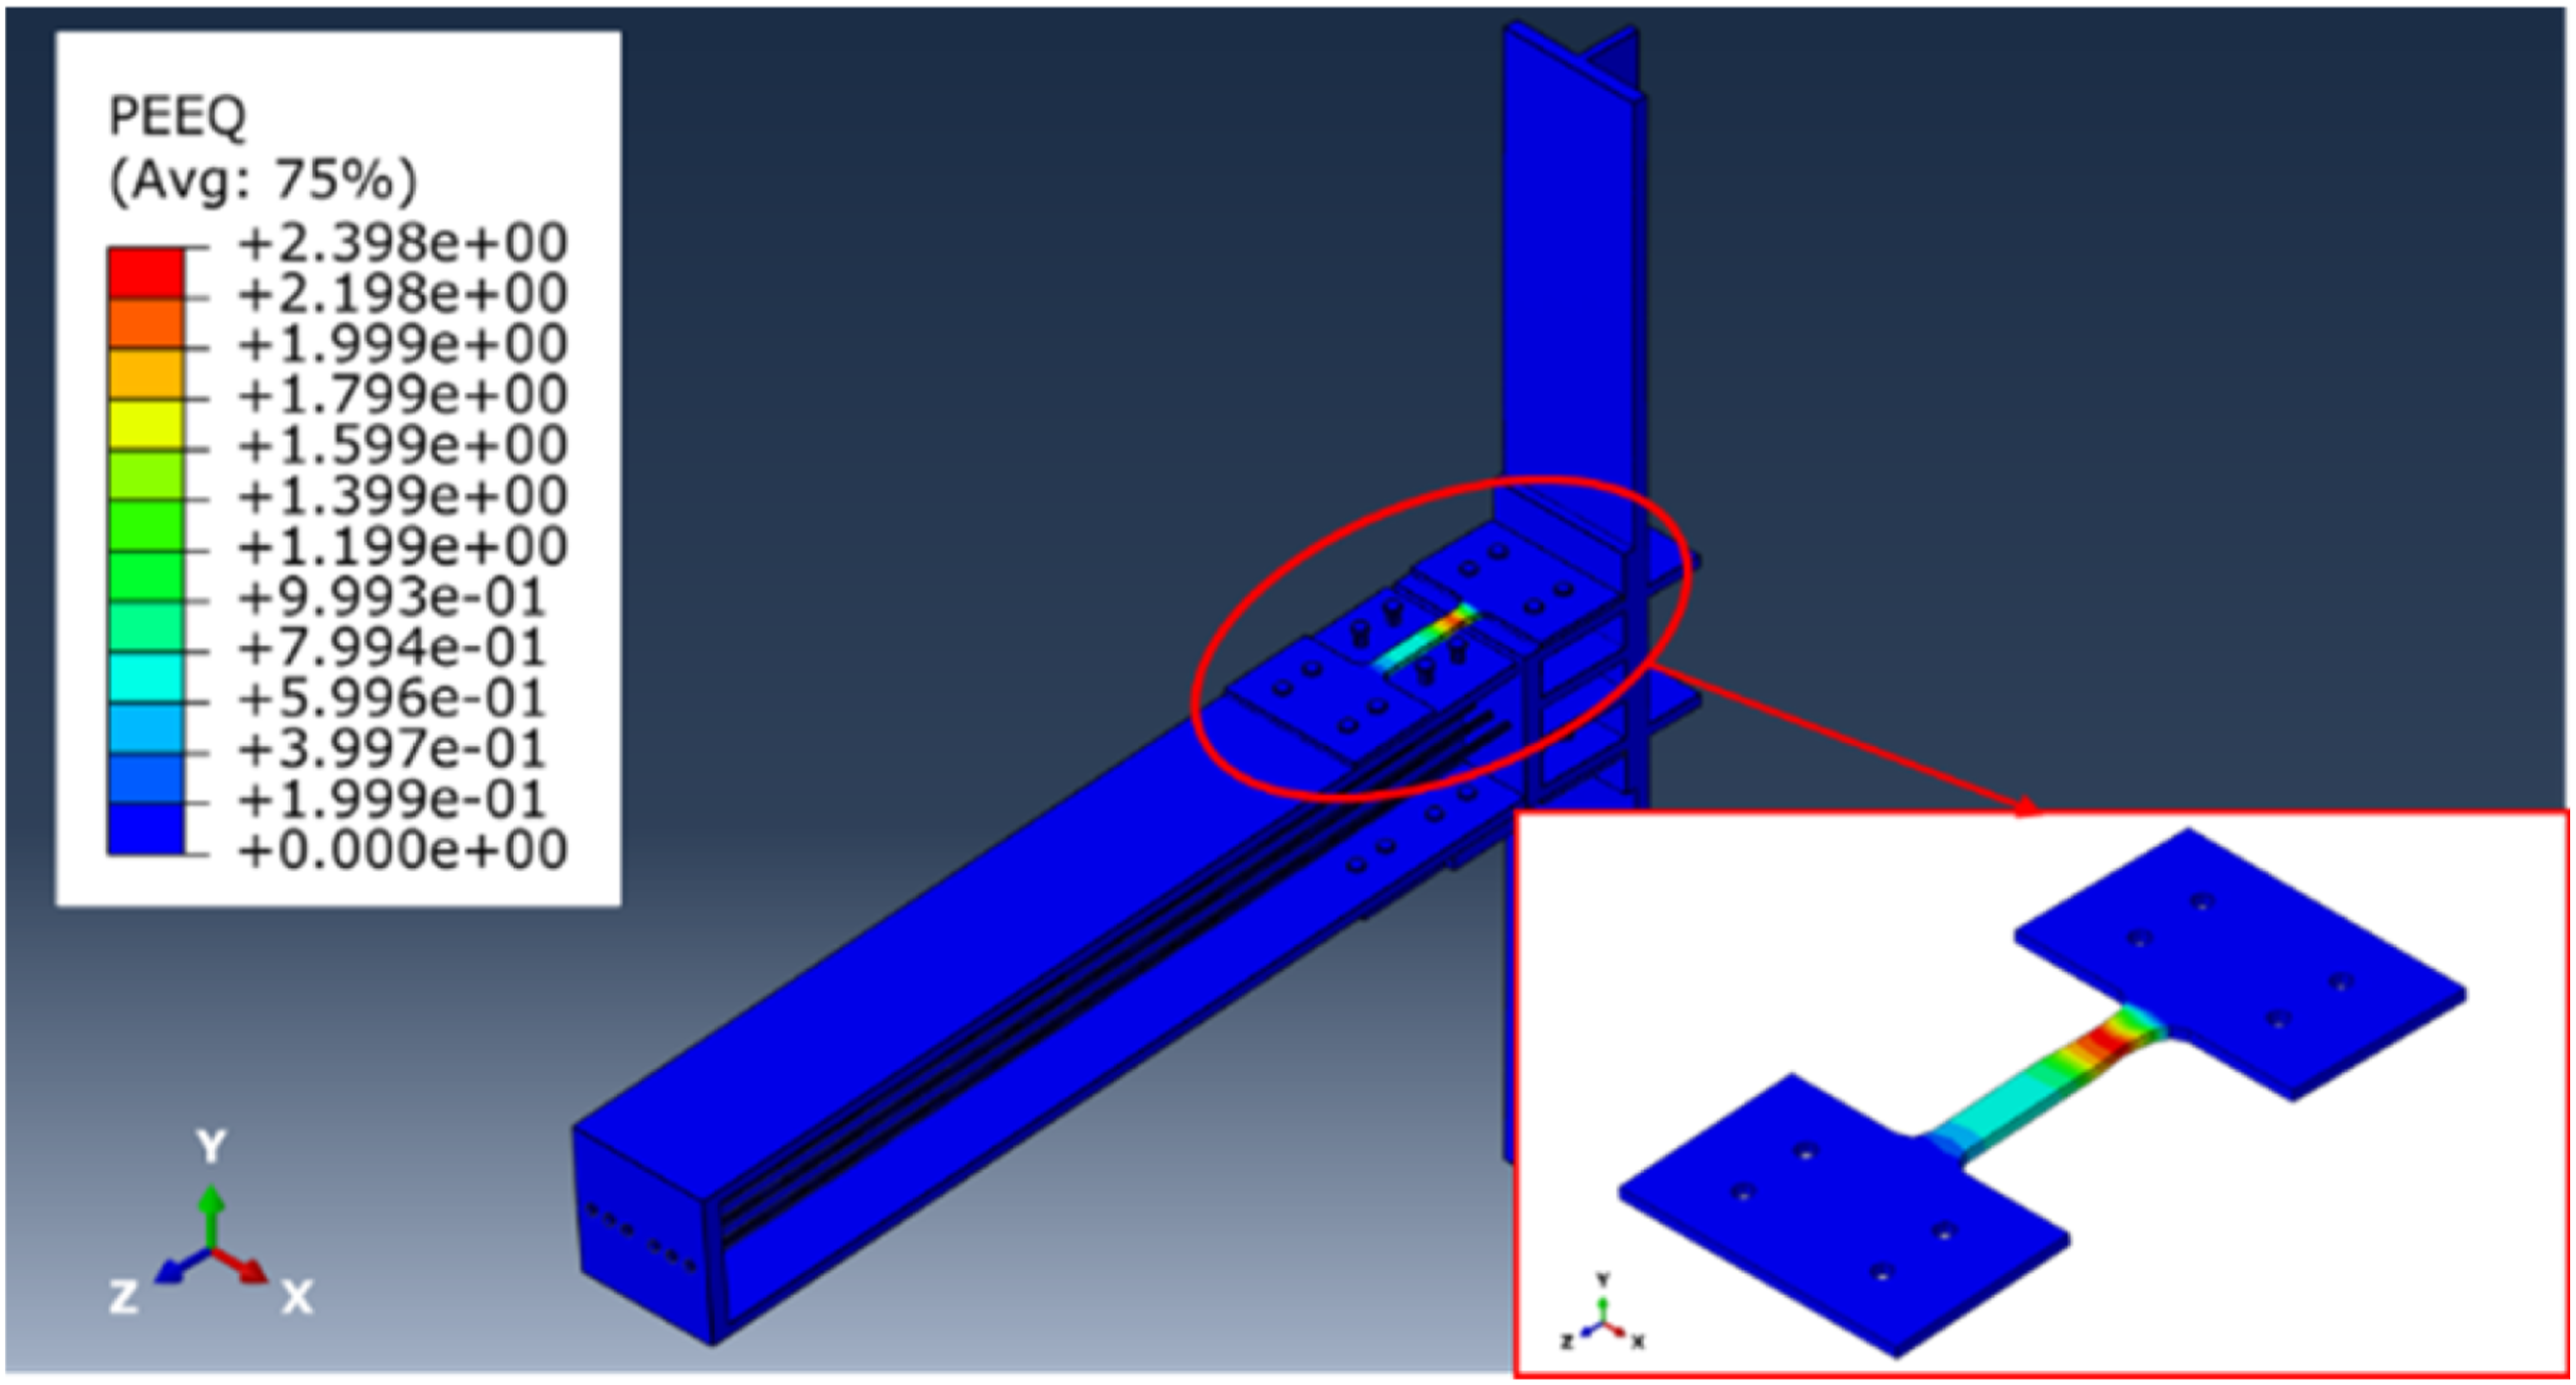
Figure 32 illustrates the comparison between overall deformation pattern of the specimen simulated by FE and that observed from experimental scenario, it can be seen that the deformation of the self-centering connection under reciprocating loads mainly concentrates on gap opening between the main beam and the transfer beam, and the deformations at other positions are relatively small. Figure 33 demonstrates the deformation pattern of the dog-bone energy dissipative plate simulated by FE, the calculated stress and deformation mainly occur at the root position of the sectional reduced region, which is consistent with experimental phenomenon. Through these comparisons, validity of the FE model was proved. Figure 34 shows the distribution of PEEQ, it is evident that under simulated earthquake loads, plastic damage mainly concentrates on the replaceable energy dissipative plates. This phenomenon is in accordance with initial design purpose of such kind of connection. Comparison of deformation mode calculated by FE and that obtained by experiment (Overall). Comparison between deformation model calculated by FE and that obtained by experiment (Local). Distribution of PEEQ.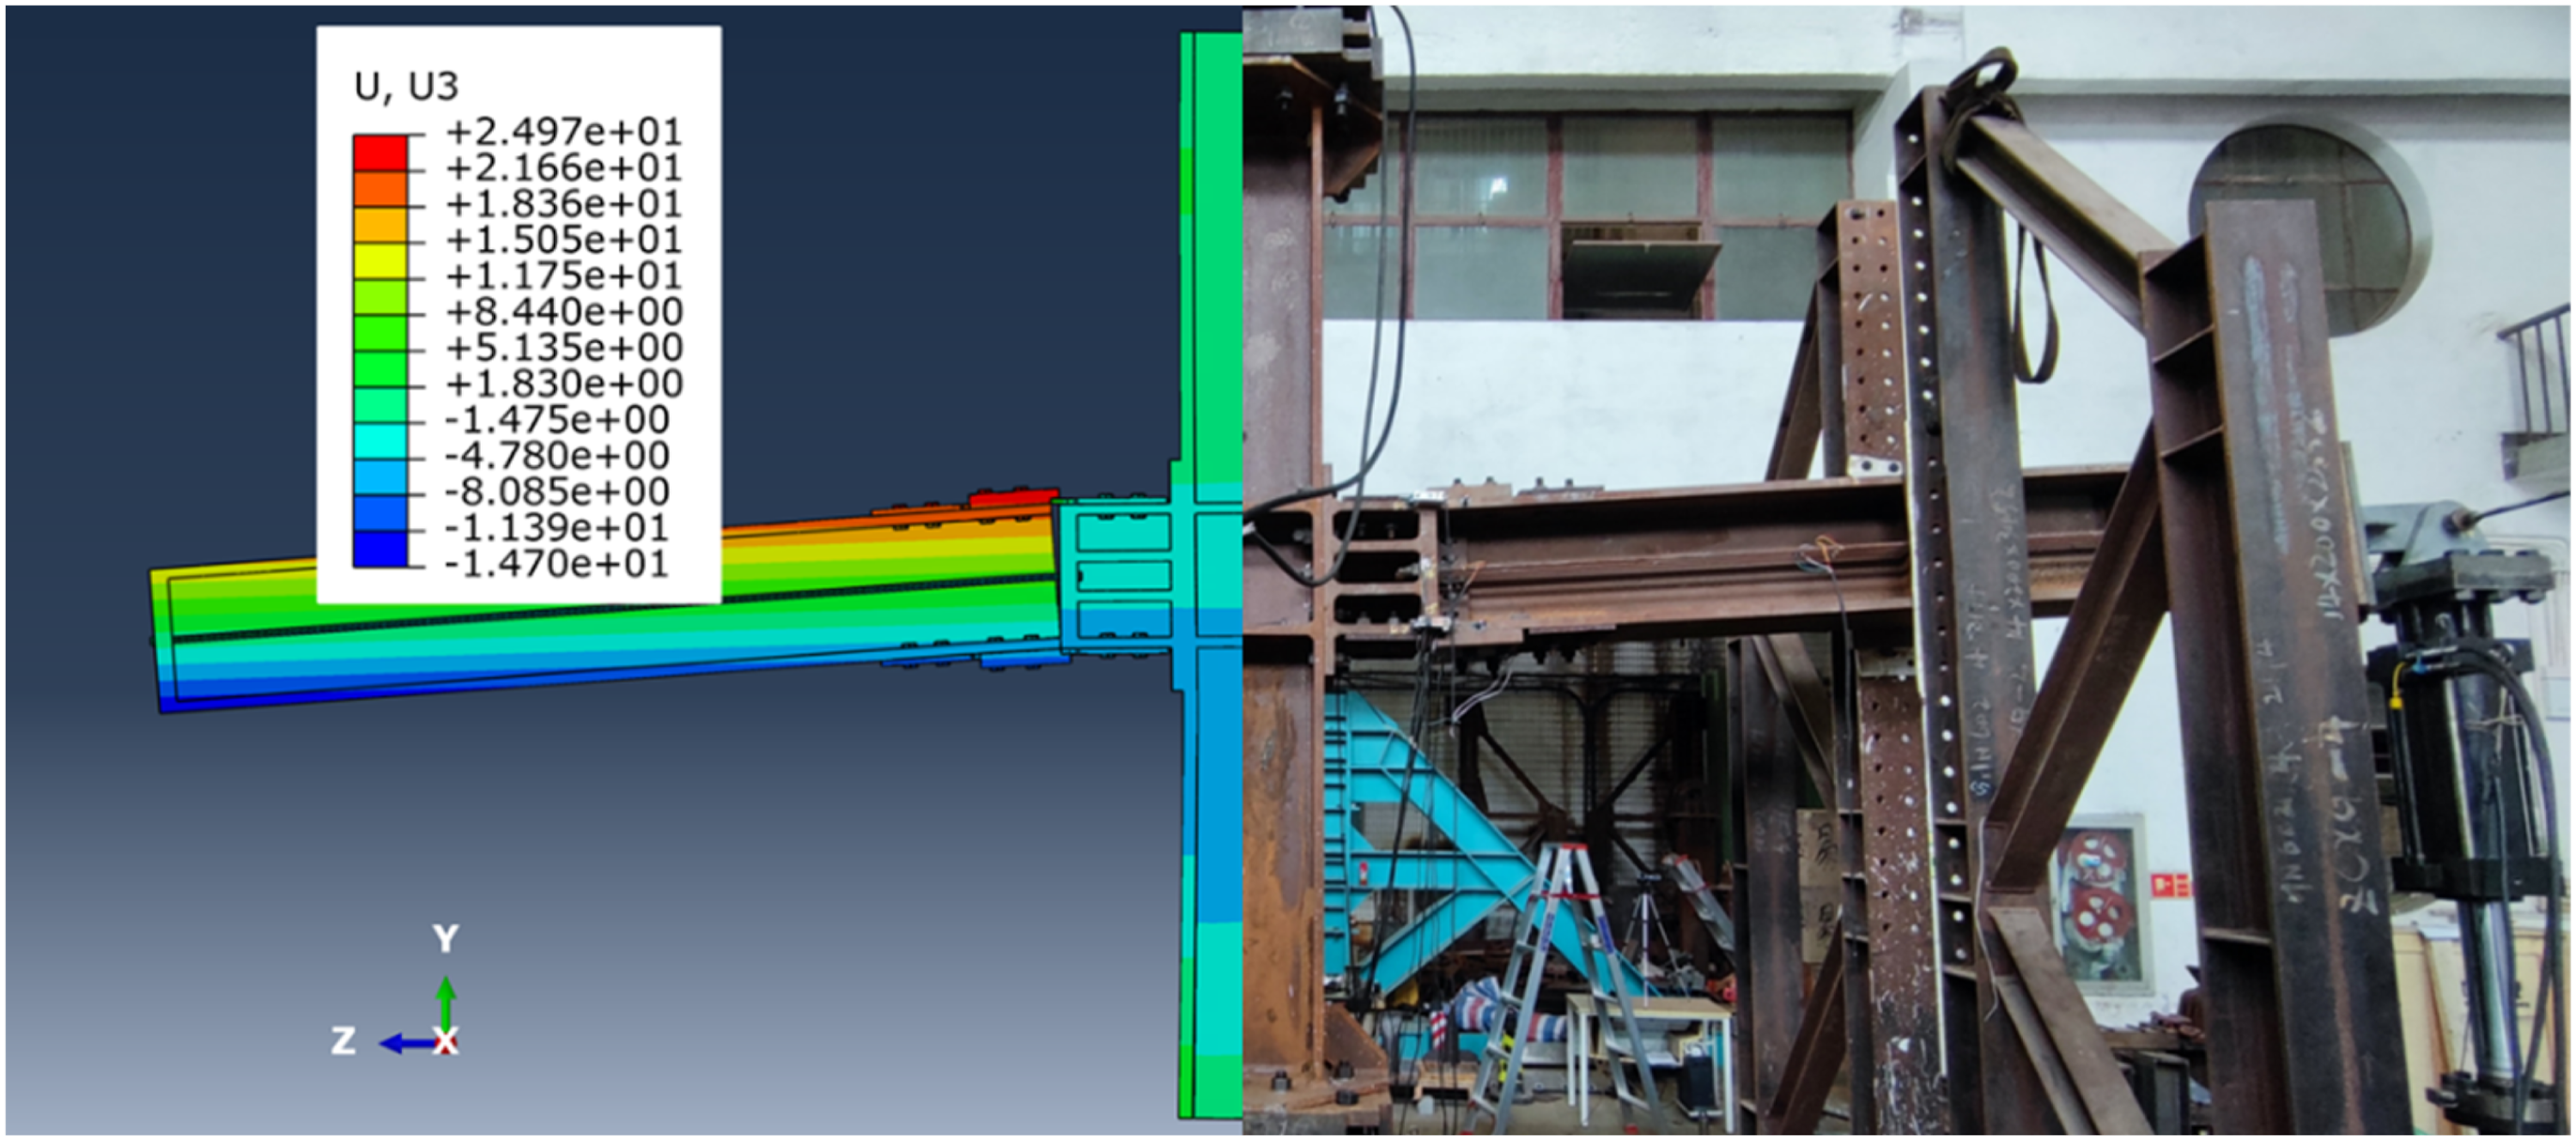
Parametric study
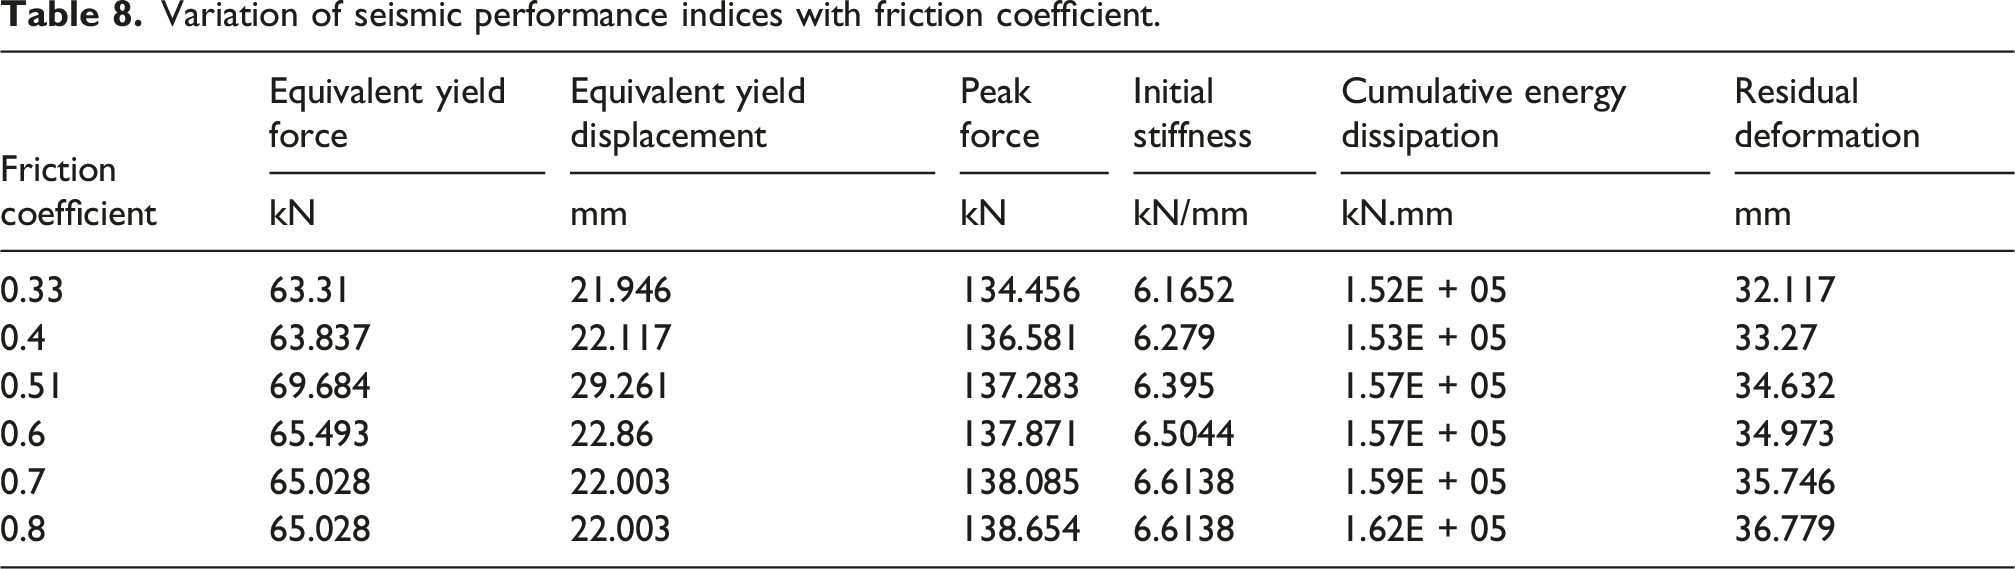
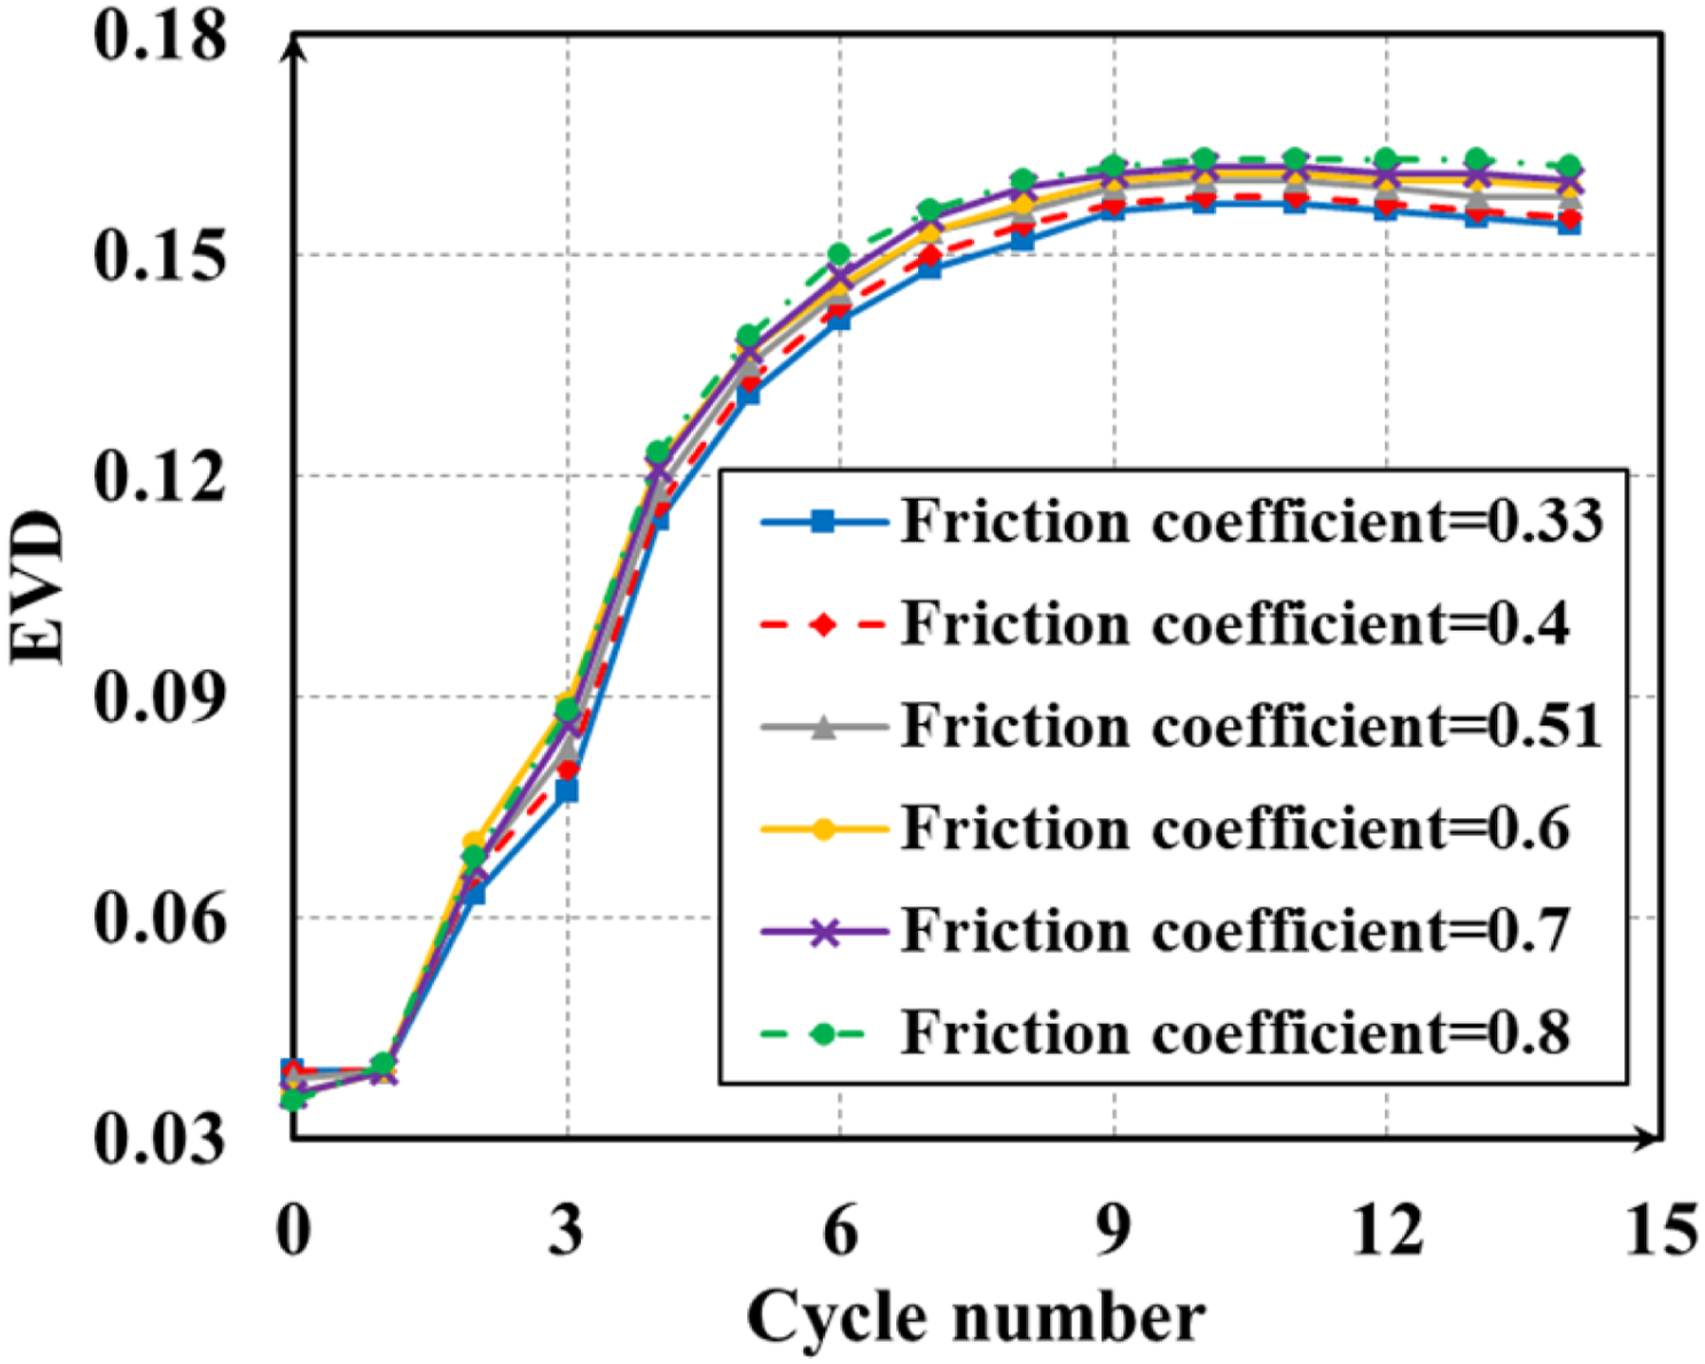
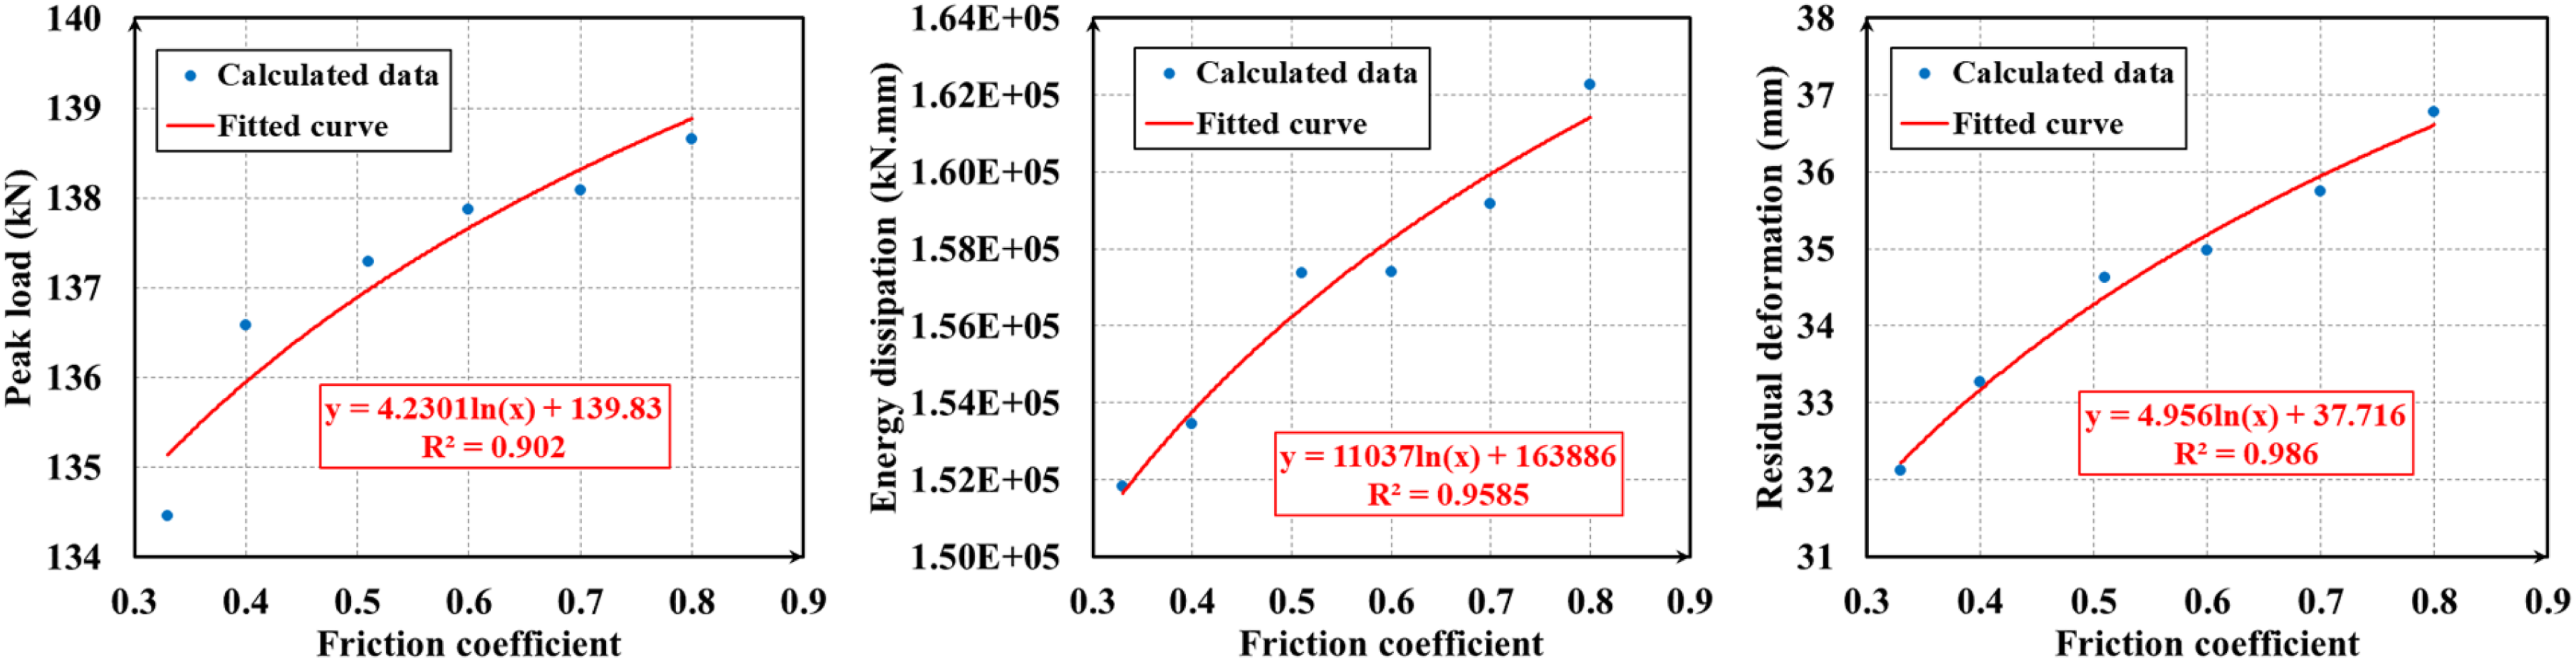
According to above analysis and previous study (Fang et al., 2023), friction coefficient is a critical parameter that affects the seismic performance of self-centering devices. So, friction coefficient is selected as a variable to conduct parametric study, and range of the variable is 0.33 to 0.8. Figure 35 shows typical hysteresis curves of the connection with different friction coefficients, it can be qualitatively concluded from the hysteresis curves that the peak load, energy dissipation, and residual deformation increase with the increase of friction coefficient. Specific increasing amplitudes are summarized in Table 8. When the friction coefficient is increased from 0.33 to 0.8, the increase of equivalent yield force, equivalent yield displacement, peak load, initial stiffness, cumulative energy dissipation, and residual deformation are 2.71%, 0.26%, 3.12%, 7.28%, 6.88%, 14.52%, respectively. It is evident that an increased contribution of friction will lead to a larger residual deformation of the SC connection, changing the connection to a “partially SC member”. According to (Hu et al., 2024), compared with a fully SC system, a partially SC system can achieve a lower force requirement, a reduced absolute acceleration response, and an acceptable residual displacement, when being designed to achieve the same maximum deformation. From this perspective, corrosion have no negative influence on seismic performance of the self-centering connection equipped with replaceable devices, affirming the SC connection is a promising member to augment life-cycle performance of structures. Figure 36 displays the variation of equivalent viscous damping (EVD) coefficient with cycle number under different friction coefficients. When the friction coefficient is larger, the EVDs of all cycles increase. The variation relationships between peak load, cumulative energy dissipation, and residual deformation of the specimen and friction coefficient are fitted in Figure 37, from which one can see that the three indices approximately increase with the increase of friction coefficient in a logarithm fashion. Typical hysteresis curves of the connection with different friction coefficients. Variation of seismic performance indices with friction coefficient. Variation of EVD with friction coefficient. Variation of seismic performance indices with the increase of friction coefficient.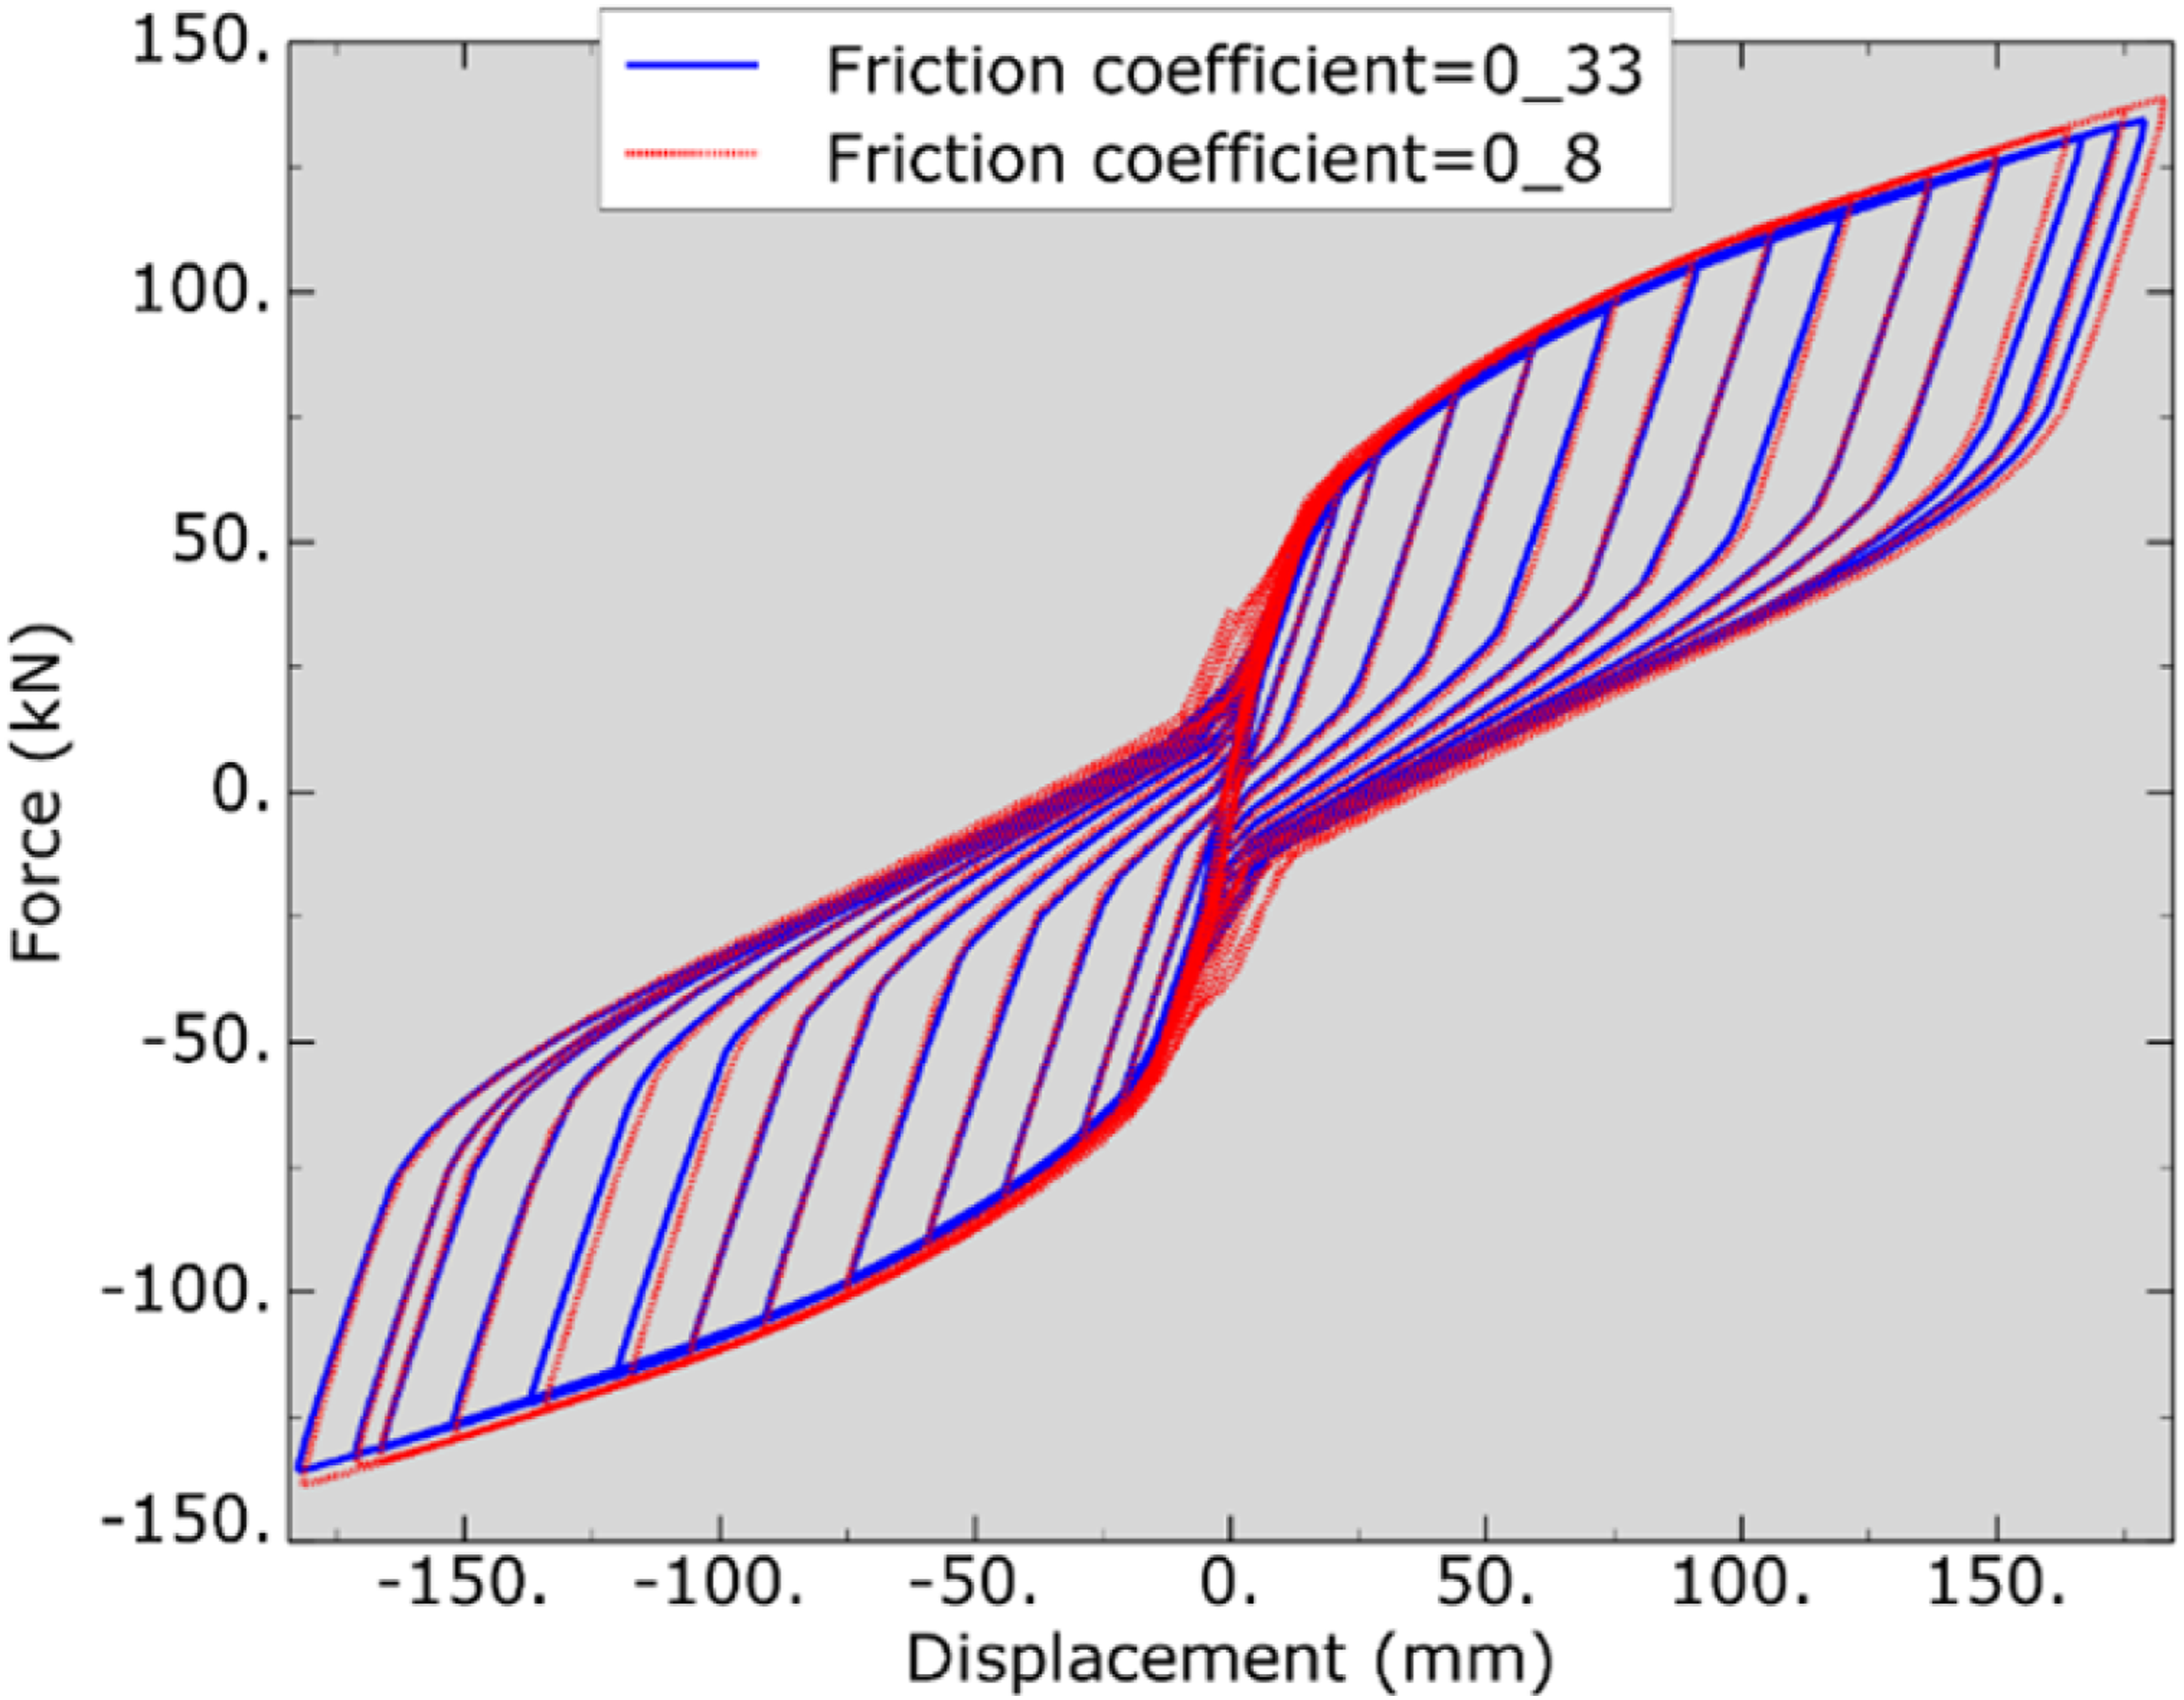
The numerical simulation in this study serves to validate experimental results, deepen mechanistic understanding, and extend findings through parametric analysis. By developing a finite element (FE) model that replicates experimental tests, the study confirms the accuracy of simulated hysteresis curves and deformation patterns against physical test data. The model goes beyond experimental limitations by revealing localized stress concentrations and plastic strain distribution in critical components like the dog-bone plates, while also testing key assumptions—such as the dominant role of plate corrosion—through comparative simulations. A calibrated Chaboche combined hardening model captures cyclic plasticity more accurately than pure kinematic or isotropic hardening approaches. The simulation enables systematic exploration of friction coefficients (0.33–0.8), quantifying their impact on seismic performance metrics like energy dissipation and residual deformation, which would be impractical to test experimentally. This numerical work not only verifies the experimental observations but also provides scalable insights for durability-focused design, demonstrating how corrosion-induced friction changes affect self-centering capability and offering a cost-effective tool for future multi-hazard assessments of similar structural systems.
Conclusions
To reveal the influence of corrosion on seismic performance of a newly-proposed self-centering beam-to-column connection, and thus provide guidance on durability design of such kind of connections, accelerated corrosion test was conducted on energy dissipation components (dog-bone plates) of the connection, as well as corresponding round bar coupons cut off from the plates. Both cyclic behavior tests at material level and structural member level were carried out. In addition, effect of the generation of rust layer on friction coefficient of the plate surface was studied. At last, FE model to predict seismic behavior of the connection considering corrosion was set up. On the basis of simulation results, influence of friction coefficient on seismic performance of the beam-to-column connection with energy dissipative components was analyzed. Main conclusions of the study are listed as follows: (1) After 1,600h accelerated corrosion, all mechanical property indices of the steel experience a certain extent of degradation, where Young’s modulus exhibits the greatest deterioration degree, with the value of 6.86%, followed by elongation ratio after fracture (3.44%), while the influence of corrosion on fracture strain is much marginal, only 0.43% of deterioration is observed after corrosion. (2) Influence of corrosion on friction coefficient of mild steel is much significant, the friction coefficient between the corroded plate surfaces is about 2.5 times that of the surfaces before corrosion. (3) The variations of seismic performance indices of the specimen after corrosion of the energy dissipative plates are not severe (all within 3%), implying that the self-centering connection is not sensitive to corrosion. (4) Of all the seismic performance indices, the influence of friction coefficient on residual deformation is most significant, while the influence on yield displacement is rather slight. When the friction coefficient is increased from 0.33 to 0.8, the increase of equivalent yield displacement and residual deformation are 0.26% and 14.52%, respectively.
Footnotes
Acknowledgement
The authors would like to express great gratitude to the financial support from the Postdoctoral Fellowship Program of CPSF under Grant Number GZC20250186. This paper is also supported by the China Postdoctoral Science Foundation-Hubei Joint Supported Program under Grant Number 2025T047HB, and National Defense Basic Scientific Research Program Project (JCKY2025110 C).

Funding
The authors disclosed receipt of the following financial support for the research, authorship, and/or publication of this article: Postdoctoral Fellowship Program of CPSF; GZC20250186; China Postdoctoral Science Foundation-Hubei Joint Supported Program, 2025T047HB and National Defense Basic Scientific Research Program Project, JCKY2025110 C.
Declaration of conflicting interests
The authors declared no potential conflicts of interest with respect to the research, authorship, and/or publication of this article.