






Abstract
Based on the excellent mechanical properties of UHPC such as high strength and good toughness, UHPC is used to replace part of NC in the mid-span of beams to form an UHPC-NC composite beam, a design that optimizes both the cost and mechanical properties of the composite beam. The effect of the ratio of UHPC length to calculated span (Lu/L) on the performance of the composite beams in terms of crack load, peak load, mid-span deflection and stiffness was investigated by four-point flexural tests. The study shows that (1) the peak load of full UHPC beam (UB) is 40.2% higher than that of the NB beam, and peak loads of composite beams UN-HB1, UN-HB2 and UN-HB3 can reach 79.8%, 97.6% and 98.7% of the peak load of the UB beam, respectively. (2) Composite beams with larger Lu/L have better deformation capacity, the ductility of UN-HB1 is 22.1% higher than that of NB. (3) The stiffnesses of composite beams UN-HB2 and UN-HB3 increased by 31.7% and 34.2% beam NB, and they were able to reach 83.2% and 84.3% of the stiffness of UB beam. (4) UHPC length ratio of 50% (Lu/L = 0.5) enables the composite beam to achieve satisfactory flexural performance. A calculation model is derived based on variable stiffness non-equal section beams and immediate stiffness, which can accurately predict the mid-span deflection of the composite beams.
Keywords
Introduction
Ultra-high performance concrete (UHPC) is a cement-based composite material that exhibits substantially superior strength, toughness, and durability compared to normal concrete (NC), primarily due its extremely low water-to-cement ratio (0.15-0.24) and optimized aggregate gradation (Abbas et al., 2016; Lim et al., 2021; Magureanu et al., 2012; Wang et al., 2019). Although different codes and organizations define UHPC with varying minimum compressive strength requirements (ranging from 120 to 150 MPa) (CSA A23.3-19, 2019; ASTM C1856/C1856M-17, 2017; Graybeal and Haber, 2017; AFGC, 2013), there is a general consensus regarding its high strength and significant post-cracking tensile resistance.
Leveraging these superior mechanical properties, extensive research has been conducted on the flexural behavior of UHPC beams. Experimental studies have demonstrated that UHPC beams exhibit multiple fine cracking, improved stress redistribution capability, and enhanced yield load, ultimate capacity, and ductility with increasing reinforcement ratios (Yang et al., 2010; Turker et al., 2019). Nevertheless, the high material cost of UHPC limits its widespread engineering application (Zhang et al., 2022), which has motivated researchers to explore UHPC-NC composite beams as a cost-effective alternative (Yang et al., 2023). Interfacial bond performance of UHPC-NC is a critical factor governing the structural behavior of such composite systems. Studies have shown that the bond strength at the UHPC-NC interface is significantly higher than that of the NC-NC interface and even slightly exceeds that of monolithic NC specimens (Alharthi et al., 2021; Zhang et al., 2020). By increasing interfacial roughness, bond strengths of 4.5-4.8 MPa can be achieved, corresponding to approximately 109%-117% of the tensile strength of ordinary concrete (Hong and Kang, 2015; Carbonell Muñoz et al., 2014). Building upon these findings, extensive research has been directed toward UHPC-NC composite beams configured along the cross-sectional direction. It has been reported that UHPC can effectively rehabilitate damaged concrete beams, increasing their load-carrying capacity by 32% to 208% (Huang, 2021; Tanarslan, 2017). Furthermore, arranging UHPC along the section height, with an optimal thickness of approximately one-third of the beam depth, significantly enhances the ductility, flexural capacity, and stiffness of hybrid beams (Turker and Torun, 2020; Yalçınkaya Ç, 2021), although some studies have noted a potential reduction in overall ductility (Yuan et al., 2022). Hybrid beams employing UHPC as formwork or as tensile reinforcement have also demonstrated satisfactory flexural performance (Liang et al., 2019; Hakeem et al., 2022).
Against this background, the present paper proposes a novel UHPC-NC composite beams configured along the span direction to achieve a balance between cost efficiency and structural performance, in which the entire mid-span section is composed of UHPC and the two side segments are made of NC. To date, only Kadhim et al. (2021) have proposed the concept of replacing NC with UHPC in the region of maximum flexural moment, reporting that a UHPC length of half the span enables the composite beam to achieve a load-carrying capacity comparable to that of a fully UHPC beam. Subsequently, Nadir et al. (2024) investigated the influence of the UHPC length-to-span ratio (Lu/L) and the interface inclination angle on flexural behavior. However, the presence of an inclined interface leads to an imprecise definition of Lu/L, making it difficult to isolate the independent effect of the UHPC segment length.
Consequently, this study adopts Lu/L (the ratio of UHPC segment length to calculated span) as the primary experimental variable to systematically investigate the feasibility of replacing NC with UHPC at the mid-span region. An integrated approach combining experiments, numerical simulations, and theoretical analysis is employed to examine the influence of Lu/L on the flexural performance of UHPC-NC composite beams, including crack development, failure mode, deformability, and stiffness. Based on the findings, a design recommendation for Lu/L is proposed, and a reliable and efficient calculation model for the mid-span deflection of UHPC-NC composite beams is proposed, with the aim of providing theoretical guidance for practical engineering applications.
Experimental study
Material properties
The normal concrete (NC) used for the tests was commercial concrete with strength grade of C40. UHPC was prepared in the previous research group, with favorable mechanical properties (Liang et al., 2023). The mix proportion of UHPC is cement: silica fume: quartz powder: quartz sand = 1:0.25:0.32:1.06, with a water-to-cement ratio of 0.16 and a superplasticizer dosage of 3%. The cement is ordinary silicate cement (PO42.5) with silica fume particle size of 0.1 μm, and the quartz sand is classified as fine sand (0.106 mm-0.212 mm), medium sand (0.212-0.425 mm) and coarse sand (0.425 mm-0.850 mm). The steel fibers were a mixture of straight and end-hooked steel fibers, the straight steel fibers were 13 mm in length and the end-hooked steel fibers were 16 mm, with a total volume fraction of 2% for both types of steel fibers, and the two types of steel fibers were mixed in a ratio of 1:1. Two types of steel fibers are illustrated in Figure 1. Types of steel fibers.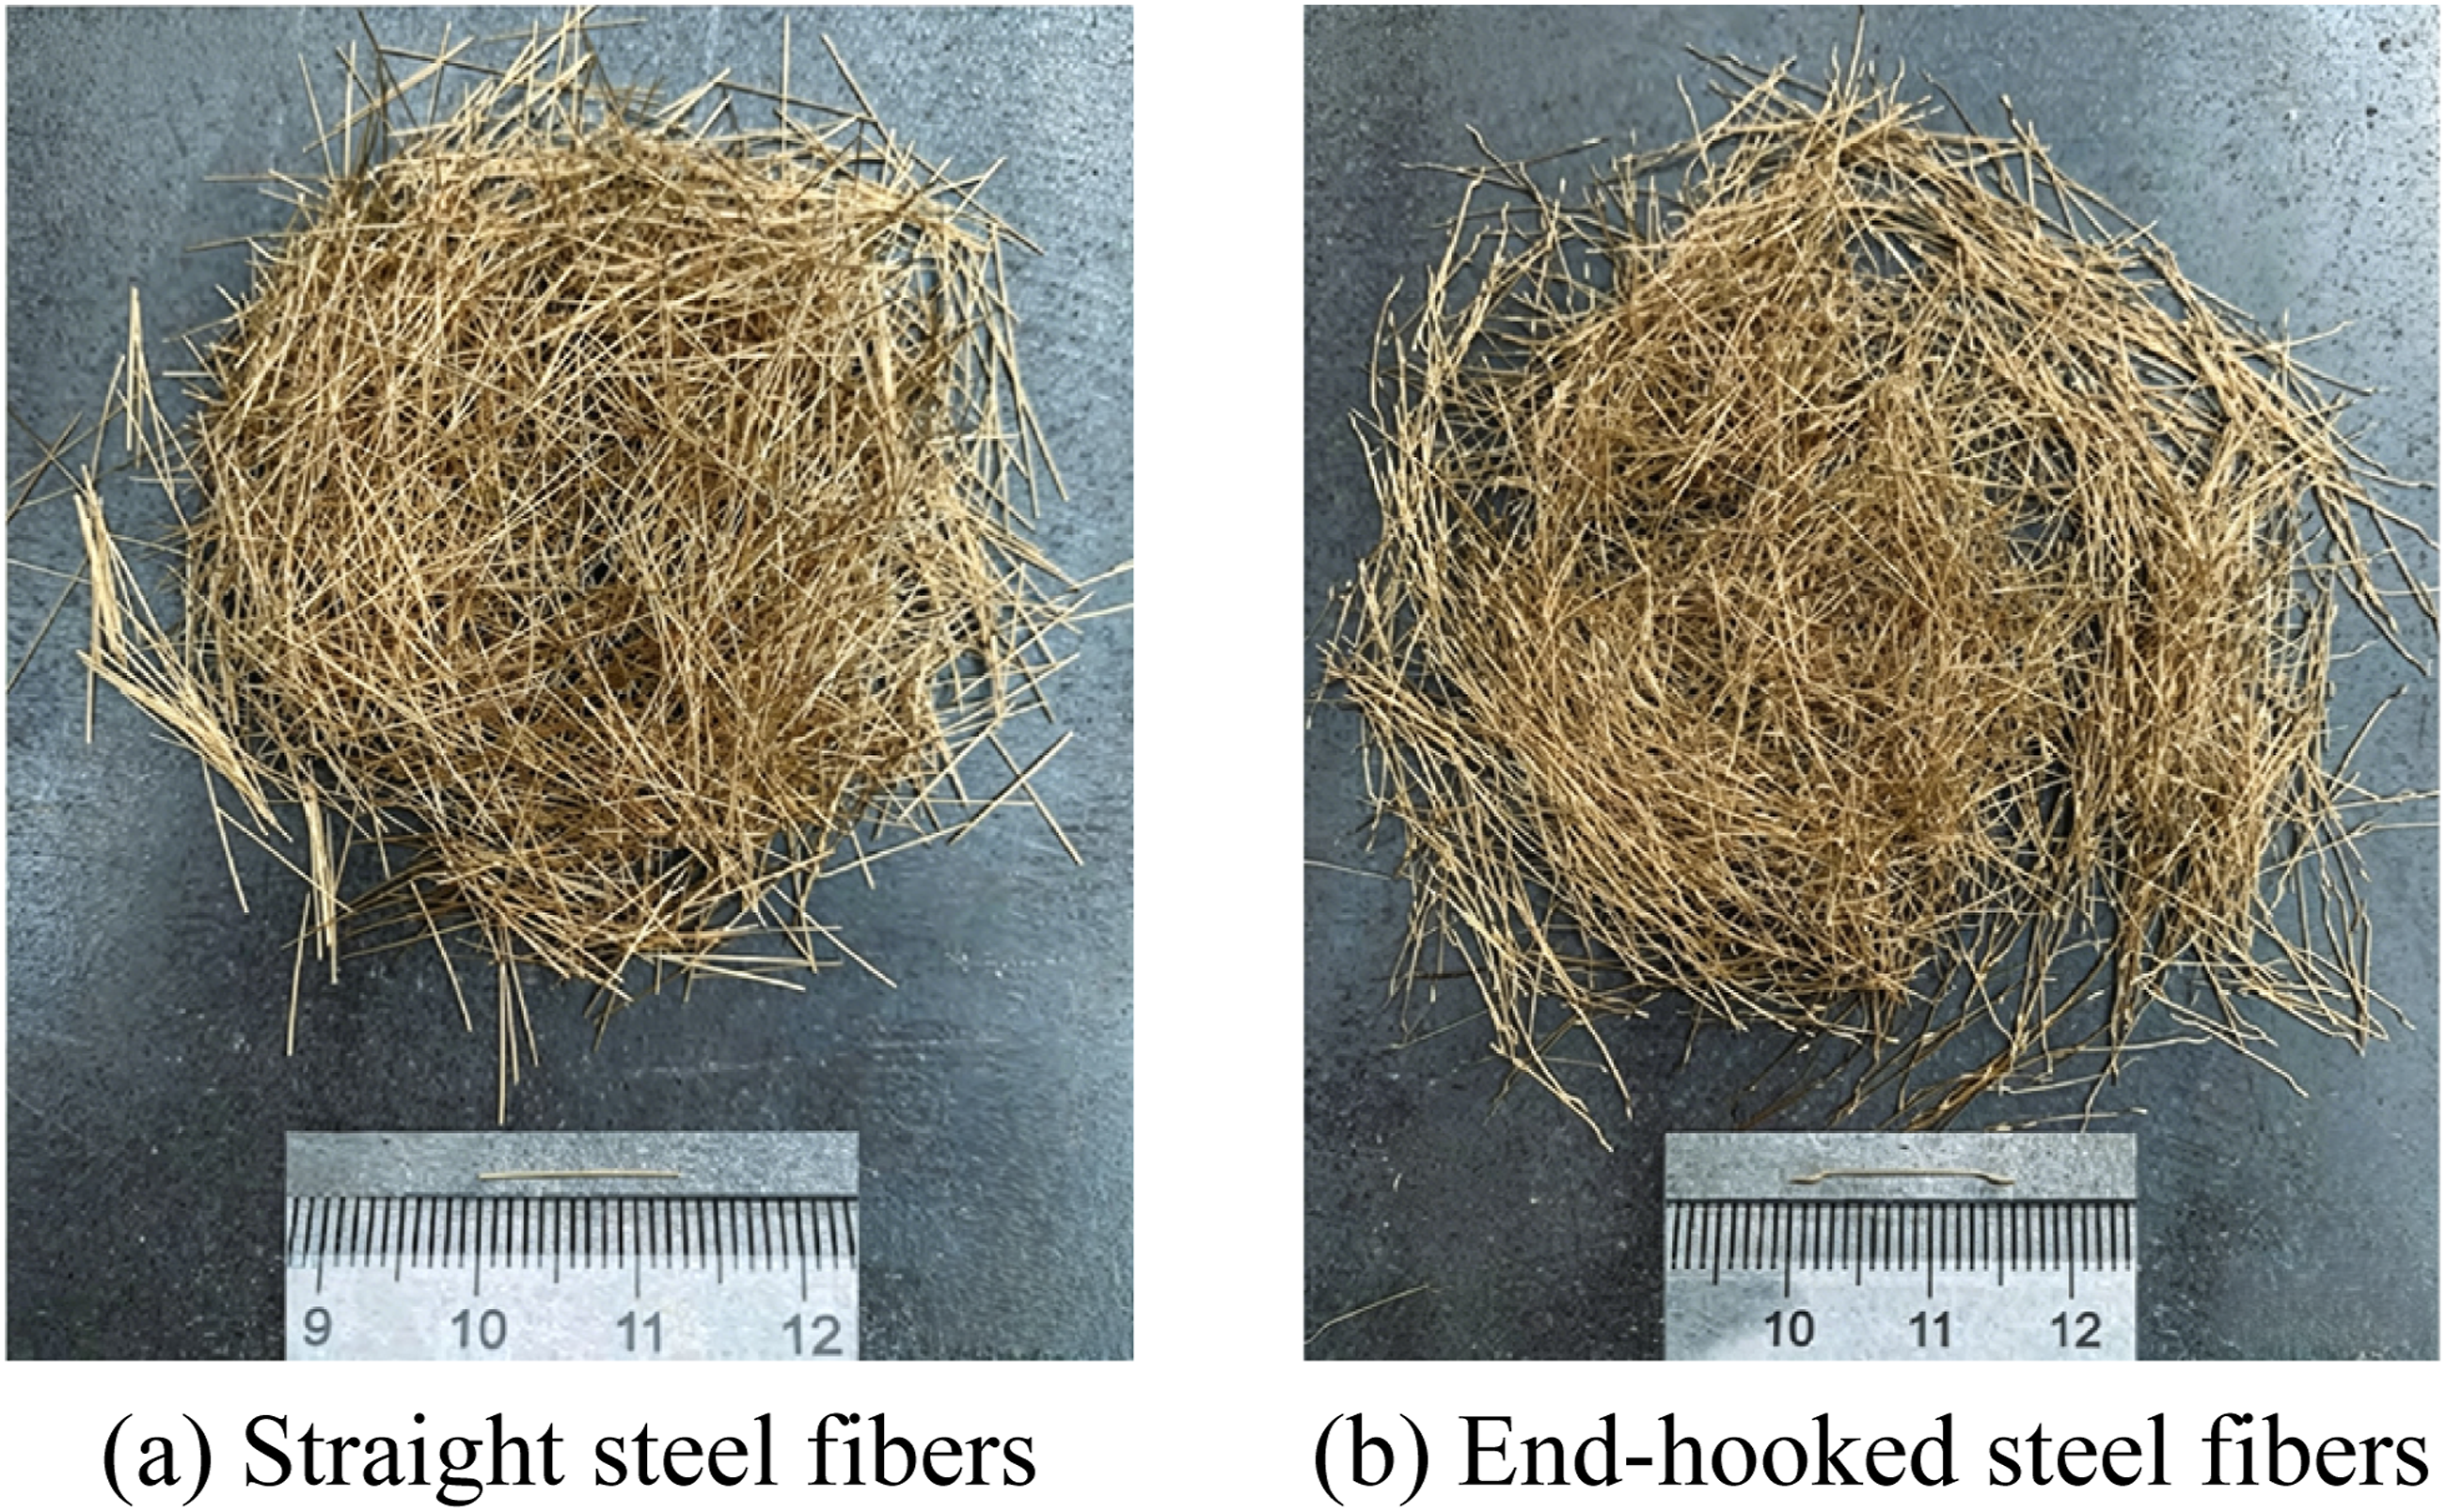
The compressive strength and axial compressive strength of NC were measured according to GB/T 50081-2019 (2019), the compressive strength is 39.47 MPa and axial compressive strength is 31.42 MPa at 28 days. The material properties of UHPC are tested by T/CCPA 7-2018 (2018), the compressive strength of UHPC is 124.36 MPa, axial compressive strength is 100.25 MPa, and ultimate tensile strength is 8.43 MPa. The uniaxial tensile test setup for UHPC is shown in Figure 2(a), and its tensile stress-strain curve is presented in Figure 2(b). According to the code GB/T228.1-2010 (2011), and the tensile test was carried out on reinforcements with diameters of 8, 10, 12 and 18 mm, respectively, there are 3 test specimens for each type of reinforcement. The mechanical properties of reinforcements are listed in Table 1. Uniaxial tensile test of UHPC. Material properties of reinforcements.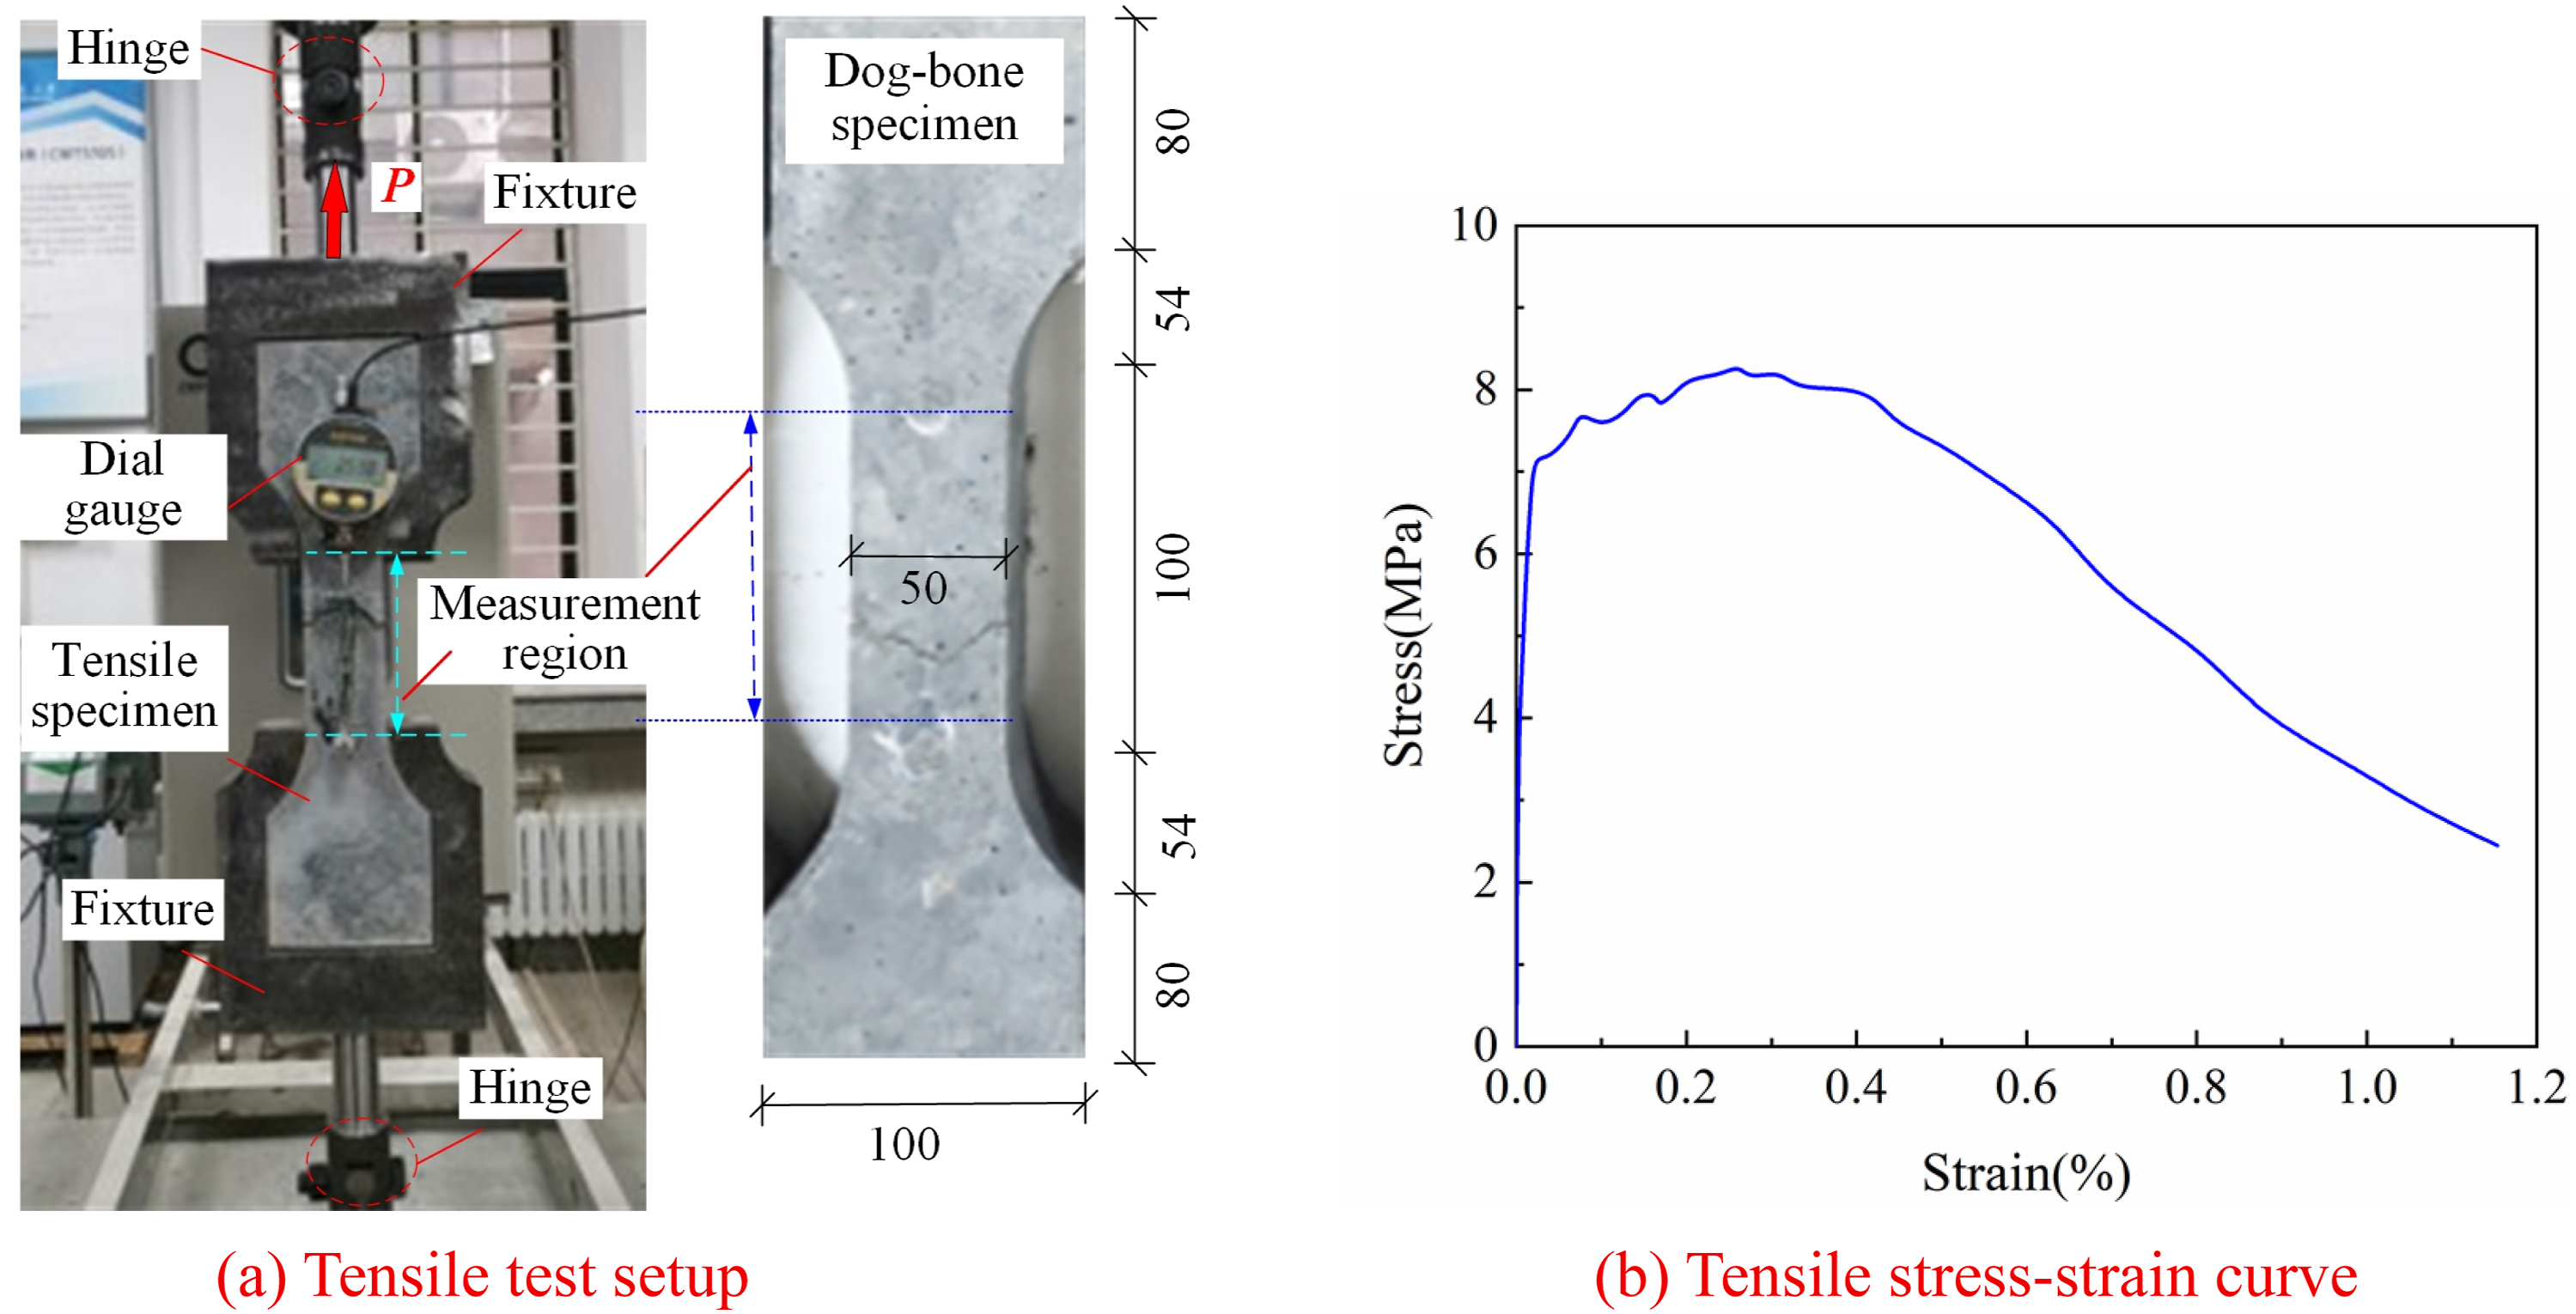

Specimen detail
The cross-sectional width, height and length of the test beams are 150 mm, 250 mm and 2000 mm, respectively, with a calculated span of 1800 mm, and pure flexural zone of 600 mm. The ratio of the UHPC segment length (Lu) to the calculated span (L) of the composite beams was the test variable, with Lu/L taking the values of 0, 0.25, 0.5, 0.75 and 1, respectively. All beams adopted the same reinforcement ratio (2 Φ 10 for compression reinforcement, 2 Φ 18 for tension reinforcement, and Φ 8 for stirrups). The distance between the stirrups in the flexural shear section and the pure flexural section of the beams was 100 mm and 150 mm. The detailed size and section form are shown in Figure 3(a). The 1-1 section, 2-2 section and 3-3 section of the composite beams are shown in Figure 3(b) to (d). Where NB and UB represent NC beams and UHPC beams; and UN denotes composite beams consisting of UHPC and NC, where UN-HB1, UN-HB2 and UN-HB3 denote composite beams with UHPC lengths Lu of 450 mm, 900 mm and 1350 mm, respectively. The details of the test beams are shown in Table 2. Effective load transfer is ensured by the use of key-tooth interfaces and the setting of connecting reinforcement. The interface of key tooth is designed according to NFP 18-710 (2016), and the root width and height of the keyed interface were 100 mm and 50 mm. The detailed dimensions of the interface are shown in Figure 3(e). Geometric dimensions of test specimens (unit: mm). Characteristics of tested beams.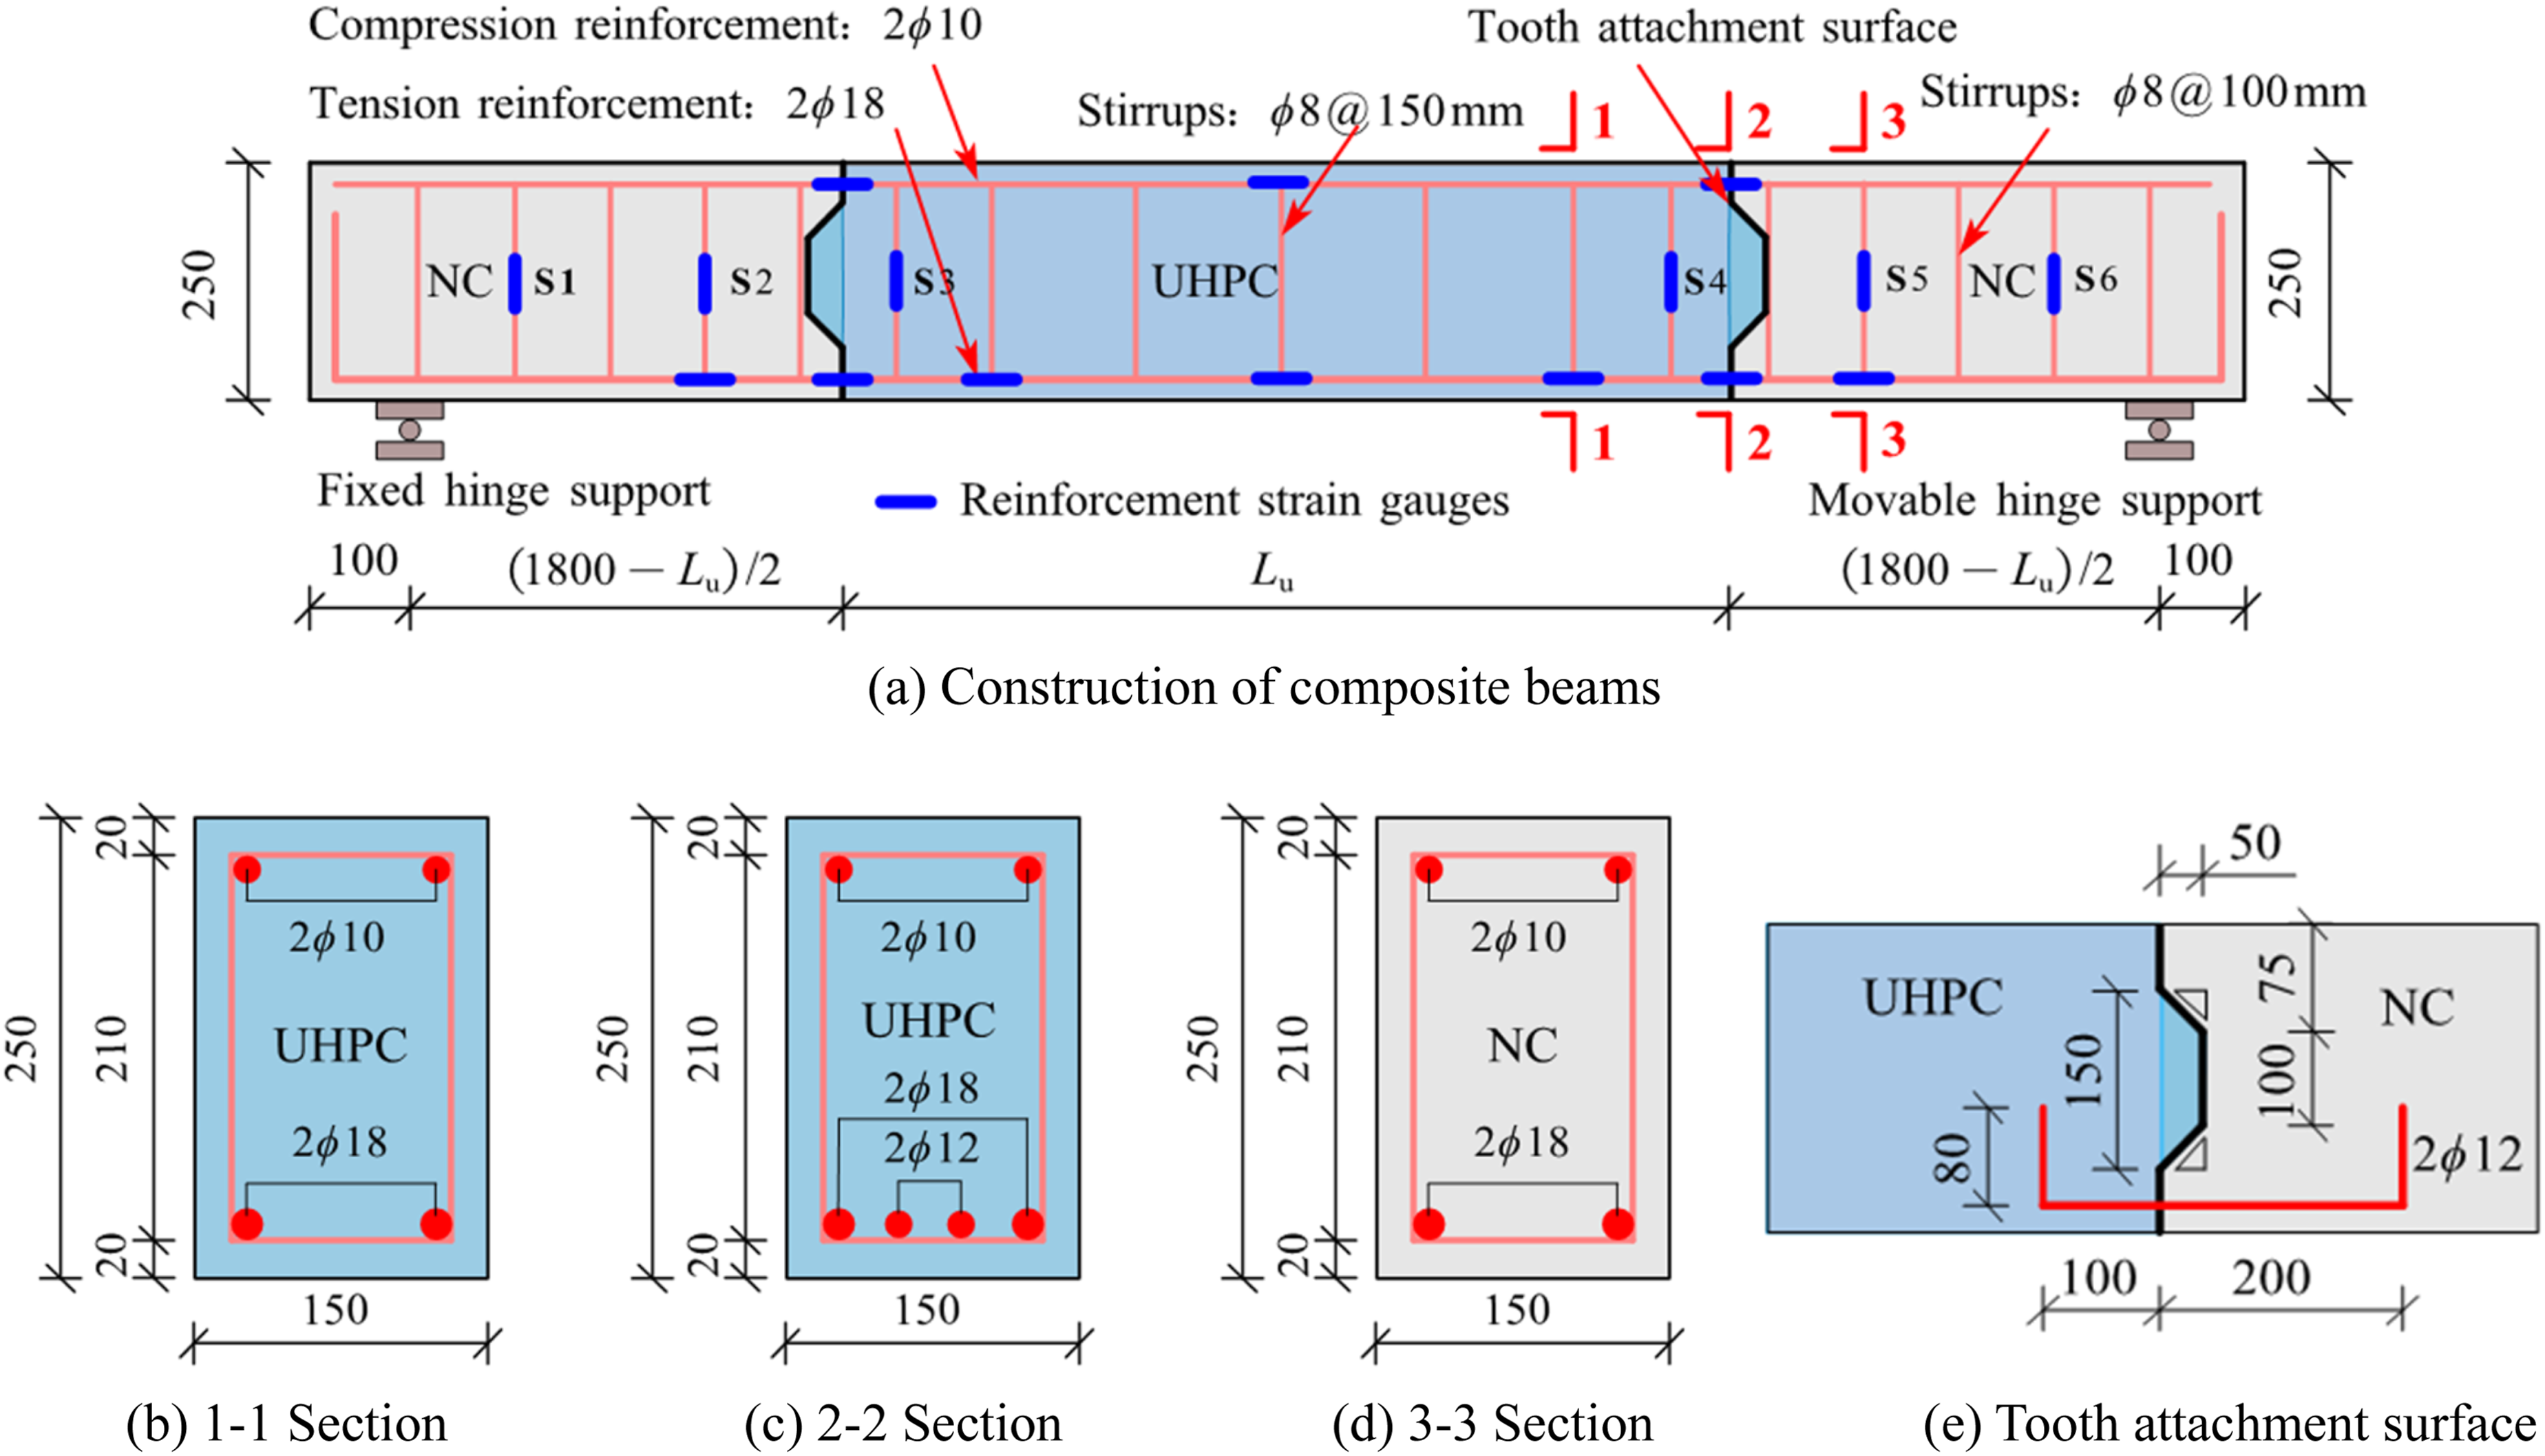
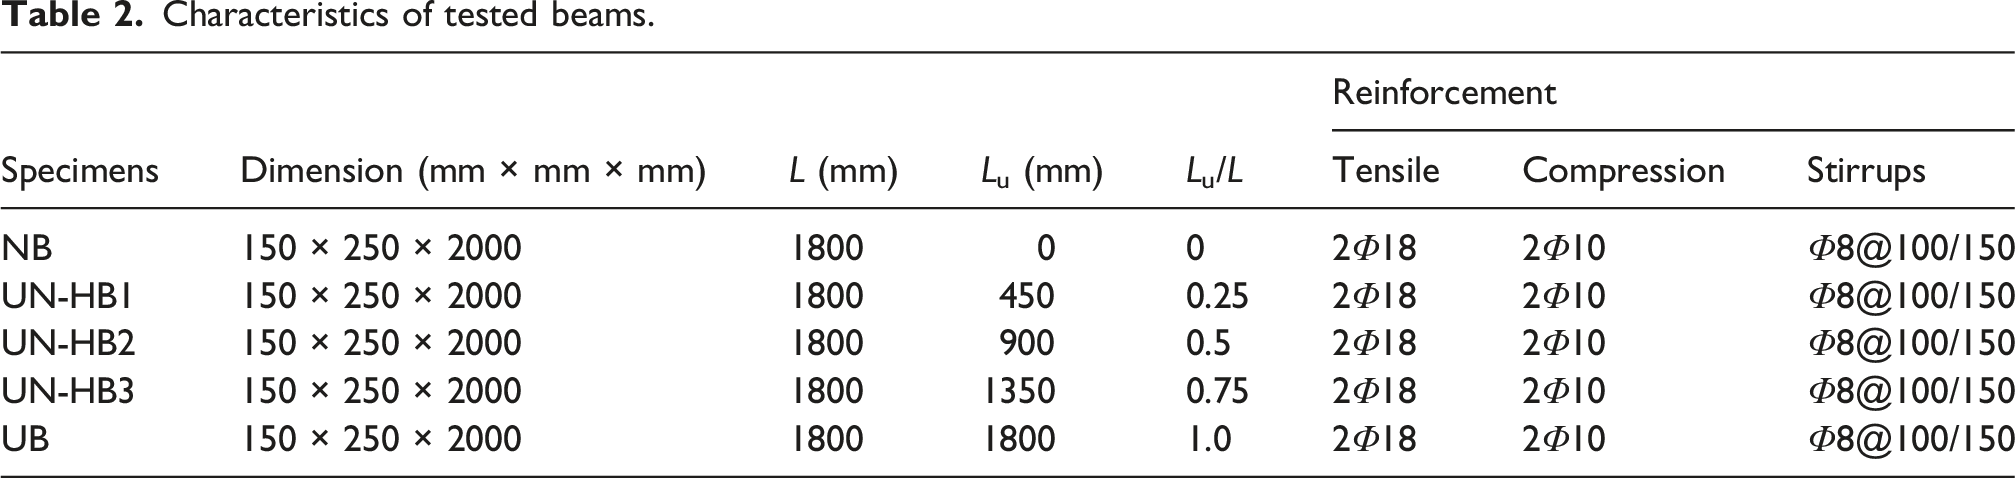
Figure 4 illustrates the steps involved in the preparation and curing of the beams. The steps are as follows: (1) Place the reinforcement cage in the formwork and set the keyed interface (internal templates) at the design position. (2) Cut openings on the internal templates at positions corresponding to the reinforcements, so that the reinforcements can pass through the dividers while preventing concrete from flowing through, thereby separating the formwork into independent casting regions (Area 1 is poured with UHPC, Area 2 is poured with NC). (3) Pour normal concrete (NC), and remove the internal templates after the NC reached its initial setting. (4) After pouring UHPC, the specimens were covered with protective film. They were kept at room temperature for 24 hours before demolding, followed by standard curing at ambient temperature (approximately 25°C) for 28 days prior to the flexural testing. The standard specimens for the material properties test were cast in the same batch of concrete as the composite beams. Preparing procedures of test specimens.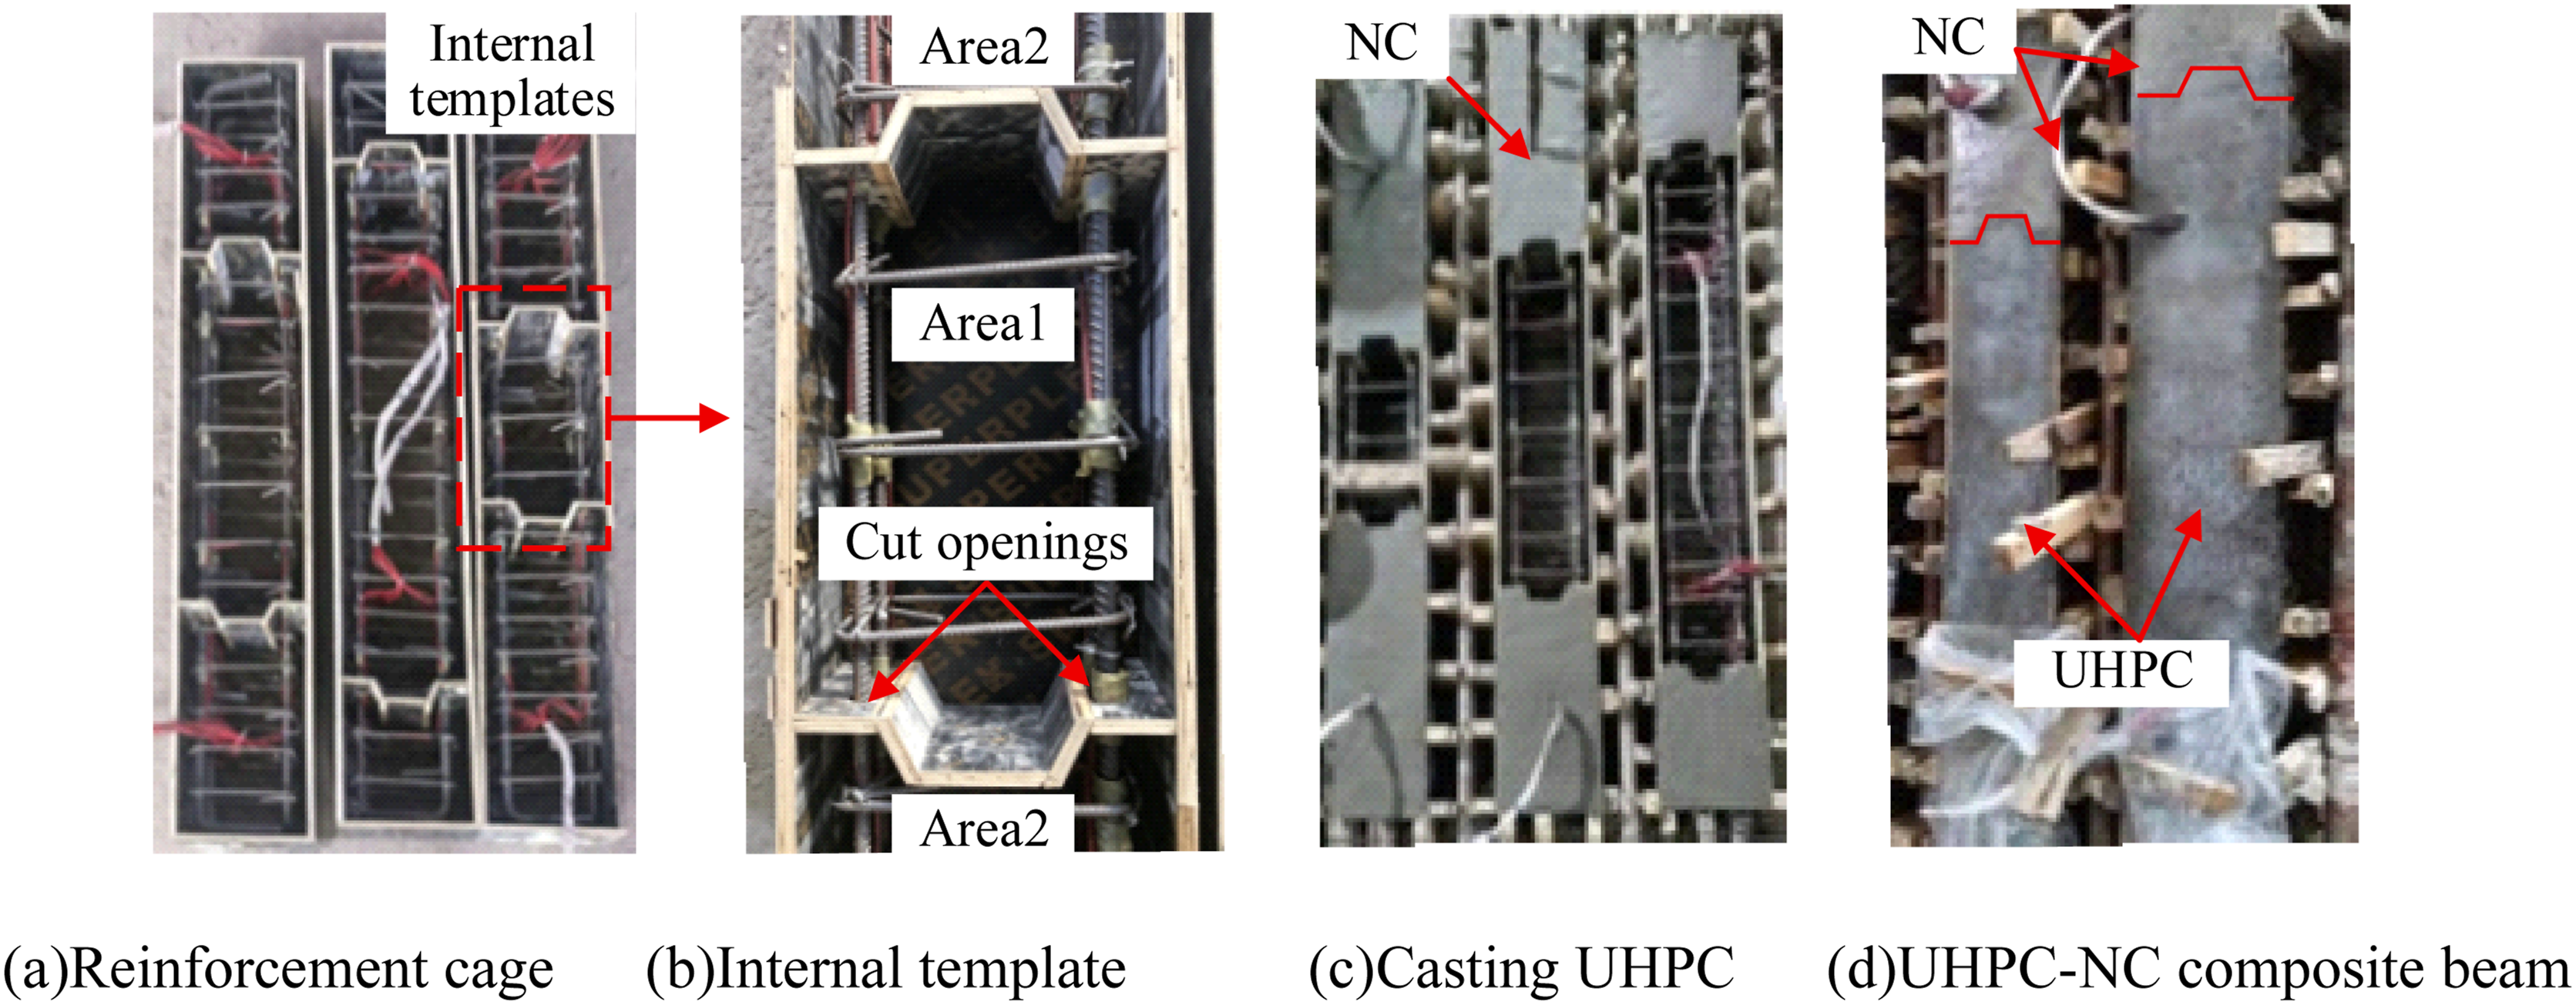
Test setup, instrumentation, and loading protocol
Four-point flexural tests of UHPC-NC composite beams were carried out using a 500 t hydraulic testing system. The load, displacement and strain data during the test were collected by TDS-602 data acquisition system, along with an ASW-50C scanner box for manual data collection. The strain of stirrups were measured by strain gauges S1∼S6 (Figure 3(a)). The test beams were arranged in the form of simply supported beams, all of which were supported on steel blocks at the supports to ensure that there was no local damage to the ends of the composite beams. The loading arrangement and the placement of concrete strain gauges for the UHPC-NC composite beam are shown in Figure 5(a), the deflection at each section of the composite beams was measured by displacement meters D1∼D5. The laboratory apparatus and instrumentation are shown in Figure 5(b), and the reinforcement strain gauge arrangement of the composite beams is shown in Figure 5(c). The flexural tests were conducted in accordance with GB/T 50152-2012 (2012). Three UHPC-NC composite beams (UN-HB1, UN-HB2 and UN-HB3) and two control beams (NB and UB) were designed to study the effects of different Lu/L on the crack development, bearing capacity, failure mode, ductility and stiffness of UHPC-NC composite beams. Before the load reached the cracking load of the test beams, displacement-controlled loading of 0.2 mm/min was used for loading. The load was applied at a rate of 0.5 mm/min when the crack load of the specimen was reached. Test setup and measuring point arrangement.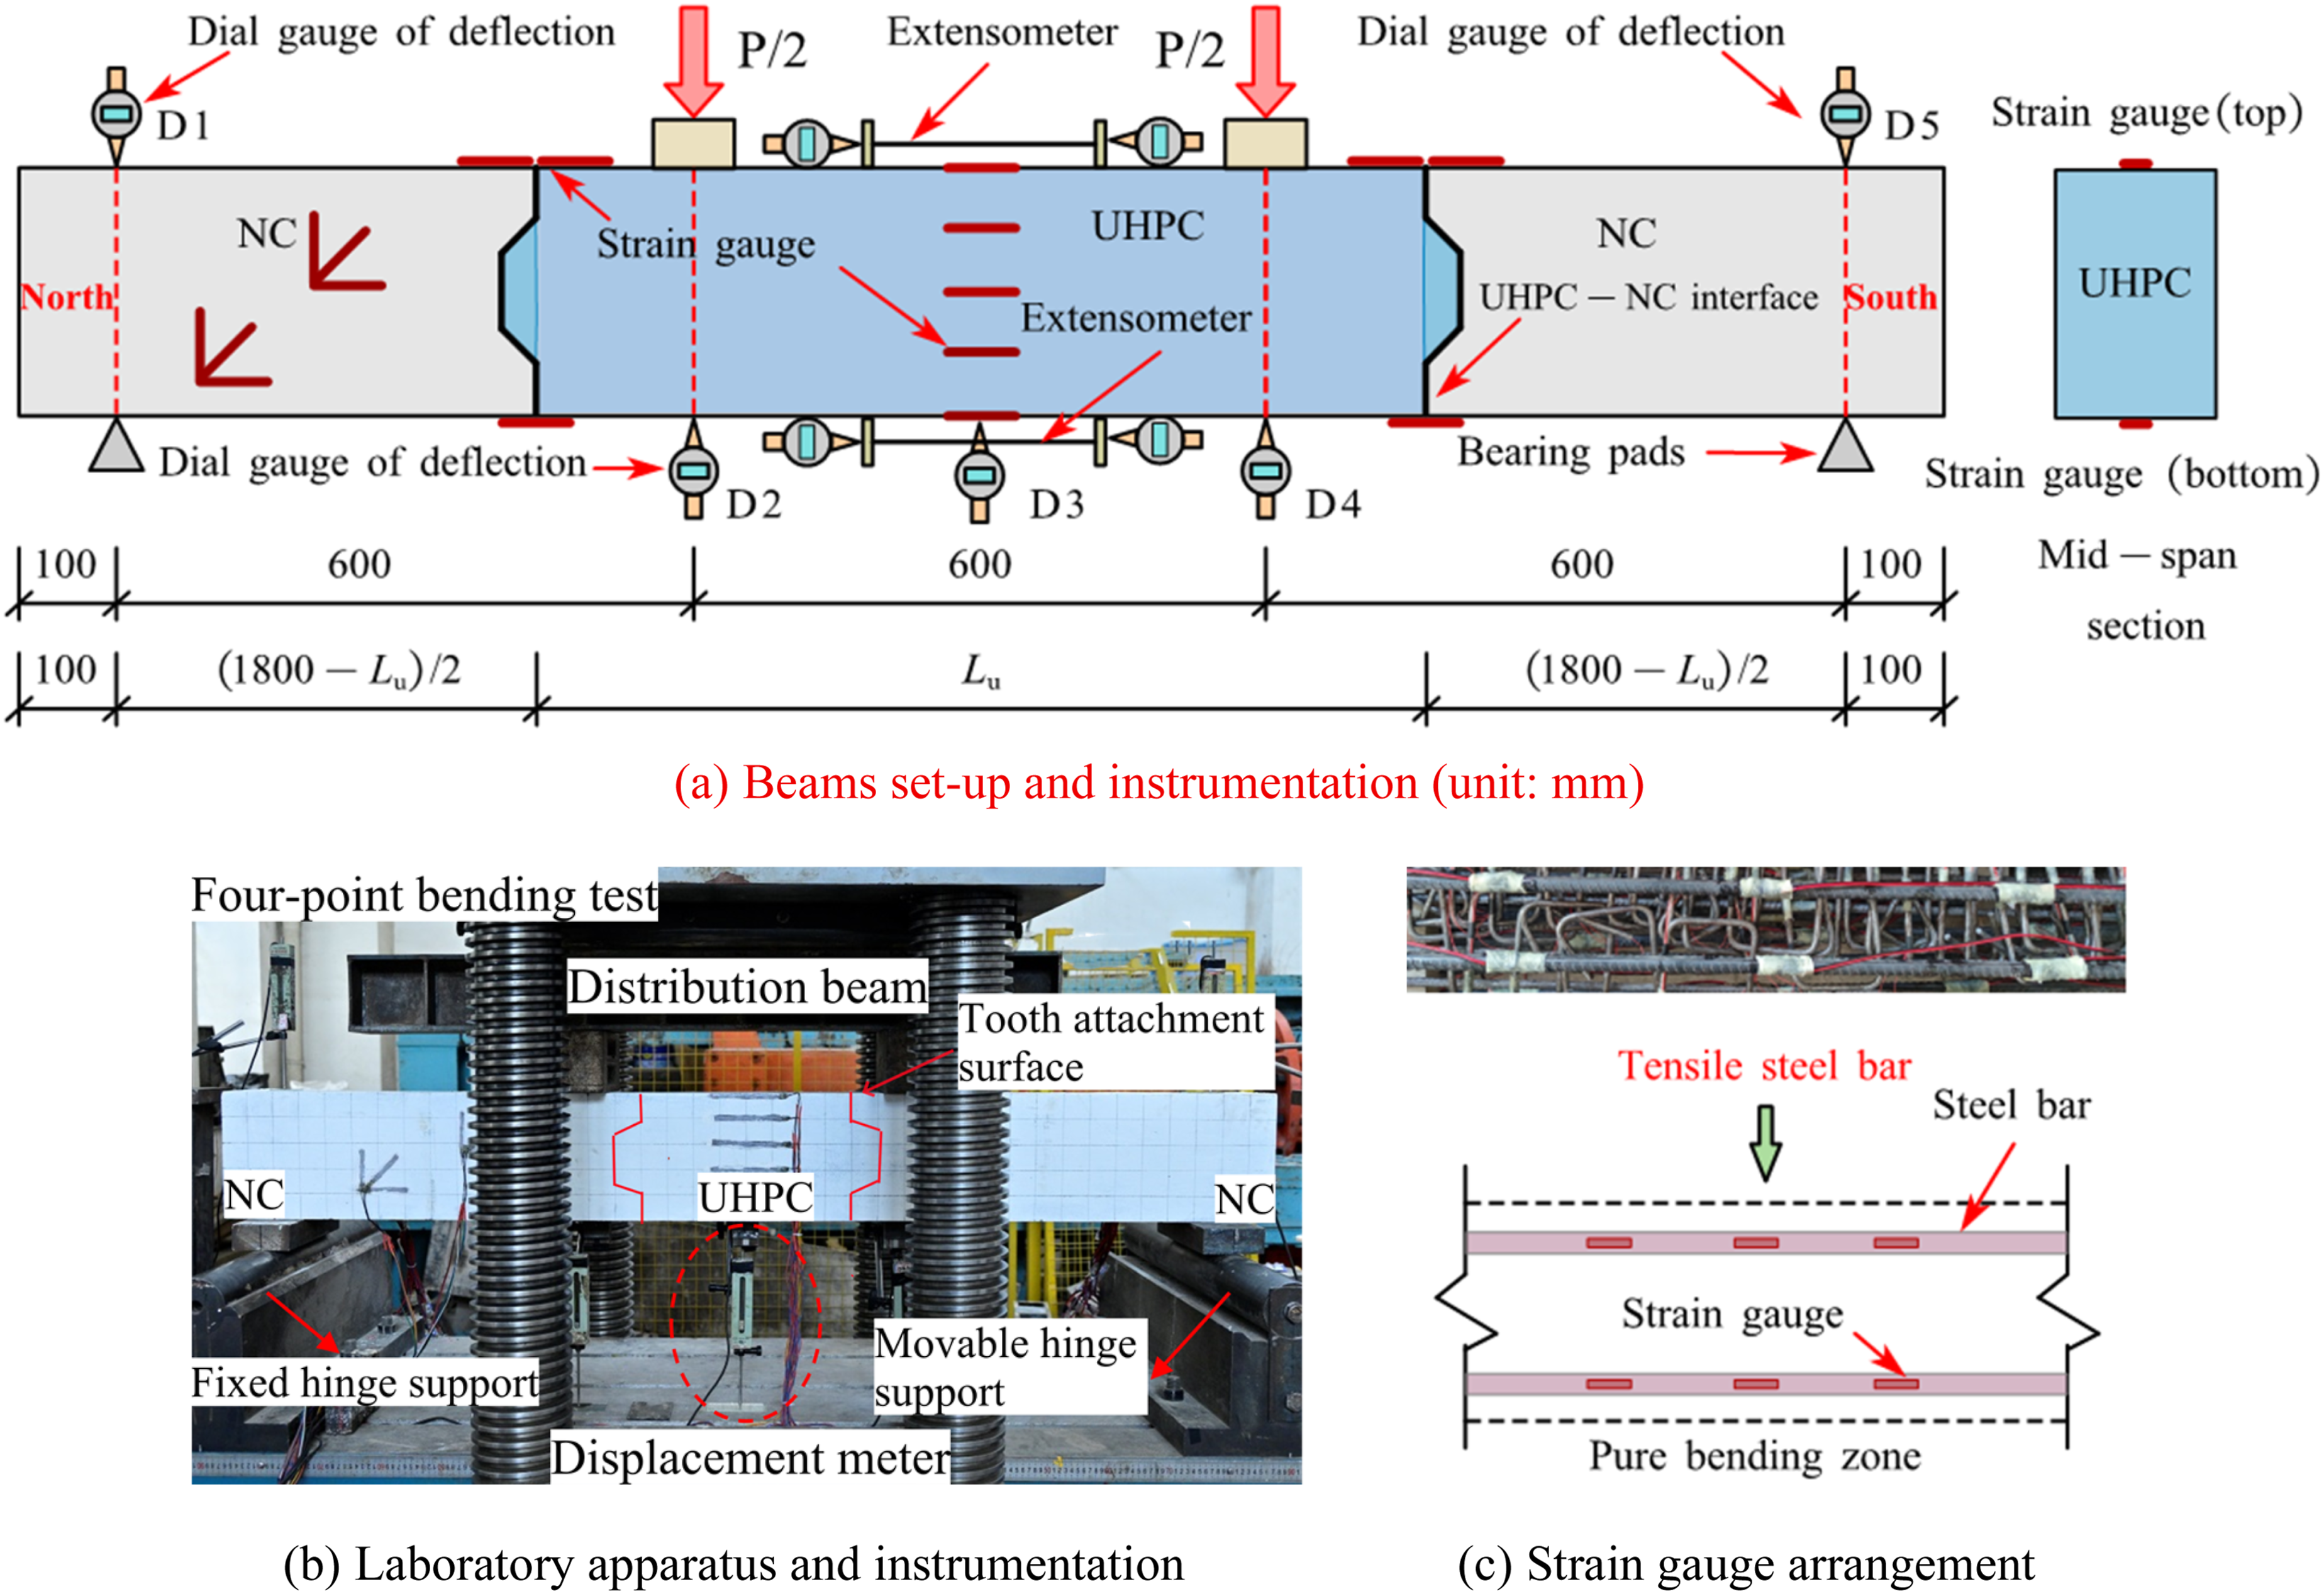
Test results and discussion
Crack development and failure mode
Failure modes of composite beams
The failure modes of the composite beams can be seen from Figure 6. Composite beam UN-HB1 experienced flexural shear failure, and it exhibited oblique shear cracks and vertical flexural cracks. However, beams NB, UB, UN-HB2 and UN-HB3 exhibited flexural failure. The NC beam (NB) was damaged with multiple narrow cracks at the bottom that were uniformly distributed. Due to the limited length of the UHPC, the composite beam UN-HB1 moved downward as a whole without deformation of the UHPC in the mid-span upon failure (Figure 6(b)). UN-HB2, UN-HB3 and UB have two to three dominant cracks in the flexural section, and the main crack width typically ranges from 1 mm to 7 mm. Interestingly, the main crack in the composite beams consistently appears aligned with the loading point. The main reason is that the loading point is the transition critical point between pure flexural and flexural-shear section, where the bending moment is the largest and shear force is present. The interface between the UHPC and NC did not fail, demonstrating that this robust keyed interface can satisfy the structural performance requirements of the beams. The cracks at the bottom of the mid-span of the composite beams are wide, and the steel fibers at the crack partial pullout and fracture of steel fibers when the beams failed. Failure modes of test specimens. (a)NB; (b)UN-HB1; (c)UN-HB2; (d)UN-HB3; (e)UB.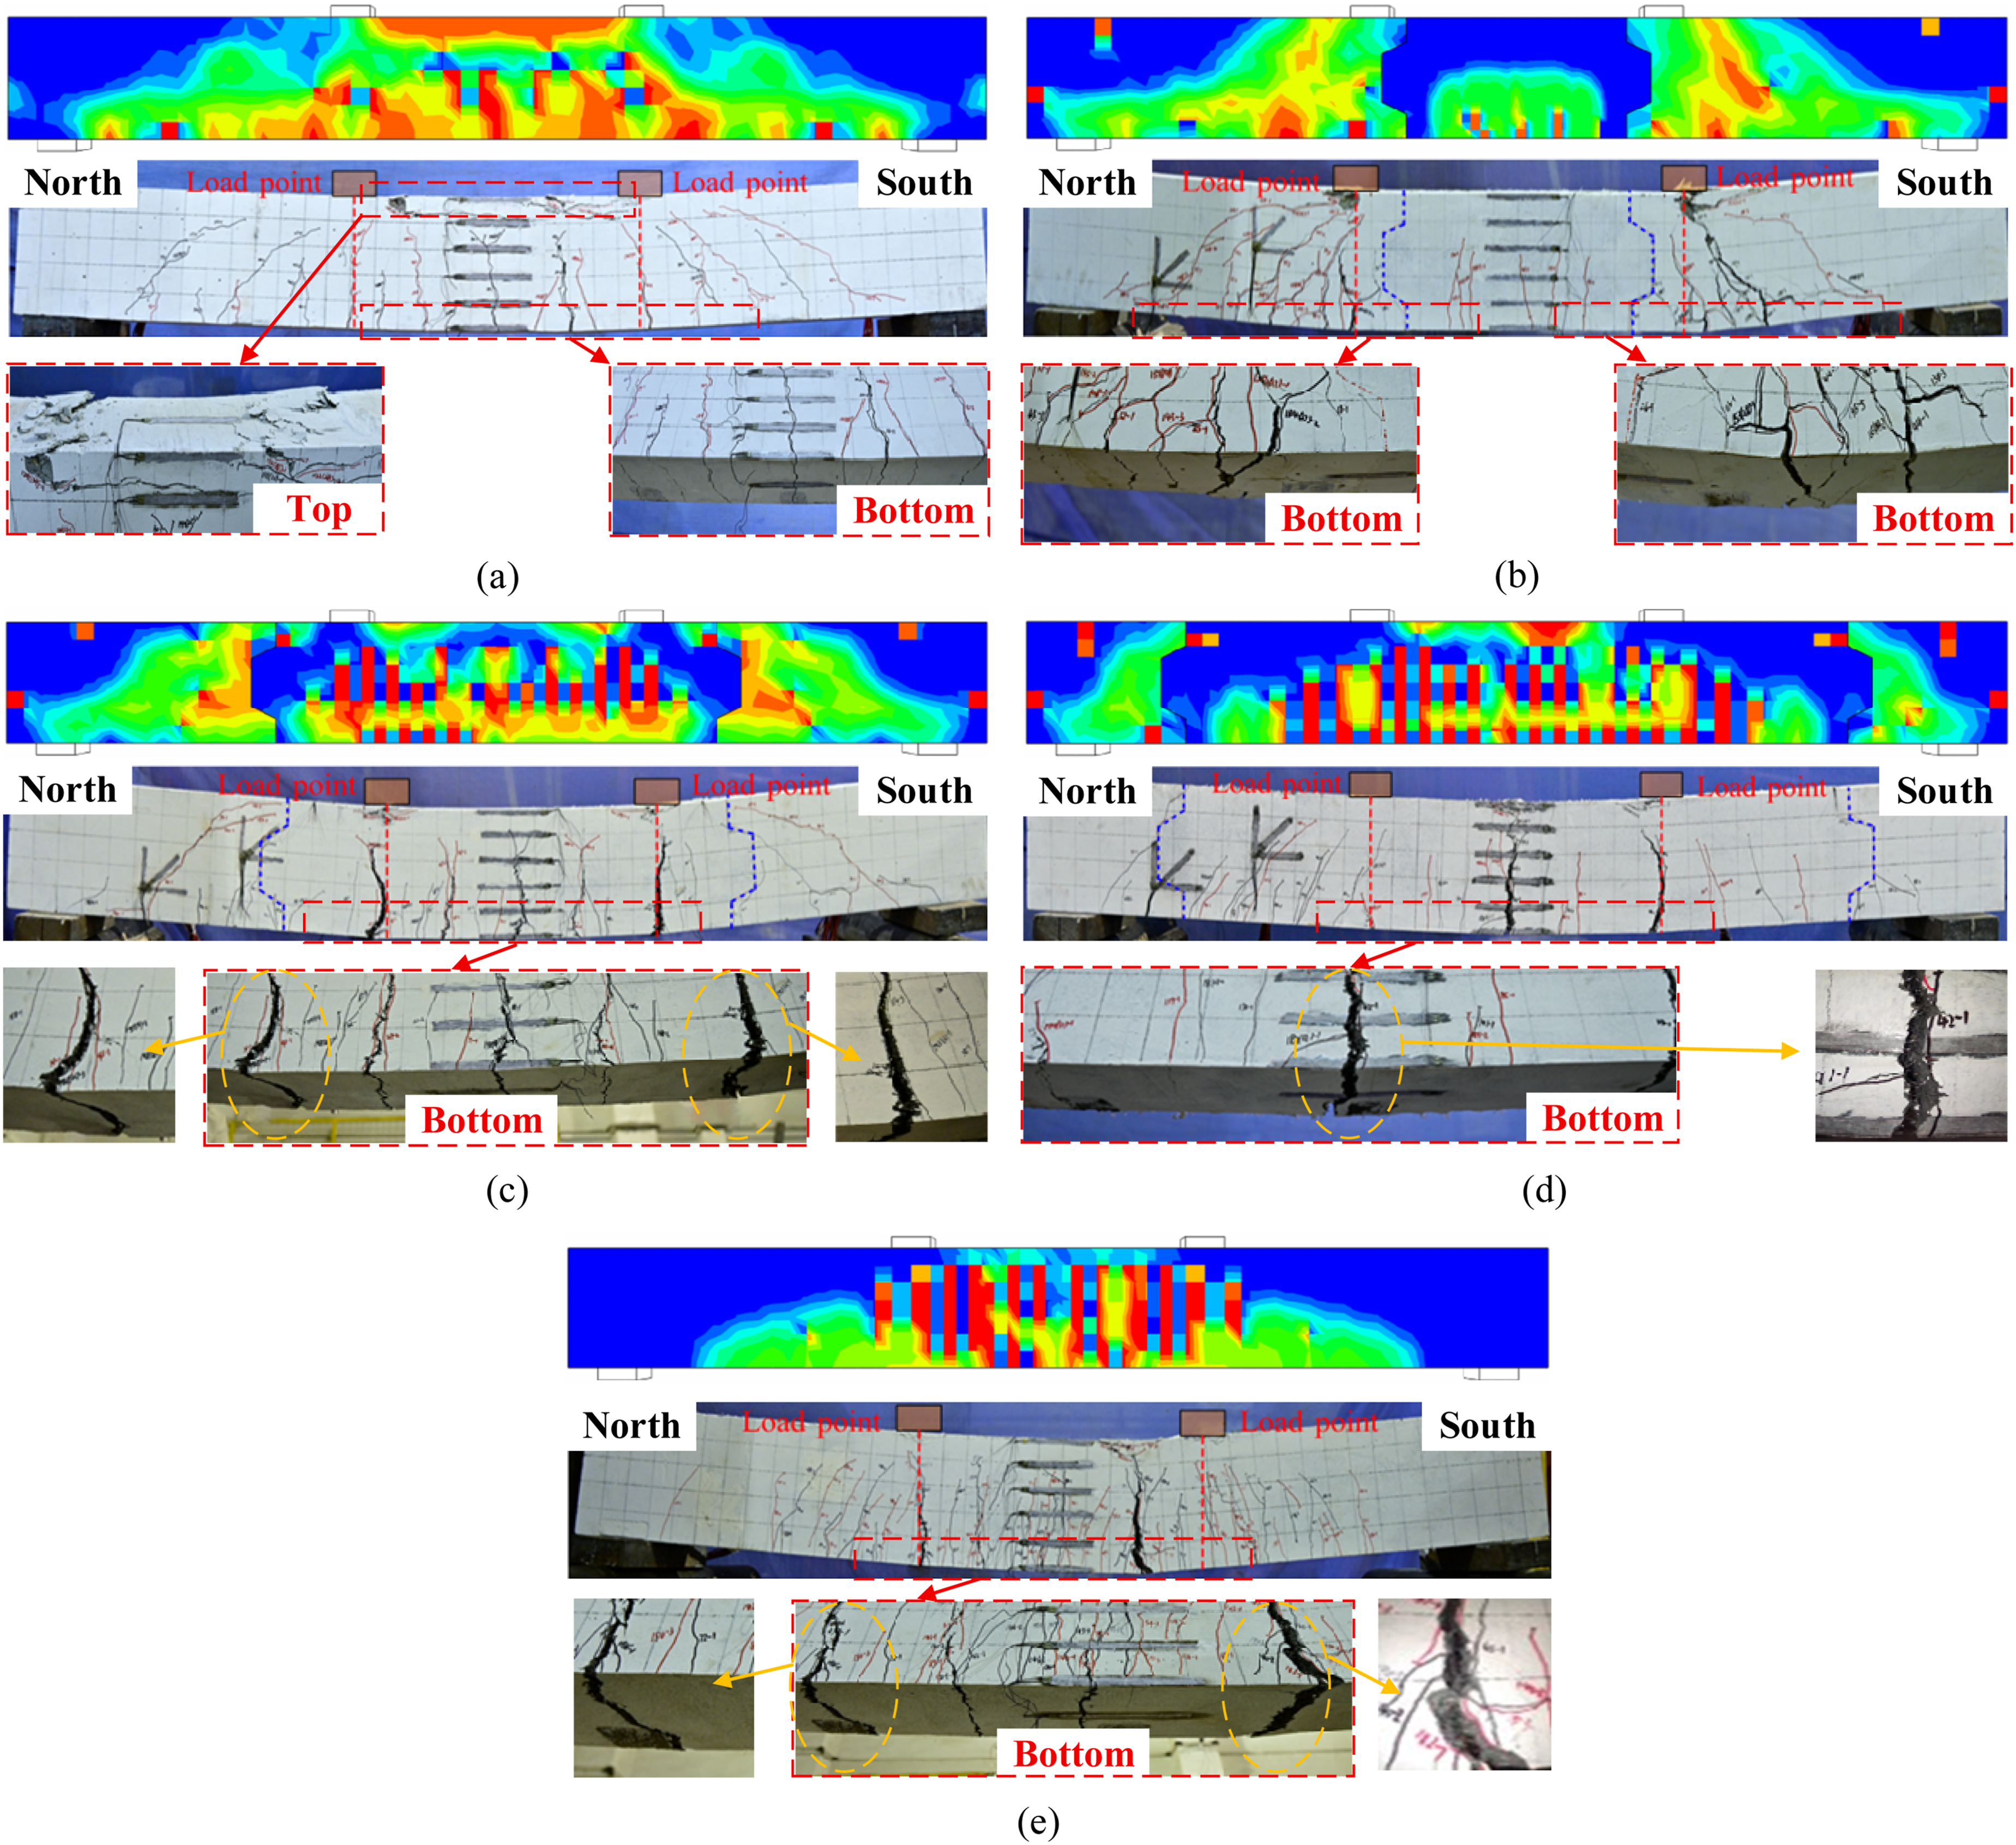
Crack development of composite beams
A representative fully developed crack from the composite beams was selected for analysis, as shown in Figure 7(a). Before reaching 80% of the peak load Pm, the crack width of each specimen was less than 1 mm, and the crack growth rate of NB beam was significantly greater than those of the composite beams and UB beam. This indicates that the bridging effect of steel fibers in UHPC allows the composite beams to exhibit better crack control during the service stage (0-0.8 P/Pm). At the same time, the crack evolution behavior of UN-HB2 and UN-HB3 composite beams are similar, and the crack development patterns of UN-HB1 are the same as NB due to its small Lu/L. Beyond 80% of the peak load, the crack width of each specimen increased sharply with increasing deflection, and the crack width of the composite beam increased significantly more than that of the NB beam. The bridging effect of steel fibers in the UHPC of the composite beams inhibited the initiation and propagation, which led to a further increase in the main crack. The main crack width of the composite beam was close to 7 mm upon failure, while the dominant crack width of the NB beam was only 3-4 mm. The development of cracks in composite beams.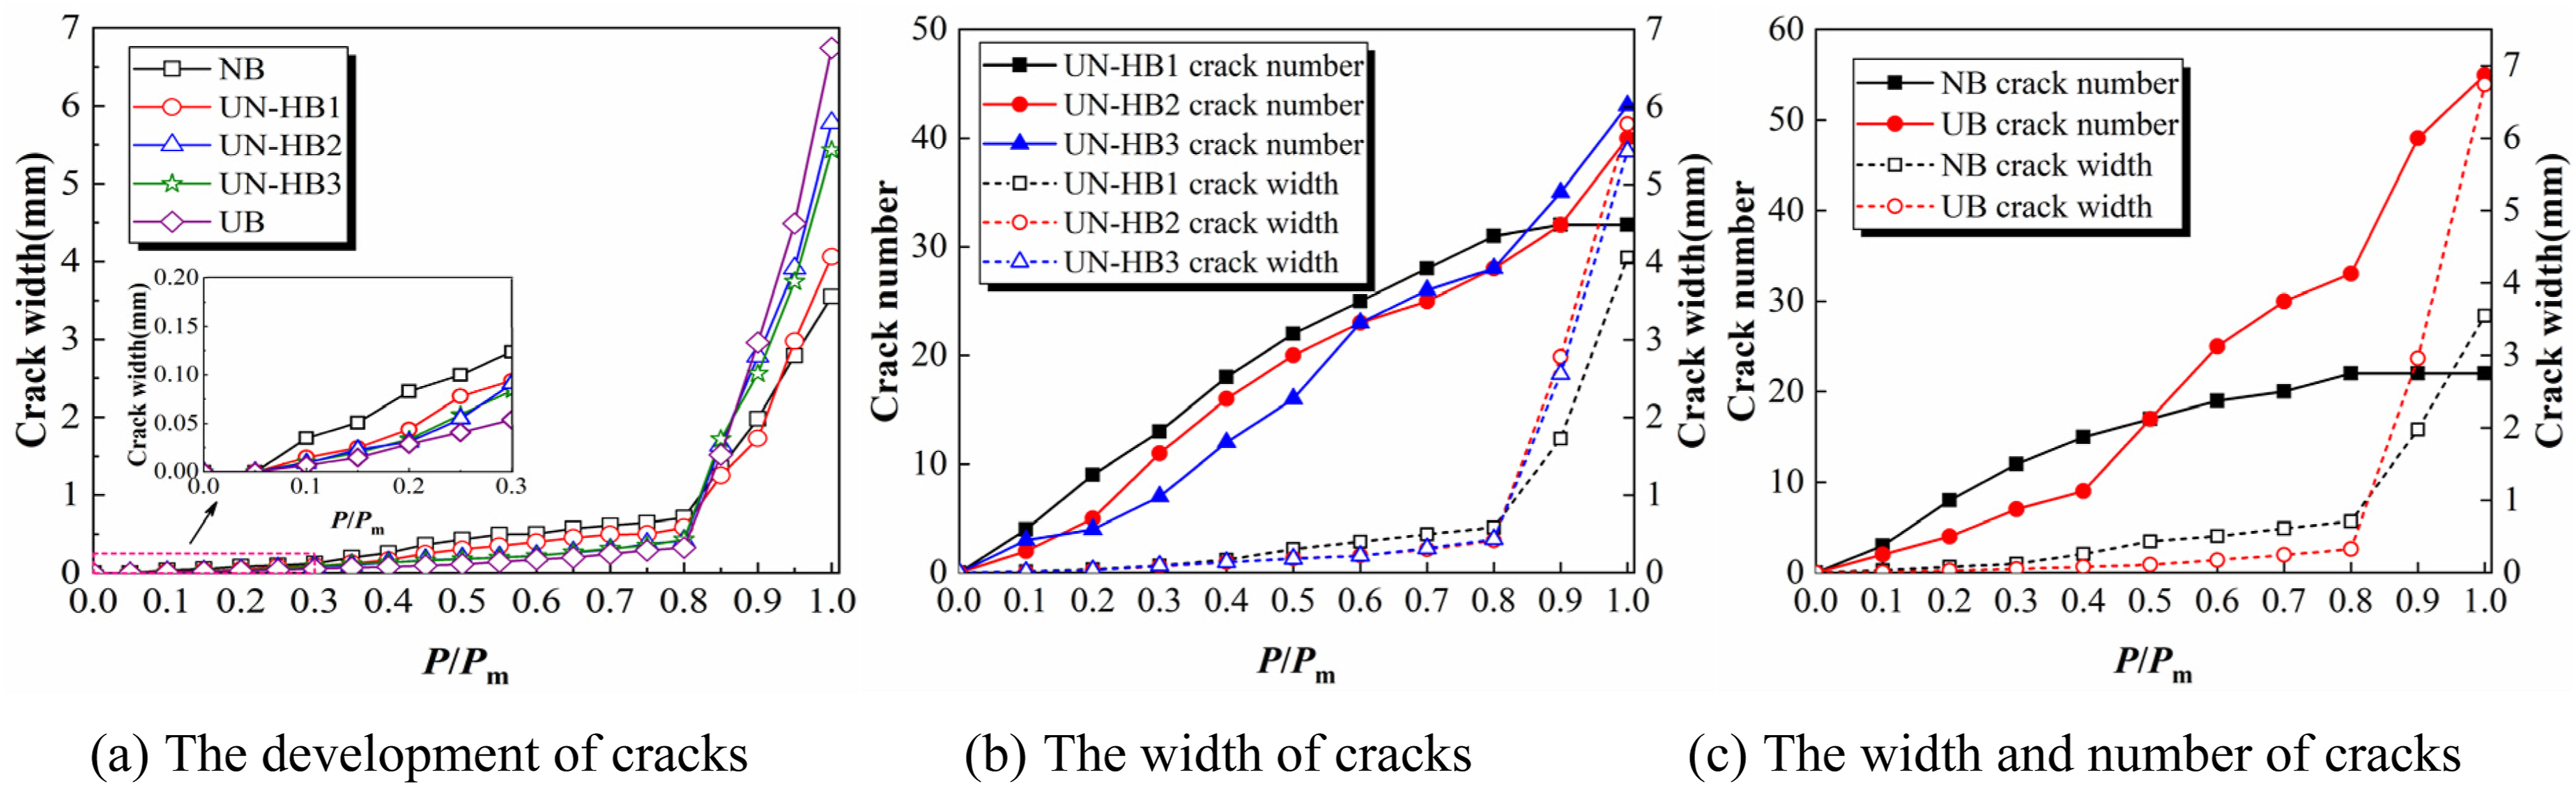
Figure 7(b) and (c) compare the evolution of crack number and crack width in each specimen. The results indicate that there are significant differences in crack development between the composite beams and the NB beam. Before reaching 0.8 P/Pm, the number of cracks in NB and UN-HB1 increased rapidly, while the crack number approached saturation at 0.8 P/Pm. Subsequently, there were no new cracks generated, the main crack width of NB and UN-HB1 beams increased rapidly with the increase of load. Because more cracks were generated during the bending process of the composite beams, these cracks effectively suppressed the effect of deflection on crack widening, resulting in the number of cracks in the composite beam during normal service (0–0.8 P/Pm) was smaller than that in the NB beam. As the load exceeded 0.8P/Pm, additional cracks developed in the composite beam. During the entire loading process, the crack width and the crack number of the composite beam always developed concurrently.
Load-deflection curves
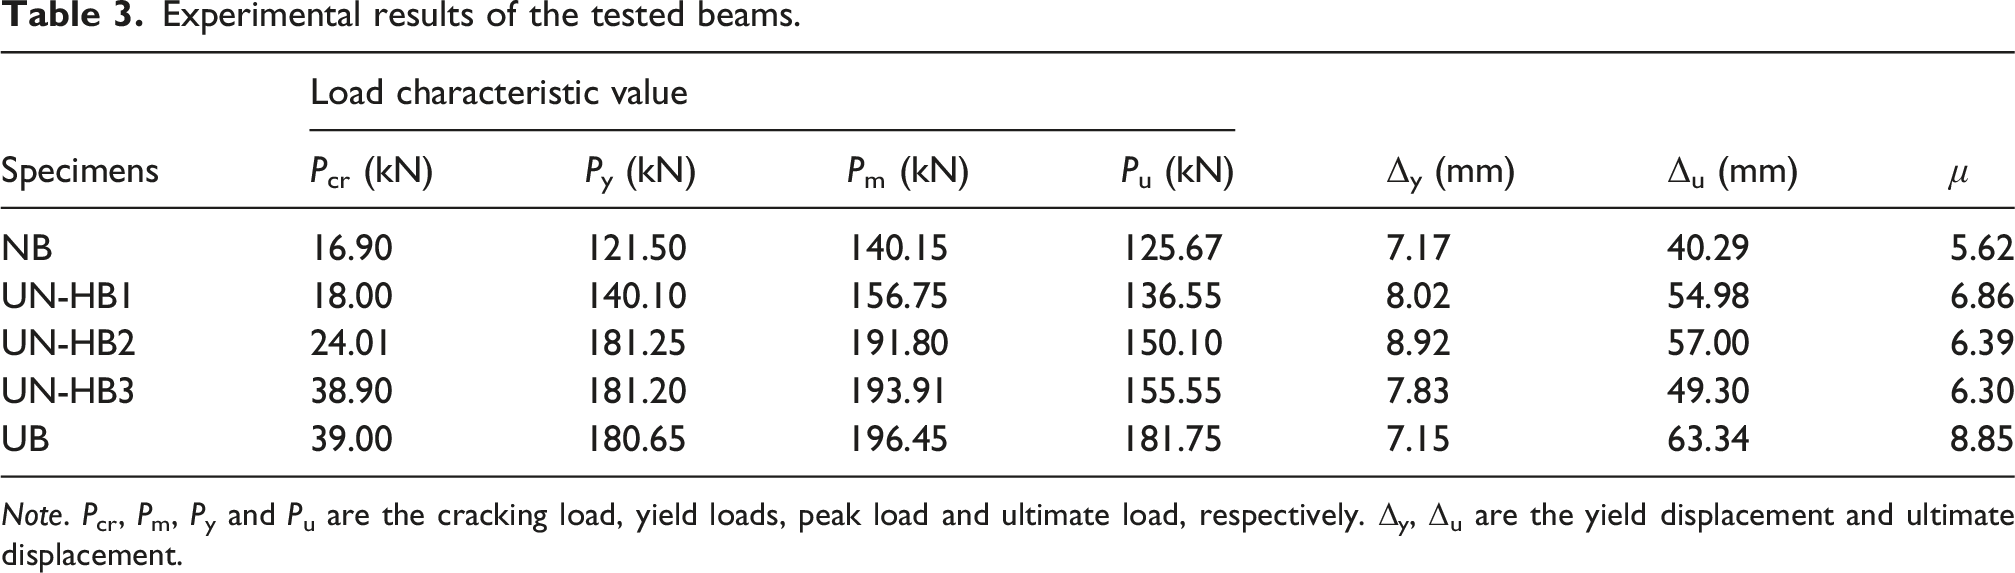
The load-deflection curves of the UHPC-NC composite beams and control beams are shown in Figure 8, the mid-span deflection of the beams is Δ = Δ3-(Δ1+Δ5)/2, where Δ1, Δ3 and Δ5 are the values of the displacement gauges D1, D3 and D5. The load characteristic values (Pcr, Pm, Py and Pu) and displacement values (Δy, Δu) of the UHPC-NC composite beams are shown in Table 3. Specifically, the load values represent the total resultant force of the two loading points. Load-deflection curves and characteristic load of test specimens. Experimental results of the tested beams. Note. Pcr, Pm, Py and Pu are the cracking load, yield loads, peak load and ultimate load, respectively. Δy, Δu are the yield displacement and ultimate displacement.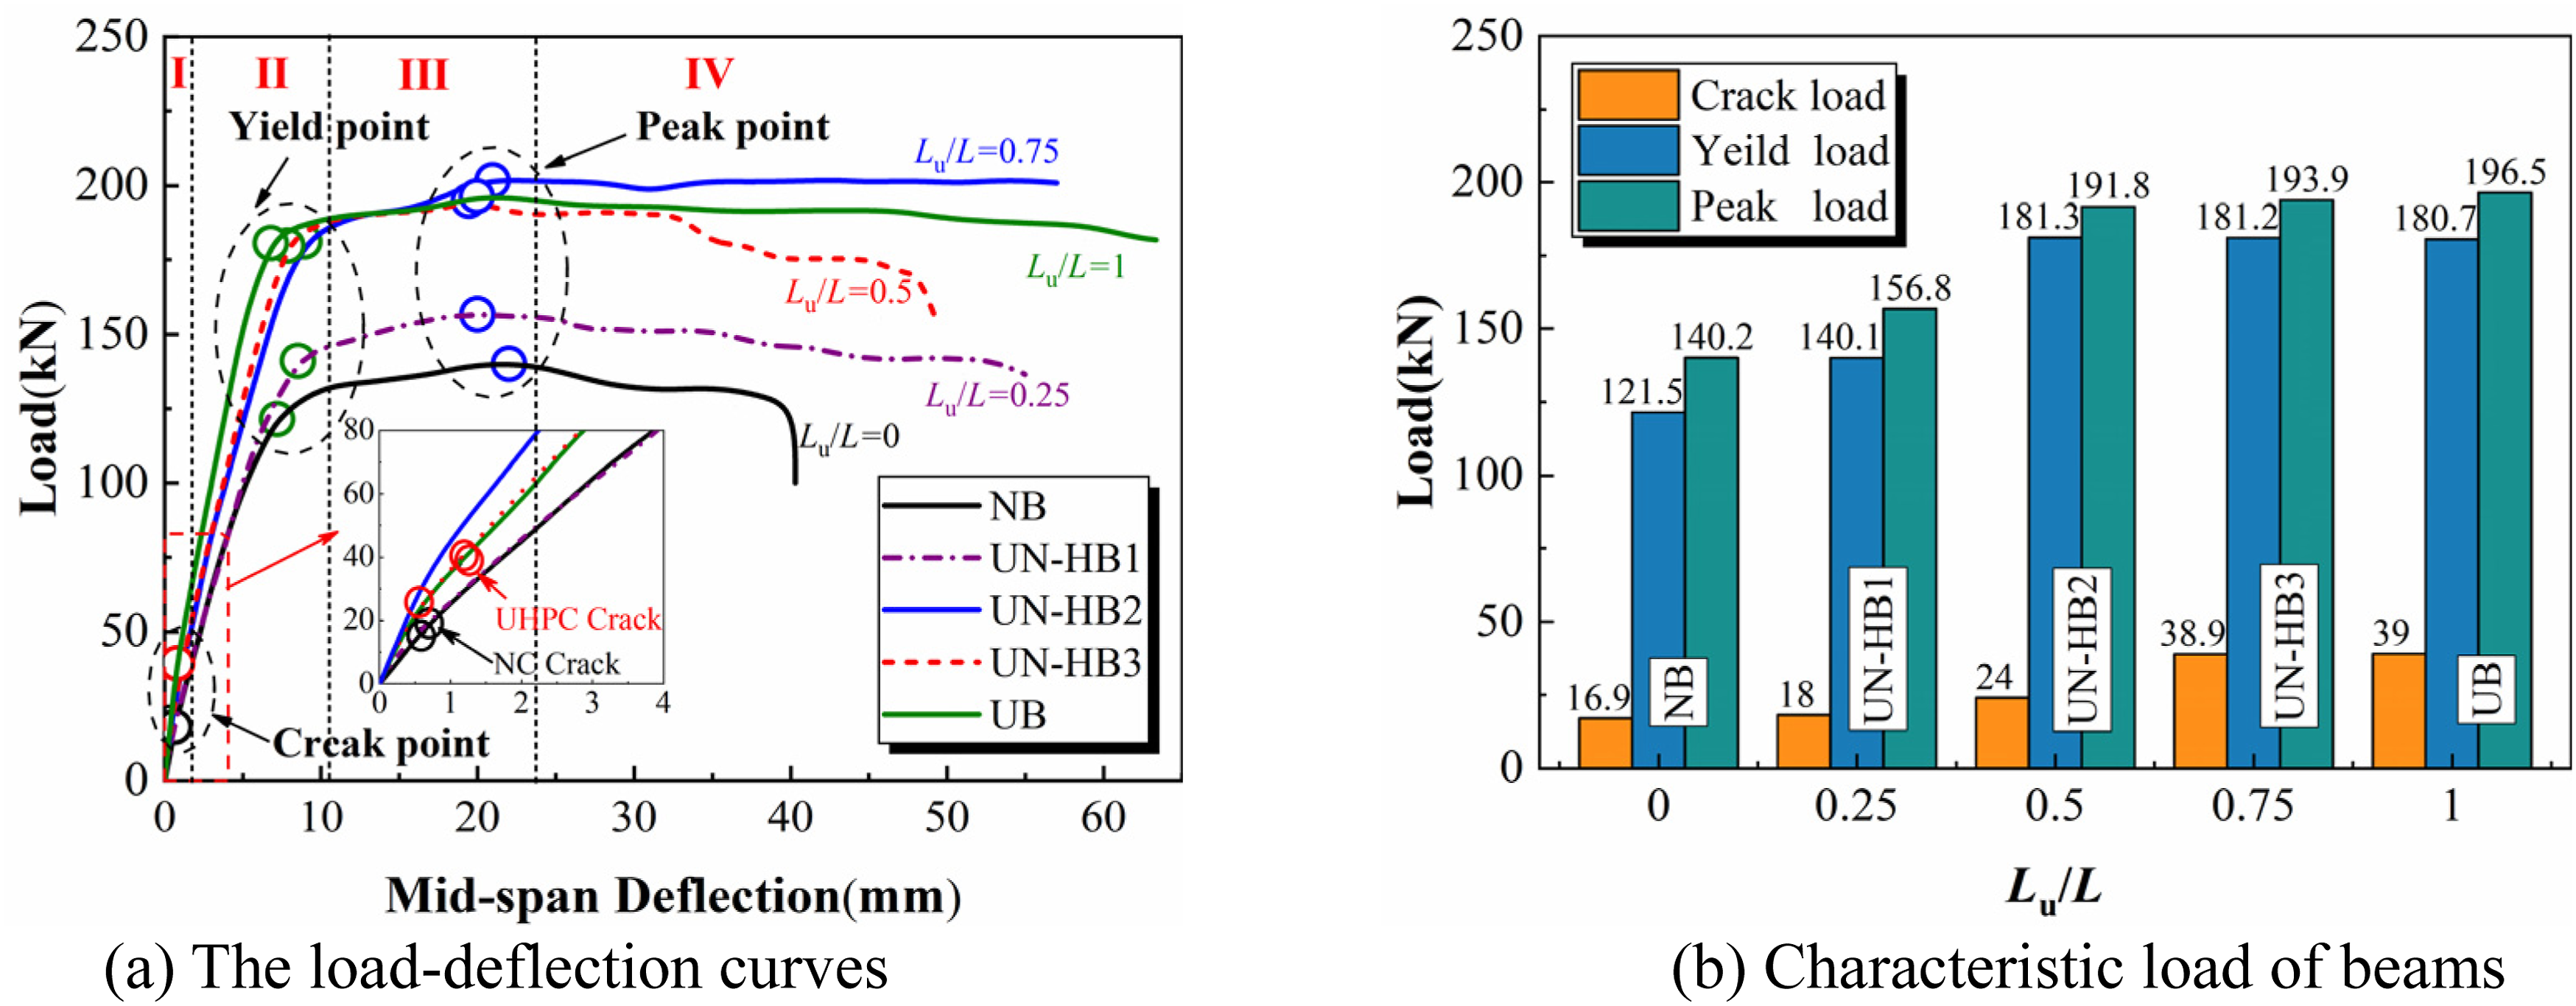
Based on the cracking points, yield points and peak points of the composite beams, the load-deflection curves can be divided into pre-cracking stage (Stage I), crack development stage (Stage II), yielding stage (Stage III) and plastic damage stage after peak loading (Stage IV).
Before the composite beams cracked (Stage I), Lu/L had a significant effect on its crack load. When Lu/L increased from 0 to 0.25, 0.50, 0.75 and 1, the crack load of the beams increased by 6.5%, 42.1%, 130.2% and 130.8%, respectively. The pure flexural section of the composite beam UN-HB1 included UHPC and NC, so NC cracked before UHPC. The cracks in the beams developed further with increasing load (Stage II), and the cracks in the pure bending section of their spans continued to expand. As the cracks continued to expand, the composite beams entered the yielding stage (Stage III). The yield load of the composite beams increased with increasing Lu/L. The composite beams UN-HB2, UN-HB3 and UB with Lu/L of 0.5, 0.75 and 1 had essentially the same yield load (about 180 kN). The peak load of the test beams increased with increasing Lu/L and was greater than that of NB (Stage IV). The peak loads of the composite beams UN-HB1, UN-HB2 and UN-HB3 were increased by 11.8%, 43.9% and 38.3% compared to NB, and the peak loads of UN-HB2 and UN-HB3 were comparable to those of the full UHPC beam (UB). The composite beams have a large ultimate displacement due to the bridging action of the steel fibers, while the NB beam experienced a sudden loss of load-carrying capacity after reaching the ultimate load.
Load-strain behavior
The strain of the reinforcement in the bottom span of the composite beams is shown in Figure 9(a). The strains of the bottom mid-span reinforcement approached the yield strain when the beam NB and the composite beam UN-HB1 enter the yield state. This indicates that the bottom reinforcement reaching the yield strain can serve as an indicator that the normal concrete beam (NC) has entered the yielding stage. For composite beam UN-HB1, which has a smaller Lu/L, the UHPC region experienced an overall downward shift, and the stress state of the tensile reinforcement is basically the same as that of beam NC. However, the strain of the bottom reinforcement had substantially exceeded its yield strain (by about 30%) when the composite beams UN-HB2, UN-HB3 and UB were yielded. The main reason is that the steel fibers in UHPC have a good bridging effect and the tensile effect of steel fibers can still resist tensile force when the reinforcement reached the yield strain. As a result, the reinforcement strain of the composite beams was significantly smaller than that of the NC beams at the same load level. Load-strain curve of specimens.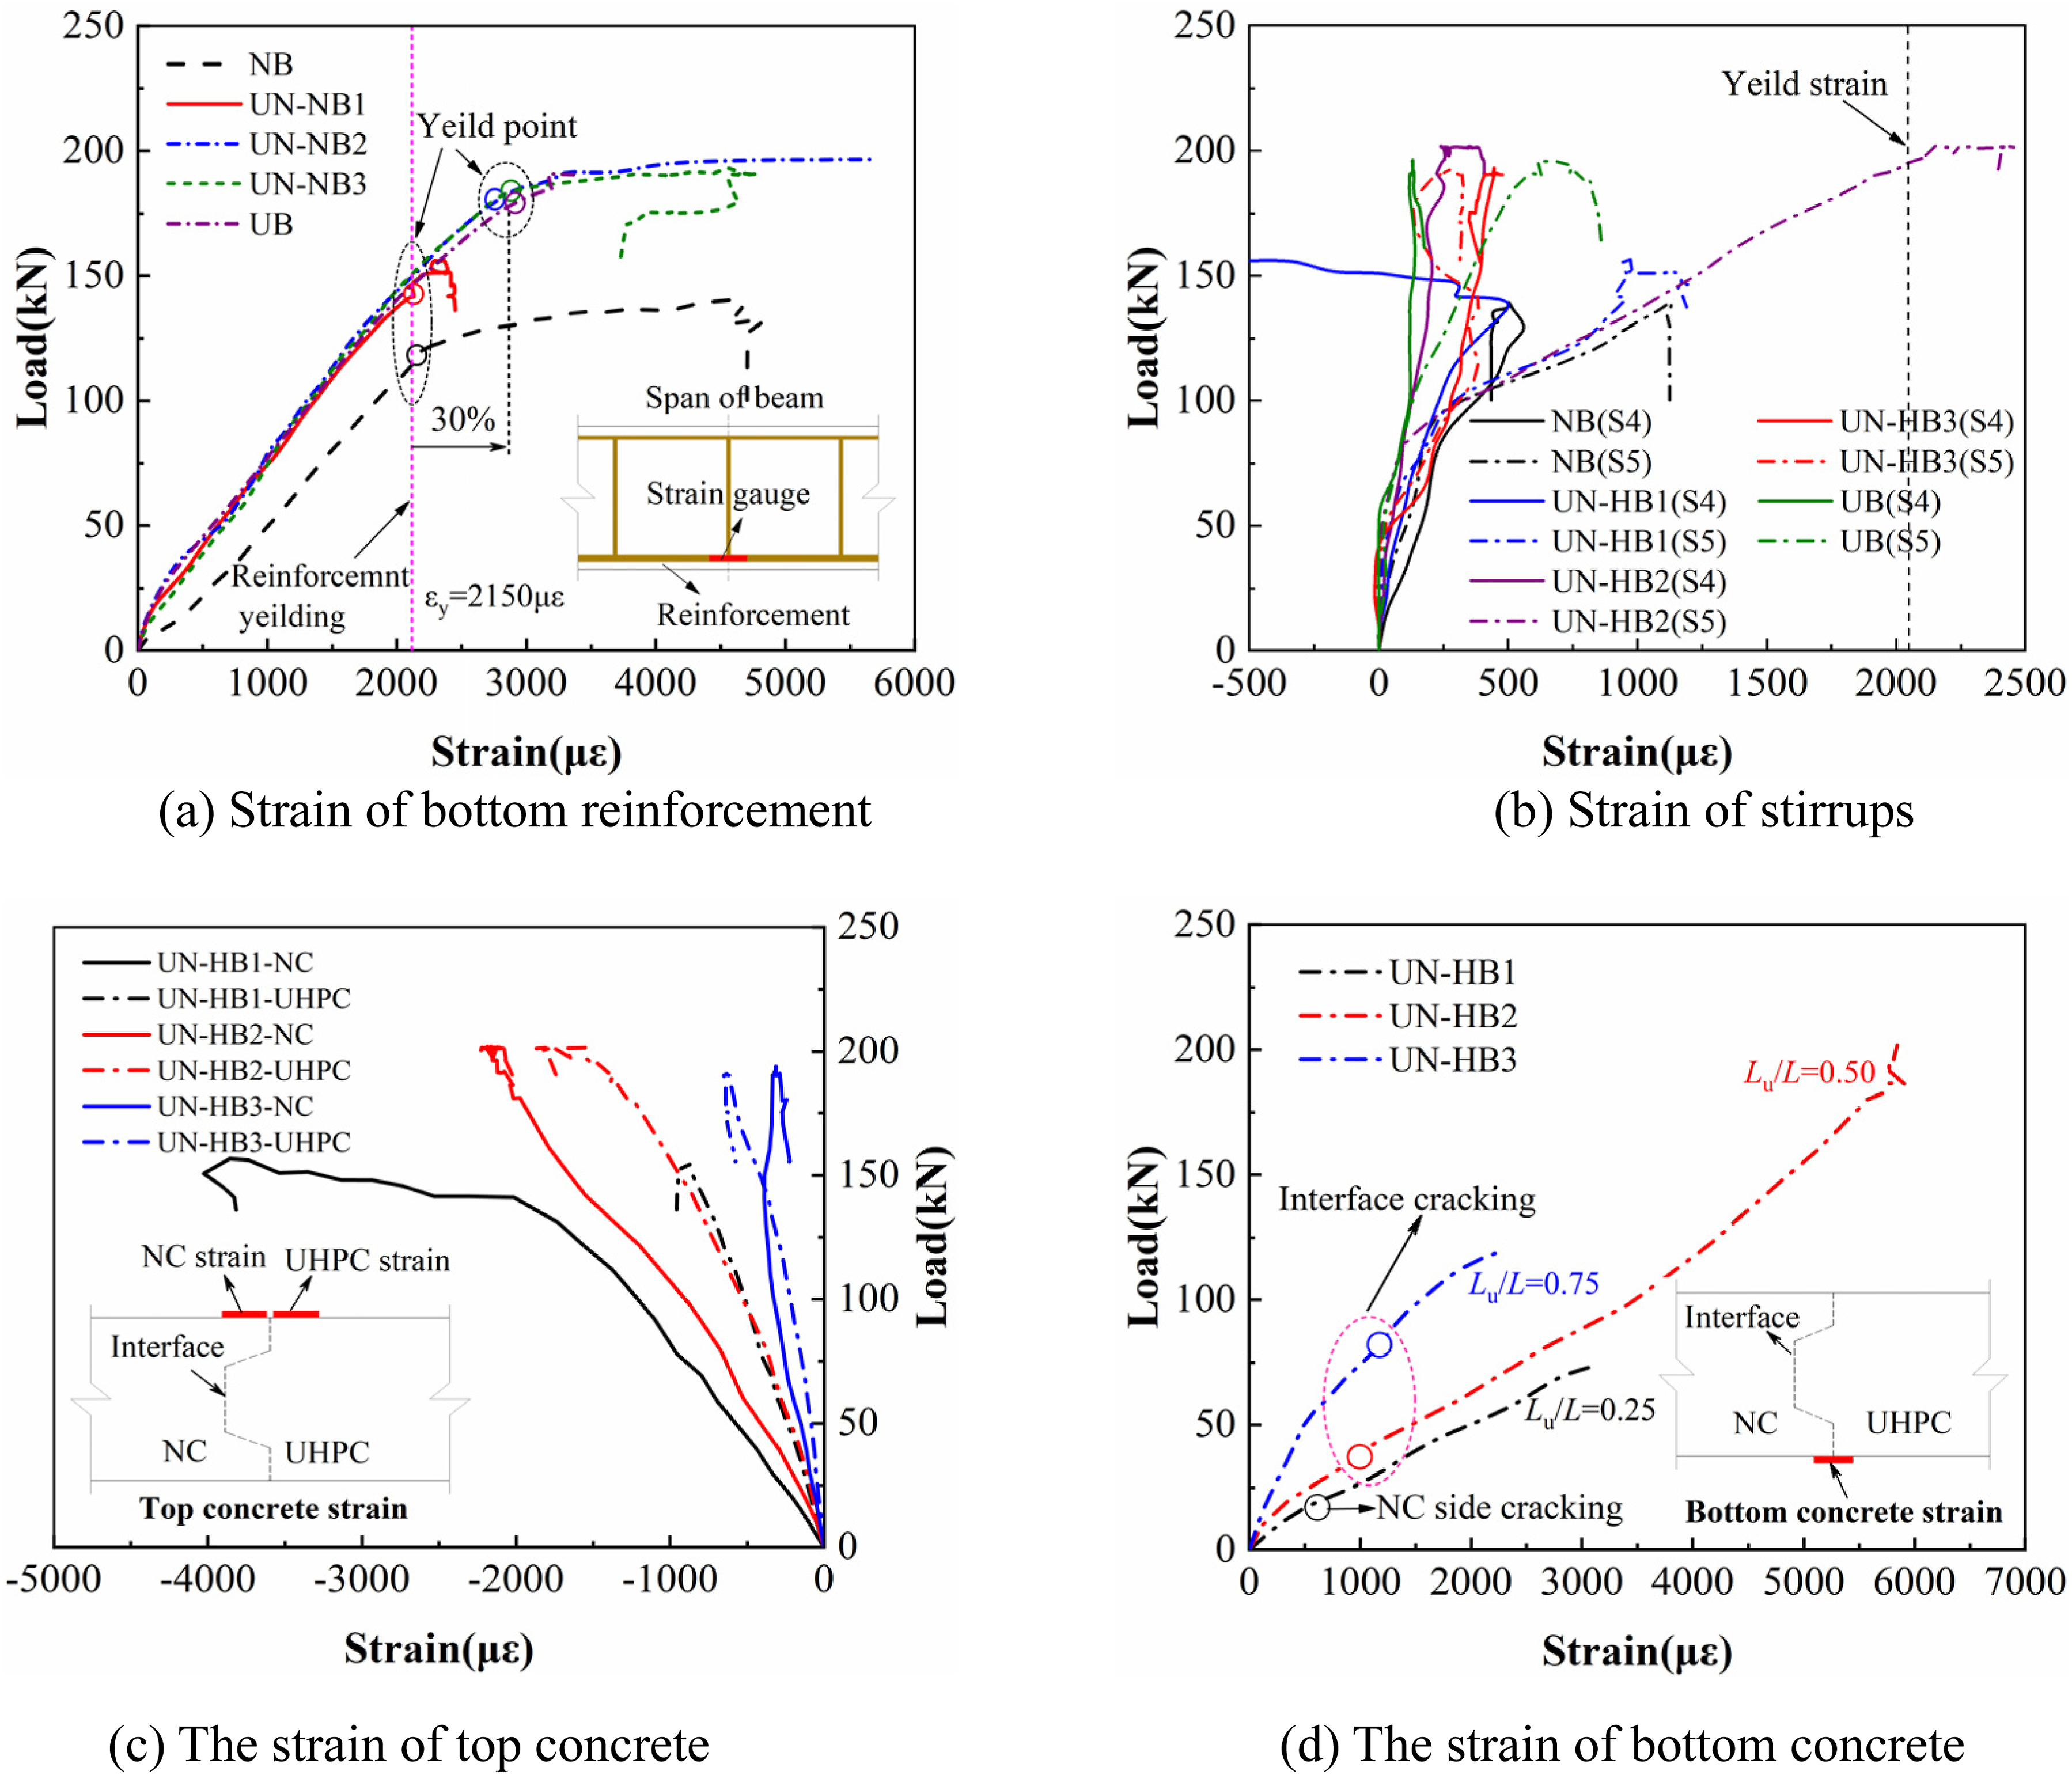
The load-strain curves of stirrups S4 and S5 (see Figure 3(a)) for each test beam are shown in Figure 9(b). During the entire flexural process, the stirrups did not reach the yield strain, and the strain of stirrup S4 (located in UHPC) was significantly smaller than that of stirrup S5 (located in NC). The stirrup strain of the composite beams decreased with increasing Lu/L. Due to the high mid-span stiffness of the composite beam UN-HB1 (Lu/L = 0.25), the UHPC section of the specimen exhibited overall downward displacement as a whole under load (Figure 9(b)), which causing stirrup to experience compressive stress.
Figure 9(c) shows the concrete strain at the top of the UHPC-NC interface. The strain of the concrete on both sides of the interface increased approximately linearly with the increase of load. The strain difference between NC and UHPC decreased with increasing Lu/L at the same load level. This indicates that Lu/L affects the deformation compatibility at the top of the interface. The deformation mismatch phenomenon of composite beams was also observed in flexural tests. The strain of concrete at the bottom of the interface is shown in Figure 9(d). The cracking load at the UHPC-NC interface and the bottom concrete strain of the composite beams increased with the increase of Lu/L. Because the UHPC segments of the composite beam UN-HB1 are all within the mid-span pure flexural section, where the cracks are transferred from the UHPC to the NC side under loading, and the crack load was comparable to that of beam NB.
Deformation performance
Deflection analysis
The mid-span deflection of each test beam is shown in Figure 10. The deflection distributions of composite beams in the yield stage and ultimate stage are exhibited similar trends, and the deflection curve is basically consistent with the curve of half-sine wave. The composite beam UN-HB1 has a sudden deflection change of the beam due to the short length of the UHPC. As a result, the whole section of UHPC moves down and UHPC without deformation. Prior to the yield load, the deflections of the test beams were small, with a maximum mid-span deflection of about 8 mm. As the load increases from yield load to ultimate load, the cracks of the beam expand further, which resulting in a weakening of the stiffness, and the mid-span deflection increases sharply. Deflection analysis of composite beams.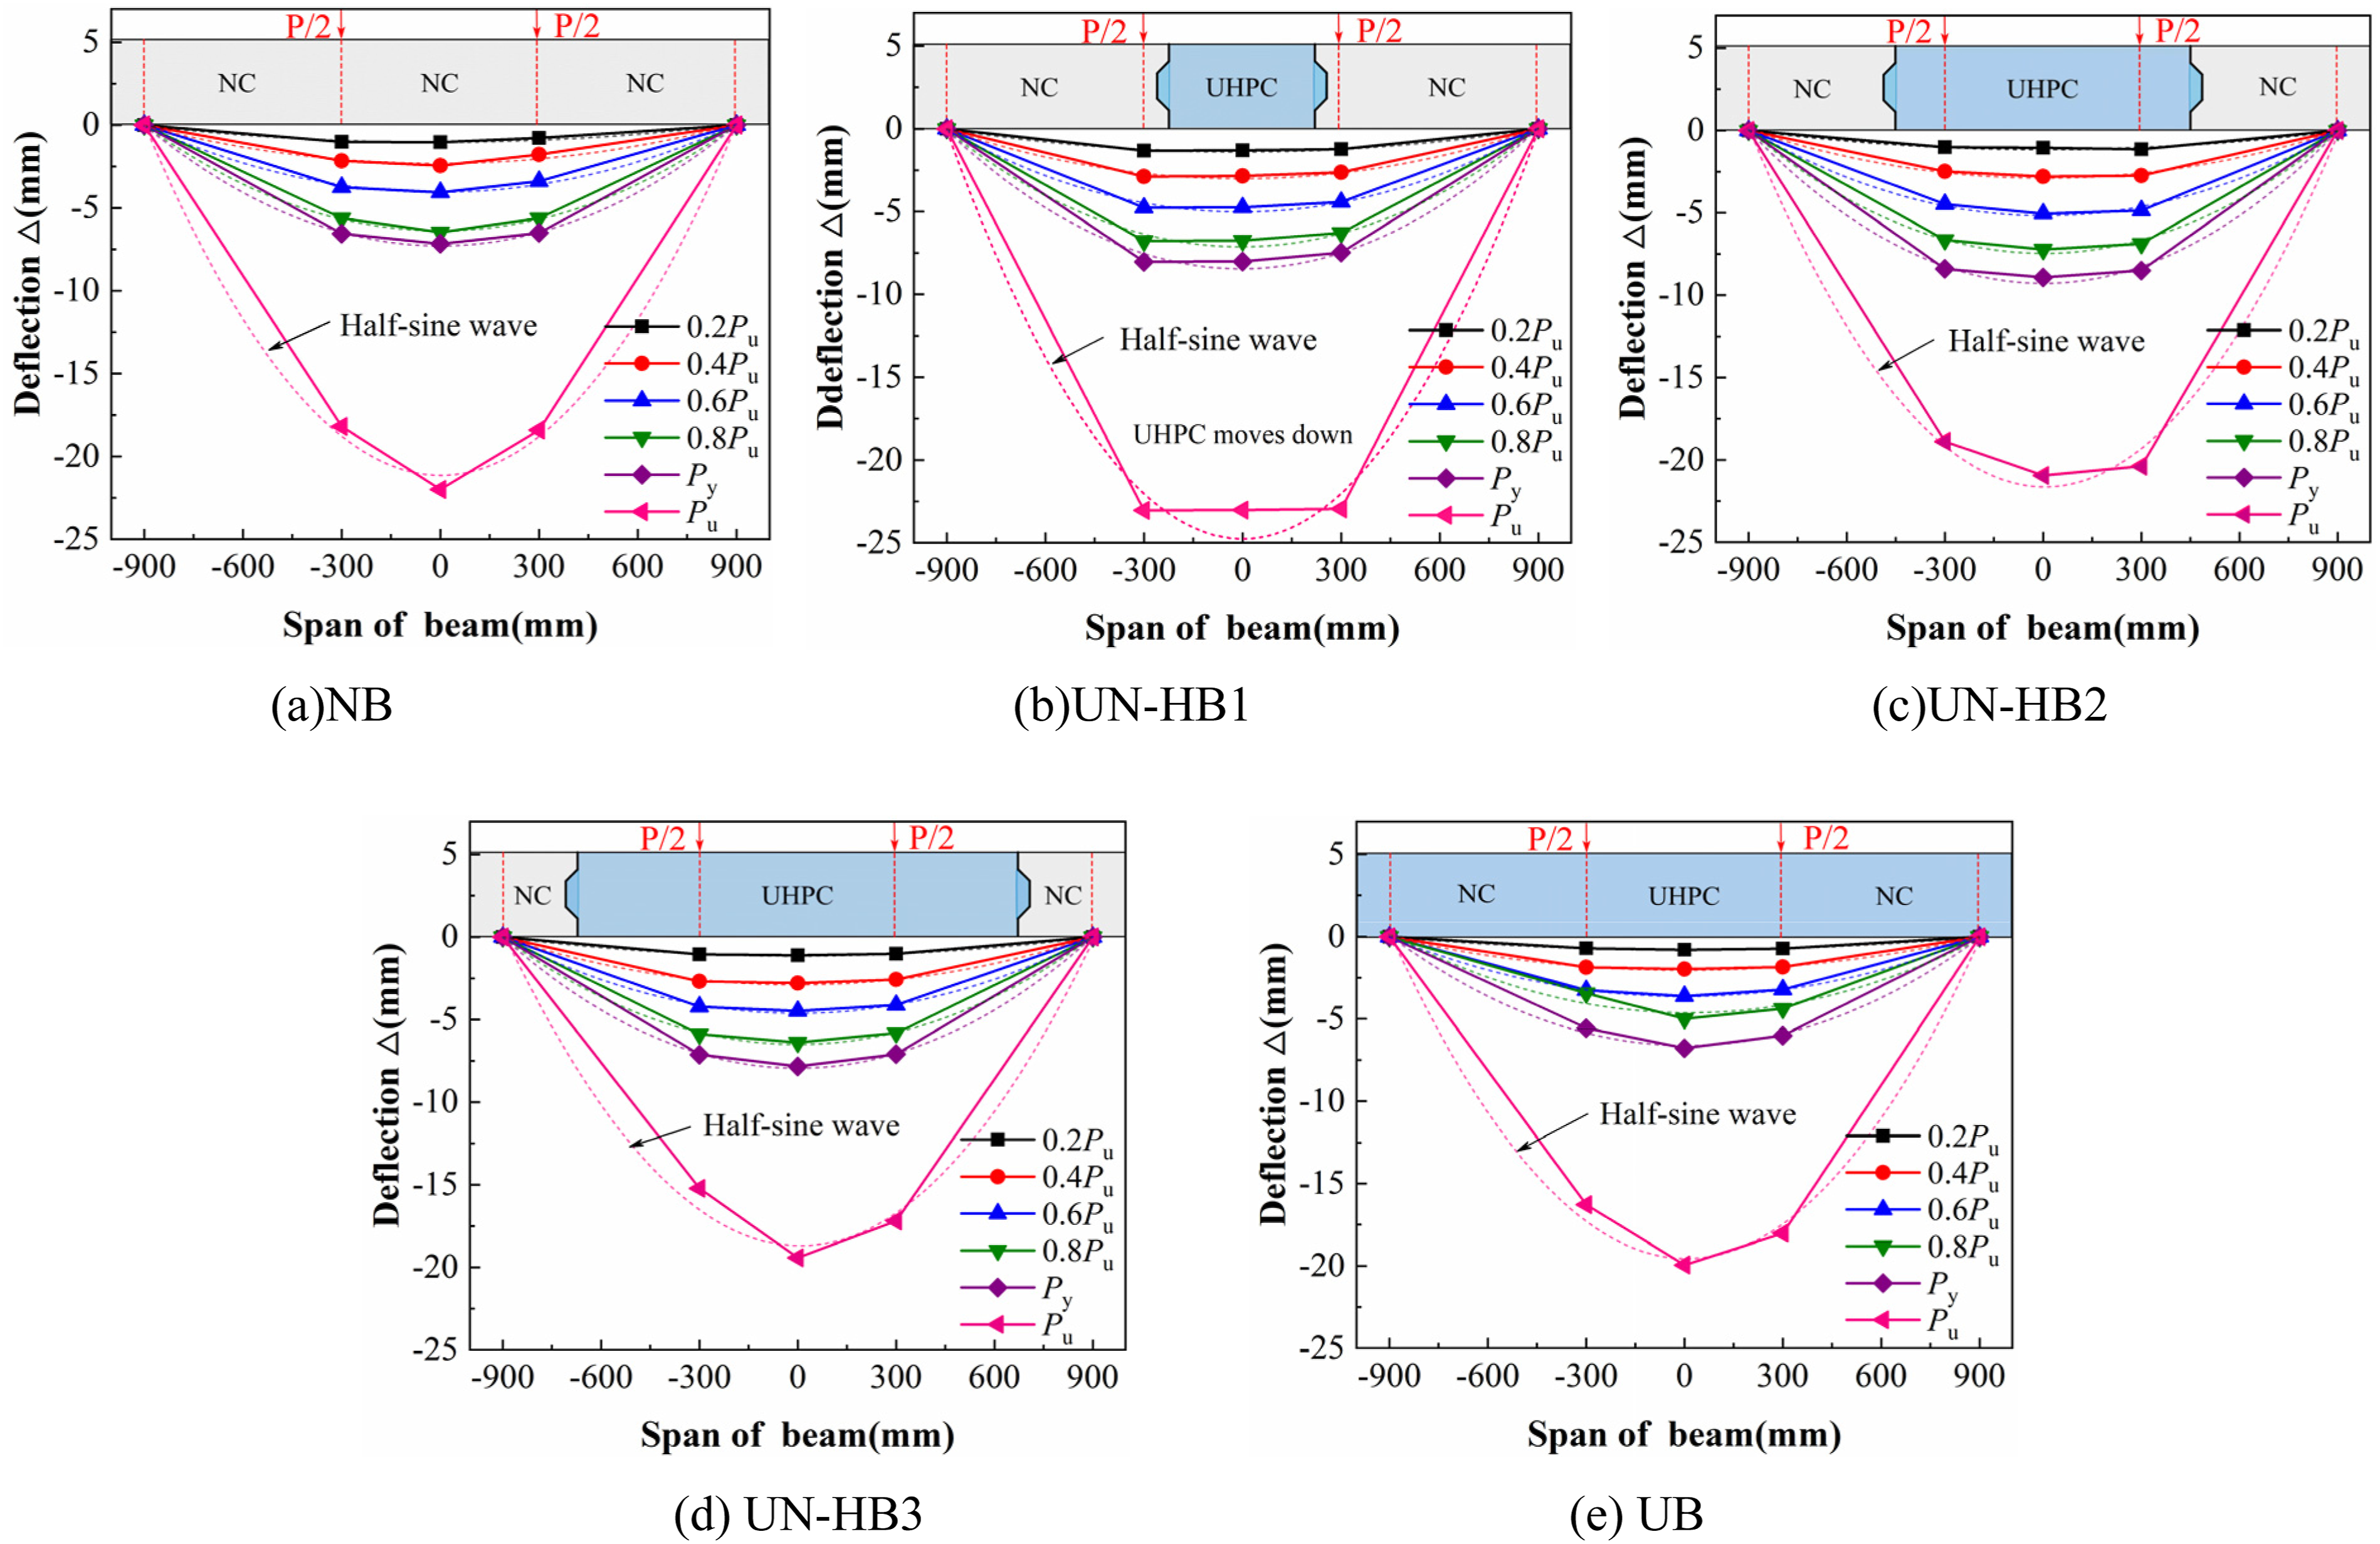
Ductility and plasticization coefficient
The ductility coefficient is usually used to reflect structure plastic deformation ability, and the plasticizing coefficient reflects the degree of plastic development of the structure (ANSI/AISC 360-16, 2016). The ductility and plasticization coefficient of the structure are calculated according to equation (1), where the yield load and yield displacement are determined based on the farthest point method (Feng et al., 2017) (Figure 11(a)). Changes of ductility parameters.
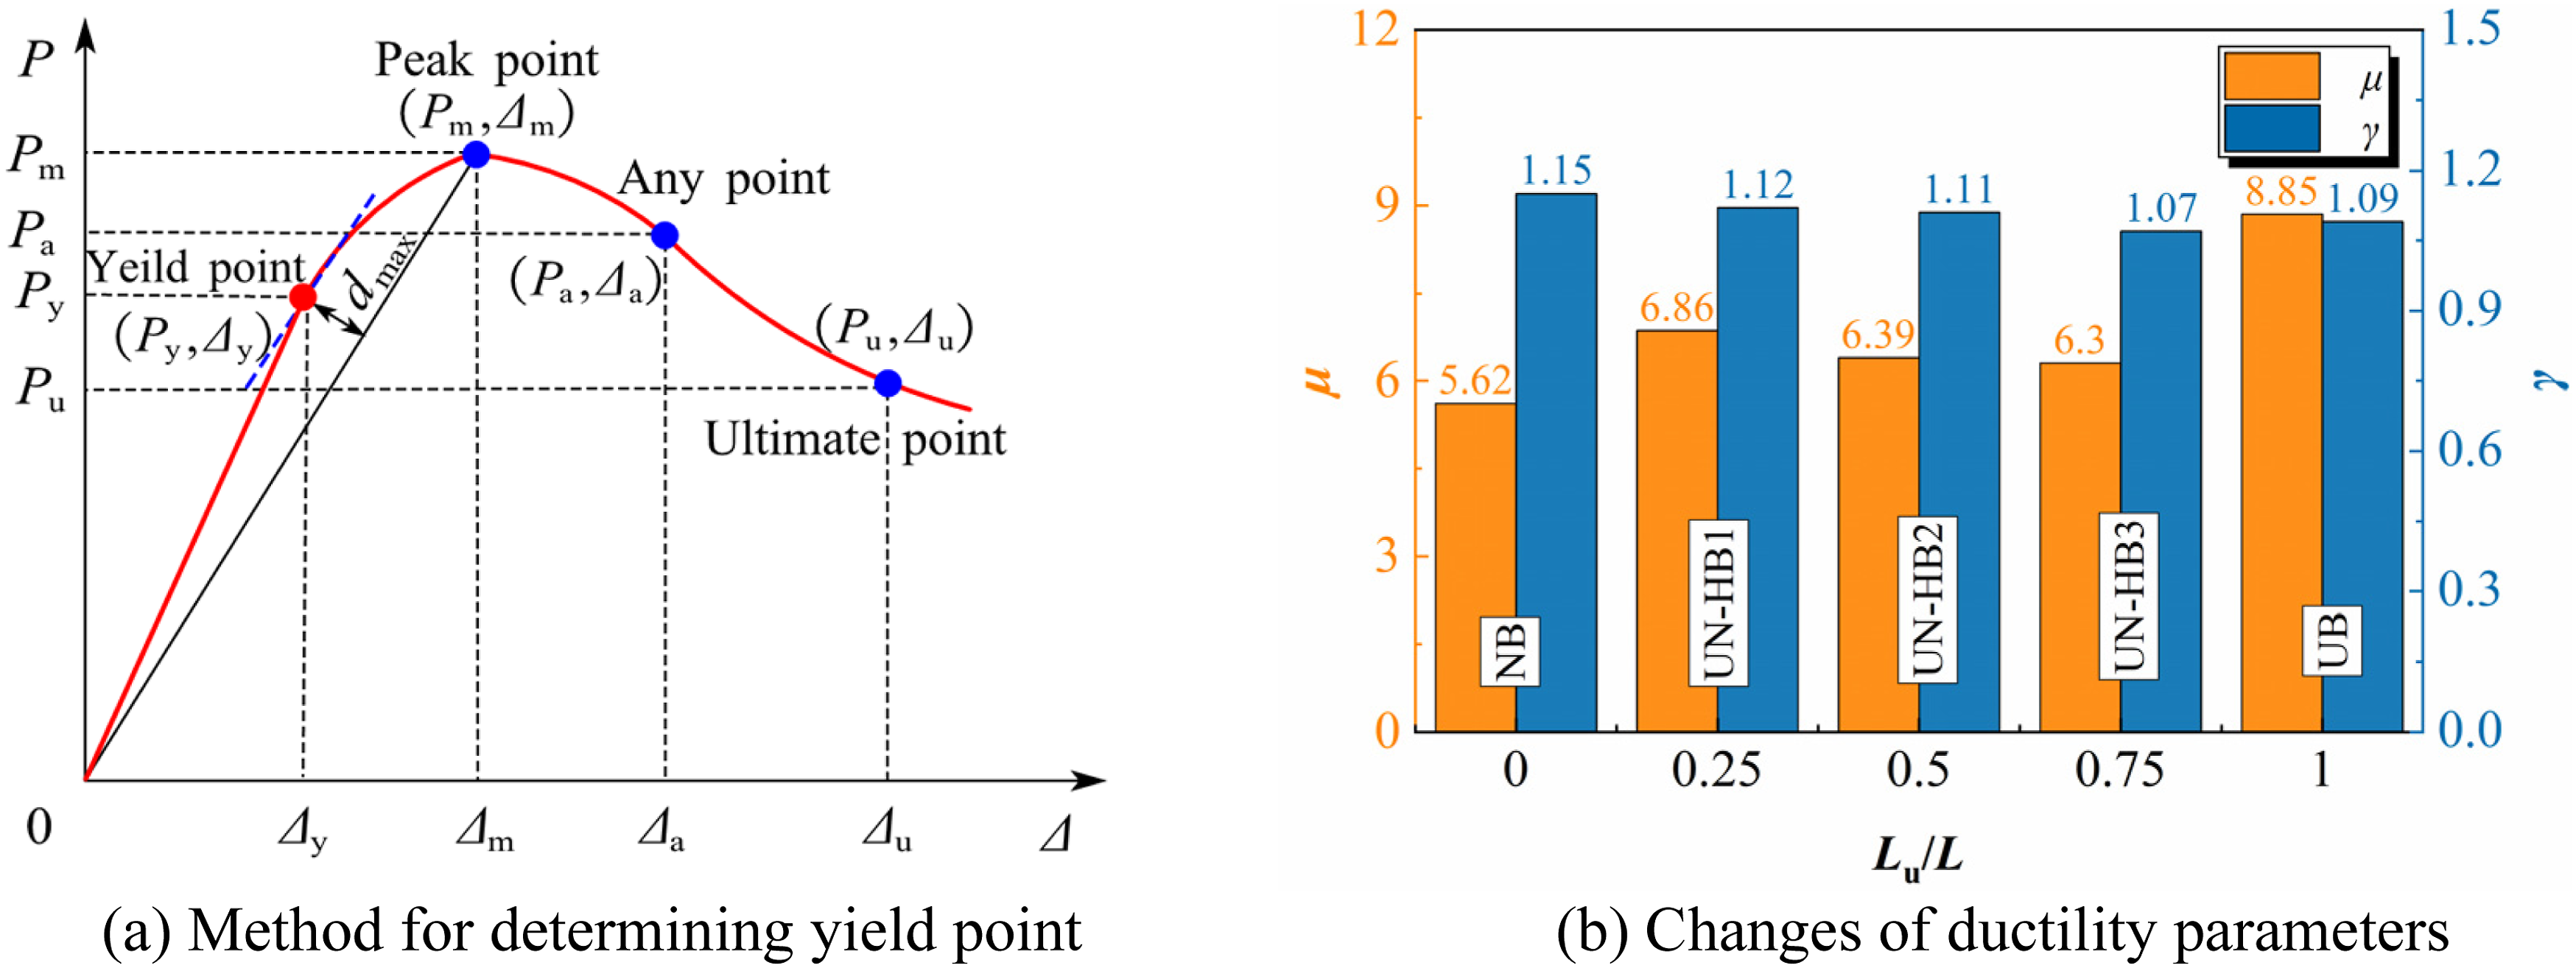
As shown in Figure 11(b) that the ductility of composite beams is higher than that of normal concrete beam (NB beam), which indicates that using UHPC instead of NC at the maximum moment section of the beams can effectively improve beam ductility. The ductility of composite beams can be increased by at least 12% over the ductility of NB beam. Specifically, with the UHPC ratio increasing from 0 to 0.25, 0.5 and 0.75, the displacement ductility increased by 22.1%, 13.7% and 12.1%, respectively. The effect of Lu/L on the plasticity coefficient of each test beam was not significant. However, it can be further concluded that the plasticization coefficient of the composite beam shows a decreasing trend with increasing Lu/L. The main reason is that the yield load of the composite beams is close to the peak load and t resulting in a relatively limited elastic-plastic deformation stage.
Stiffness analysis
In order to investigate the effect of UHPC on the stiffness of the composite beams, the UHPC-NC composite beams are analyzed as the same overall section along the span direction. The service load is generally 0.5-0.7Pu. In this paper, the flexural moments corresponding to 0.5Pu, 0.6Pu and 0.7Pu are selected as the values of flexural moments in the service stage. The stiffness 
The overall stiffness of each test beam is shown in Figure 12(a). It is evident that replacing part of NC with UHPC can significantly improve the stiffness of composite beams. The stiffness of composite beams increased with increasing Lu/L. When the section load of composite beams is 0.6Mu, as Lu/L increased from 0 to 0.25, 0.5, 0.75, and 1, the stiffness of the composite increased by 7.8%, 31.7%, 34.2% and 58.3%, respectively. Specifically, the stiffness of composite beams UN-HB2 and UN-HB3 exhibited similar stiffness values, which can reach 85% of the stiffness of full UHPC beam (UB). Meanwhile, the incorporation of UHPC effectively delayed damage development in the composite beams (Figure 12(b)). The test beam experienced negligible damage before yielding load (D = 0.035), and it can be considered that the composite beams remained essentially undamaged before reaching yield load. The slope of the curve increases sharply past the yield point and the damage of the composite beam increases. This indicates that the composite beams began to exhibit damage after reaching the yield load. At the same time, the composite beams with a larger proportion of UHPC exhibited a slower rate of damage accumulation. Figure 8(a) shows the same pattern that the overall stiffness of the test beams had no change before the yield load. Stiffness analysis of composite beams.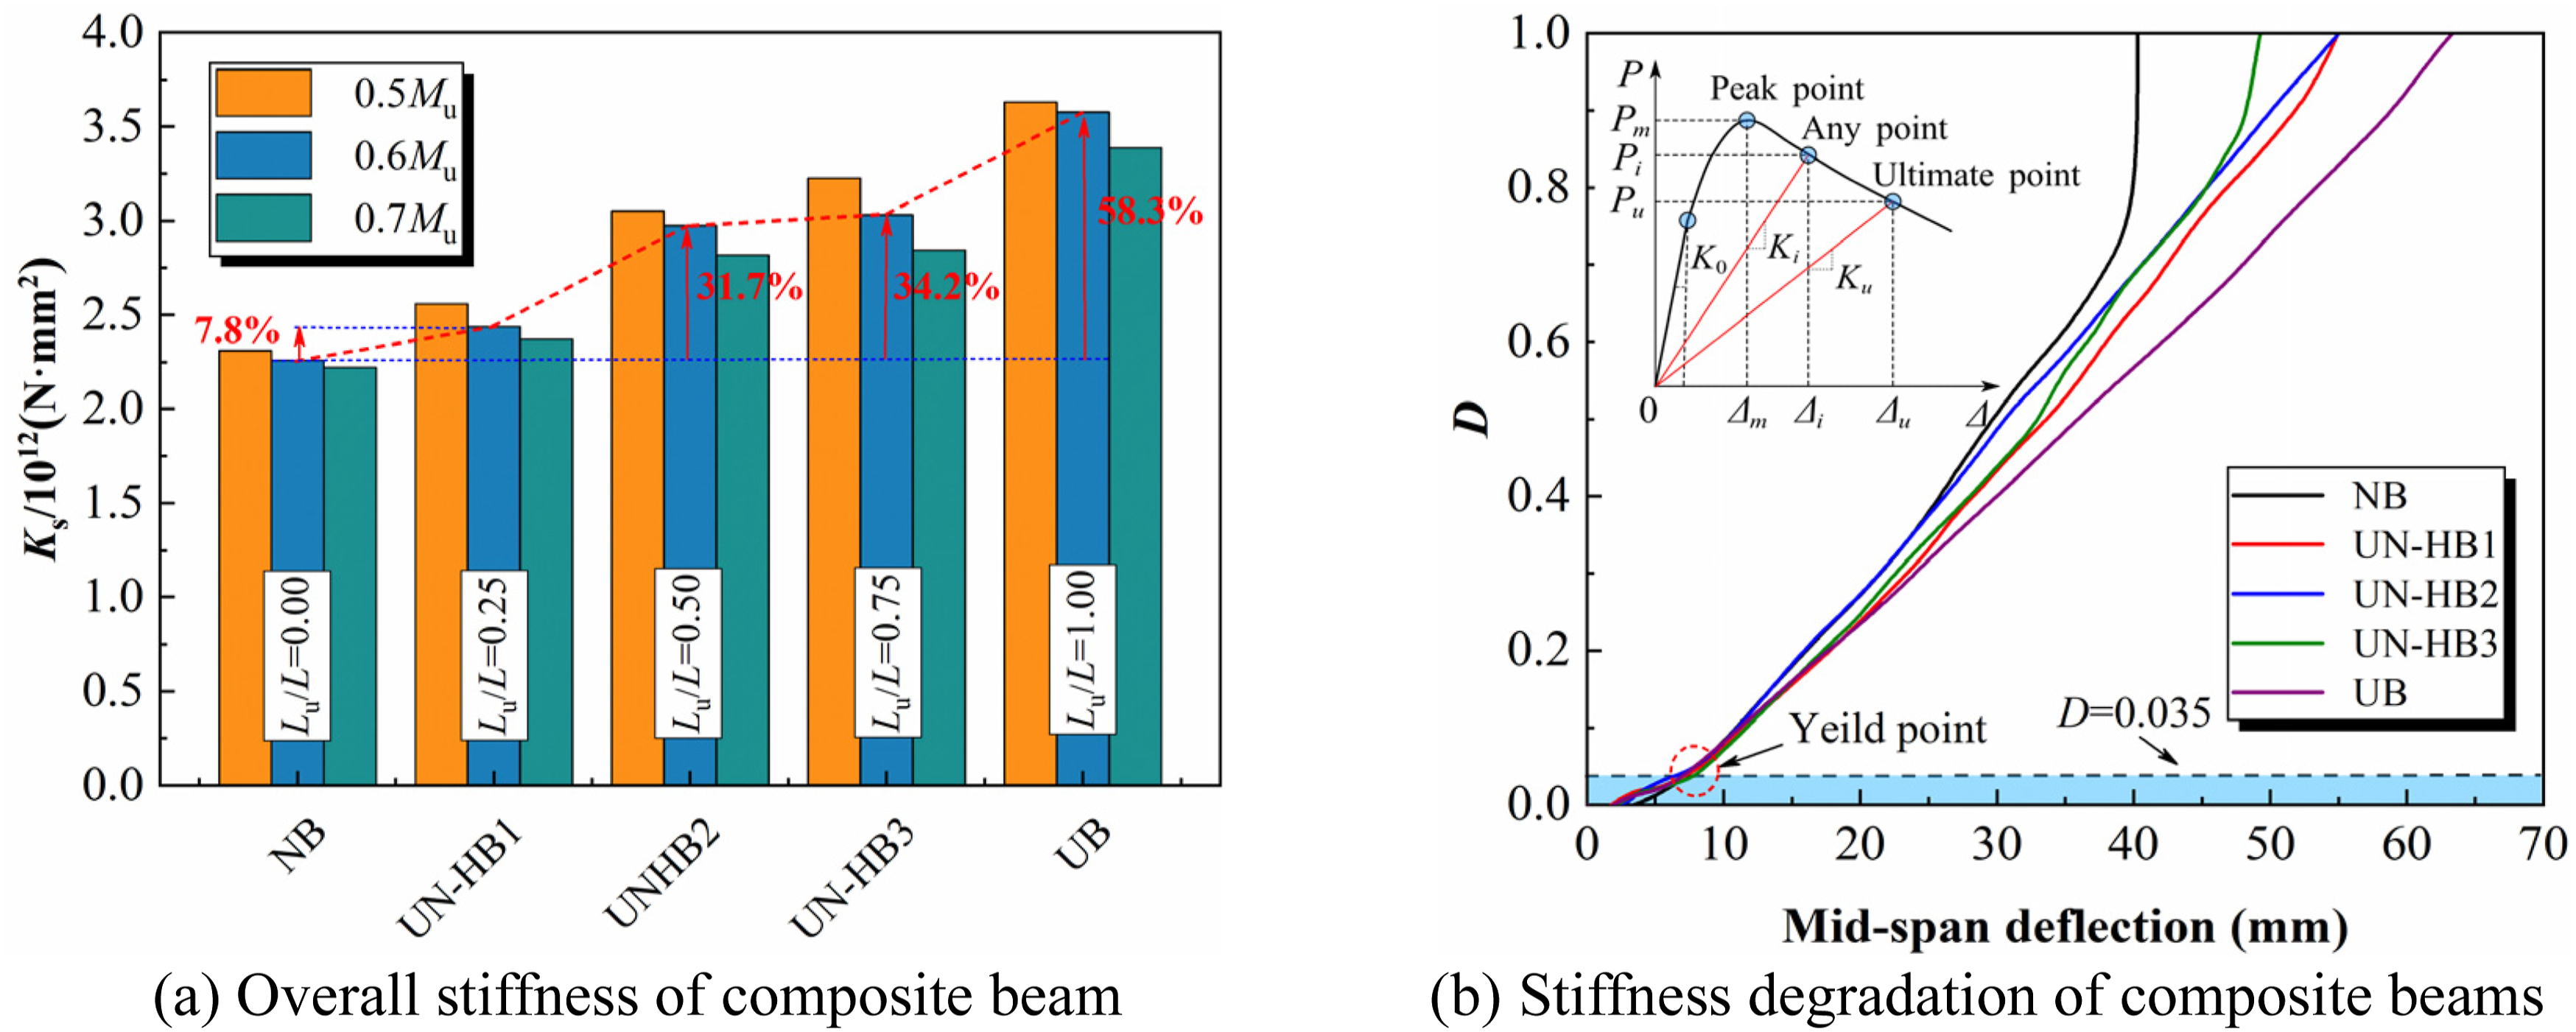
Design recommendations for Lu/L
Previous studies have shown that when the Lu/L value is relatively small, UHPC mainly plays a connecting role, and its contribution to the flexural resistance of composite beams is not significant. The effect is similar to that of UHPC wet connection beams. However, an excessively high Lu/L value leads to a decline in economic efficiency. Due to the limited number of test specimens and variability in the experimental results, further verification is still required. Therefore, in order to obtain reasonable Lu/L values to guide the design and analysis of UHPC-NC composite beams, expanded parameter analysis was carried out based on ABAQUS finite element software to investigate the load, ductility and other flexural properties of UHPC-NC composite beams under different Lu/L.
Finite element model
Material constitutive model
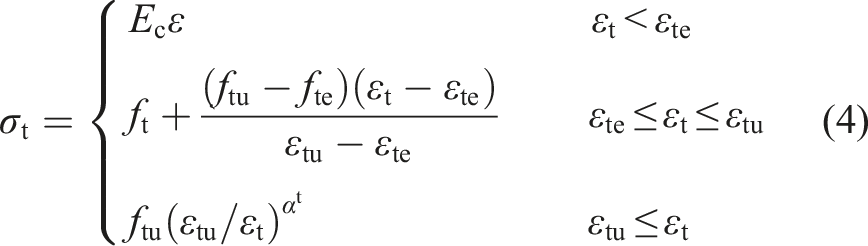
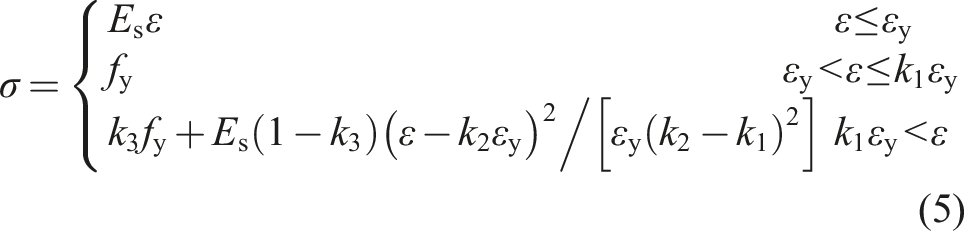
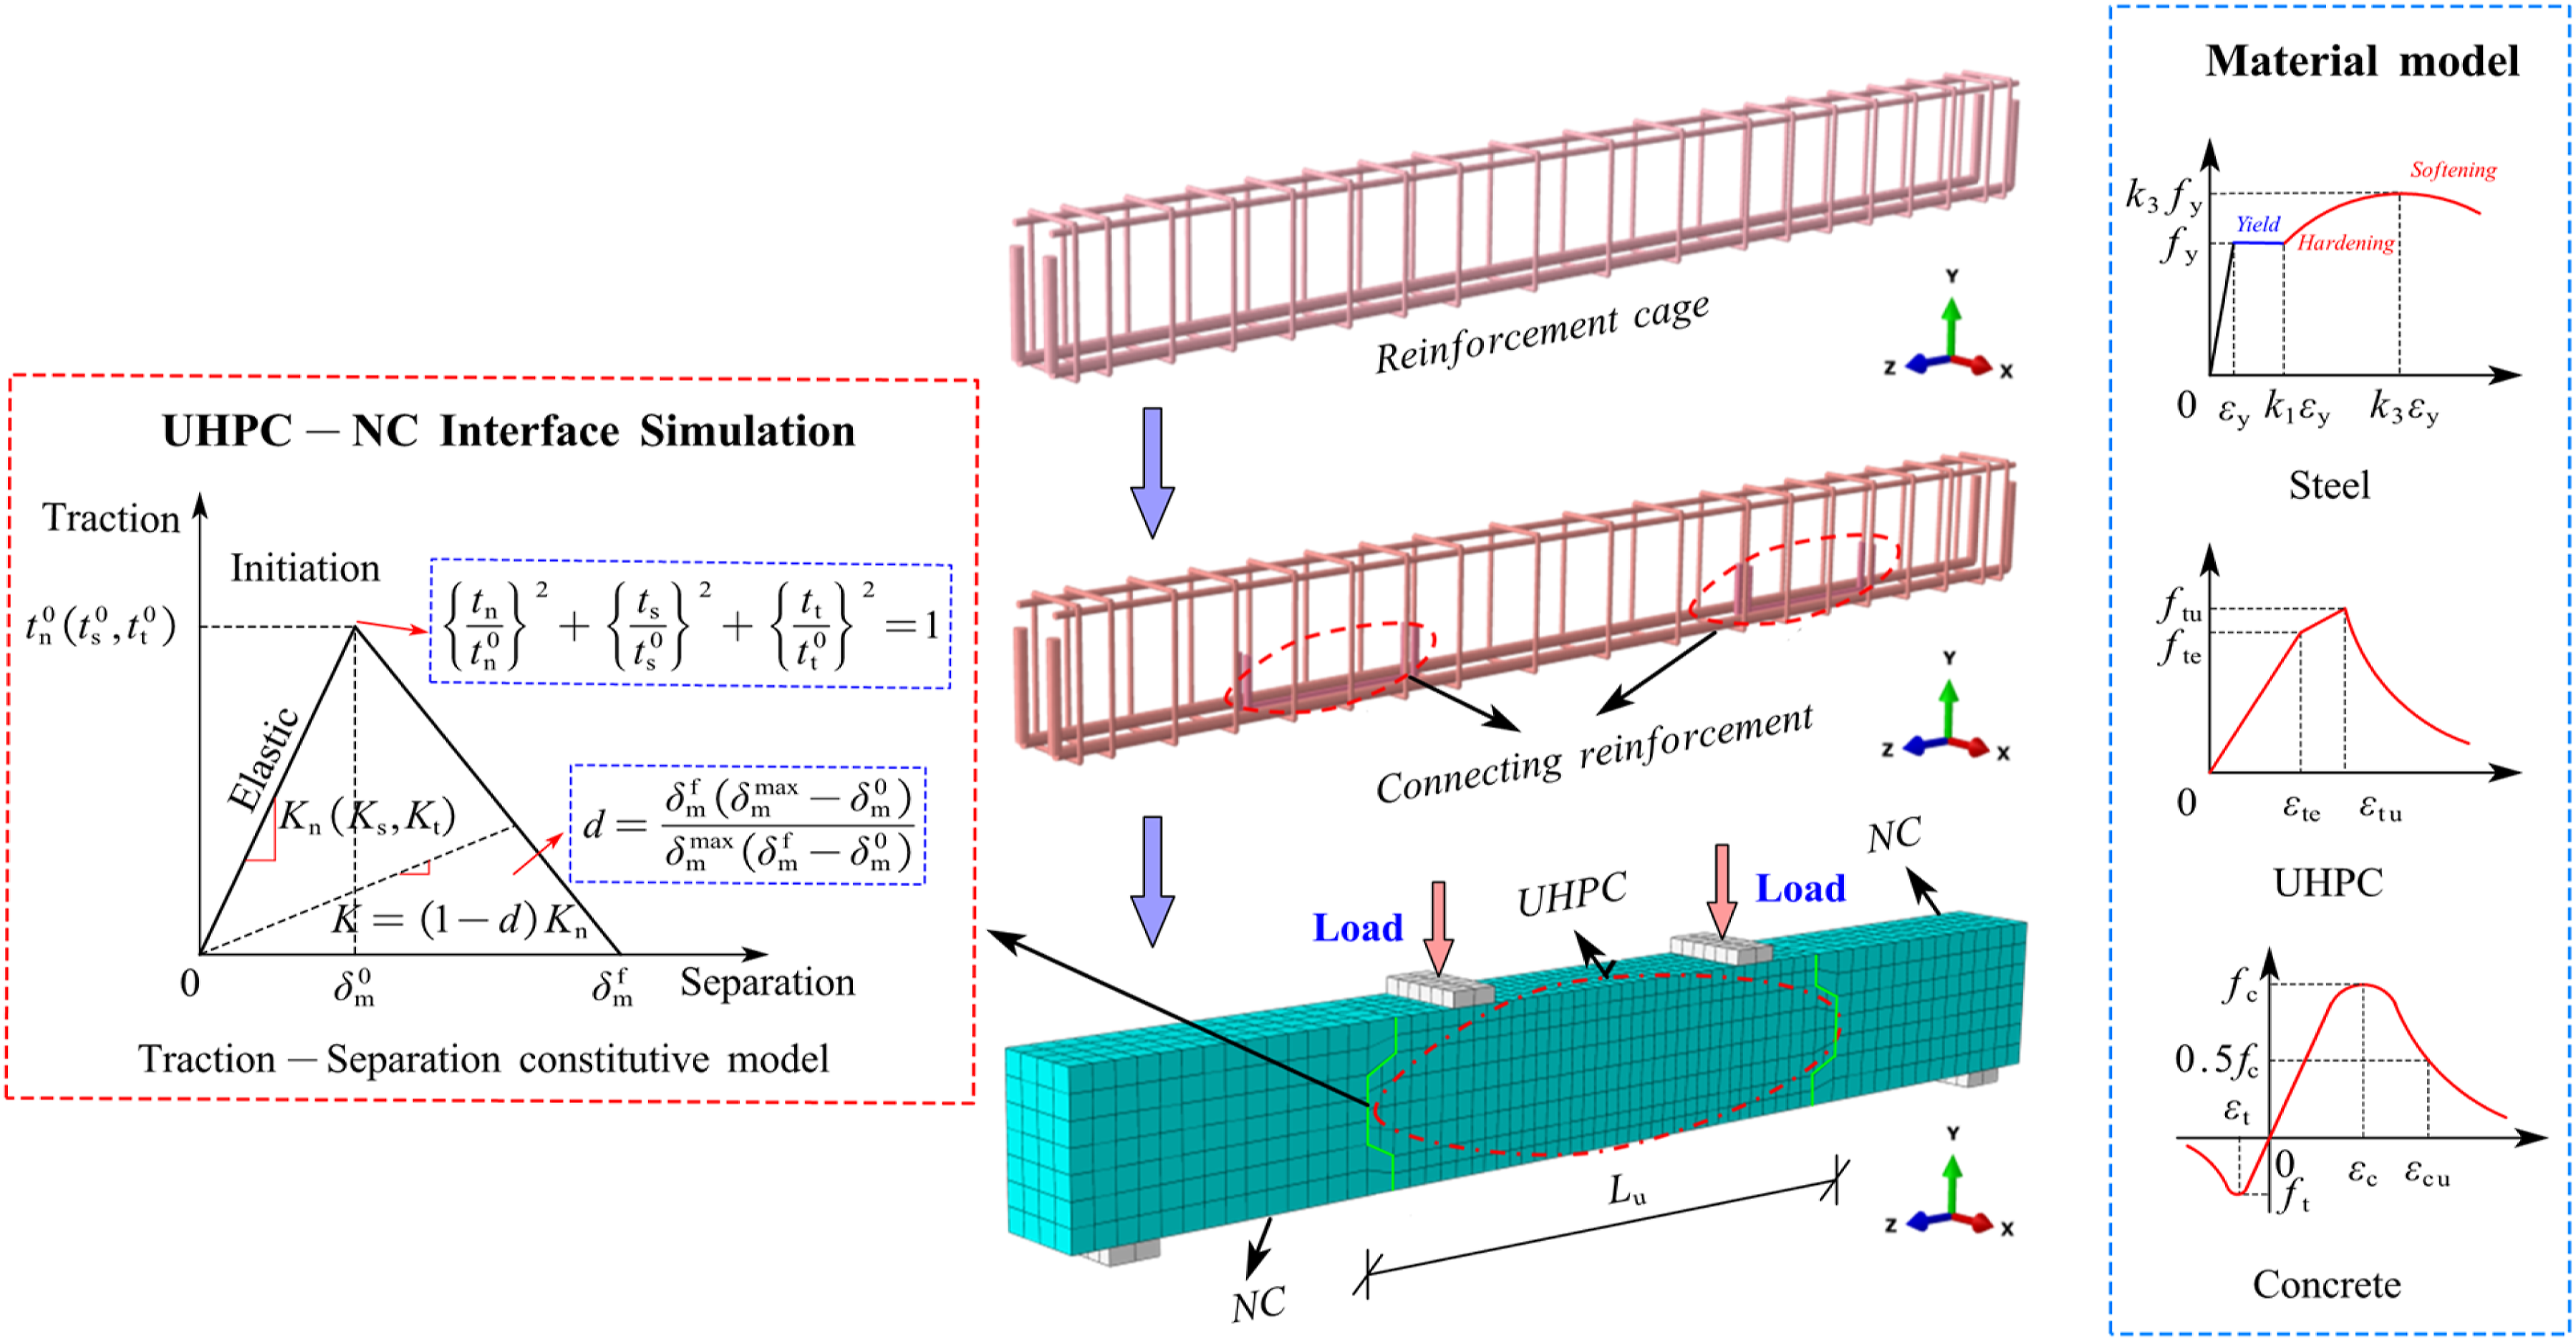
C3D8R elements were used for concrete and steel bearing blocks, and T3D2 elements are used for reinforcement. The constitutive model for NC was defined according to the Code for the Design of Concrete Structures. The compressive constitutive behavior of UHPC was characterized using the model relationship proposed by equation (3). The tensile constitutive model of UHPC considers the tensile hardening of UHPC (see Figure 13), and the stress-strain relationship is shown in equation (4). Considering the strain-hardening characteristics of the reinforcement after yielding, the stress-strain relationship is presented in equation (5). The model of three-dimensional finite element.
Interface contact methods and boundary conditions
In this paper, the bilinear traction-separation law shown in Figure 13 is adopted to simulate the interfacial bonding behavior (Wang et al., 2026). The interfacial bonding behavior before and after cracking is described linearly. Before the stress reaches
Finite element model verification
Figure 6 shows that (1) NC and UHPC beams have a typical flexural failure mode, and the concrete in the compression zone was crushed. An extensive crushing occurred in the compression zone of NC beams, while the UHPC beams showed local concrete crushing. The main reason is the high compressive strength of UHPC. The crushing of concrete in the compression zone required the specimen to bear a large stress, and this high stress caused the mid-span cracks to expand rapidly. Due to the bridging effect of steel fibers, the cracks eventually extend upward under the action of load to form a flexural failure form of localized crushing in the compression zone. (2) The composite beam UN-HB1 suffered a bending-shear failure. The failure location was in the NC section outside the connecting reinforcement, where the longitudinal rebar yielded, and the concrete in the compression zone near the loading point was crushed. (3) UN-HB2 and UN-HB3 failed in flexure caused by local concrete crushing in mid-span. Unlike UHPC beams, oblique cracks are formed on the outside of the interface extending along the apex of the composite interface. Figure 14 shows that the load-deflection curve calculated by the finite element is basically consistent with the test. Because the finite element ignores the internal defects of the actual specimen, the stiffness of the finite element model is greater than the test. The development trend of the load mid-span deflection curve of the specimen is in good agreement with the test results. Comparison of load-mid-span deflection curves.
Flexural behavior of UHPC-NC composite beams with different Lu/L
The UHPC-NC composite beams with Lu/L = 0-1 were simulated and analyzed by ABAQUS, and the stiffness reduction rate (SDEG) nephograms of each specimen were obtained as shown in Figure 15. Composite beams with Lu/L < 0.5 exhibited flexural-shear failure. Due to the high strength of UHPC, the failure location shifted to the flexural shear section. Only the tensile zone of the UHPC exhibited a significant decrease in stiffness, indicating that when the Lu/L is relatively small, the UHPC in the composite beam cannot fully utilize its superior mechanical properties. When Lu/L ≥ 0.5, the composite beam exhibited flexural failure. The nephogram shows that the stiffness of the concrete in the compression and tension regions of UHPC in the mid-span decreases significantly. UHPC was able to effectively utilize its superior mechanical performance, and the rigidity of the concrete at the composite interface decreases with the increase of Lu/L. Cloud bap of stiffness reduction rate (SDEG) of UHPC-NC composite beam.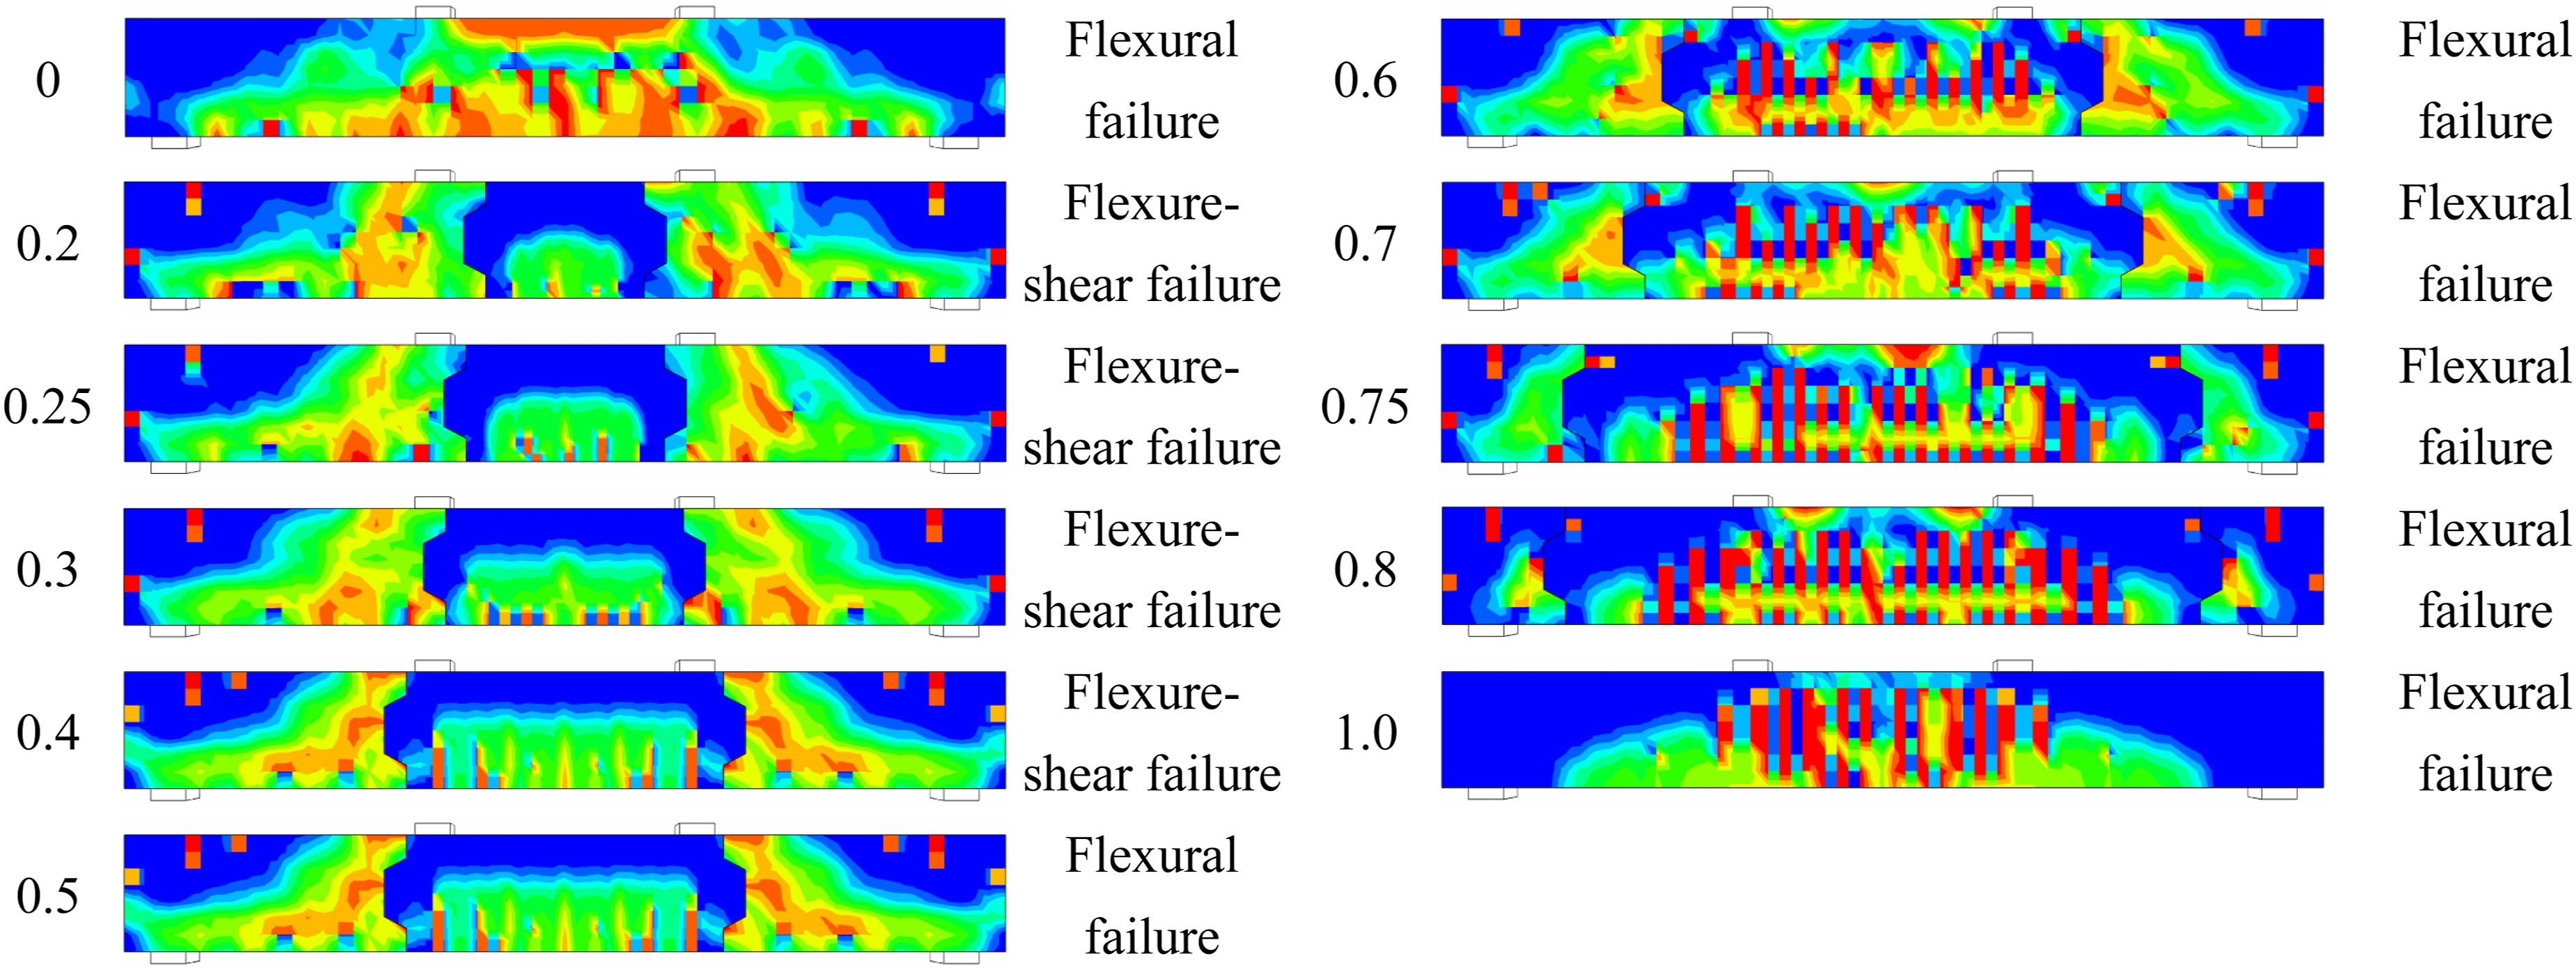
Design recommendations value for Lu/L
The above studies show that Lu/L has a significant effect on the flexural performance of UHPC-NC composite beams. UHPC-NC composite beams have superior mechanical properties to NC beams and are more cost-effective than UHPC beams. Figure 16 compares the achievement rate (defined as the ratio of a given property of the composite beam to that of the full UHPC beam). When Lu/L < 0.5, the cracking, yield, peak and ultimate loads of composite beams increased with the increase of Lu/L. When Lu/L ≥ 0.5, the achievement rate of the bearing capacity of the composite beams was approximately 1.0, indicating that the bearing capacity of composite beams with Lu/L ≥ 0.5 can reach that of the full UHPC beam. The ductility of the composite beams exhibited a similar trend to that of the load-bearing capacity, but the achievement rate was basically about 0.9. Figure 16 (f) shows that plasticity coefficient of the composite beams slightly decreases with the increase of Lu/L. The plasticization coefficient of each composite beam was comparable to that of the full UHPC beam (UB). This indicates that composite beams with Lu/L ≥ 0.5 can achieve mechanical properties comparable to those of UB. Therefore, it is recommended that a Lu/L ratio of at least 0.5 be adopted in the theoretical calculation and design of UHPC-NC composite beams. Achievement rate of flexural performance of UHPC-NC composite beams.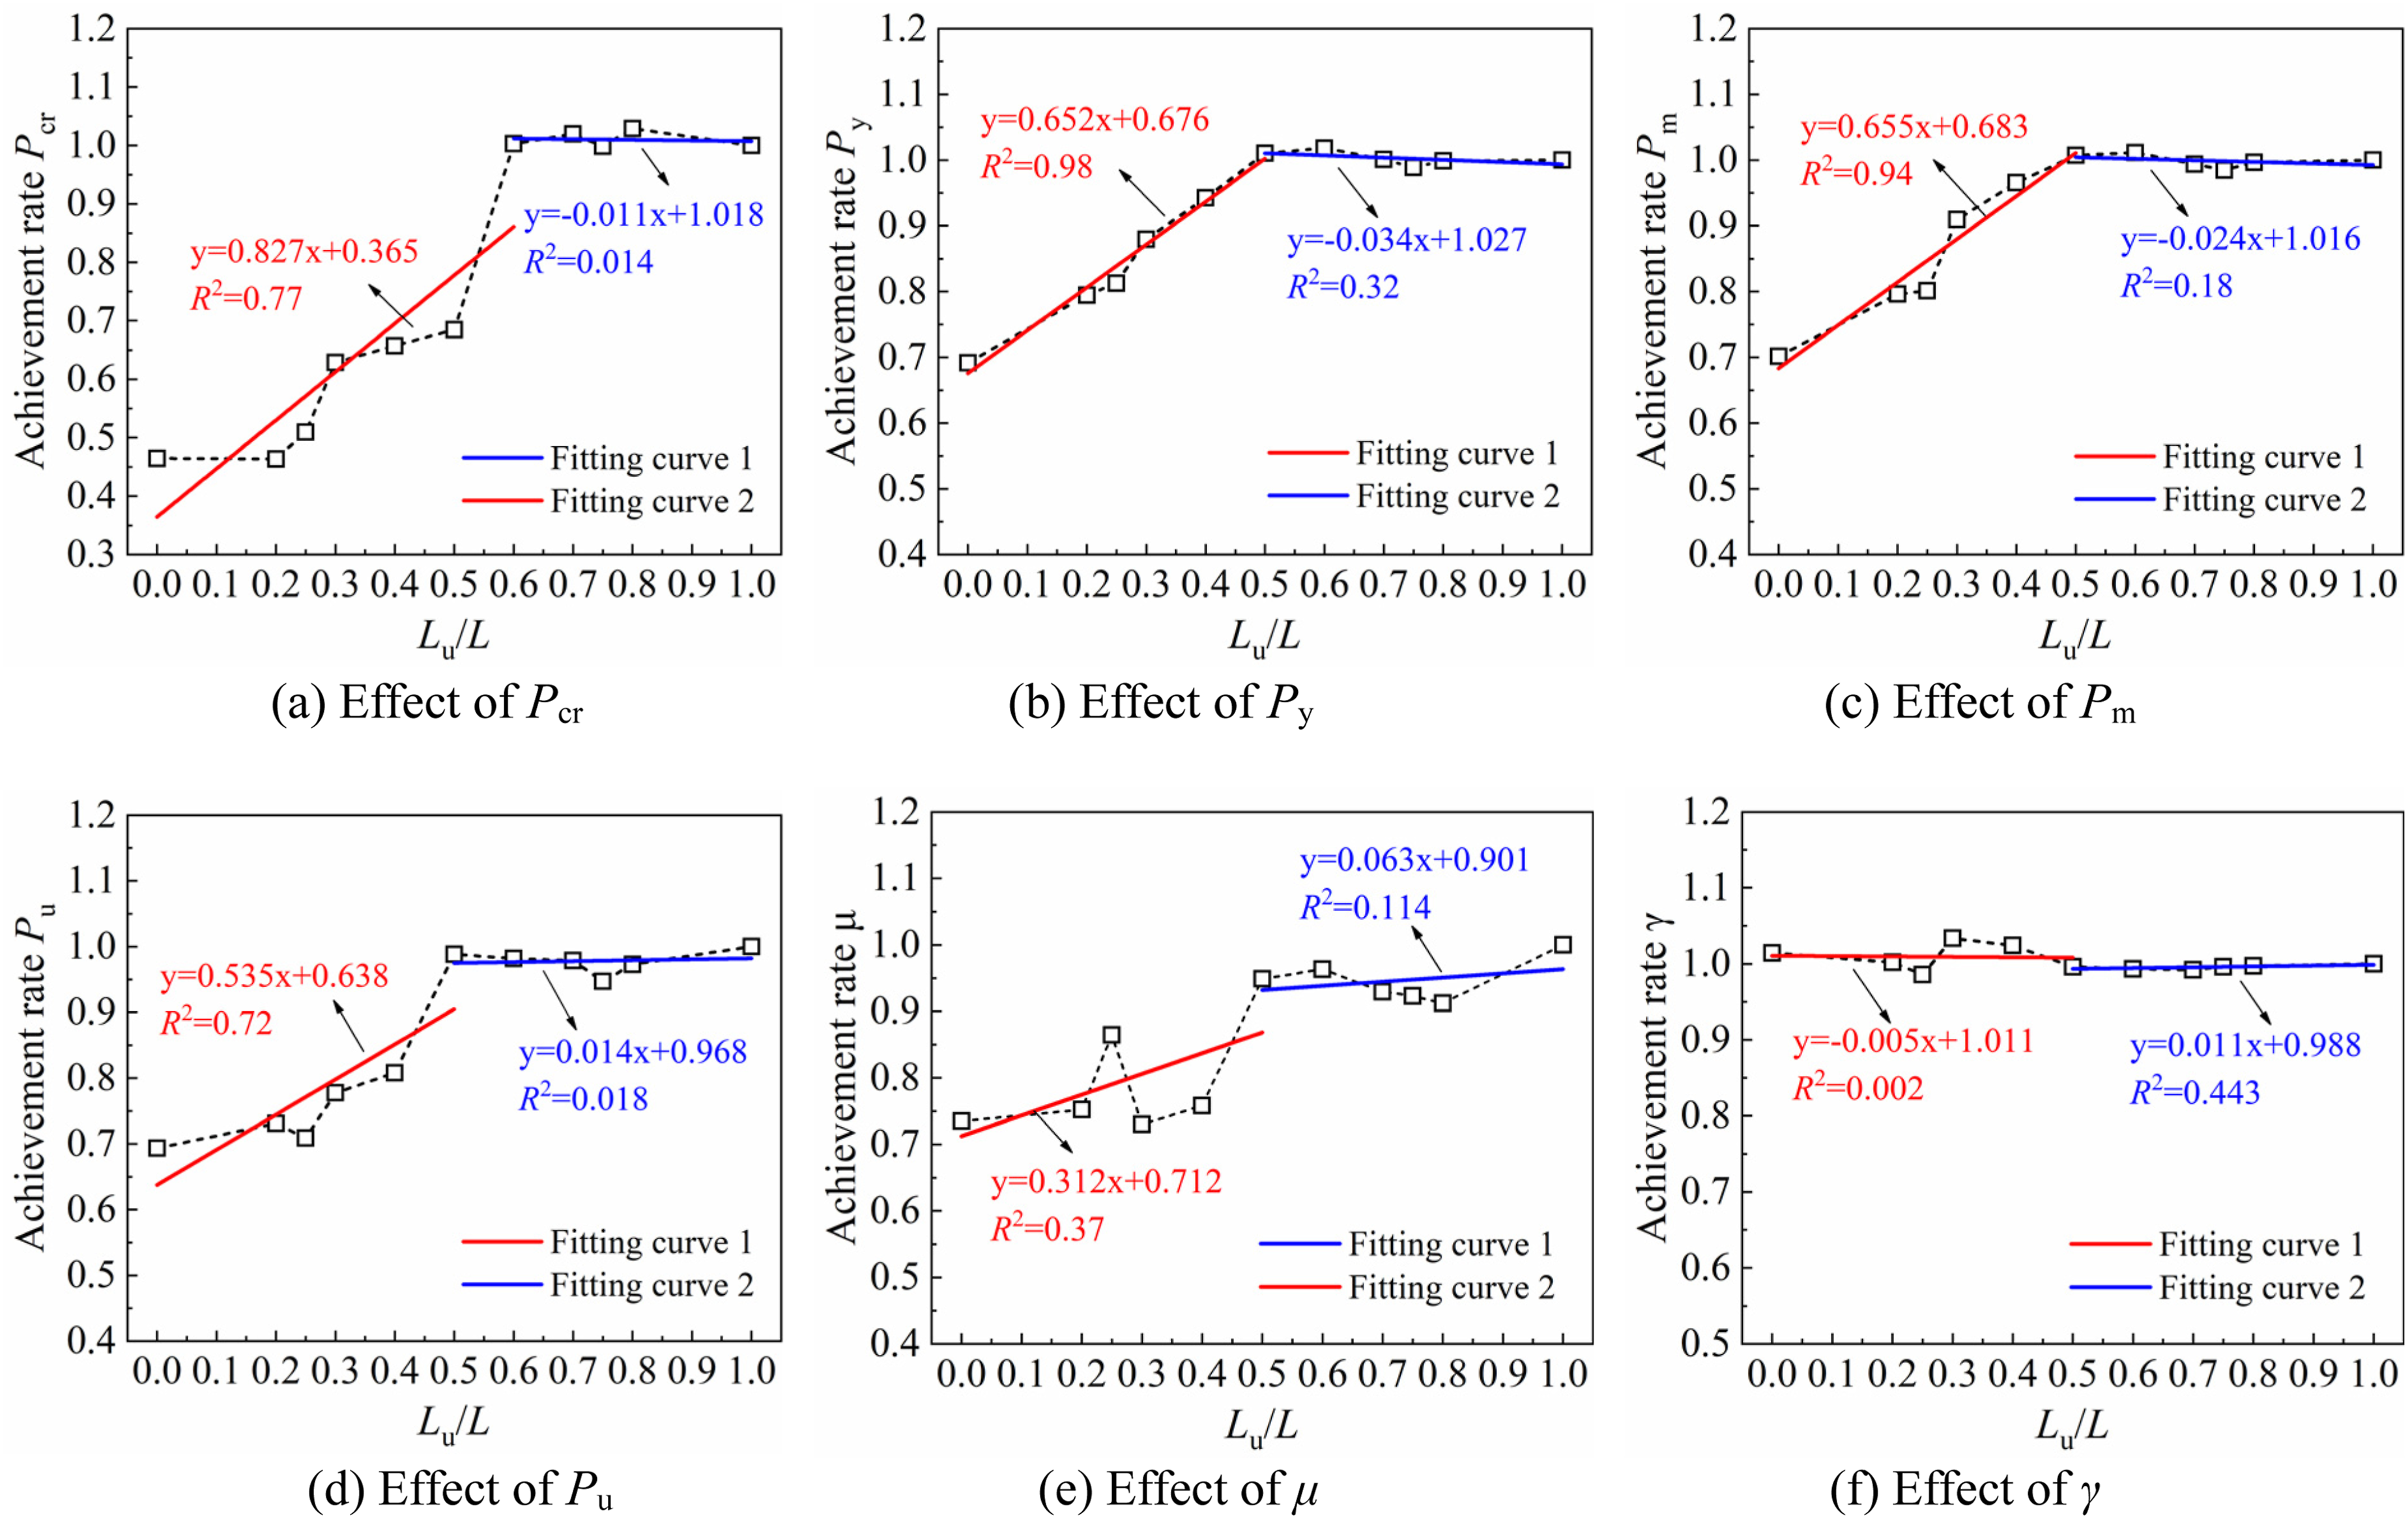
Deflection calculation of composite beams
Because the UHPC-NC composite beams are consist of UHPC and NC materials along the span, it can not be accurately predicted using conventional calculation methods. Therefore, the immediate stiffness is used to derive the mid-span deflection of the composite beam based on the immediate stiffness in this paper. The following assumptions are adopted in the calculations: (1) the composite beams conform to the plane section assumption during flexural loading (Figure 17); (2) the compressive contribution of the reinforcement is neglected; (3) there is no slip between longitudinal reinforcement and concrete. Strain distribution of mid-span section of test specimens.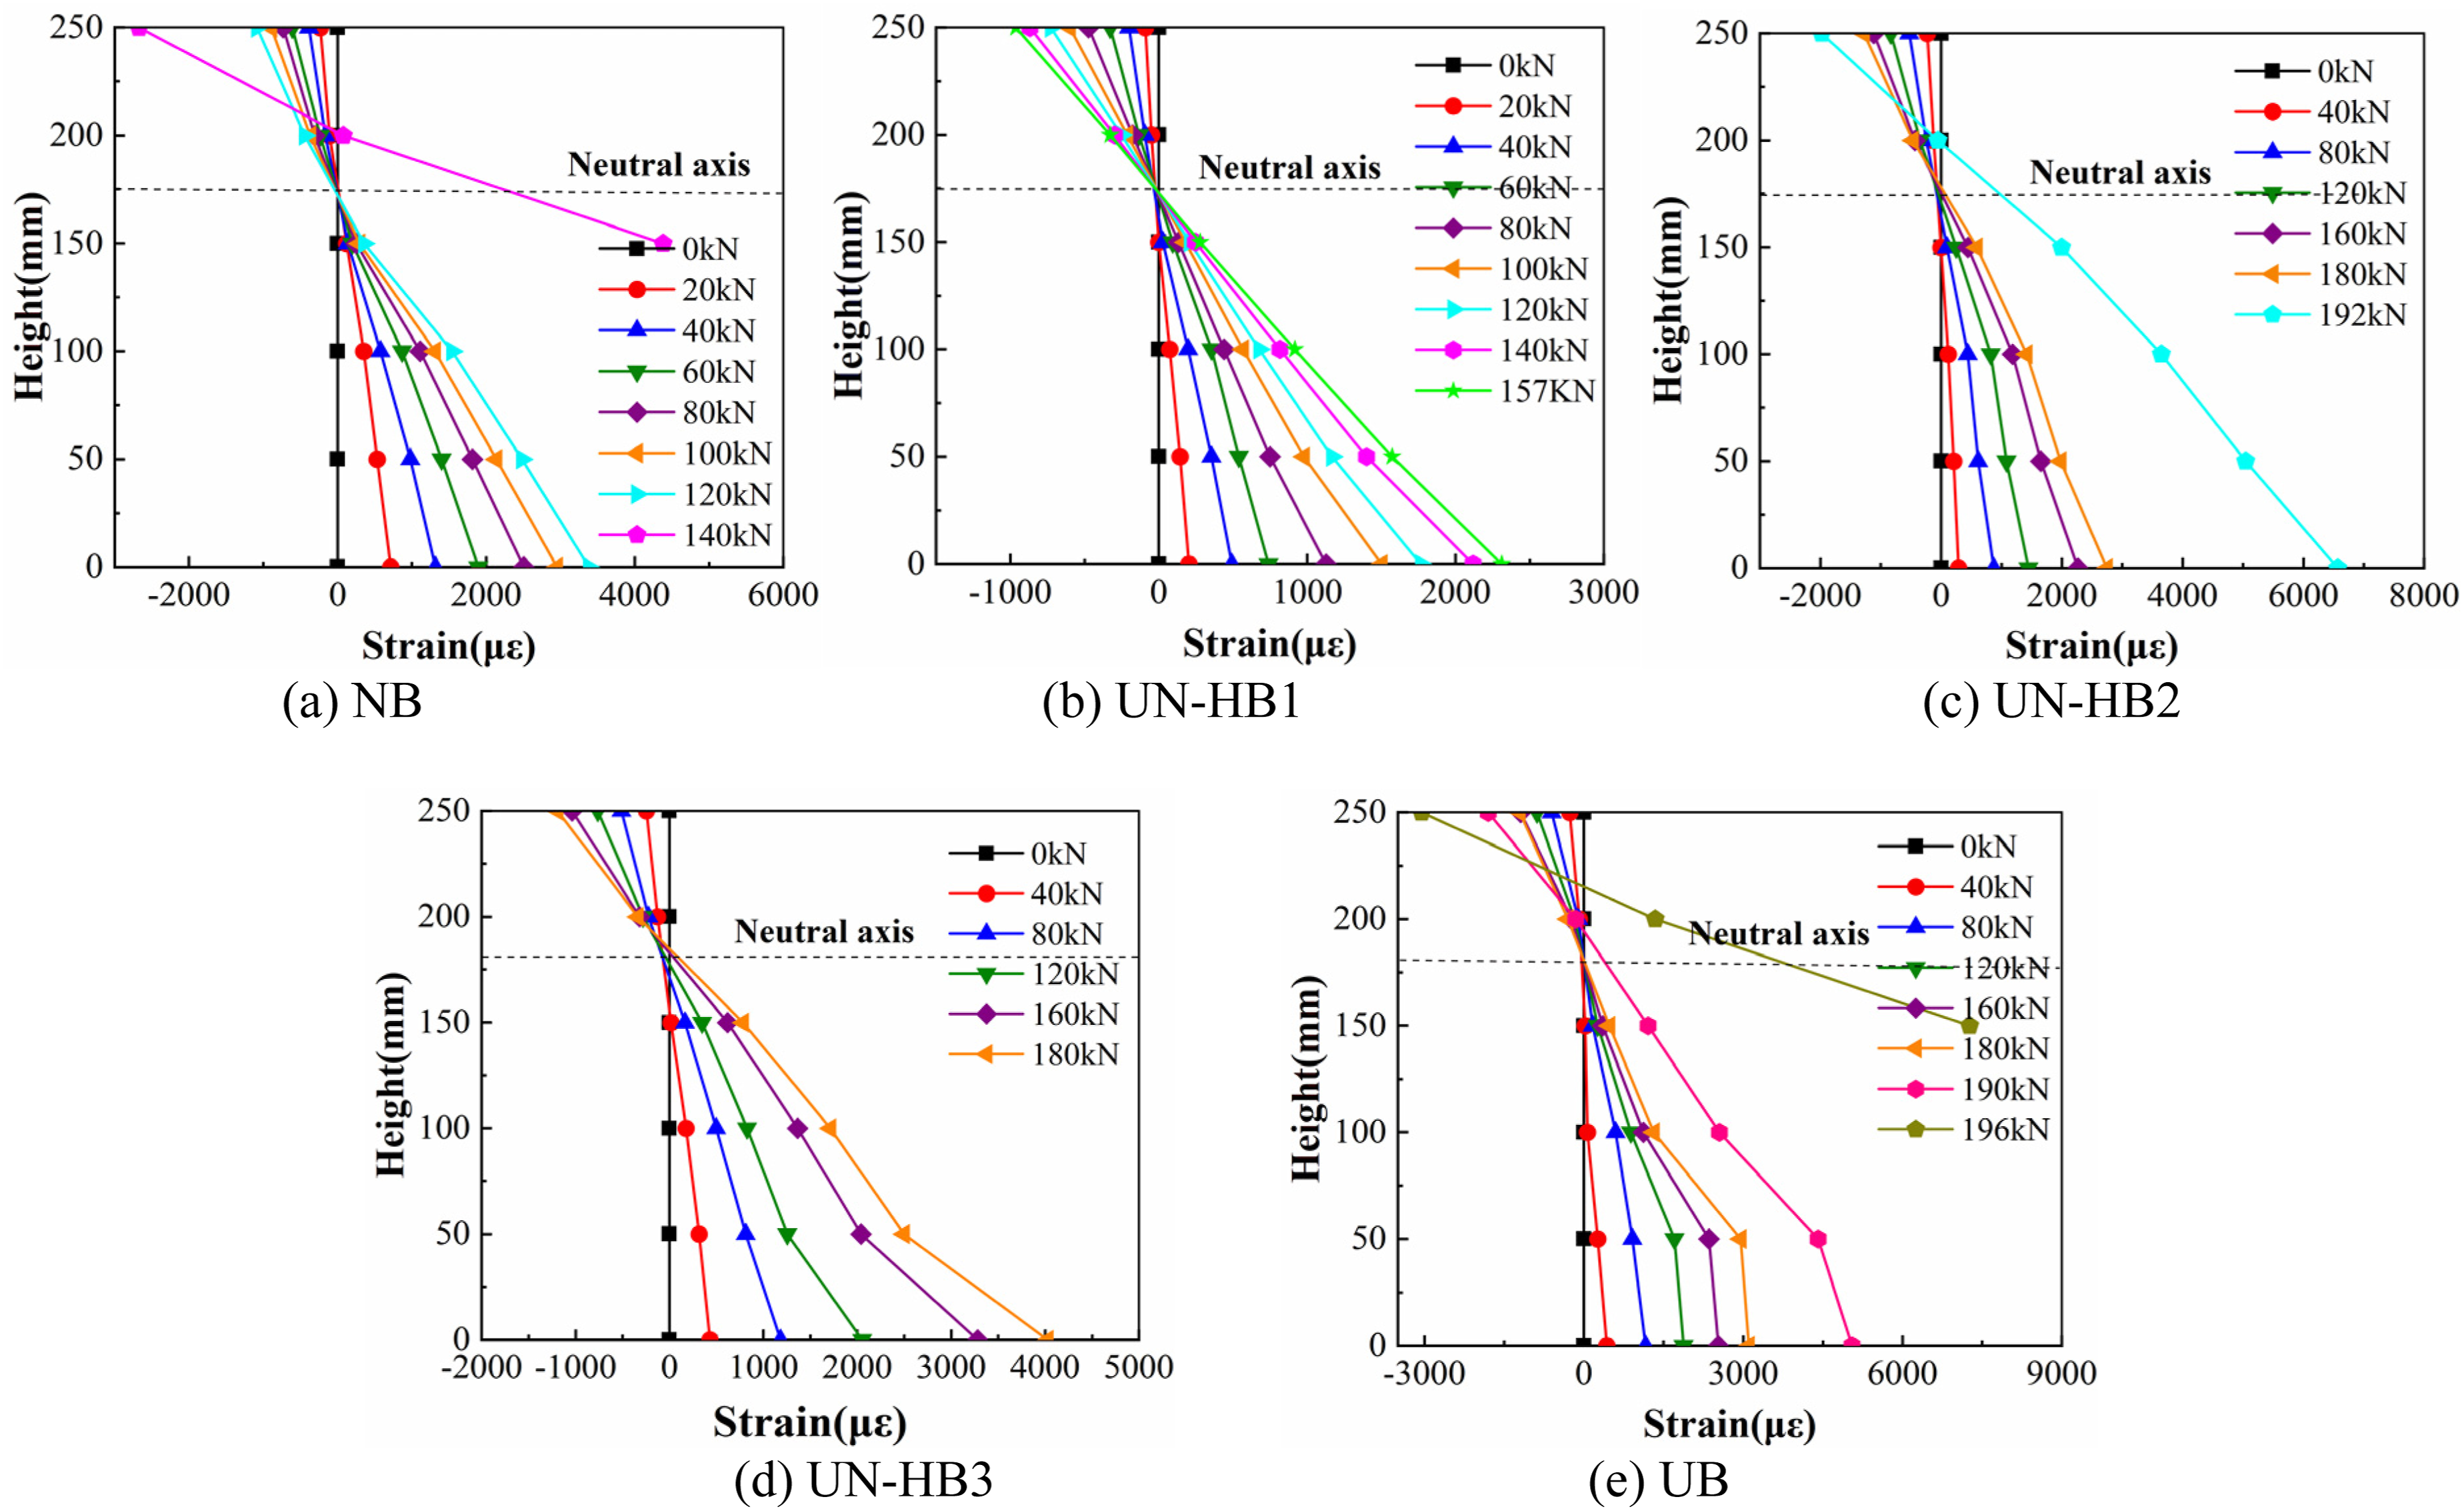
Verification of flat section assumption
Figure 17 illustrates the strain distribution of the concrete in the composite beams along the section height. At low loads, the average concrete strain at mid-span of each test beam exhibited an approximately linear distribution along the height of the section. The neutral axis of the test beams was located at approximately h = 175 mm, which shows that Lu/L had little influence on the neutral axis of the composite beams. With the increase of load, the cracks of concrete increase leading to a non-linear trend in the mid-span strains. The strain increases suddenly, so that the curve of strain deviates from the neutral axis when the beams NB and UB reach the ultimate load. The research in this paper and other research results (Nadir et al., 2024) show that the mid-span concrete of each test beam basically can be considered to satisfy the plane section assumption.
Mid-span deflection of variable stiffness non-equal section beams
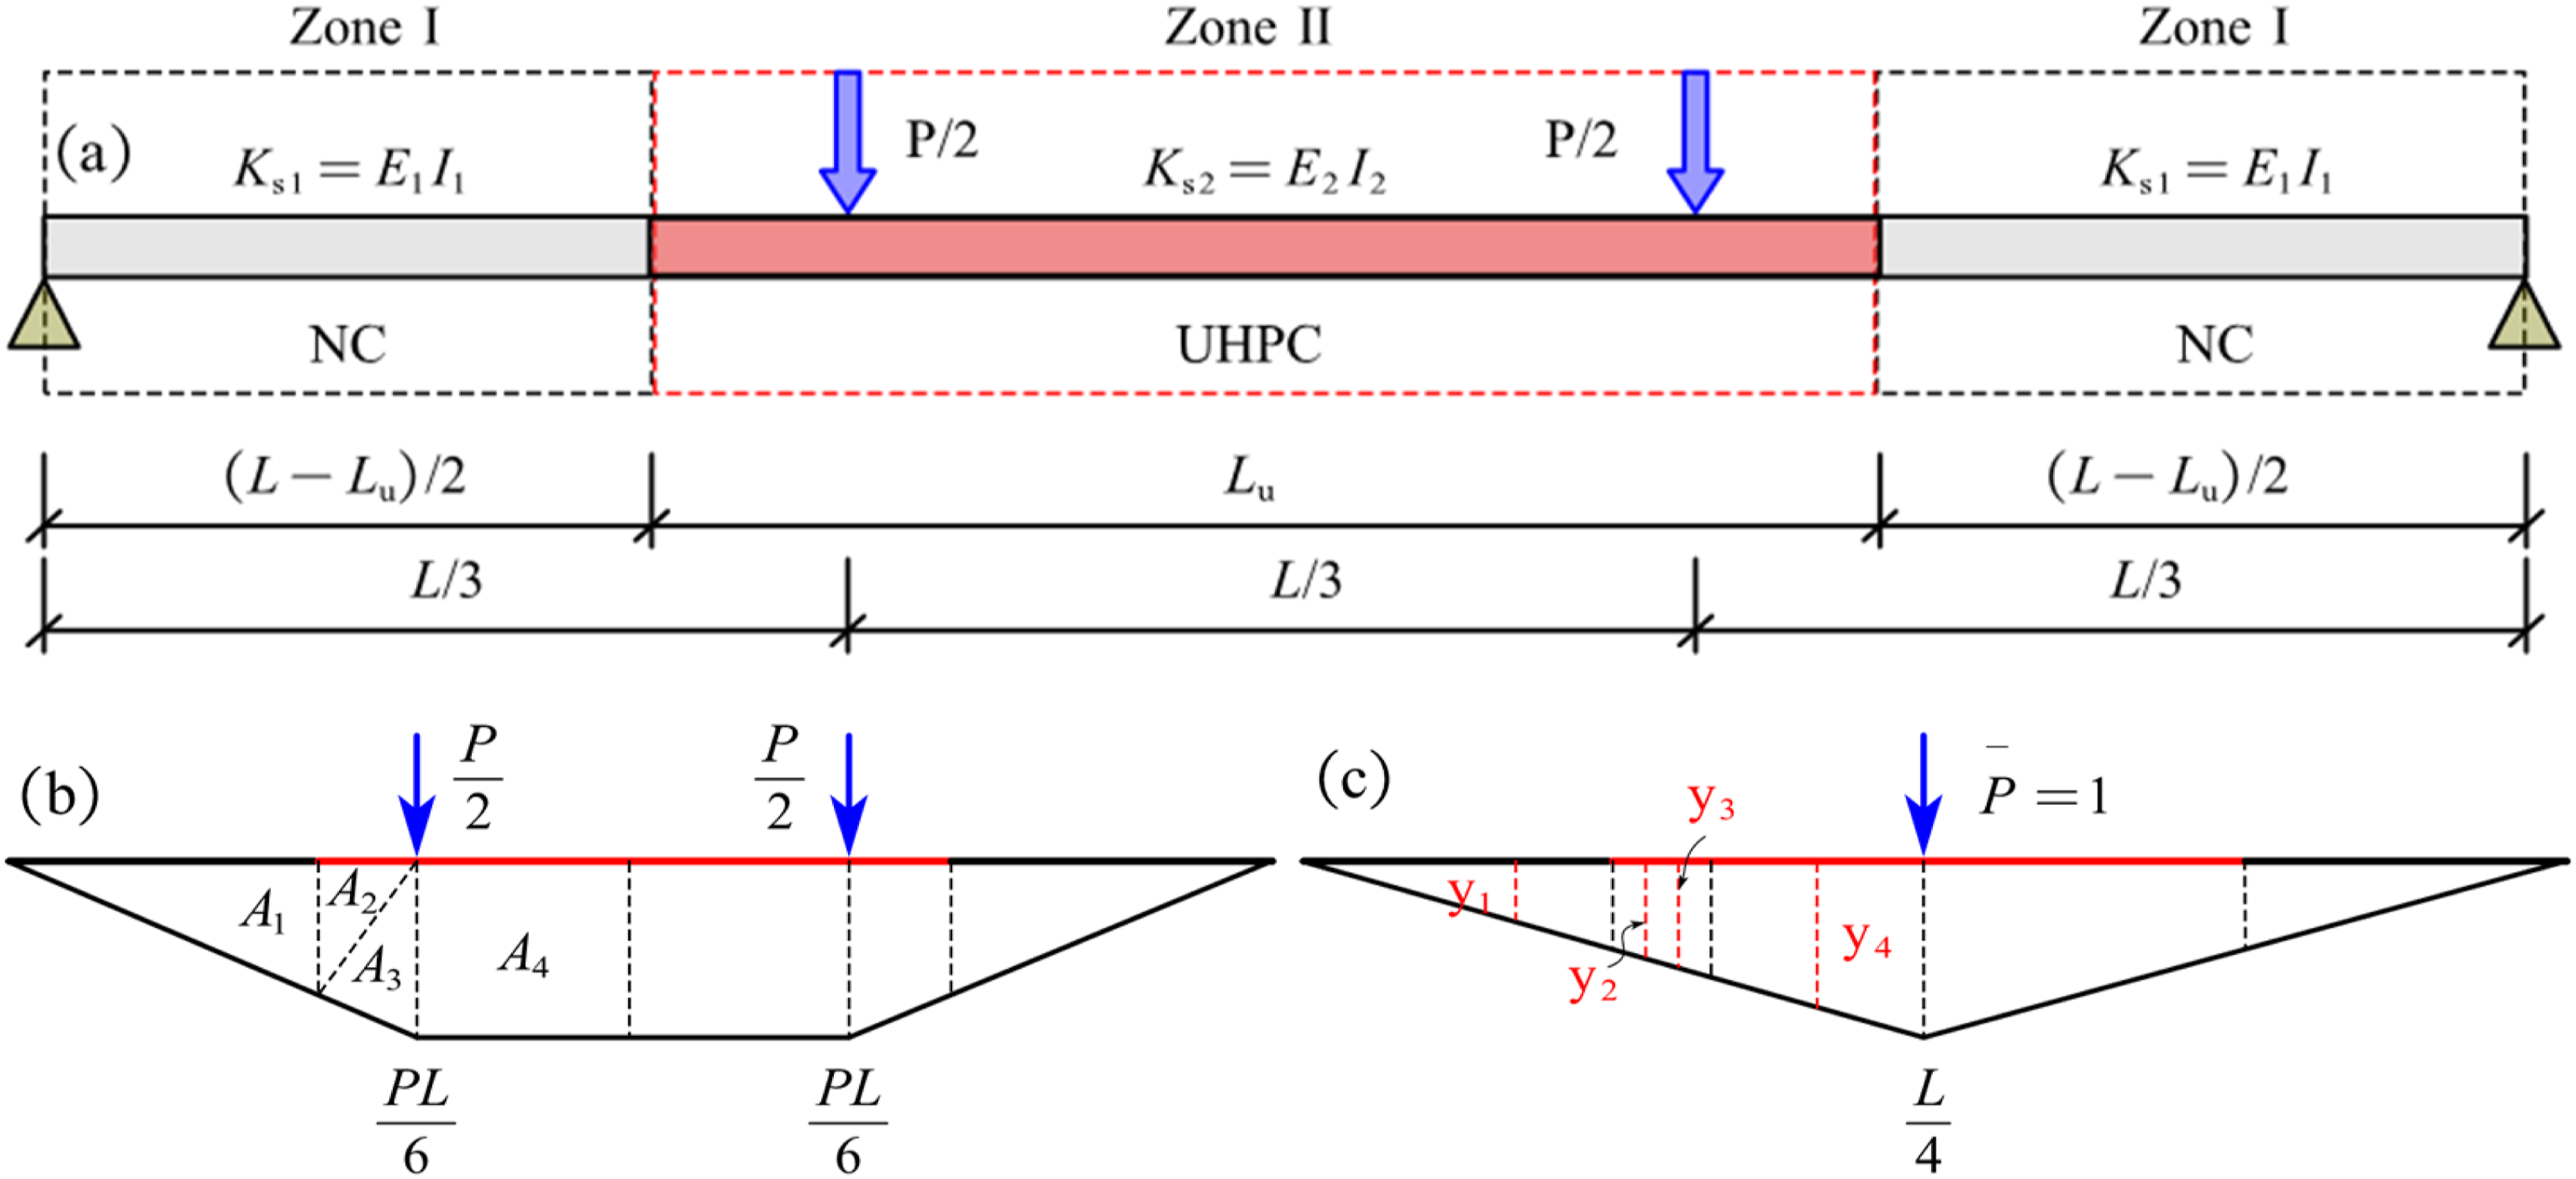
The composite beams are regarded as straight members with variable cross-sections. Based on the principle of virtual work, the mid-span deflection of the composite beams can be expressed by equation (6).
The calculation steps of the graphic multiplication method are illustrated in Figure 18, and the resulting mid-span deflection of the composite beams is given by equation (7). Simplified schematic diagram of beams. (a) Simplified diagram (b) Diagram of Mp;(c) Diagram of 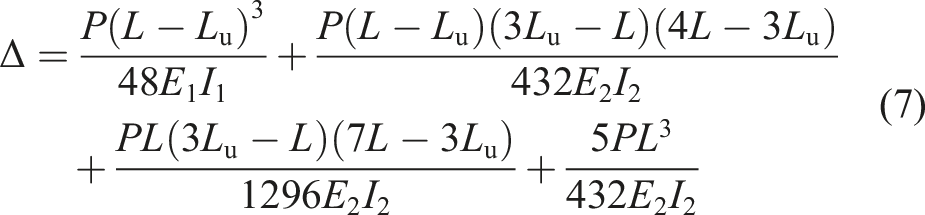
Immediate stiffness
Section 3.5 (Figure 12) qualitatively analyses the effect of UHPC proportion on the stiffness of the composite beams by treating each cross-section as a homogeneous material properties. The study shows that the overall stiffness of composite beams increases increased with increasing Lu/L. Since UHPC and NC materials are present along the span direction of the composite beam, the sectional stiffness varies nonlinearly along the beam length; therefore, it is not appropriate to use the overall stiffness to calculate the mid-span deflection of the composite beams. Figure 12(b) shows that there is no damage to the composite beams before yielding, the damage to the composite beams increased when the composite beams yielded. Therefore, the stiffness of the composite beams should be analyzed according to pre-yield and post-yield. Before reaching the yield load, the composite beams are classified into Zone I and Zone II according to material distribution characteristics (Figure 18(a)) in this paper. The immediate stiffness of materials in each section can be calculated by the principle of minimum stiffness (GB 50010-2010, 2015).
(1) Immediate stiffness of zone I
Zone I consists of normal concrete (NC). As specified in GB 50010-2010 (2015), the instantaneous stiffness of reinforced concrete flexural members under service loads (accounting for crack control) is given by equation (8).
(2) Immediate stiffness of zone II
Zone II is UHPC section, and GB50010-2010 (2015) does not consider the bridging effect of steel fiber after UHPC cracked, it is obvious that the stiffness of UHPC can not be calculated directly. Therefore, the effective moment of inertia method is used to calculate the immediate stiffness of the UHPC section in this paper. The section of beams is shown in Figure 19. Transformed uncracked and cracked sections for beams.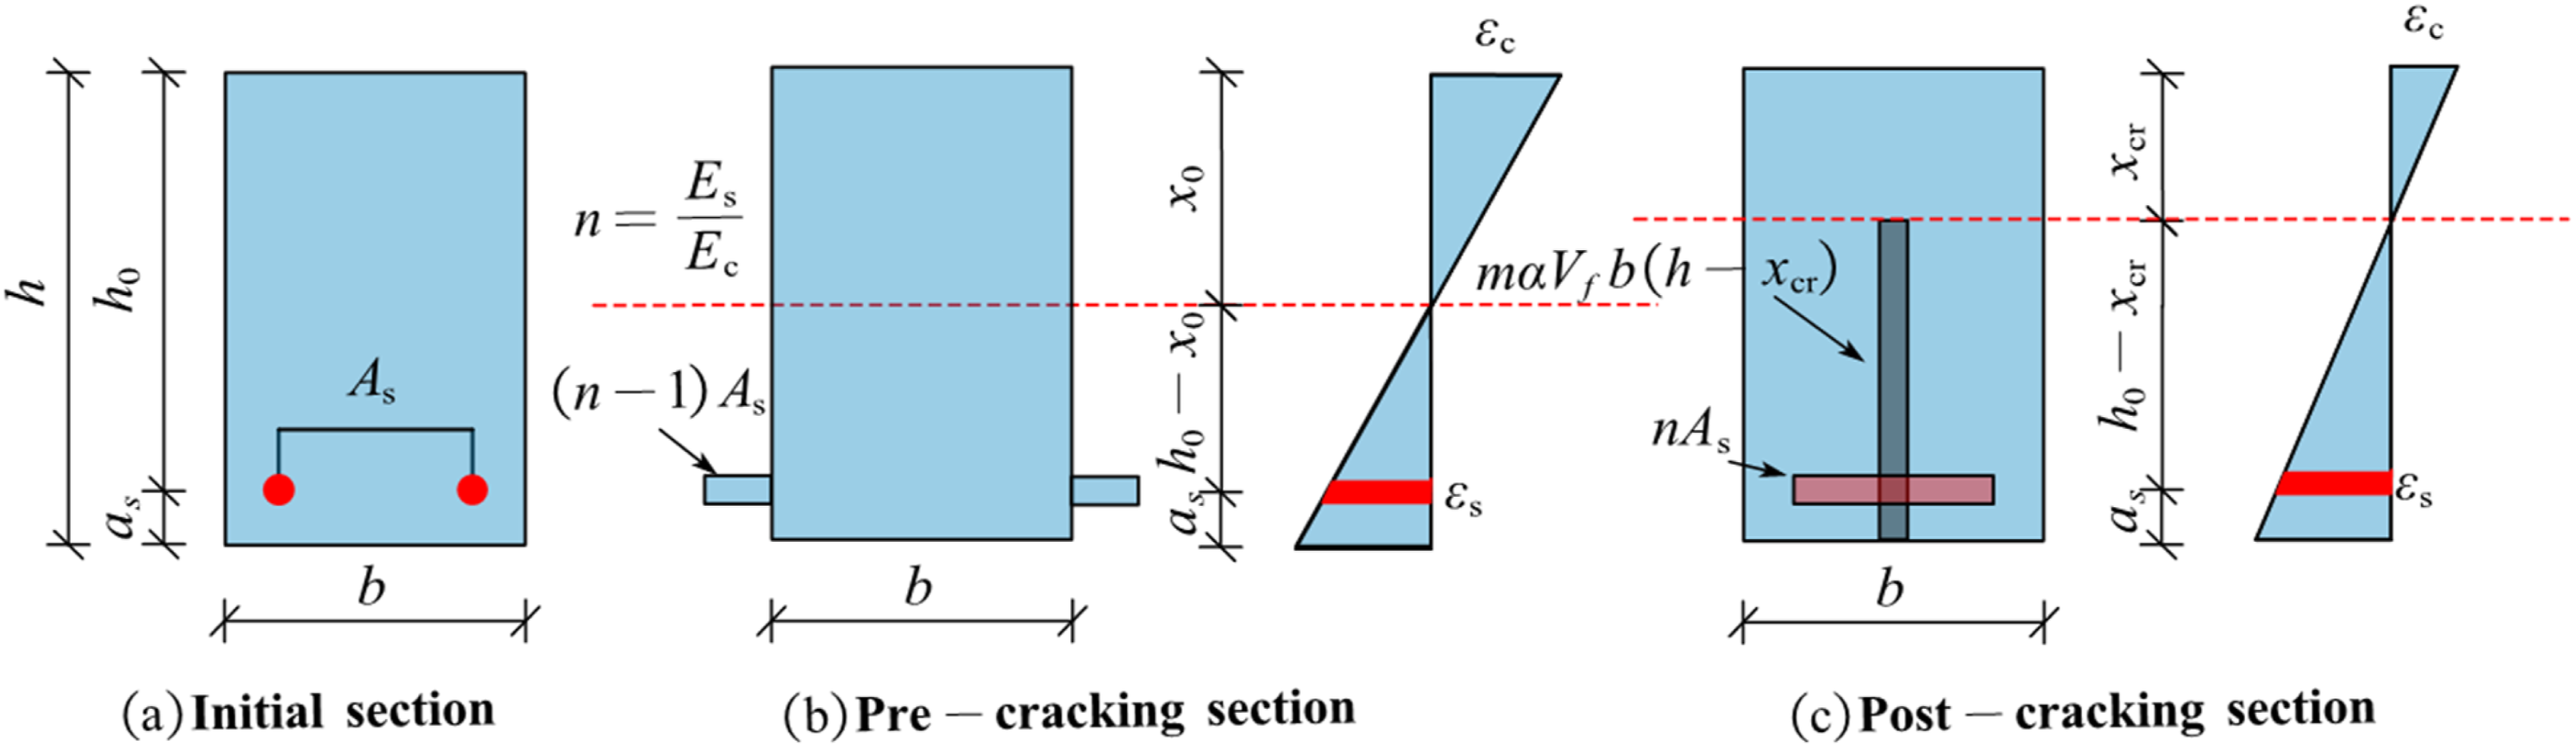
The pre-cracking tensile stresses of UHPC were provided by concrete and reinforcement, and the stress of the section is shown in Figure 19(b). The moment of inertia of the UHPC converted section before cracking is given in equation (9).
The tensile strength of UHPC is not considered after cracked and the tensile stress is provided by steel fibers and reinforcement. The stress of the section is shown in Figure 19(c). The height of the compression zone xcr and the moment of inertia Icr of the section after cracked are written as equation (10) and (11).

The effective moment of inertia of the cross-section should be adopted to calculate the mid-span deflection of the composite beams when the applied moment exceeds the cracking moment Mcr (ACI 318-95, 1995).
The immediate stiffness of the UHPC section before and after cracking is calculated by equation (13).
Reference has shown that the cracking moments calculated by Stress-strain diagram for a balanced rectangular section.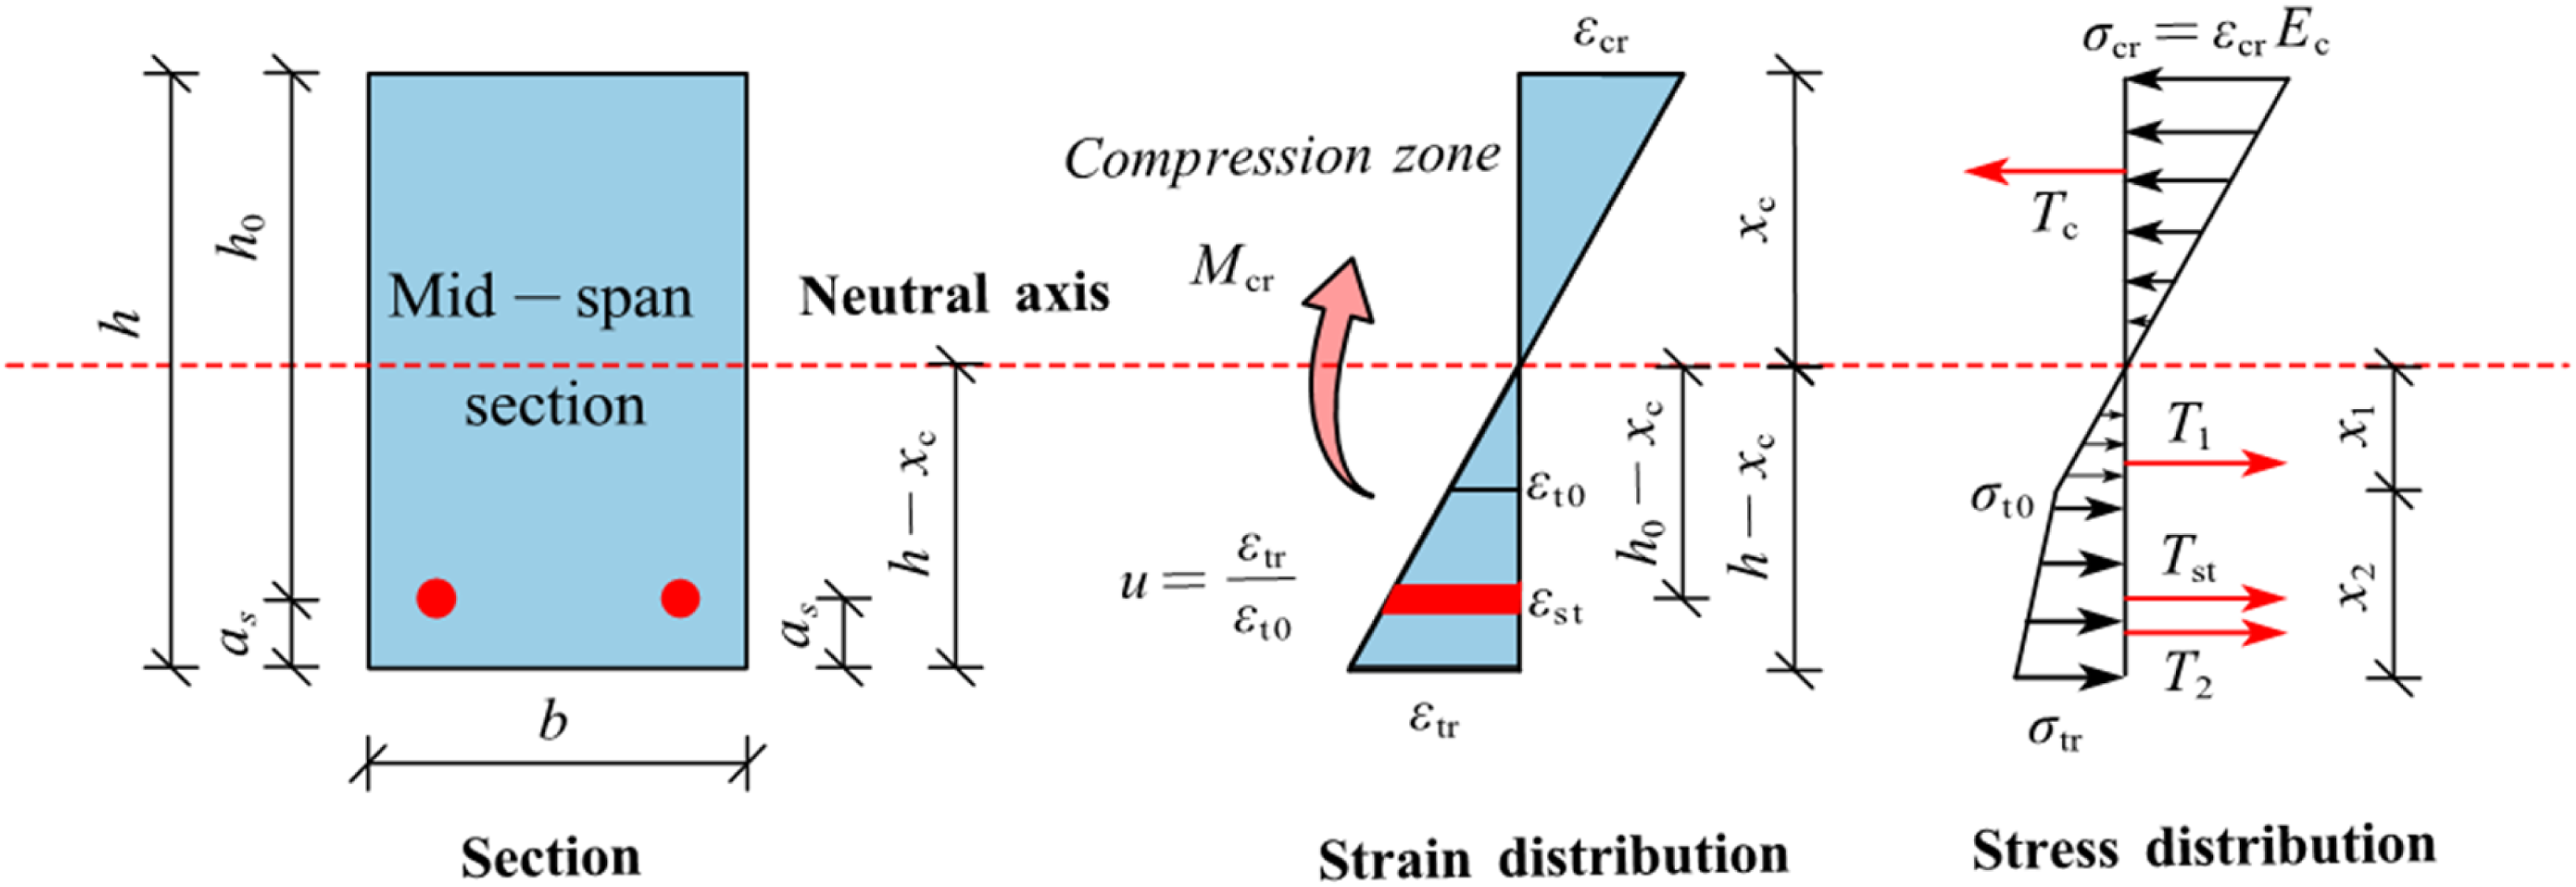
Based on the plane section assumption for composite beams, the relationship between the strains in the tensile reinforcement and the compressive concrete is given by equation (14).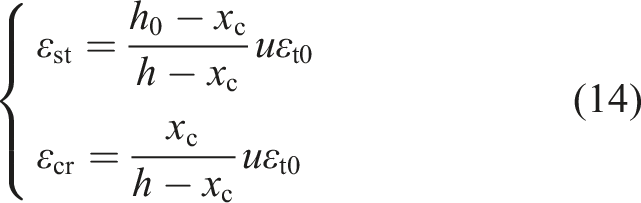
The concrete stresses Tc of the compression zone, concrete stresses T1 of the tensile elastic zone, concrete stresses T2 of the tensile plastic zone and reinforcement stresses Tst are shown in equation (15).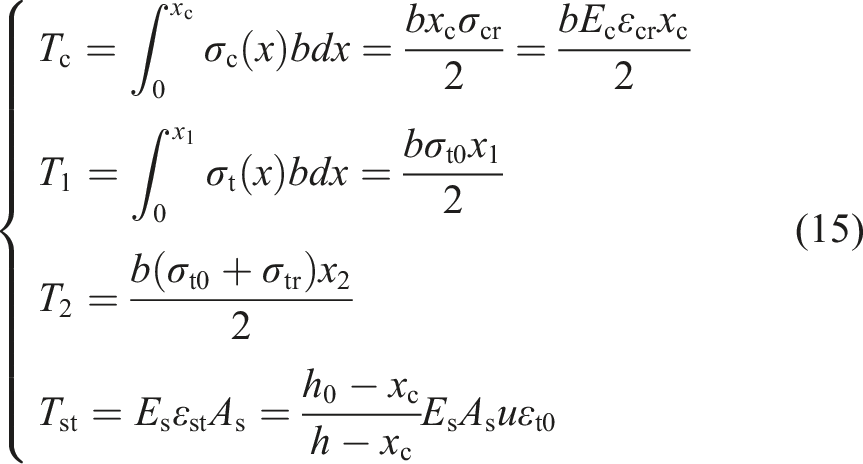
Base on 
Rearranging the equation, we obtain the height of the compressed zone 
Therefore, the acting moments of Tc, T1, T2 and Tst to the neutral axis are written as equation (18).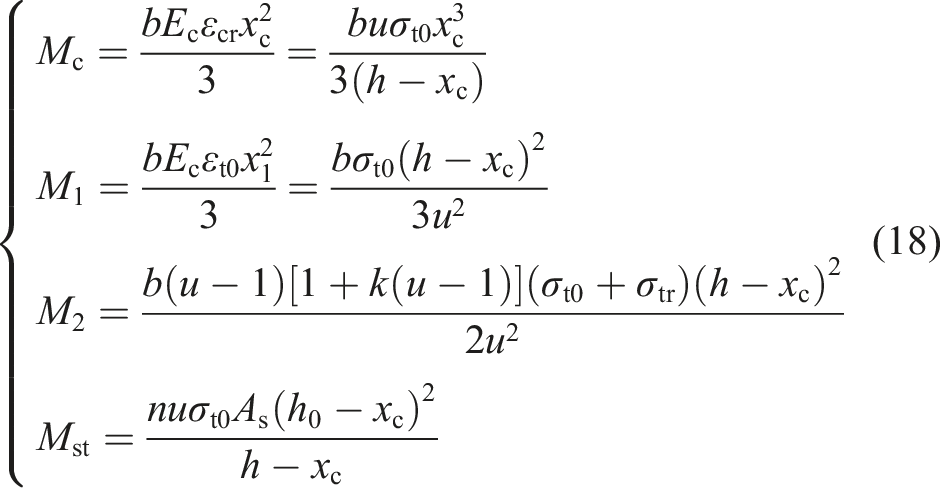
Based on 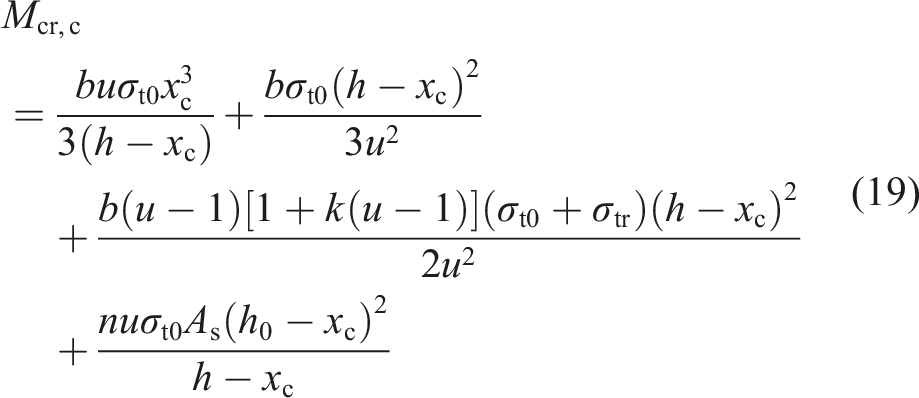
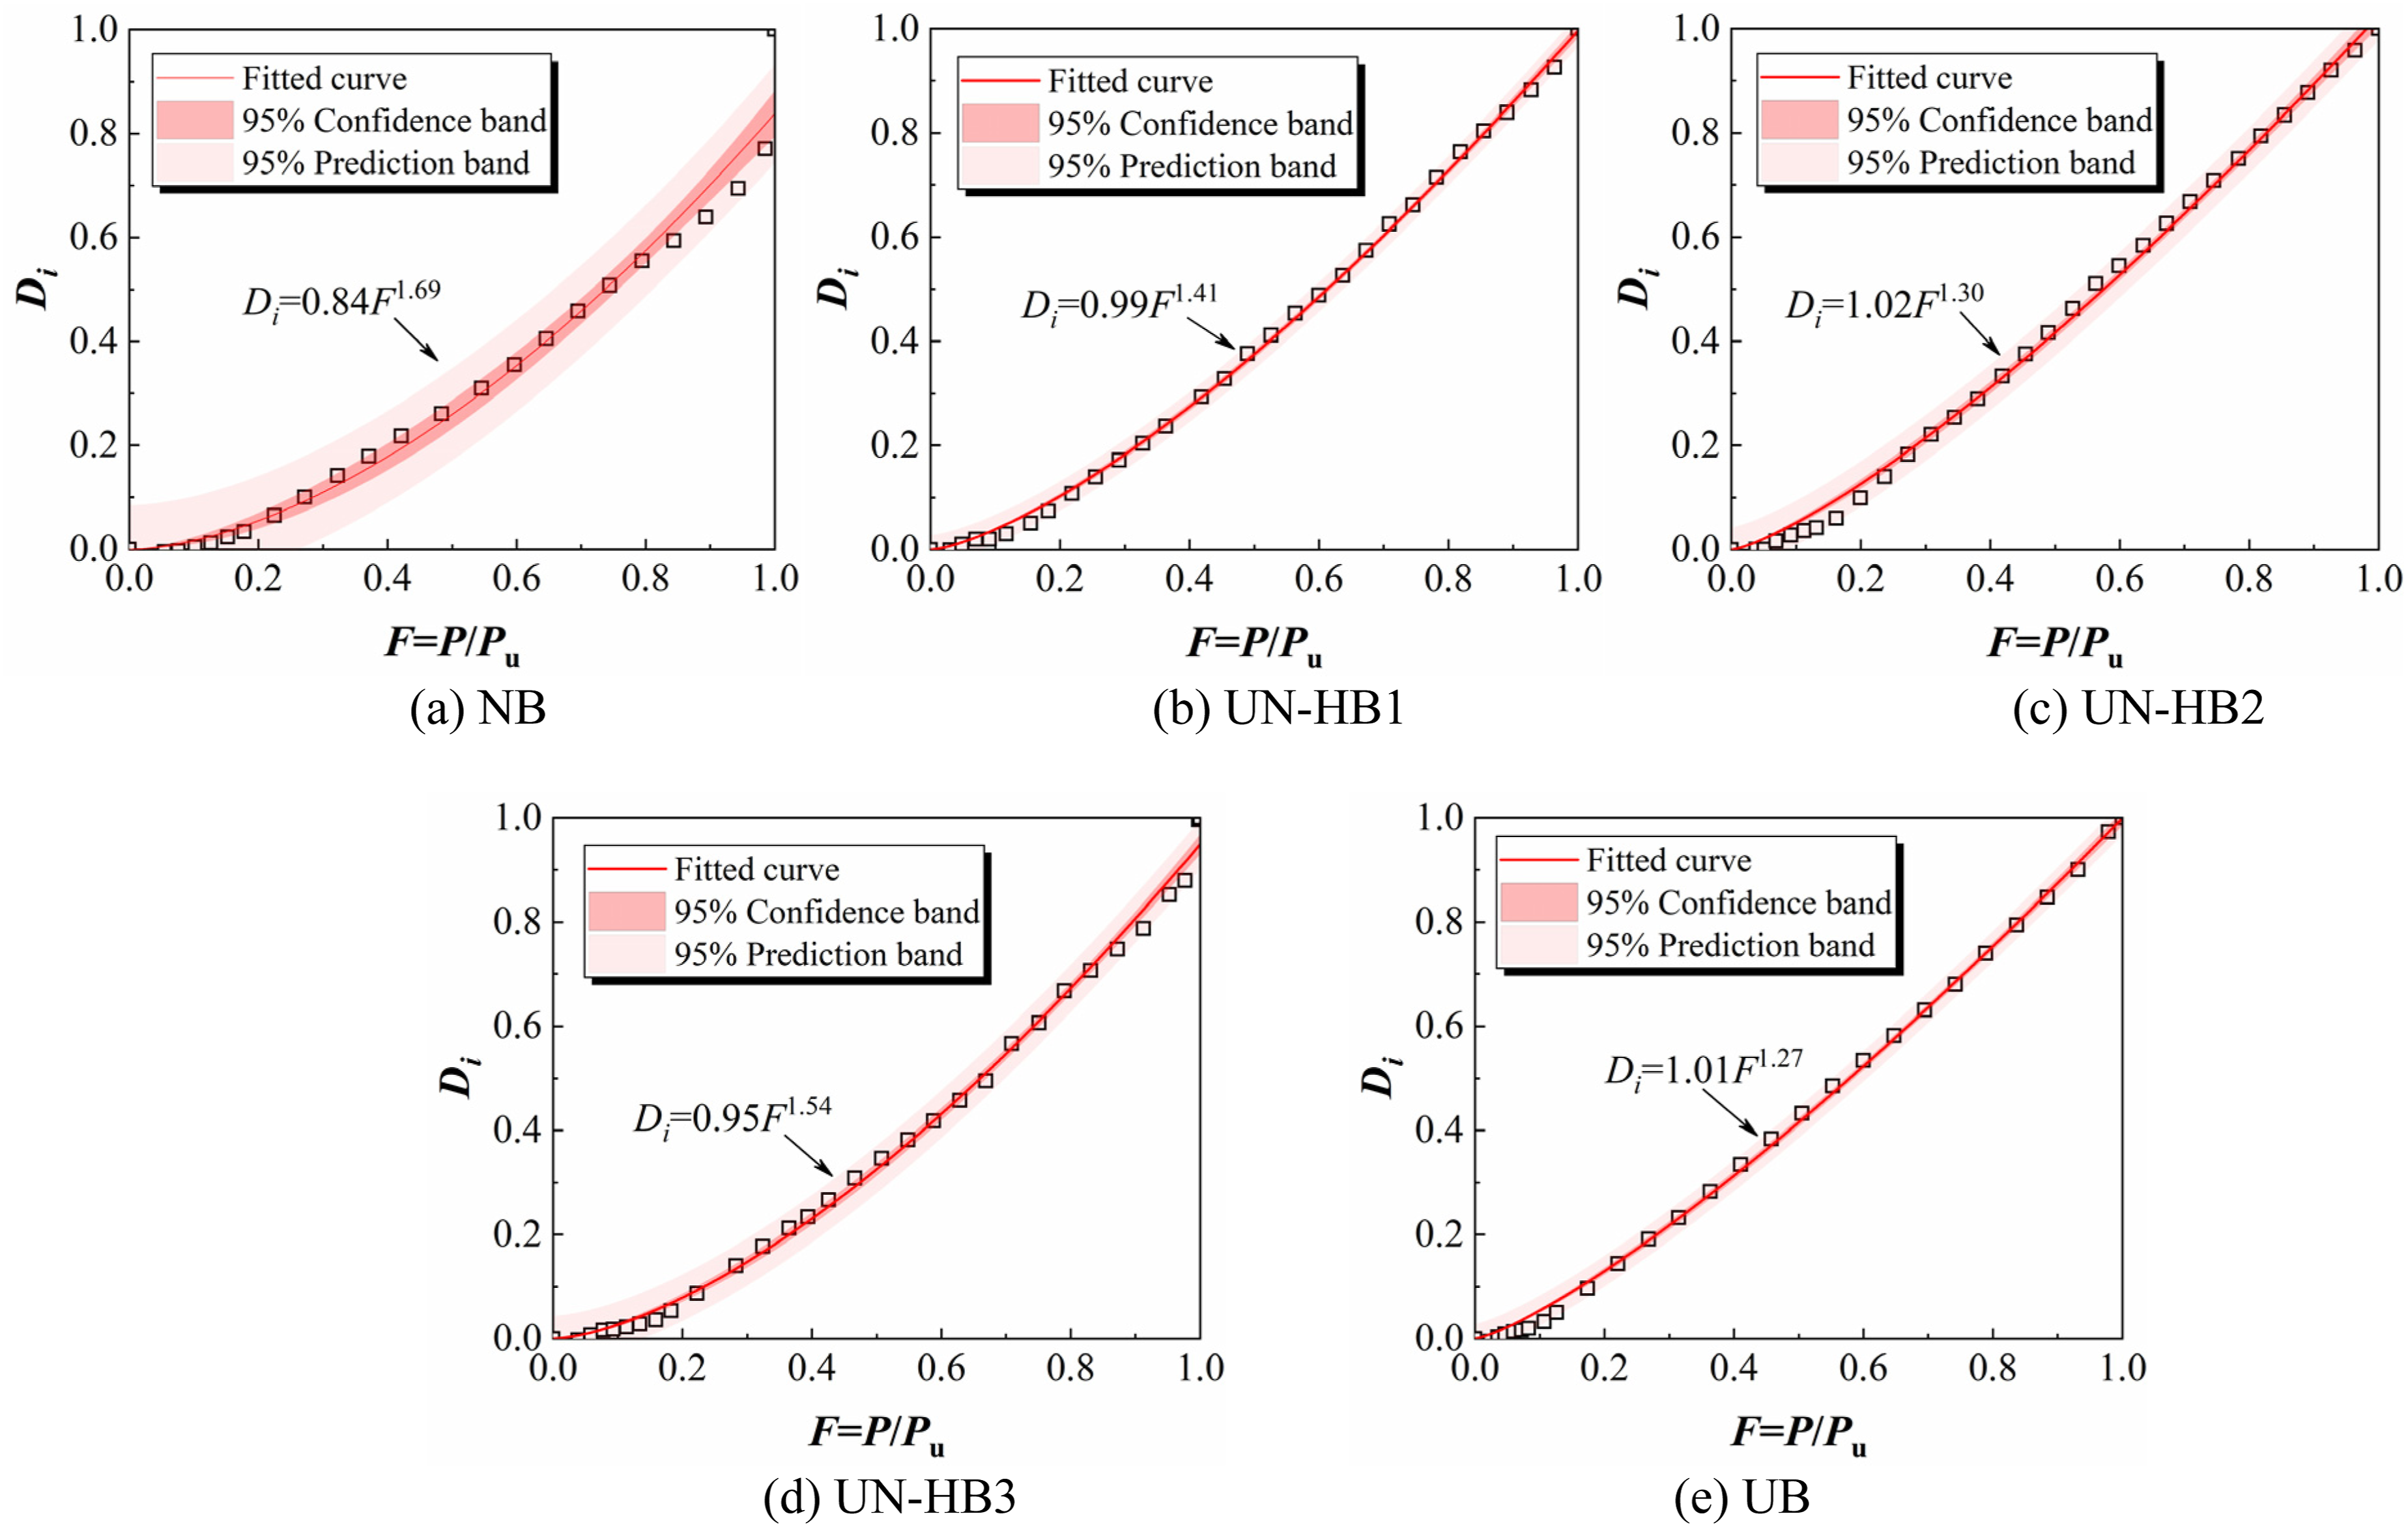
After reaching the yield load, the damage degree of the composite beams increased rapidly with increasing load, so the effect of damage on the stiffness of the composite beams is considered on the basis of the immediate stiffness at the yield point. The stiffness damage evolution relationships of each test beam are shown in Figure 21. The UHPC proportion varies among the composite beams, and the damage evolution behaviors also differ significantly during flexural loading. Equation (20) describes the influence law of Lu/L on the damage development of composite beams. The stiffness of the UHPC-NC composite beams is calculated according to equation (21) after reaching the yield load. The curve of damage evolution.

In summary, the mid-span deflection of UHPC-NC composite beams is calculated in two stages in pre-yield and post-yield, as shown in equation (22).
Model validation
The mid-span deflection experimental curves and FEM curves of the UHPC-NC composite beams are compared with the calculated curves as shown in Figure 22. The comparison results show that the calculation curves are in good agreement with the experimental and FEM curves, the experimental stiffness and calculated stiffness of the composite beams are basically consistent before the yield point, the trend of the experimental curve is generally consistent with that of the calculated curve after the yield point, which demonstrates that the proposed calculation model can accurately predict the mid-span deflection behavior of UHPC-NC composite beams. The comparison results show that the calculation curves are in good agreement with the experimental and FEM curves, the tested stiffness and calculated stiffness of the composite beams are basically consistent before the yield point, the trend of the test curve is basically consistent with the trend of the calculated curve after the yield point, which demonstrates that the proposed calculation model for mid-span deflection of UHPC-NC composite beams in this paper can accurately predict the development law of mid-span deflection. Comparison on the experimental and calculate deflection curves.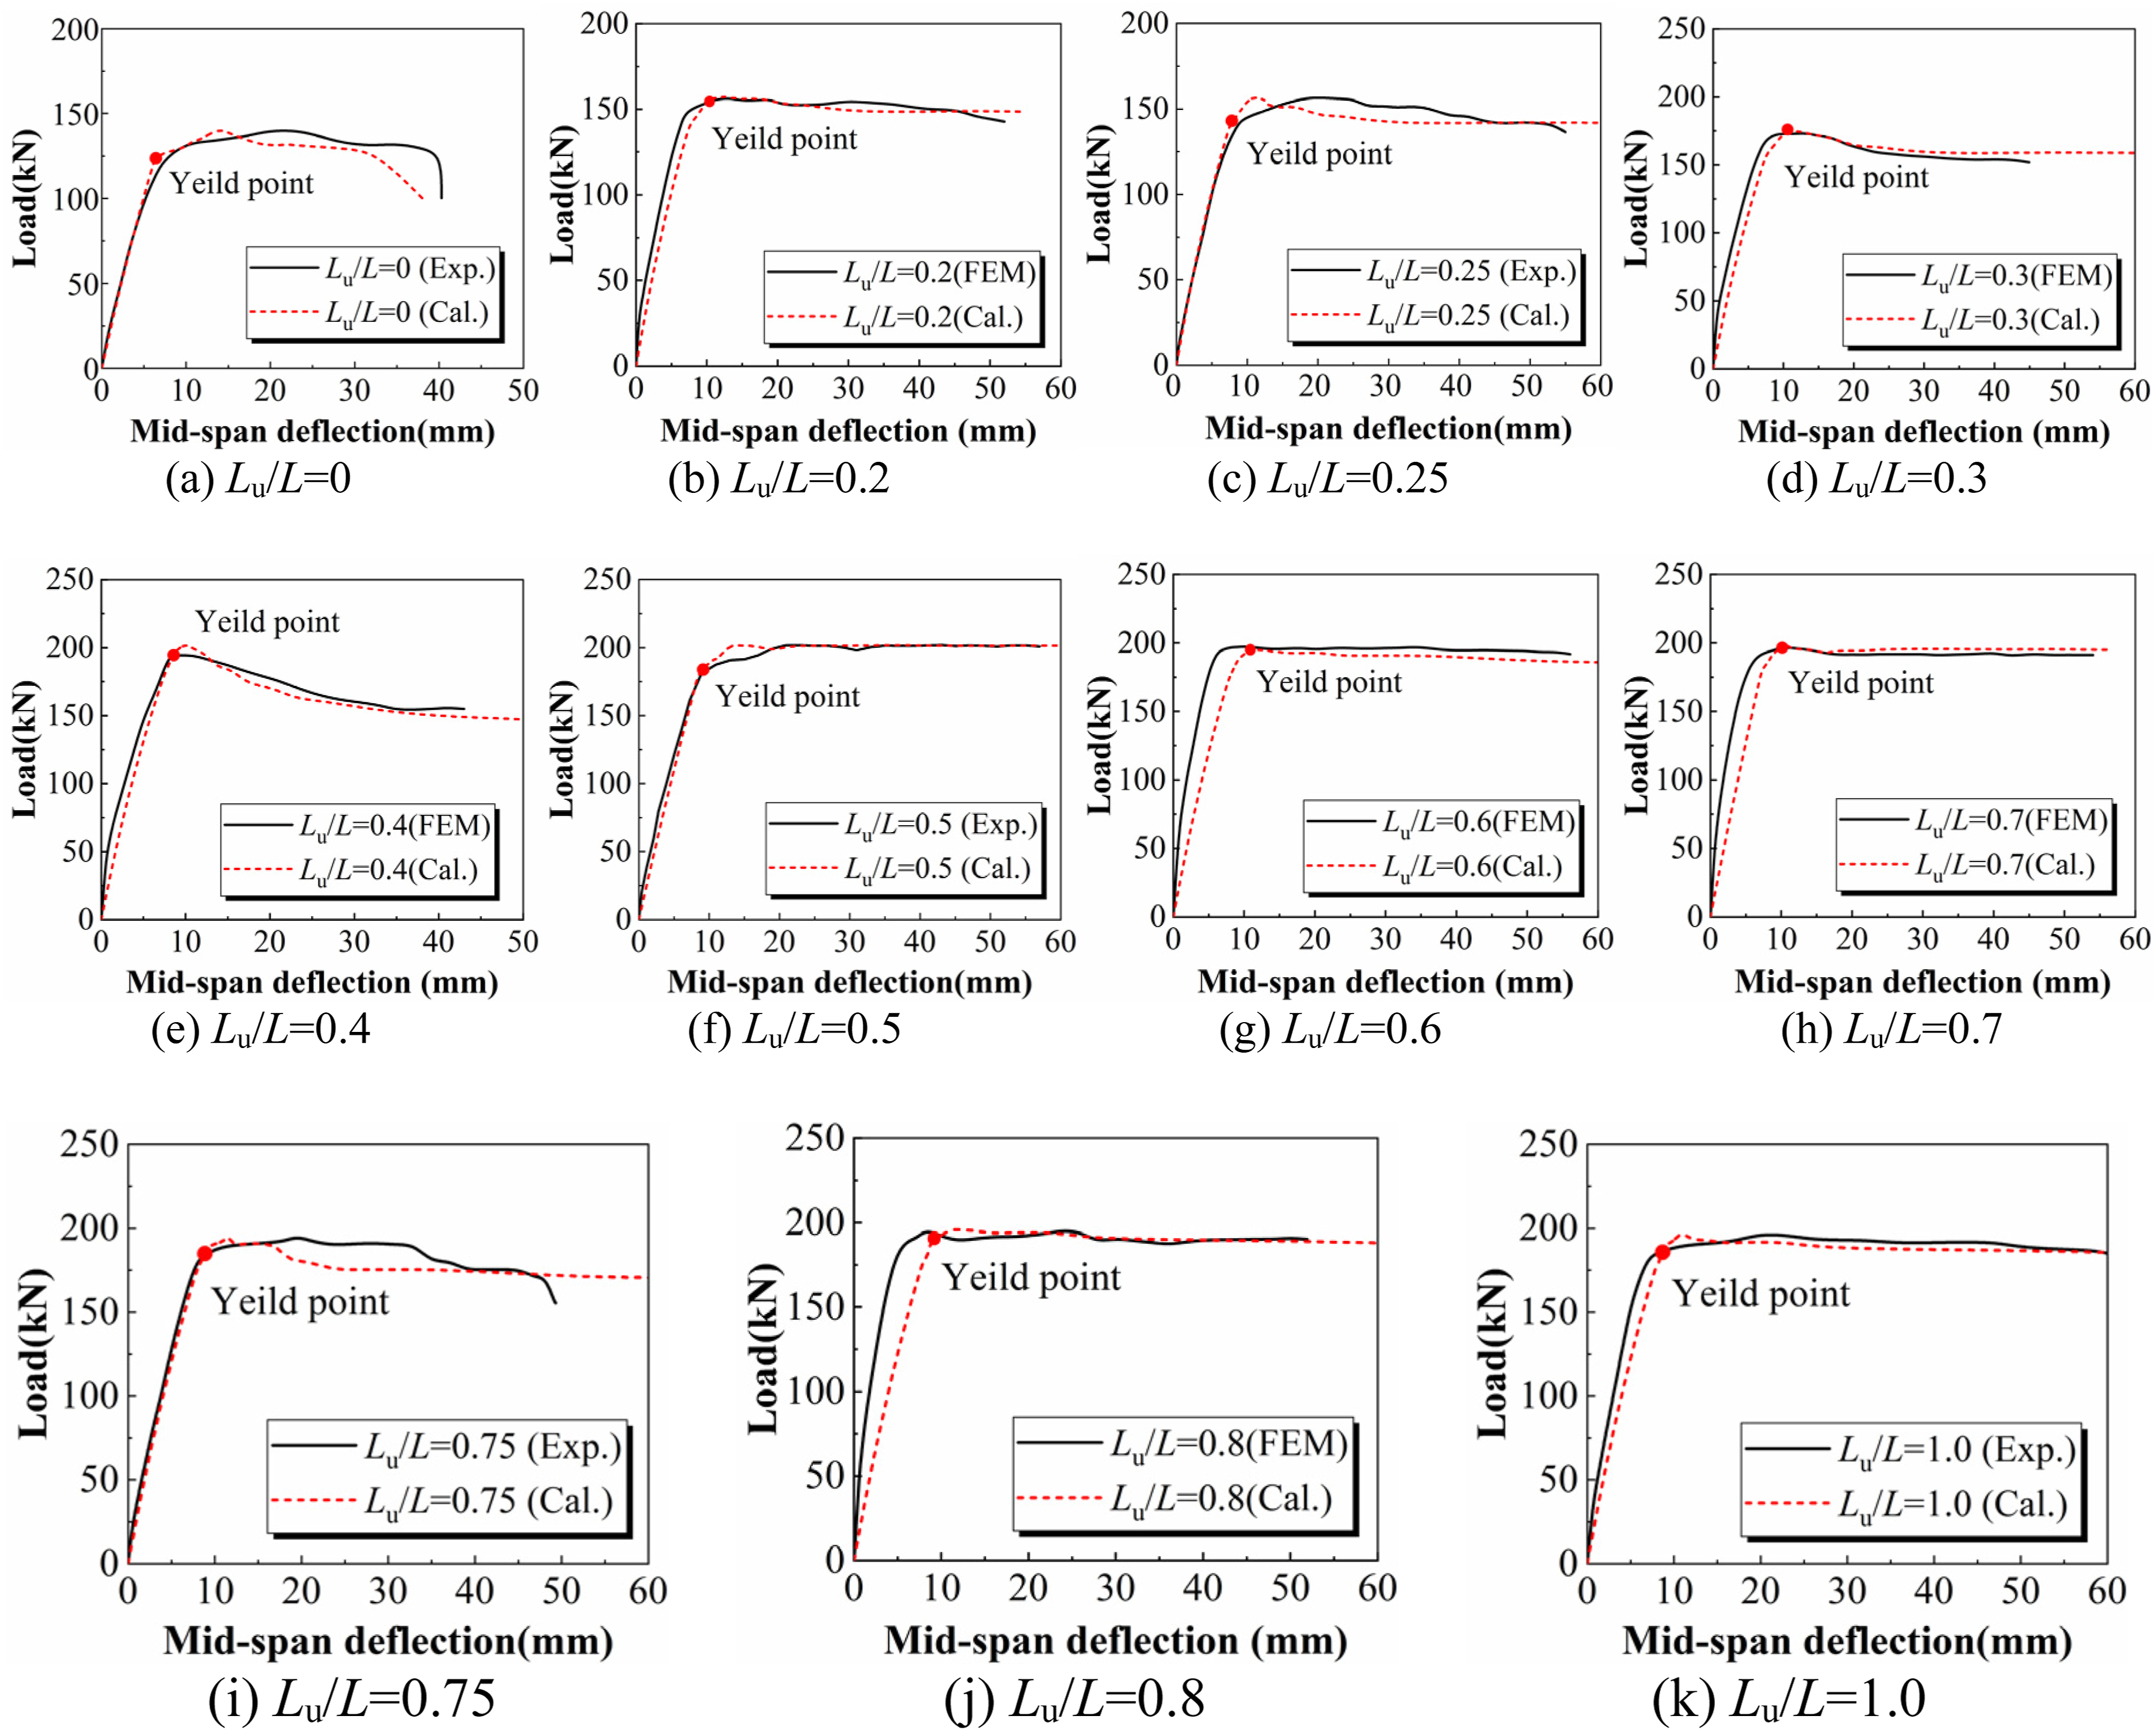
Conclusion
In this study, the effect of Lu/L on the flexural performance of UHPC-NC composite beams including mid-span deflection, ductility, and plasticity coefficient is investigated. The strain development behavior of reinforcement and concrete at the interface of UHPC-NC composite interface is also discussed. Furthermore, a model for calculating the mid-span deflection of composite beams is derived based on the experiments. The main conclusions are summarized as follows: (1) Specimen UN-HB1 exhibited flexural-shear failure, while all other specimens exhibited flexural failure. Beam NB was characterized by multiple fine cracks at the bottom of the beam. In contrast, the composite beams (UN-HB2 and UN-HB3) and the UB beam developed 2-3 major cracks in the flexural section, with the main cracks consistently located on the extension line of the loading point. The key-tooth connection of the composite beam was safe and reliable. (2) UHPC has a significant effect on the cracking load and peak load of composite beams. With the increase of Lu/L from 0 to 0.75, the cracking load and peak load increased by 130.2% and 38.3%, respectively. The peak loads of composite beams UN-HB2 and UN-HB3 can reach 97.6% and 98.7% of the full UHPC beam (UB). (3) With the UHPC ratio increasing from 0 to 0.25, 0.5 and 0.75, the displacement ductility is increased by 22.1%, 13.7% and 12.1%, respectively. The results indicate that UHPC-NC composite beams exhibit superior deformation capacity compared with beam NB, and the incorporation of UHPC can effectively enhance the mechanical performance of beams. (4) During the service phase, the bridging effect of the steel fibers within the UHPC matrix ensures that the UHPC matrix retains considerable tensile strength even after cracking, and working synergistically with reinforcements. Consequently, the stiffness of UN-HB1, UN-HB2 and UN-HB3 increased by 7.8%, 31.7% and 34.2% compared to NB, respectively. The damage of the composite beams appeared after the yield load, the rate of damage development decreased with the increasing UHPC proportion. (5) During the flexural loading of UHPC-NC composite beams, the bridging effect of the steel fibers within the UHPC matrix ensures that the UHPC matrix retains considerable tensile strength even after cracking, and working synergistically with reinforcements. Consequently UHPC-NC composite beams exhibit superior flexural performance compared to NC beams. The composite beams with Lu/L ≥ 0.5 can basically achieve the mechanical properties of UHPC beam. This paper suggests that the optimal theoretical design value Lu/L = 0.5 for this type of UHPC-NC composite beam. (6) A mid-span deflection calculation model of the UHPC-NC composite beams was derived based on the variable stiffness non-equal section beams and the principle of minimum stiffness. The comparison with experimental curves demonstrates that the calculated curves agree well with the test curves, which can reflect the load-deflection relationship of composite beams. (7) This study demonstrates the feasibility of replacing NC with UHPC at the mid-span of composite beams. A design recommendation for the Lu/L and a reliable mid-span deflection calculation model are proposed, providing a theoretical foundation for the design and deformation prediction of UHPC-NC composite beams. It is acknowledged that, due to limitations of material cost and manufacturing processes, the number of test specimens is limited, and the influence of key parameters requires further systematic study.
Footnotes

Funding
The authors disclosed receipt of the following financial support for the research, authorship, and/or publication of this article: This research is supported by the Shaanxi Natural Science Basic Research Program (2025JC-YBMS-464). Their supports are sincerely appreciated.
Declaration of conflicting interests
The authors declared no potential conflicts of interest with respect to the research, authorship, and/or publication of this article.