
Abstract
Thickness of thermal barrier coating (TBC) system of gas turbine blades is one of the pivotal parameters that significantly affects its thermal insulation capacity and other working performance, and therefore, is essential to be properly evaluated non-destructively. It is still lack of efficient nondestructive evaluation technique to evaluate the thickness of TBC of a large area. In this paper, the pulsed laser array spots thermography method was adopted to measure the thickness of TBCs by using time at the minimum 2nd logarithmic derivative of the cooling stage of the temperature evolution curve. Both numerical and experimental validations are conducted and the results demonstrated the validity of the proposed method for coating thickness evaluation of TBC specimens fabricated by using the atmospheric plasma spraying technique.
Introduction
In high temperature aerospace structures and heavy duty gas turbine blades etc., thermal barrier coating (TBC) system plays an essential role for shielding critical structure from overheating and is for ensuring its structural integrity. 1 TBC consists of top coating (TC) layer of ceramics, bond coating layer (BC) and substrate of high temperature alloy. TC is a crucial part of the TBCs, which repels the advancement of heat, and thereby limits its penetration into the substrate of turbine blades. In addition to providing thermal insulation, TBCs can also protect against oxidation and corrosion of the substrate, thus prolongs its service life. 2 The thinning of the TC directly affects the working performance of TBC system, and therefore has to be quantitatively evaluated after its fabrication (preservice inspection: PSI) and during maintenance (in-service inspection: ISI).
For the TBC thickness measurement, destructive evaluation methods such like the micro-structure analysis cause change in the structure itself and cannot be applied for PSI and ISI of the TBC system. Nondestructive evaluation (NDE) techniques are necessary to ensure the bonding quantity and TBC thickness. Eddy current testing (ECT) is adopted for the NDE of TBC for evaluating both the TC thickness and size of crack penetrated to the substrate material. 3 However, the evaluation accuracy and efficiency of ECT are limited in view of efficient NDE of a large area. On the other hand, terahertz NDE method is considered efficient for the TBC thickness evaluation. 4 A complex testing system and transducer, however, are necessary for the THz method, which makes it difficult to be widely applied in practice.
Recently, the infrared thermography (IRT) method was studied for the thickness measurement of thin coating layers. Steven Shepard found that the peak time of the logarithmic time derivative of temperature evolution curve increases with the layer thickness. 5 This method was later used by other scholars to evaluate TC thickness of the TBC system. Zhao et al. 6 used pulsed thermography logarithmic peak second-derivative method for the thickness evaluation. Huang et al. 7 applied the active long pulse thermography and the time of the minimum 2nd derivative of the temperature evolution curve during the cooling stage for coating thickness evaluation. The thickness of non-uniform coating samples can be measured by this method with a relative error of 5%. Another feature parameter commonly used to characterize the coating thickness is the phase of the thermal signals. Zhang et al. 8 used the lock-in IRT to get the phase information for quantitative evaluation of the coating thickness at a specific frequency.
For IRT method evaluating the coating thickness, the heating method gives a significant influence on its efficiency and precision. Though the commonly used halogen lamp and flash lamp heating source are convenient, they are of low and non-uniform energy intensity and require a long heating time and even black surface painting to ensure sufficient excitation heat flux. Yang 9 used homogenizing laser to the thickness evaluation of the unpainted ultra-thin TBC. However, it still has shortcomings like uneven heating and small measurement area. In addition, Unnikrishnakurup et al. also found that the pulsed IRT is more efficient to evaluate the coating thickness with its phase information.10,11 Qiu et al. 12 proposed laser array spots thermography (LAST) for detecting and sizing surface crack. The LAST has advantage to be used for the thickness evaluation of TBCs as the laser array spots enables a relative large area to be evaluated at the same time.
In this paper, the pulsed LAST was studied for the large area thickness evaluation of TBCs. Compared with the other heating source, LAST has advantage of higher heat power density and larger heating area. As the overall thickness can be quantitatively characterized by using the time at the minimum 2nd logarithmic derivative of the temperature signal at center part of laser spot, the thickness distribution of a relative large area can be evaluated efficiently. The feasibility of the propose method was verified by using the thermal signals simulated with an FEM numerical model and measured with a pulsed LAST system developed by authors. 13 Both results demonstrated a high efficiency and accuracy of the pulsed LAST method for thickness evaluation of the TBC system.
Principle and numerical validation
Principle and setup of the pulsed LAST system
The diagram of the pulsed LAST system using array laser spots as the heating source is as that shown in Figure 1. The laser shaper unit is the key component of this new laser IRT system. Figure 2 shows the structure and principle of the laser shaper, which consists of an adjustable lens tube, a collimating lens and a diffractive optical element (DOE). The laser beam produced by the air-cooled laser generator is collimated by the collimating lens at first, and then directed onto the specimen surface as array laser spots via the DOE unit. The number, size and the distance between each laser spot can be adjusted by using a proper DOE and focusing distance. The thermal image of the inspection target is measured with a infrared camera and digitized to computer for further image processing and feature parameter extraction.14,15
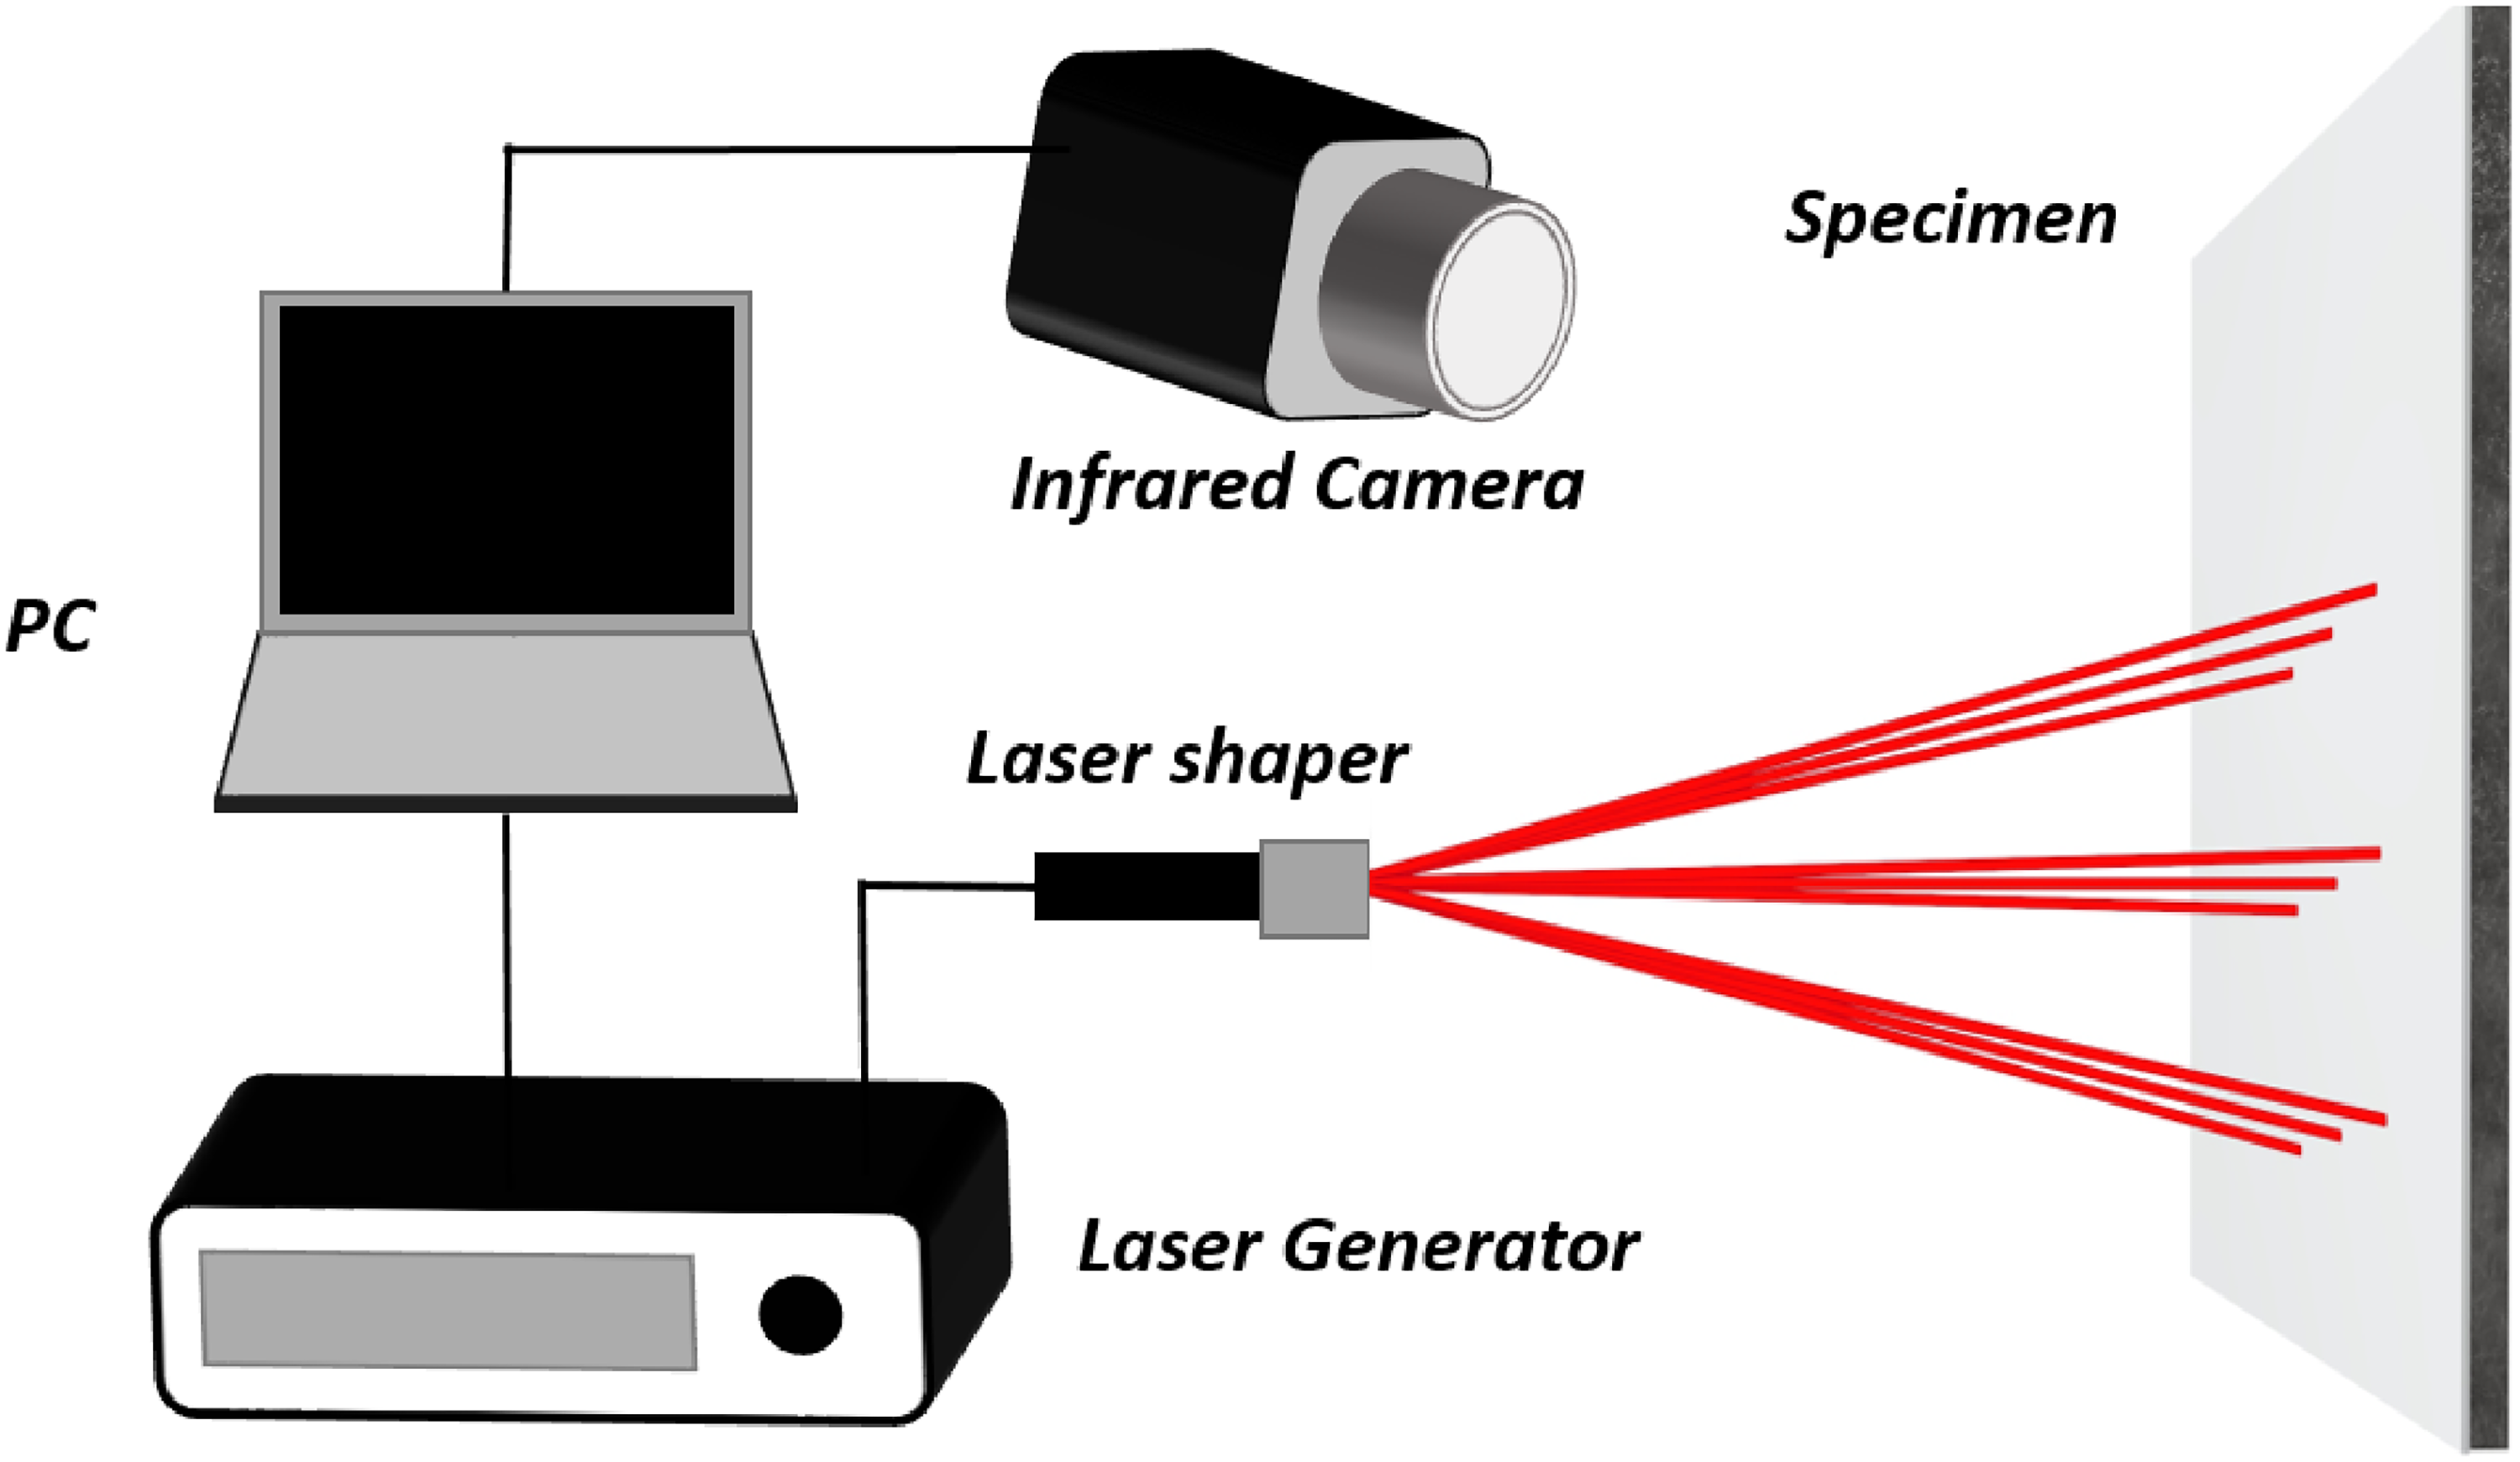
Key components and structure of the pulsed LAST system.
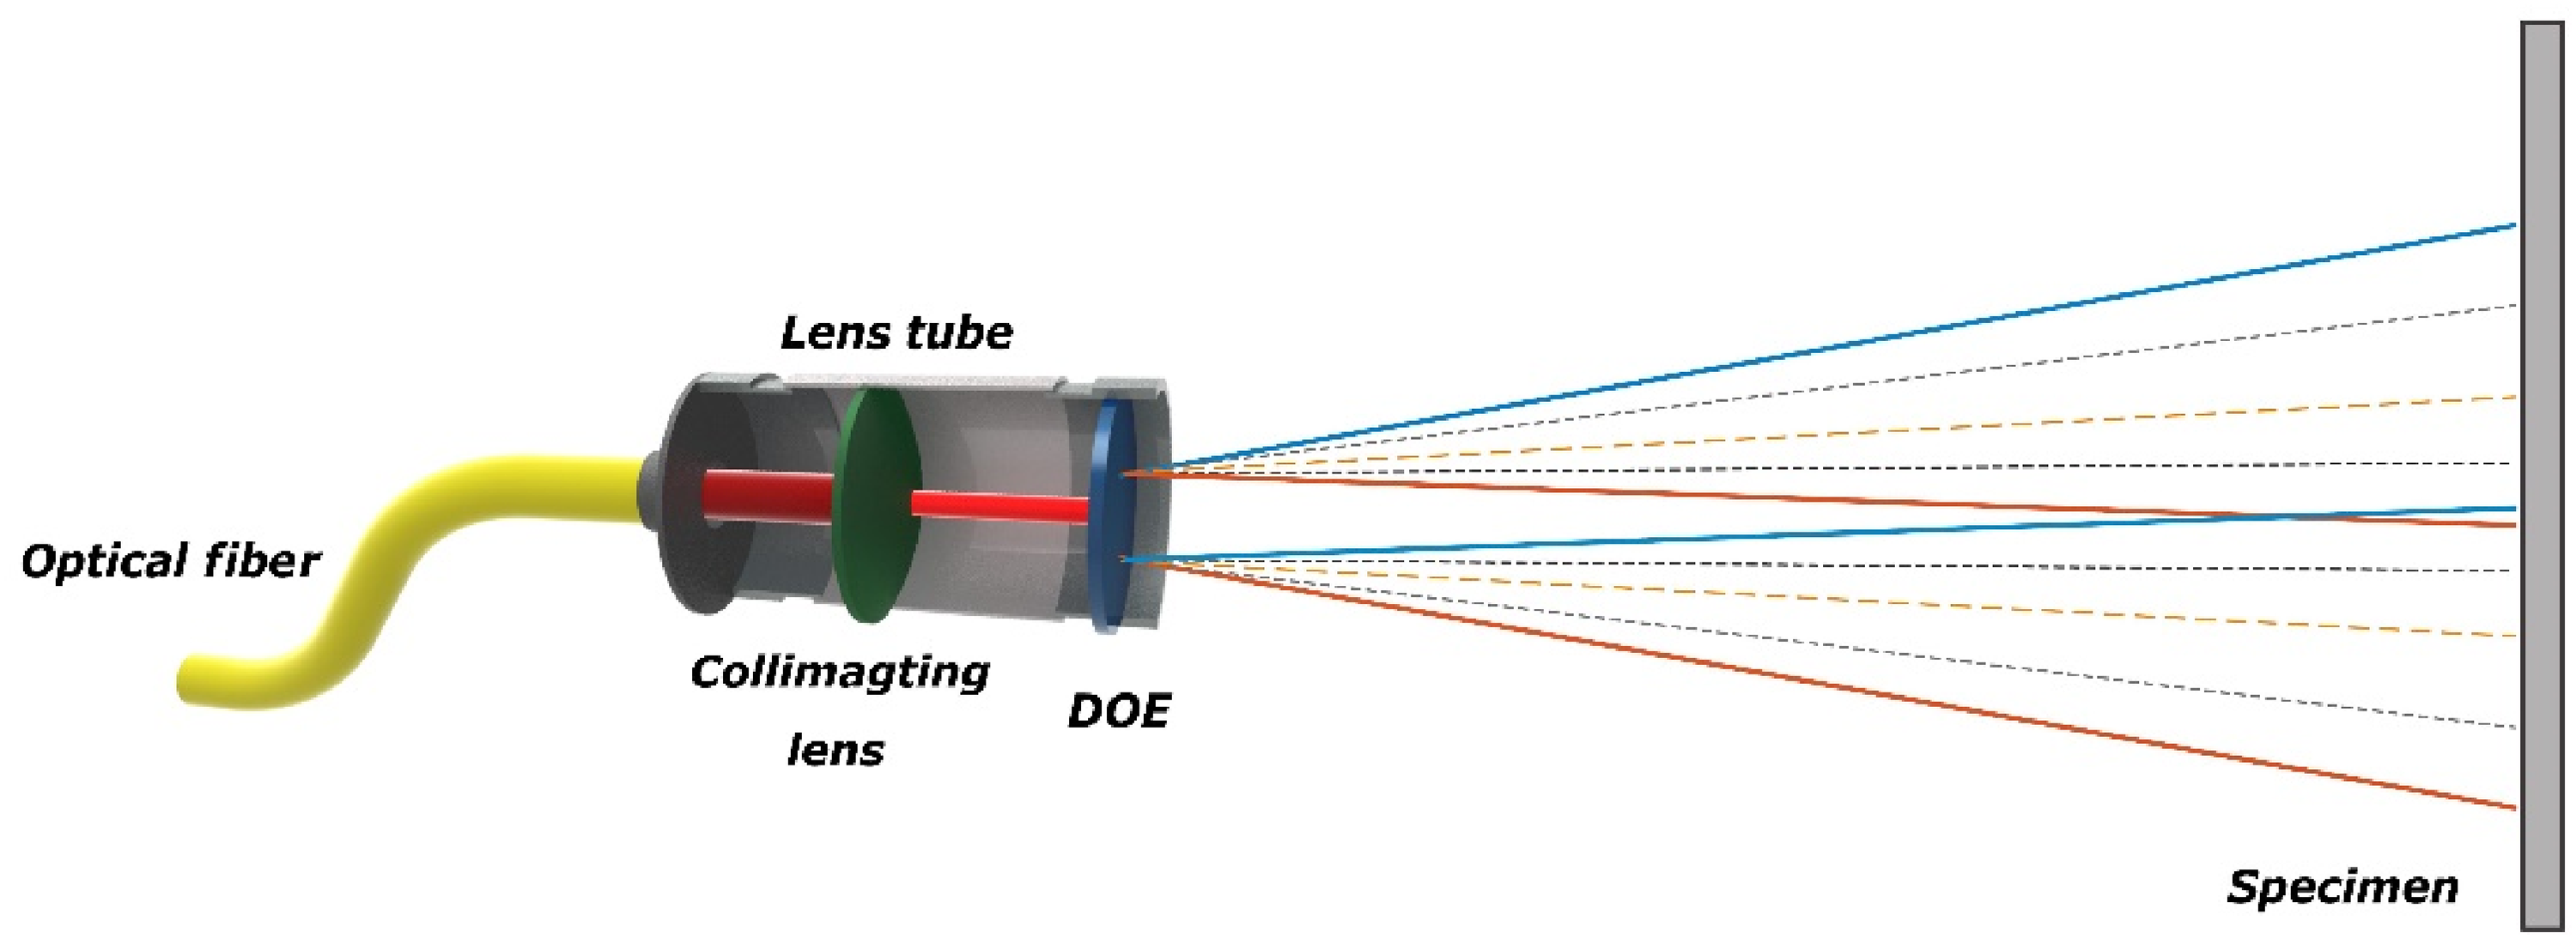
The structure of the laser shaper and principle to generate the laser array spots.
FEM simulation model and results
In paper, 16 an analytical solution of 1D heat conduct equation was used to investigate the correlation between the layer thickness and temperature evolution curve. However, the thermal field of the pulsed LAST of a practical specimen is complicated, particularly when the heat source is localized at a limited spot. Heat conduction occurs in both the surface and thickness directions of the specimen, i.e., the analytical solution cannot fulfill the requirement of thermal field simulation. Therefore, a code of finite element method developed by authors is adopted to investigate the feasibility of the pulsed LAST for TC thickness evaluation numerically.13,17 The time evolutions of the temperature field at the specimen surface heated by different pulsed laser spots are simulated to select proper parameters of the pulsed LAST system.
As shown in Figure 3, a numerical model of 3 layers is established to simulate the temperature field of a rectangular plate with TBC heated by a 6 by 6 array spots laser. The temperature fields at the top surface when it is exposed to the laser spots are calculated for TBCs of different TC thicknesses. Both the length and width of the specimen plate are 60 mm (in x and y directions), while the thickness of the bond coating and substrate layer are 100 μm and 3 mm respectively. The thickness of the top coating is set between 50 μm to 600 μm to investigate the influence of the TC thickness on the temperature signals. The diameter of each laser spot is set as 4 mm and the duration of the laser pulse is set to 3 s. The temperature evolution of 10 s total time is simulated to get the heating and cooling behaviors of the specimen. The thermophysical properties of TBC materials at room temperature listed in Table 1 are adopted in the numerical simulation. 200 uniform hexahedron finite elements are meshed in both the x and y direction while the elements of 0.01 mm size are meshed in the thickness direction. By using the constant time step of 0.01 s, the temperature field of the 10 s duration are calculated by solving the FEM thermal equations step by step.
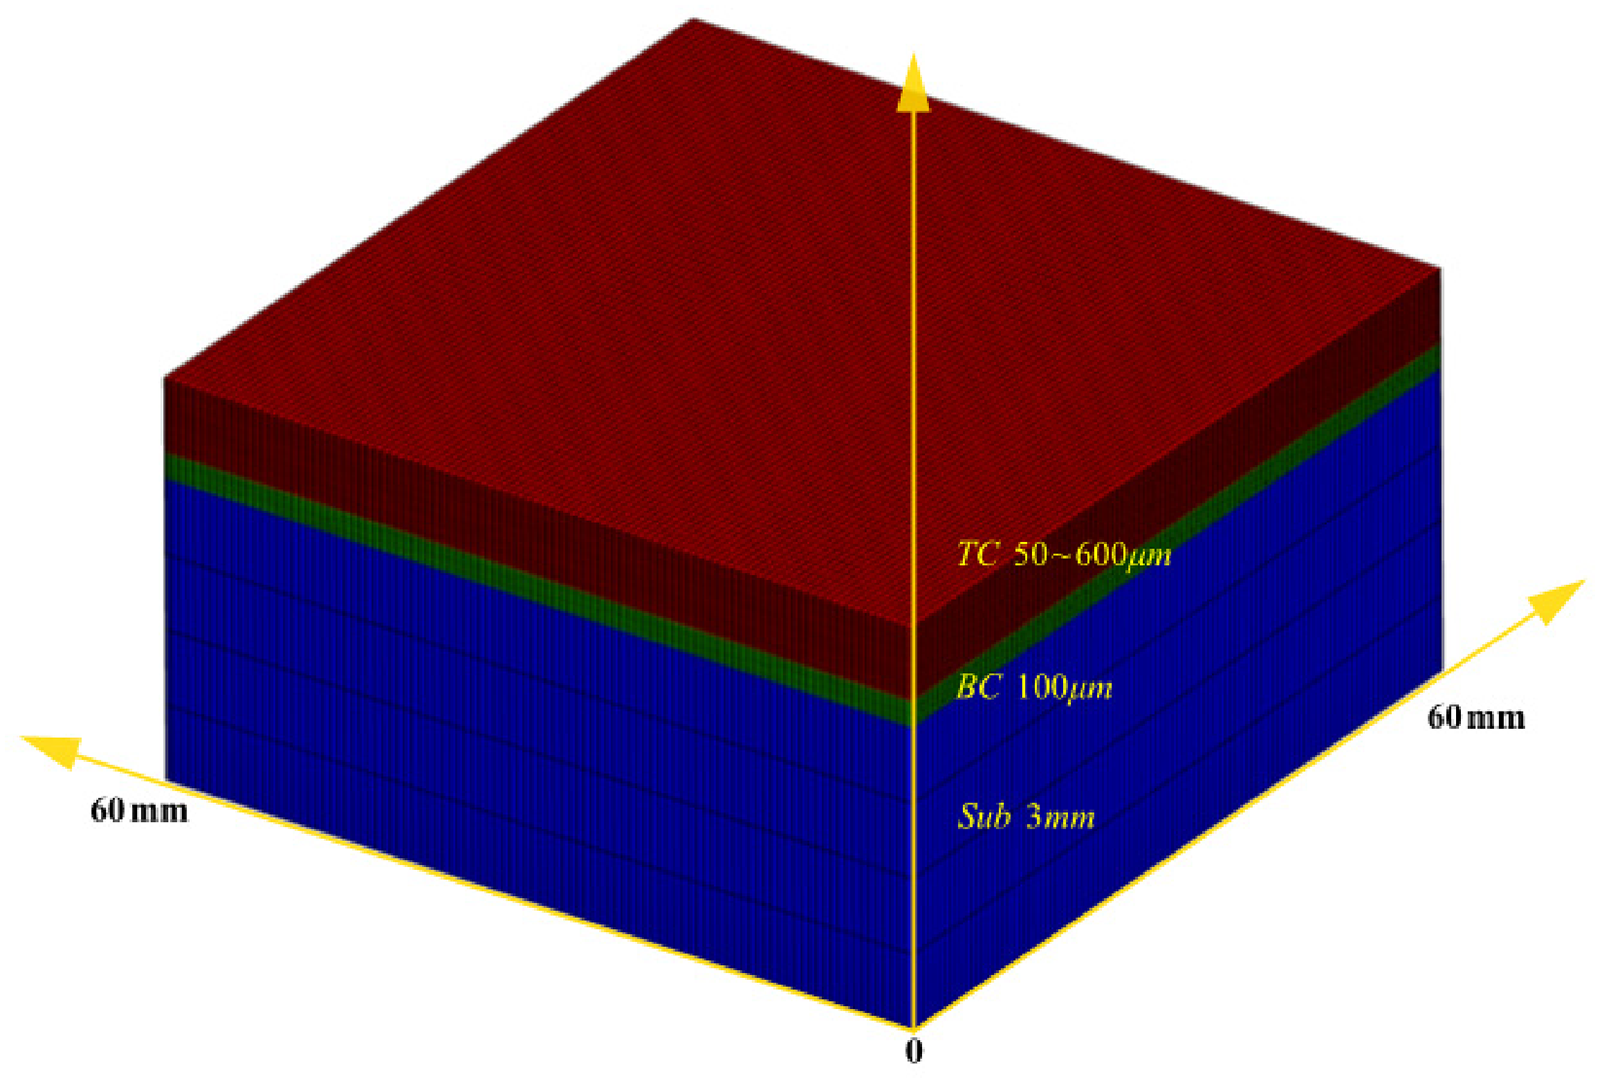
Numerical model of the LAST of TBC.
Thermal properties of the material of different layers.
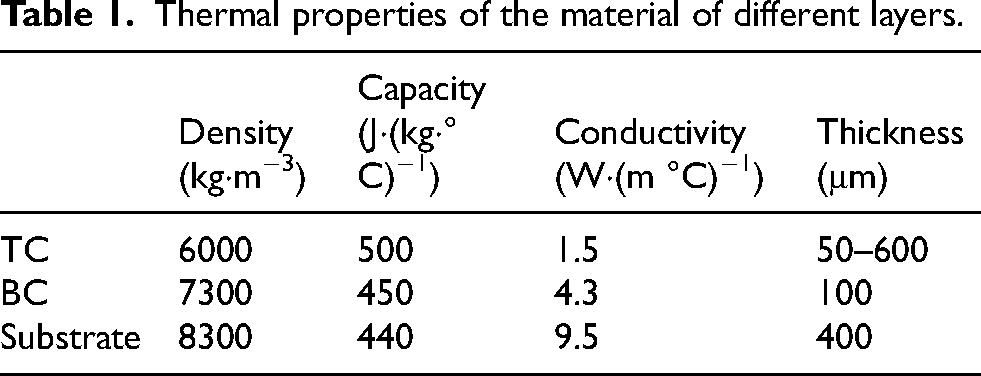
Figure 4 gives a typical numerical result of the temperature field at the specimen surface heated by the 36 laser spots at the time instant of 3 s. In case of a suitable spot spacing distance (6 mm in this case), the time evolution curves of the temperature at the center of each laser spot are almost consistent, i.e., the interference between different laser spots is negligible small for present spot distance and heating duration. In view of this phenomena, the temperature fields due to only one laser spot are used for further study on the influence of the TBC thickness on the thermal field distributions.
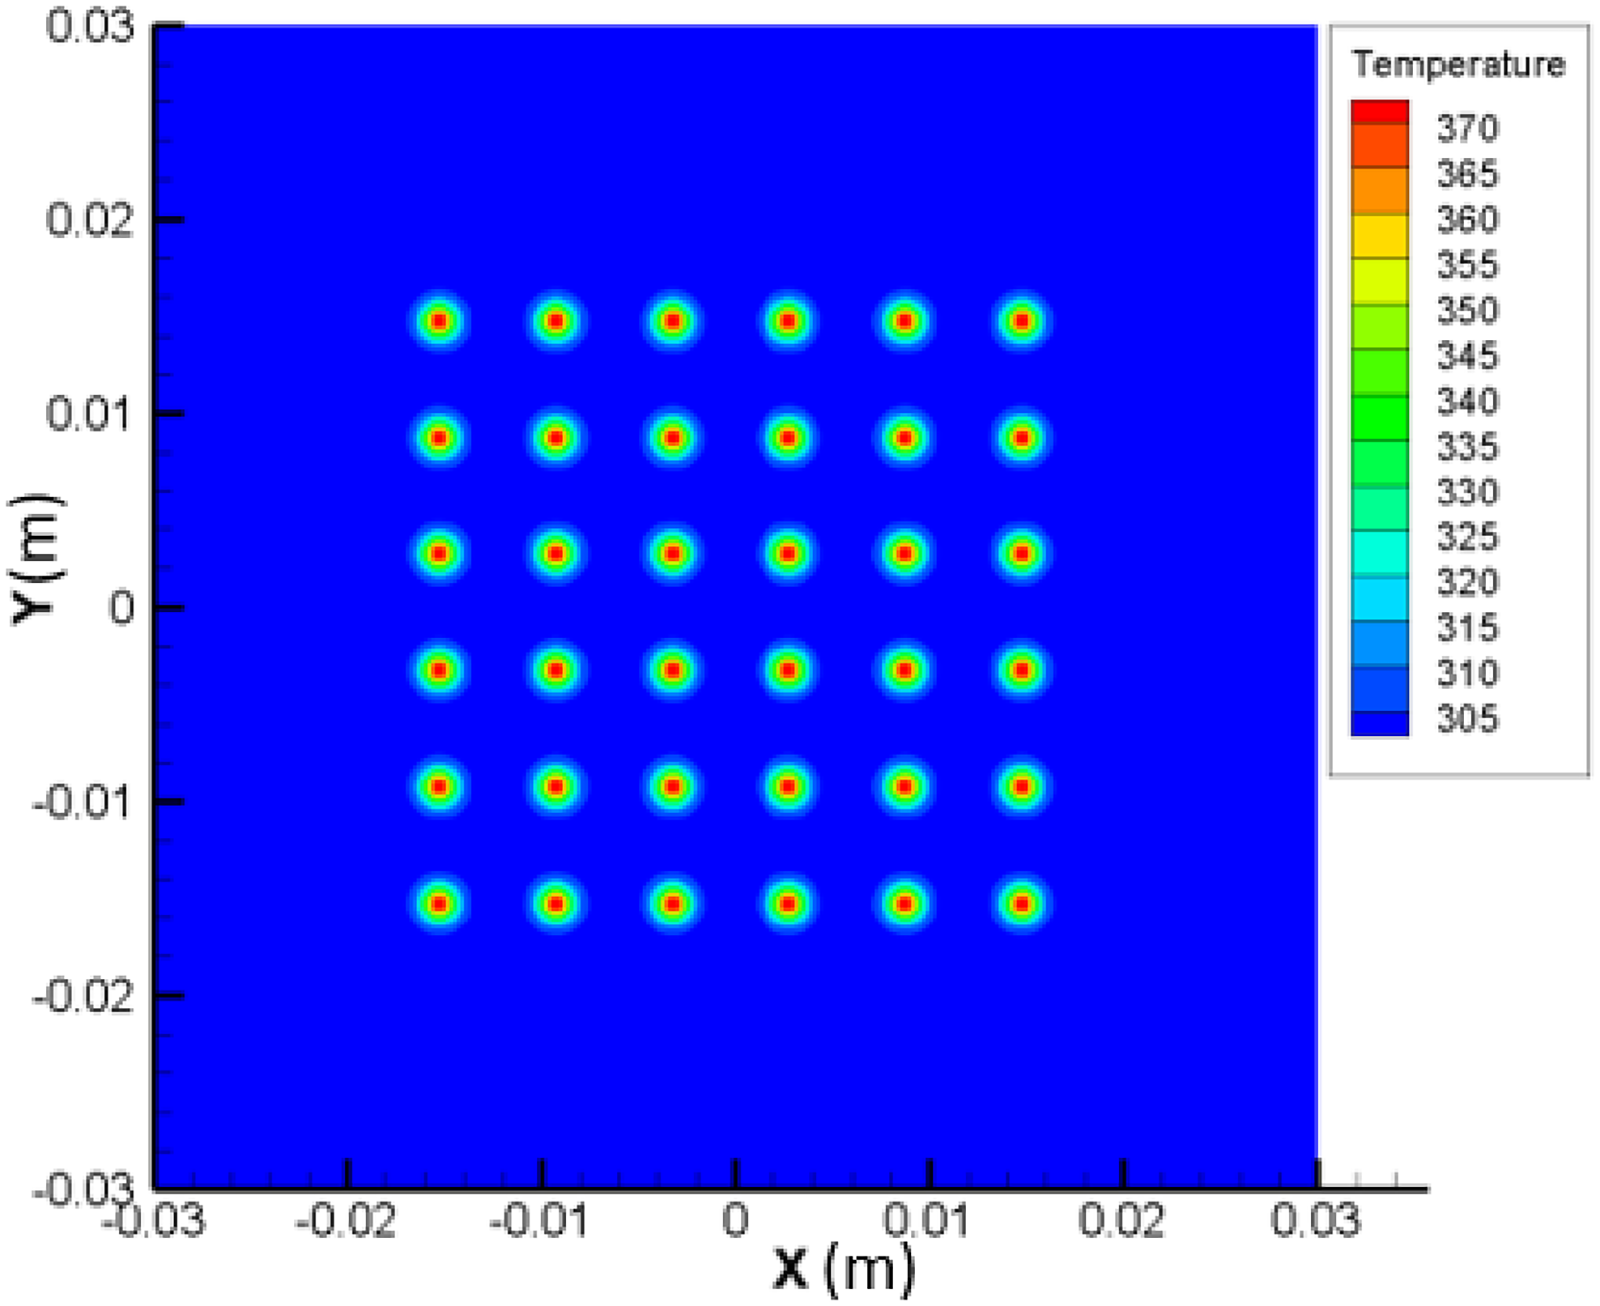
A typical numerical result of temperature field of the LAST.
As shown in Figure 5, thermal conduction through TC has a higher resistance than thermal conduction through the substrate. For smaller TC thicknesses, the heat flux from the surface is more easily transmitted to the substrate, which accelerates the surface cooling process after removing the heat source. Therefore, compared to thinner coatings, thicker coatings have a higher surface temperature and will experience a slower temperature decrease during the cooling stage compared with a coating of thinner thickness, while the highest temperature appears at the same instant of heat flux terminating time for different thickness.
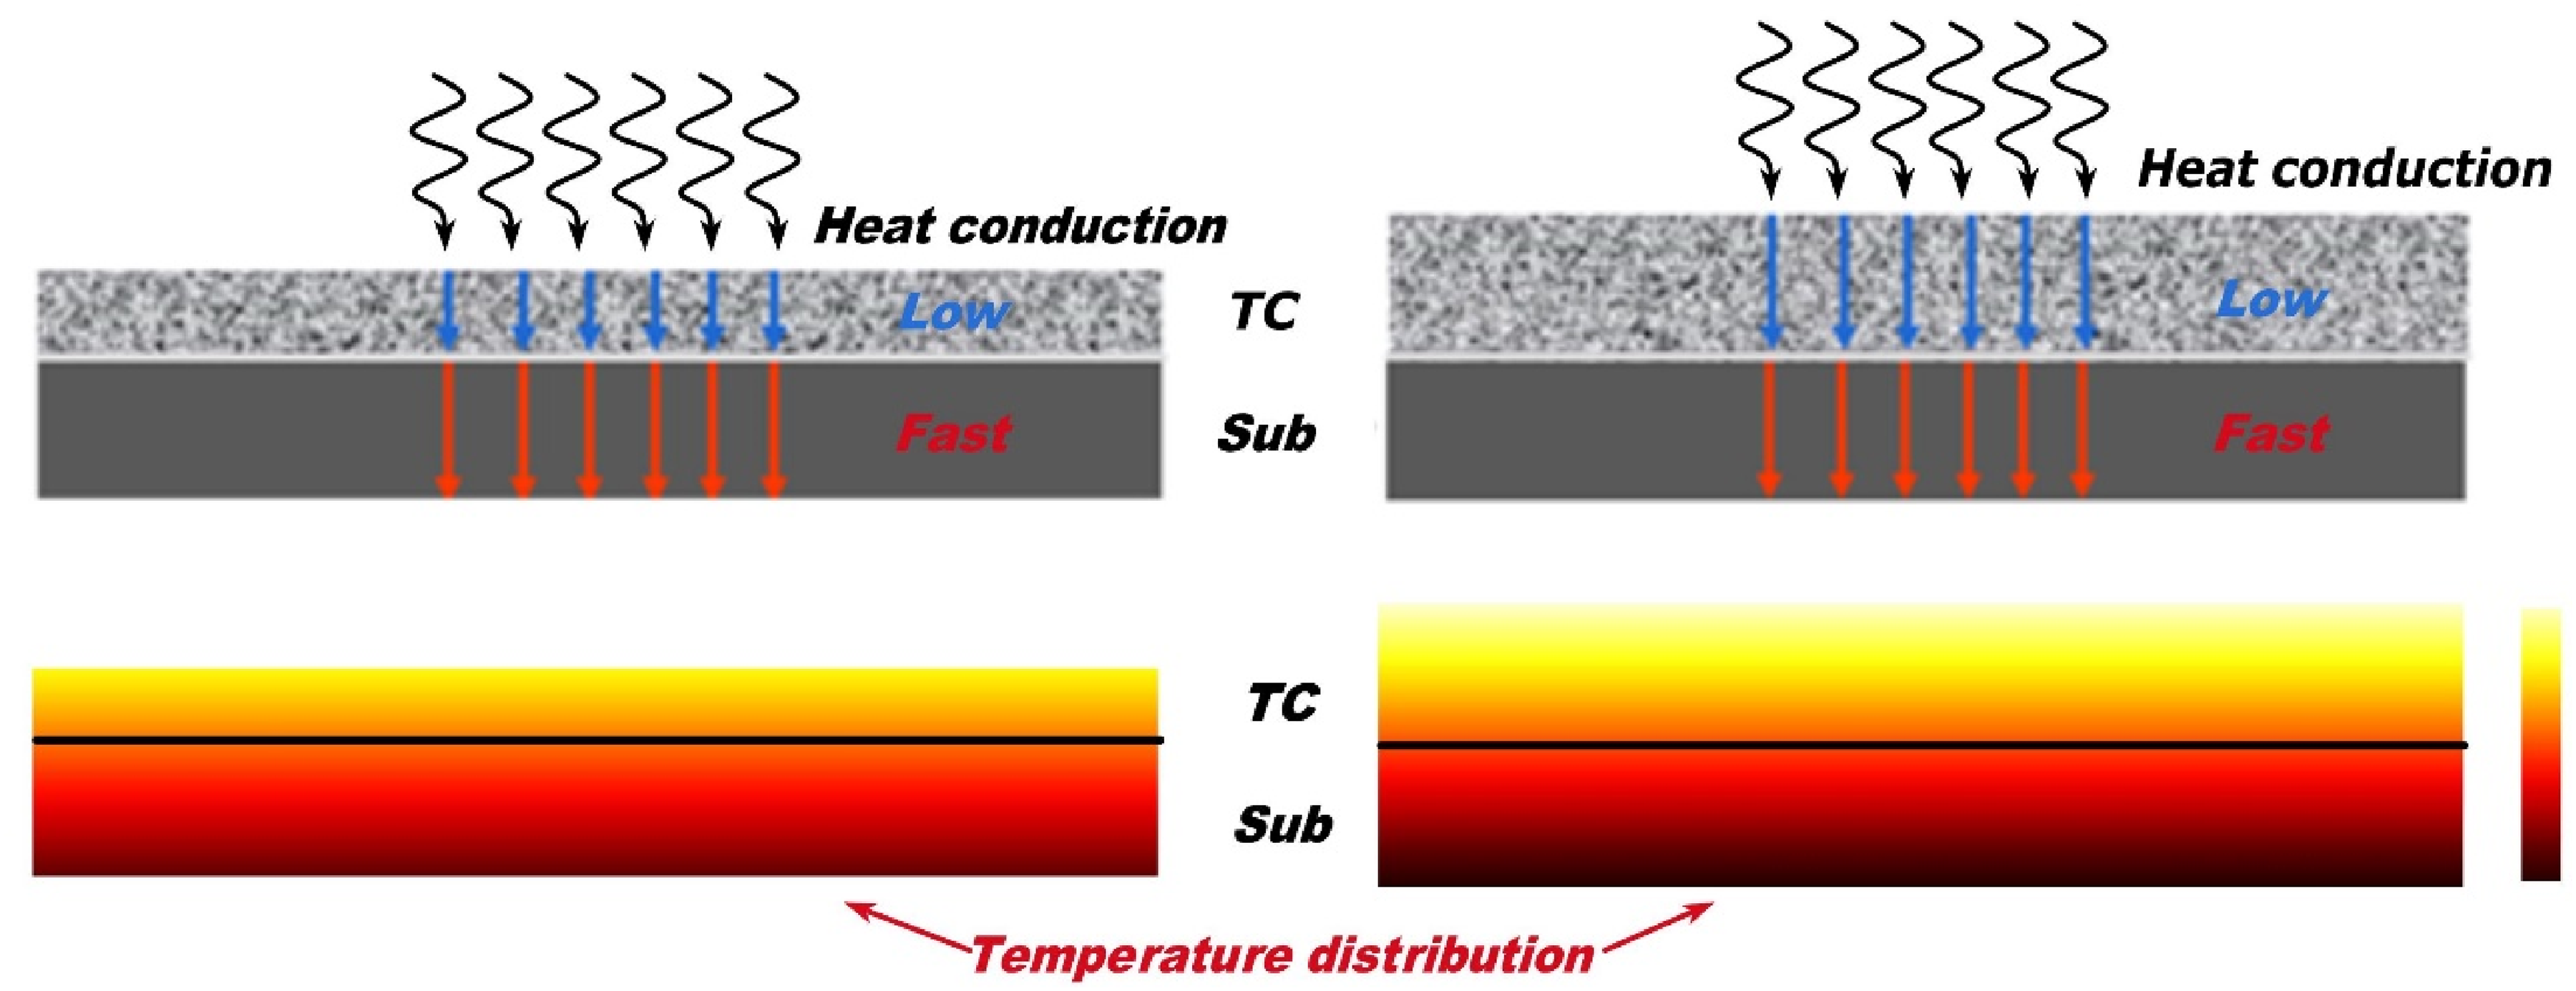
Heat conduction process through TBC with TC of different thickness.
Figure 6 illustrates 3D numerical results of temperature evolution curves at center of the laser spot for TCs of different thicknesses. It is evident that the peak temperature at the end of the heating stage rises with the enlarged TC thickness, which suggests a unique correlation between the peak temperature and TC thickness. However, the absolute surface temperature is easily to be influenced by varying laser absorptivity of specimen due to the complex surface conditions in practice. On the other hand, the cooling stage of temperature evolution curve at the selected point are different. So derivative and second derivative of the cooling stage which does not affect by the laser absorptivity can be used for thickness measurement. The minimum time of the second logarithmic derivative is chosen because it is easier to observe differences in different thickness compared to the derivative and second derivative. From the cooling stage curve, the logarithmic second-order derivatives Tlog of the curve can be extracted, and the minimum value of Tlog at time instant tmin can be adopted to evaluate the TC thickness. The detailed procedure to extract the feature parameter tmin is as follows:
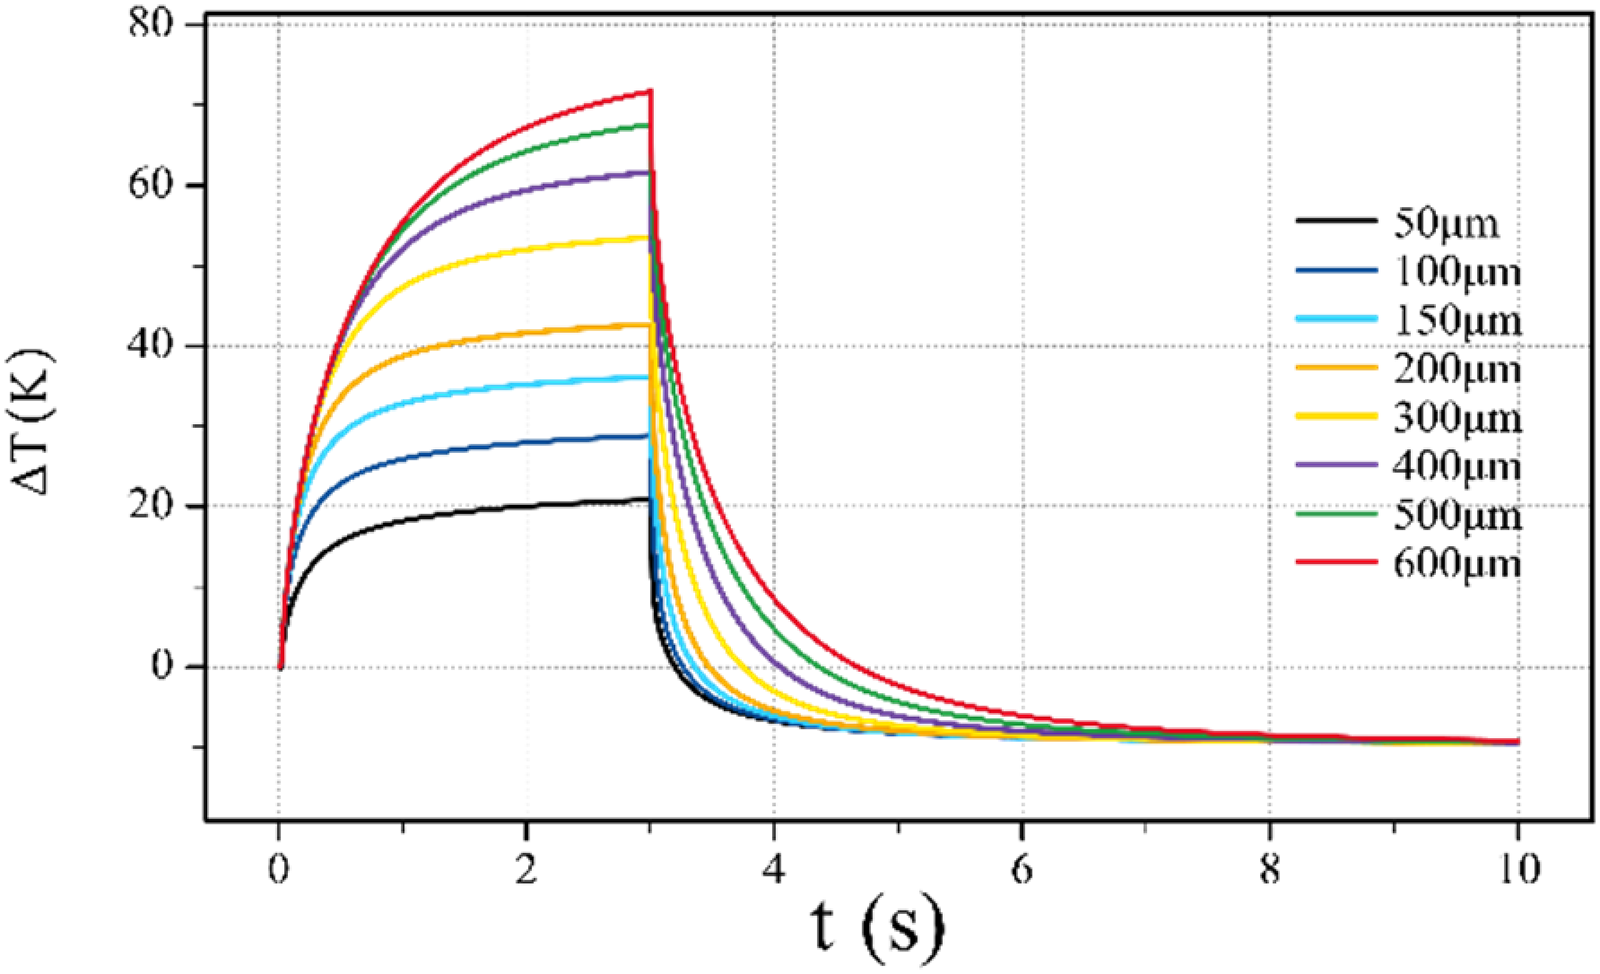
Temperature-time curve of coatings.
Step 1: Fit the temperature at the center of laser spot Tfit from the temperature evolution curve of cooling stage based on the exponential base function using Eq.(1), i.e., to determine the coefficients a, b, c, f of equation (1) from the data of temperature evolution curve with use of the least square method.
Step 2: Calculate the second logarithmic derivative Tlog with Eq.(2)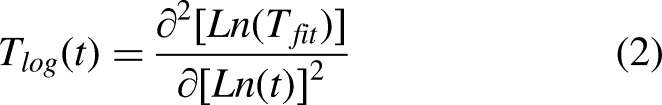
Step 3: Determine time tmin at which minimum Tlog value occurs, from the second logarithmic derivative Tlog values obtained in Step 2.
Based on the procedure above, the Tlog curves of different TC thickness are calculated and shown in Figure 7. Each Tlog curve of each TC thickness in Figure 7 has a time instant tmin at which Tlog has minimum value. One can find that the thinner the TC, the earlier the tmin (time of minimum Tlog). The tmin values for each thickness in Figure 8 are the tmin values of Tlog curves for different thicknesses in Figures 7 and 8 gives correlation of the TC thickness and the tmin. One can find that the relationship between the TC thickness and tmin is almost linear especially in a range of relative large TC thickness.
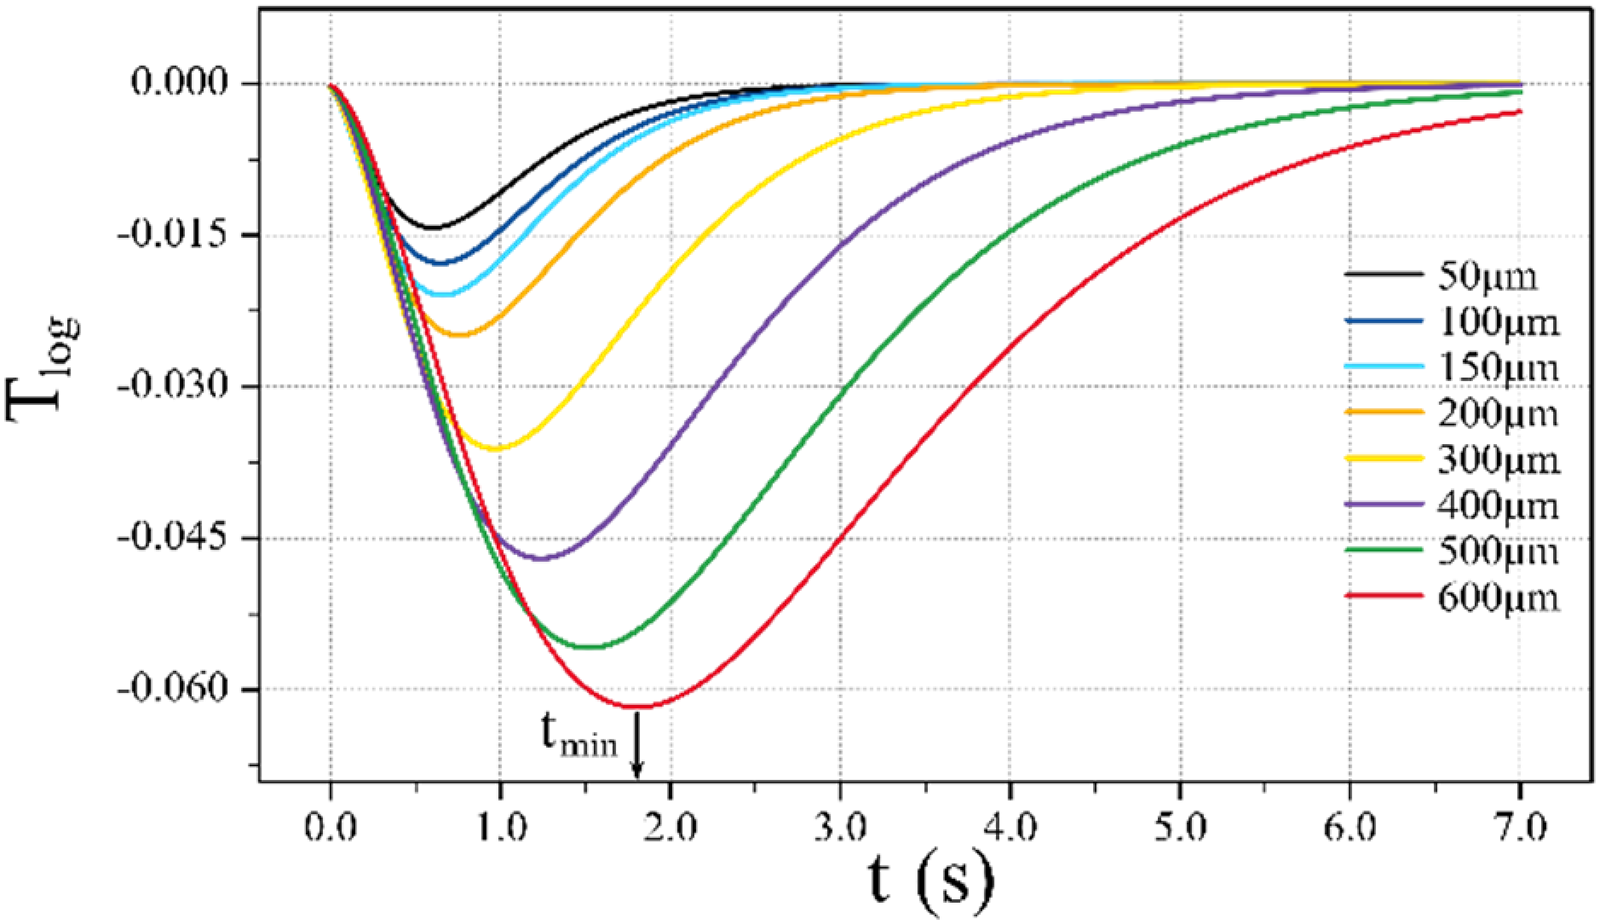
The Tlog curves and tmin of coatings.
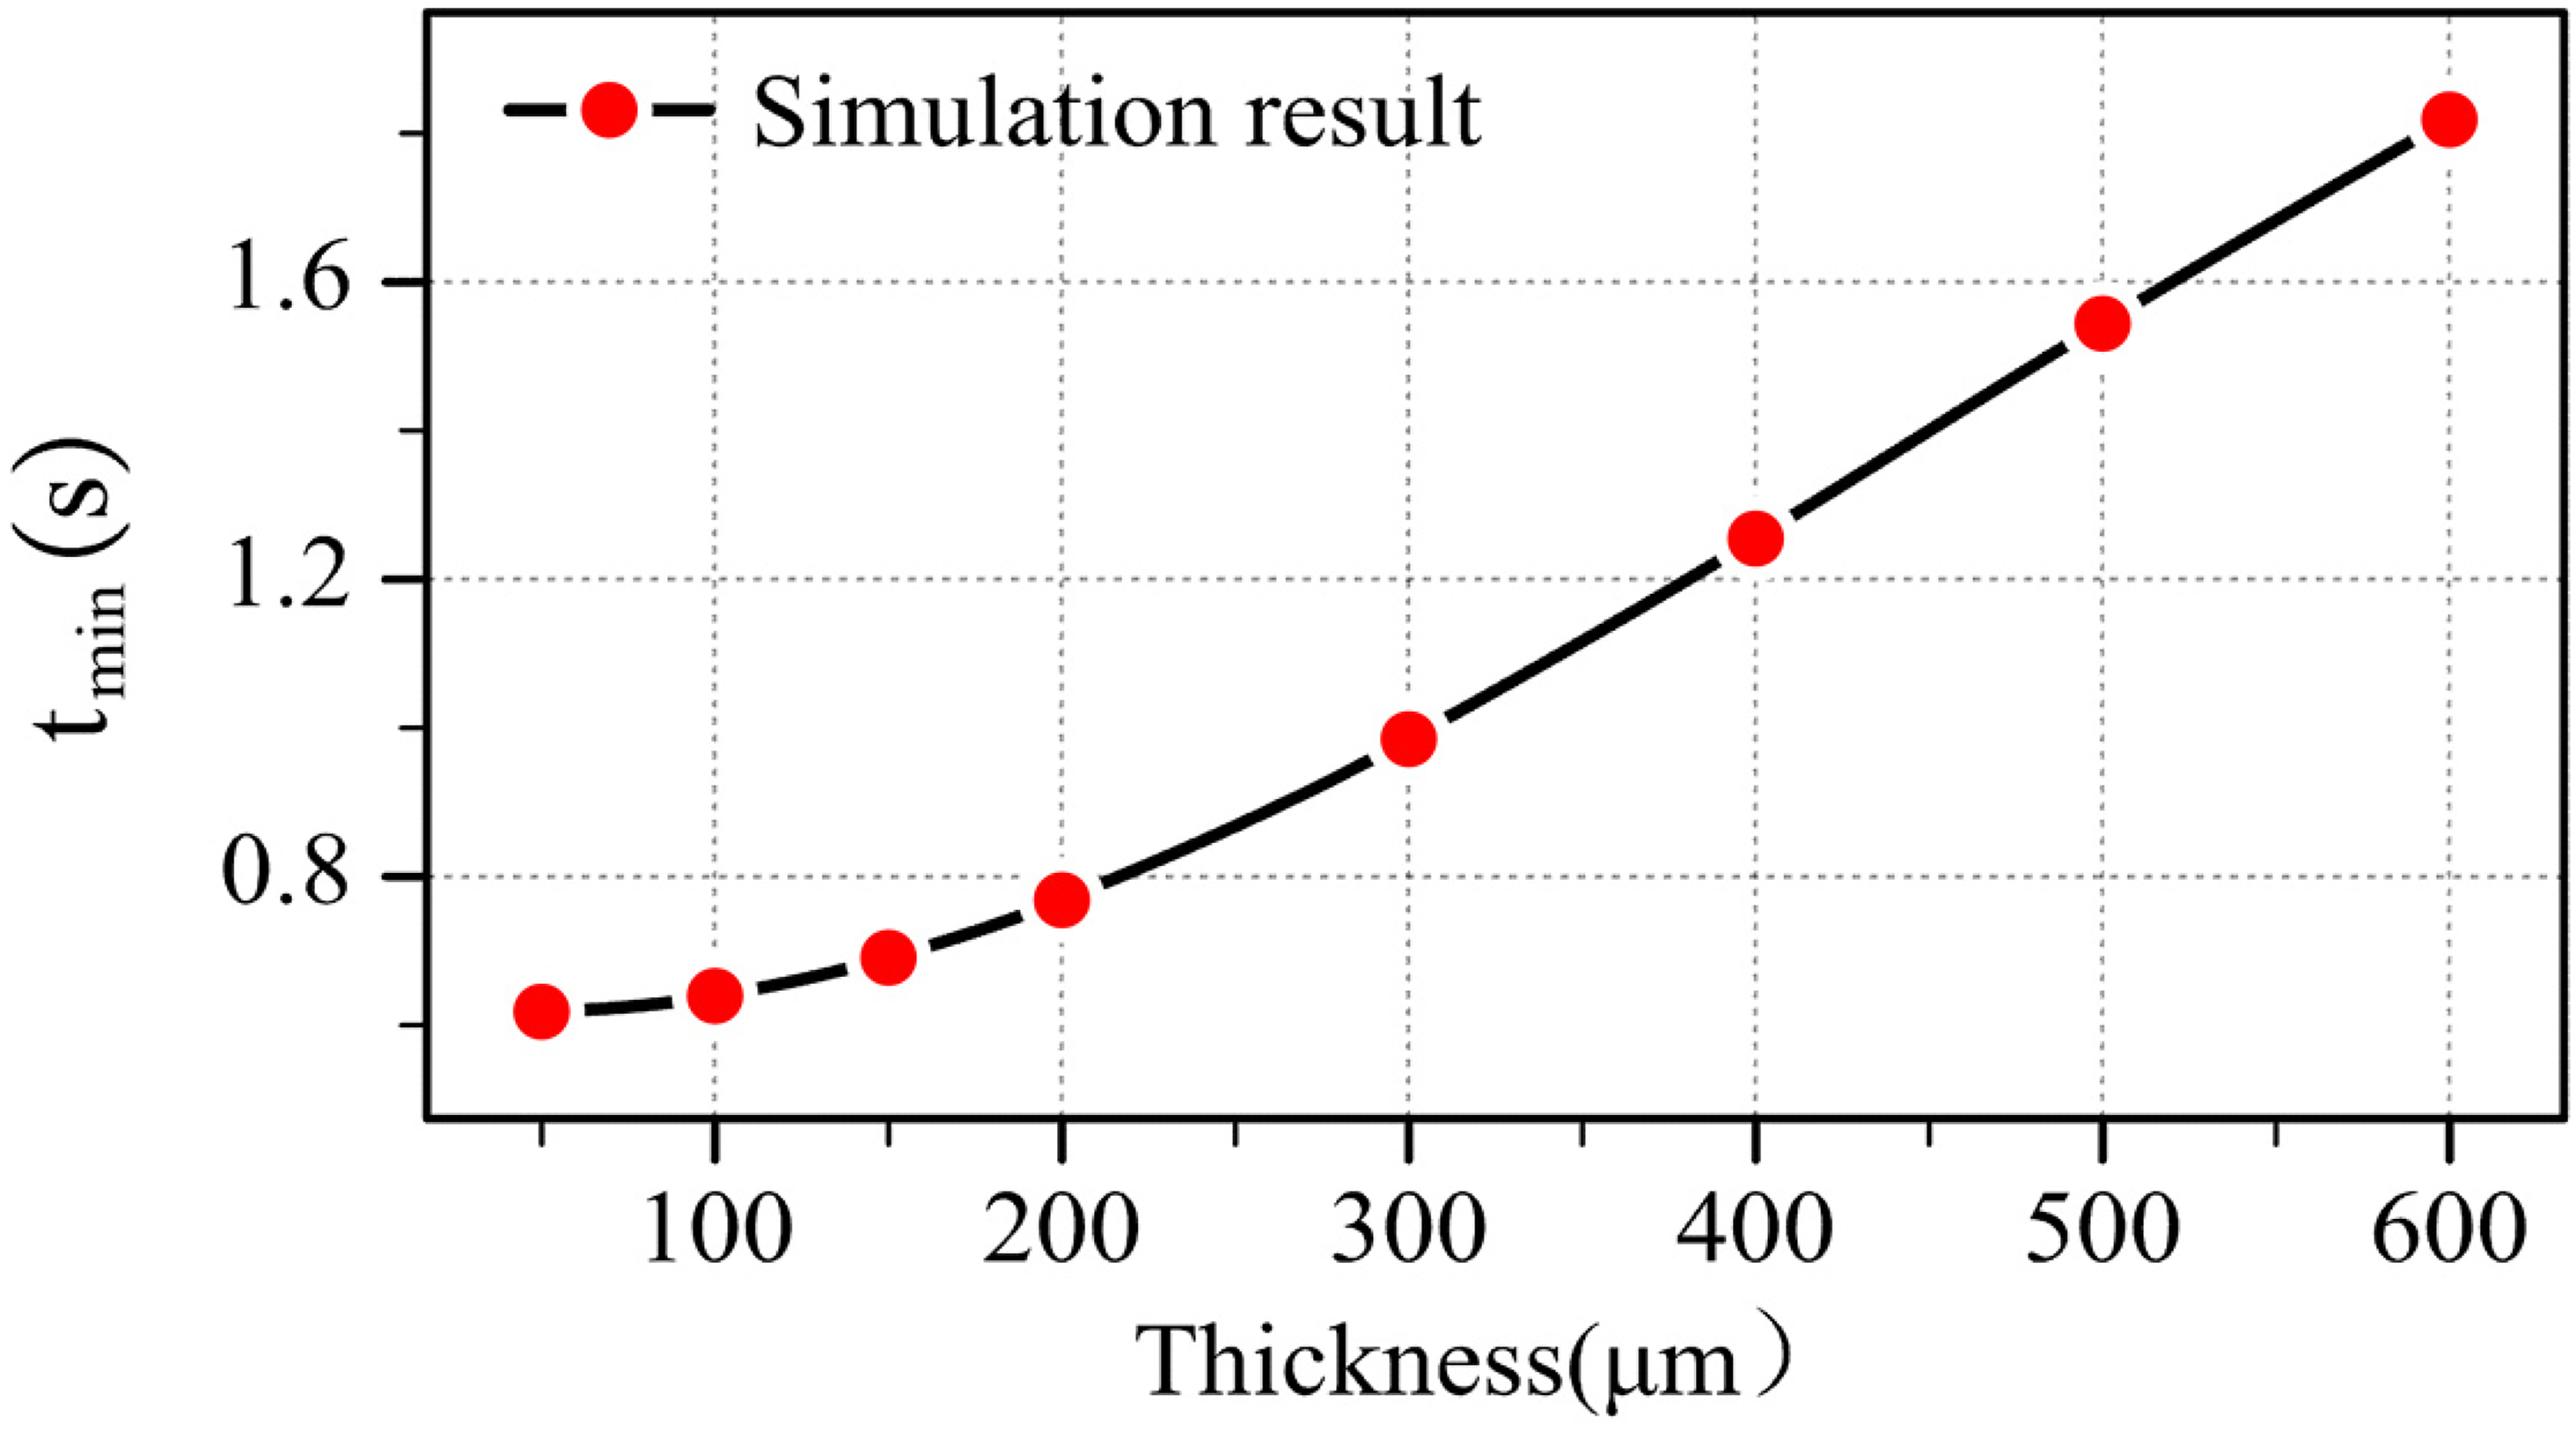
The correlation between TBC thickness and tmin.
In Figure 7, a nonlinear increasing trend emerges when the coating thickness is relative small, e.g, 50–200 μm, though the tmin is of relative small values. This is reasonable because more heat is reflected back to the surface when the temperature reaches the substrate in case of a thinner TC, and the heat of laser spot diffuses more extensively in the surface directions. Due to the surface diffusion, the heat conduction in the thickness direction is weaker for a TC of relative large thickness.
Selection of key parameters of the laser spots array
Diameter of the laser spot (d as shown in Figure 9) and the distance between the adjacent laser spots (D) are two key parameters of the laser array spots. When D/d is very small, the heating area of the adjacent laser spots will be overlapped, and will cause errors in the thickness evaluation based on the correlation curve of Figure 8. Hence, a proper value of D/d is of great importance for the LAST method. By using the FEM model of Figure 3 and TC thickness of 300 μm, the temperature evolution curve and tmin of 6 by 6 points at the central part of a single laser spot are calculated for D/d values of 1.0, 1.5, and 2.0 respectively. Figure 9 shows the simulated temperature at the surface for different D/d ratio. Figure 10 displays the temperature evolution curve at the central points of 3 different laser spots, i.e., the Spot 1, Spot 2 and Spot 3 shown in Figure 9(a). From the numerical results of Figure 10, one can find that the temperature evolution curves of Spot 1 and Spot 2 exhibit nearly identical behavior for different D/d ratios, while the cooling time of Spot 3 becomes a little different for different D/d values because the Spot 3 is at the boundary of the global heating area.
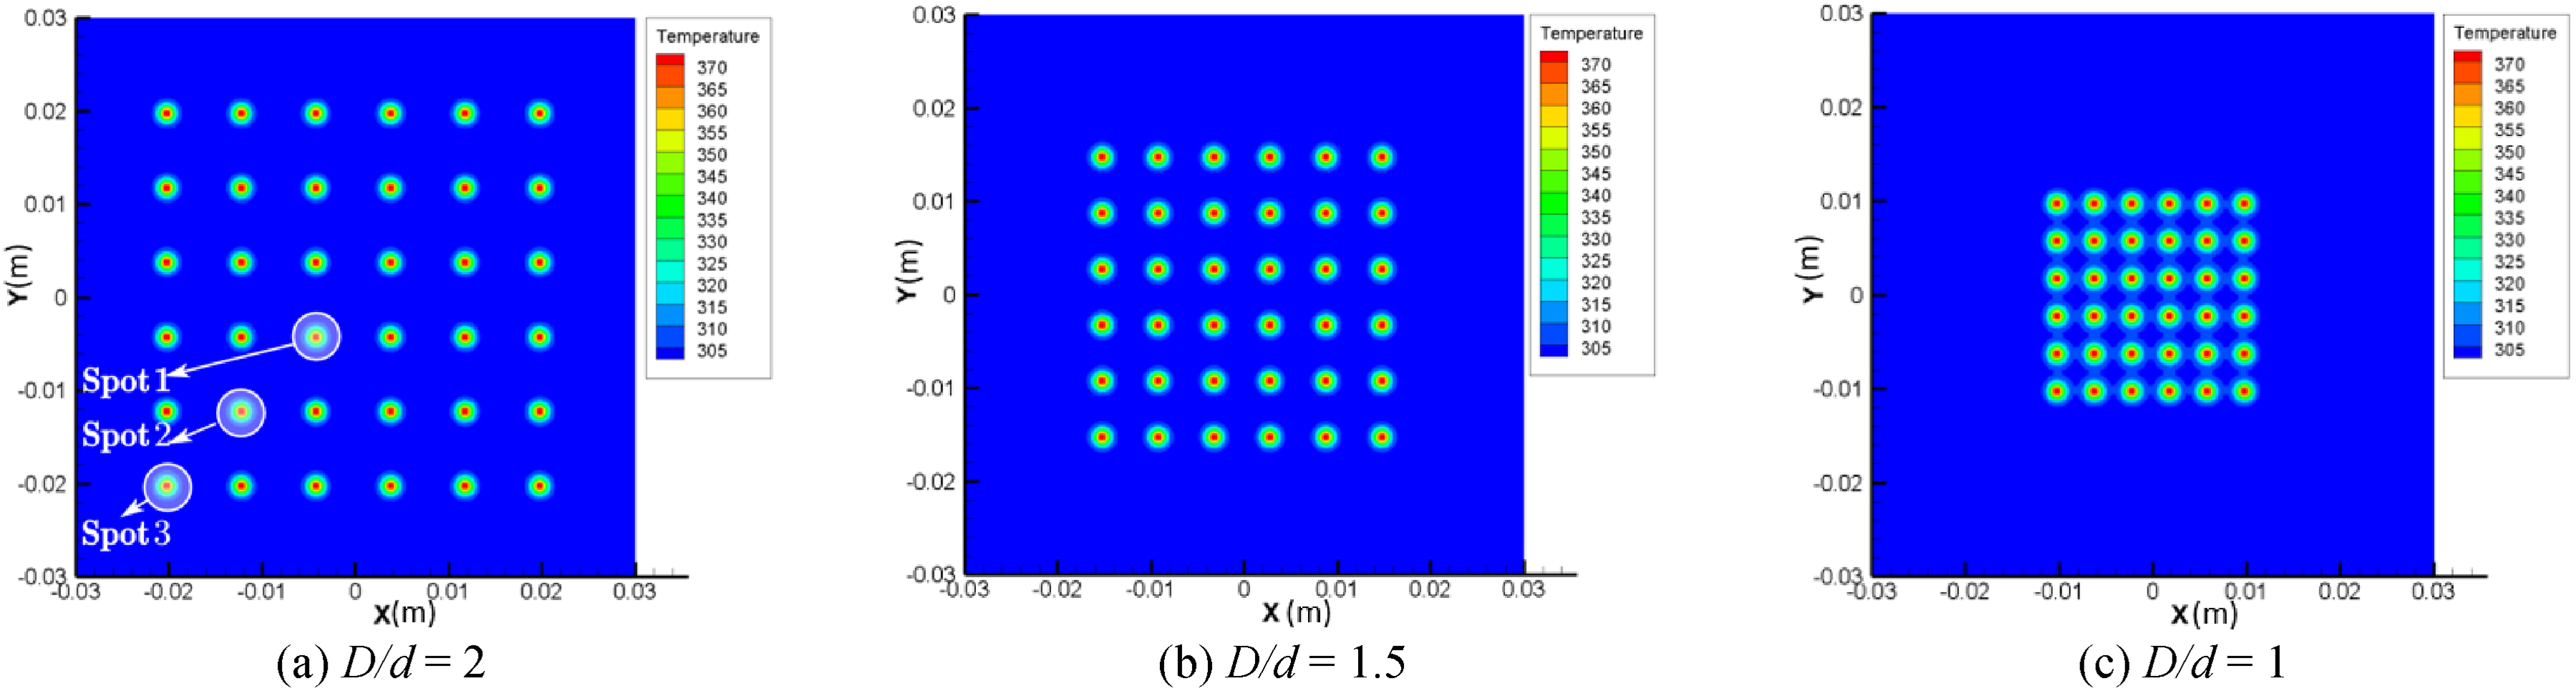
Temperature distributions of the surface for different D/d ratio.
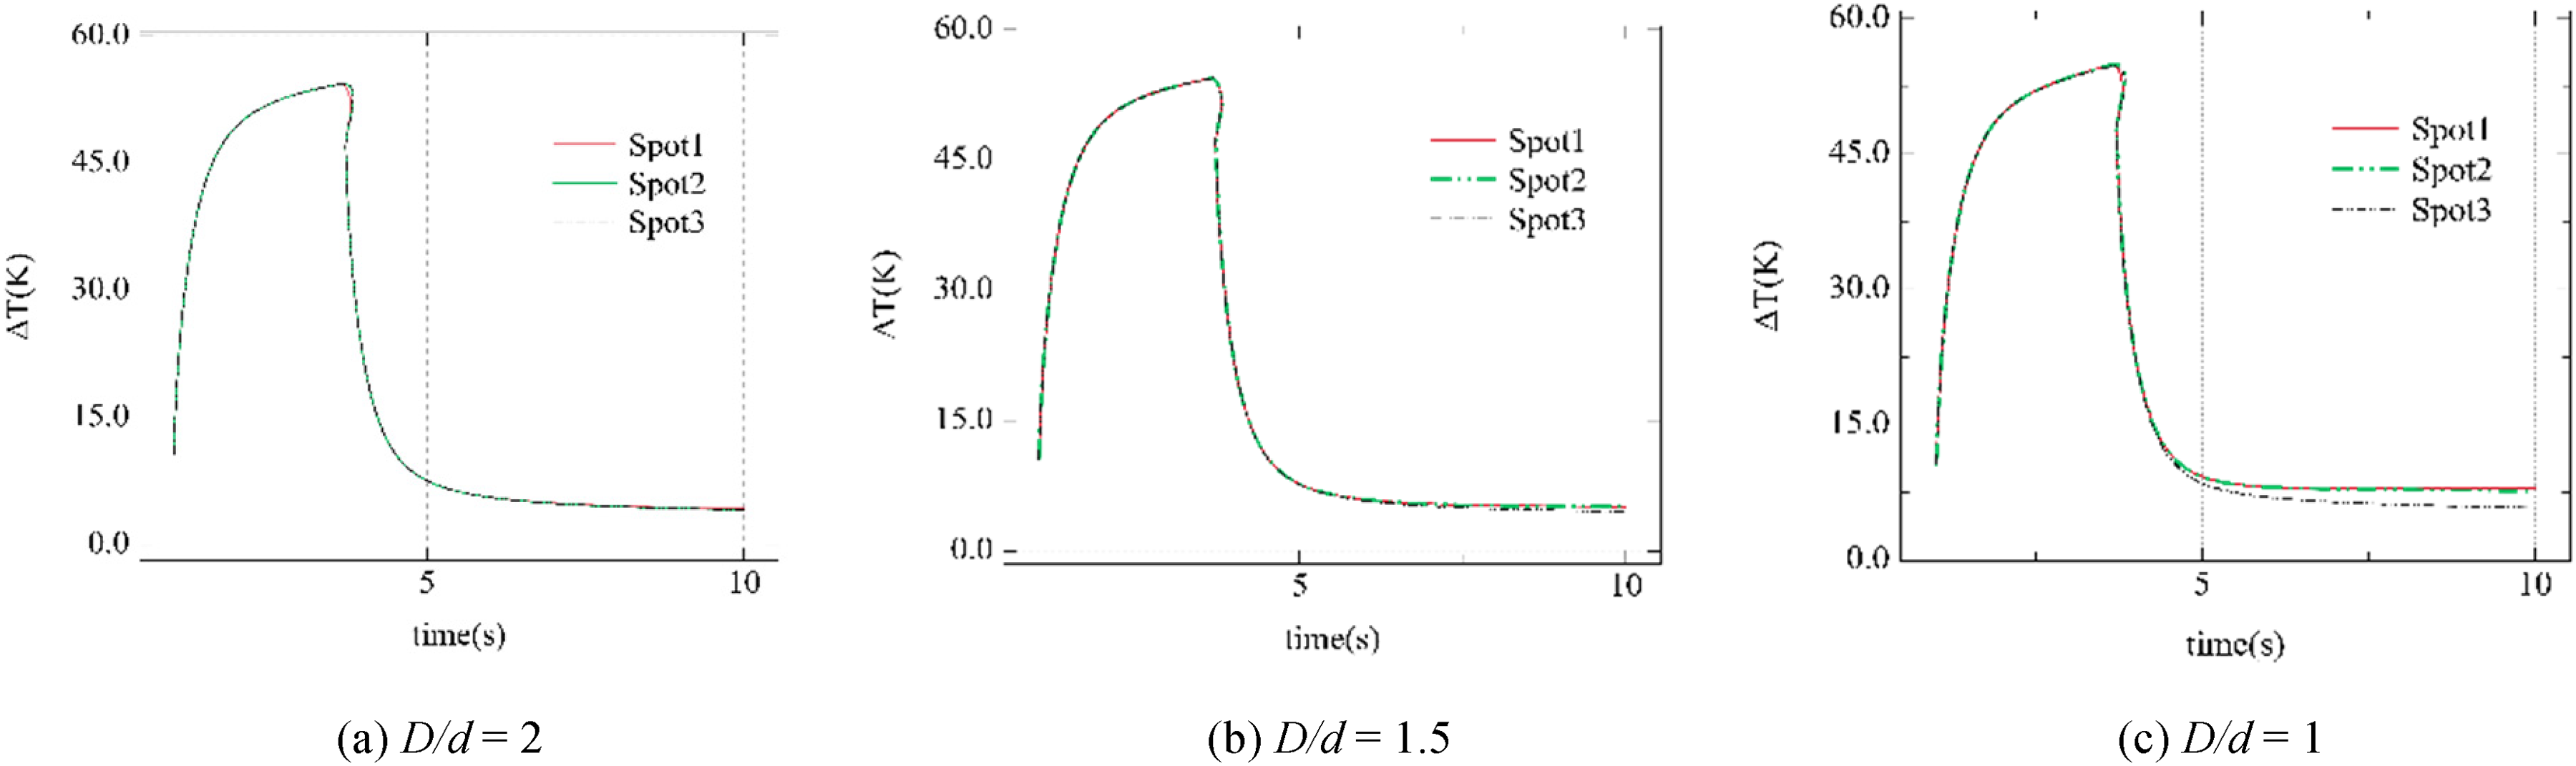
Temperature evolution curve at the center points of three laser spots of different positions.
Figure 11 shows the tmin of 6 by 6 points at the central part of a single laser spot. The results indicate that tmin will only show slight changes at the boundary position for the same TC thickness when D/d > 1.5, while the tmin shows bigger difference when D/d = 1. These results provide guidance for selecting a suitable laser spot spacing ratio in practical pulsed LAST measurements.
Tmin value of 6 by 6 points at a single laser spot central region for different D/d ratios.
Experimental setup
At first, the plasma spray technique was employed to prepare TBC specimens of four different TC thicknesses, i.e., 150 μm, 300 μm, 400 μm, and 500 μm in order to demonstrate the feasibility of the proposed LAST method experimentally. The TC is composed with the YSZ material, while the BC and substrate are of NiCoCrAlY and Inconel 718 material and of 100 μm and 5 mm thicknesses respectively. As shown in Figure 12(a), the specimens of rectangular plate geometry have other dimensions of 200 mm in length and 100 mm in width direction.
TBC specimens with different thickness and pulsed LAST experimental system.
Figure 12(b) illustrates the pulsed LAST system consisting of an infrared camera, laser generator, laser shaper, computer and image processing software. The uncooled infrared camera Flir A615 is of spectral range spanning from 7.5 to 14 μm, resolution of 640 by 480 pixels and frame frequency of 30 Hz. The temperature sensitivity of the IR camera is of 50 mK. The camera is positioned at a distance of 0.7 m from the surface of the inspection targets.
The continuous wave fiber laser generator illustrated in Figure 12 is an air-cooled one with maximum power output of 200 W and wavelength of 1064 nm. The laser shaper integrated with a DOE capable to convert a laser beam to 9 by 9 laser spots and covering an rectangular area of 48.9 mm by 48.9 mm region in case of 0.7 mm specimen distance. Due to the zero-order effect of the DOE, the actual number of laser spots is 80 because the spot at the center of the area was vanished.
As shown in the Figure 13, due to a 0.5° divergence beam angle of the DOE and the distance of 0.7 m from the specimen, the spacing between adjacent laser spots at the specimen surface is about 6.1 mm. As the diameter of the laser spots is about 4 mm in this case, the spacing to diameter ratio (D/d) is 1.5. According to the simulation results of Section “Selection of key parameters of the laser spots array”, the adjacent laser spots have little effect with each other for such a D/d value. Unlike the simulations, the pulse excitation laser duration is chosen as 10 s in experiments to ensure a sufficient heat flux, while the temperature of also 10 s cooling stage is measured to get enough experimental thermal information for further thickness evaluation.
The spacing between adjacent laser spots.
Experimental results and discussions
In Figure 14, a typical temperature image measured with the LAST system and a specimen described in Section “Experimental setup” is given. 80 laser spots can be clearly recognized in all thermal images. Concerning the boundary effect, the thermal information and feature parameter of the 7 by 7 laser spots excluding the boundary spots are processed and extracted. For each laser spot, the pixels around the highest temperature pixel is selected as the center region the temperature at the 5 by 5 pixels of the center region of a laser spot are extracted and averaged to get the temperature evolution curve. Selecting other areas for calculation is easier to be influenced by noise, and may resulting in larger error on the thickness measurement. Figure 15(a) depicts the evolution of temperature during the heating and cooling stage, while Figure 15(b) shows the corresponding evolution curve of the second logarithmic derivative for the specimens of different TC thickness during the cooling stage (from 10 s to 20 s). As the Tlog value after 15 s are almost 0, only values ranging from 10 s to 15 s were used in the Figure 15(b) in order to make the value of tmin is easier to be extracted. Unlike the numerical results, the temperature evolution curves do not depend on the TC thickness well, but the measured Tmin correlates with the TC thickness monotonously. These results proved that the second logarithmic derivative of temperature evolution curve gives better information for the thickness evaluation in practice concerning the envrionmental noise.
A typical experiment result of pulsed LAST and a zoom-in image around a laser spot.
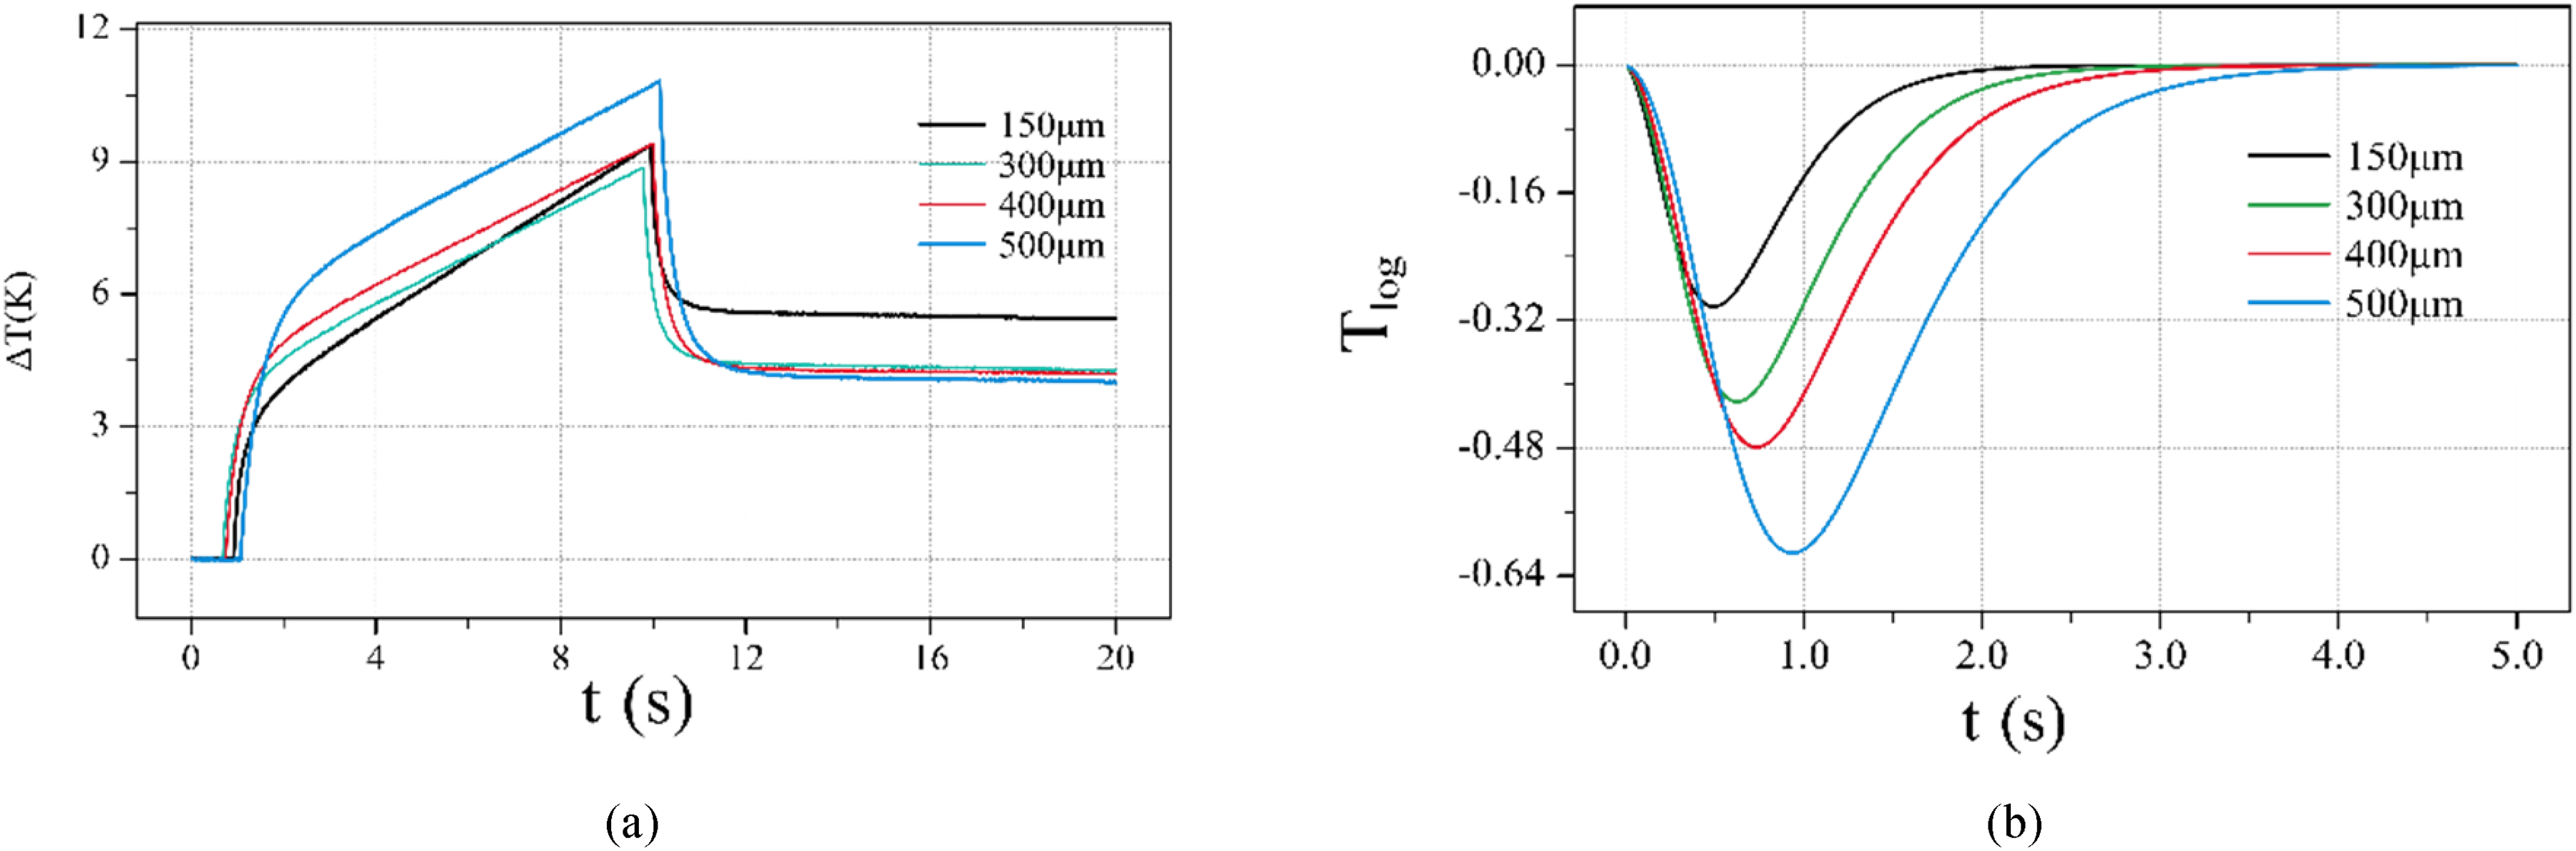
Average temperature(T) (left) and 2nd derivative of the Ln(T) (right) of different thickness.
From the 48 central laser spots, the corresponding tmin values are extracted respectively and adopted to evaluate the TC thickness at the center position of each laser spot. Figure 16 gives the distribution of the tmin values for different laser spots. One can find that the tmin value is concentrated around 0.417 s for a TC of 150 μm thickness, 0.5 s for 300 μm thickness, 0.617 s for 400 μm thickness, and 0.783 s for 500 μm thickness respectively. For the same thickness, between the tmin with the maximum deviation from the average value of tmin is about 0.033 s. These results reveal that the TC thickness can be recognized from the tmin value once the correlation between them was peoperly calibrated a priori.
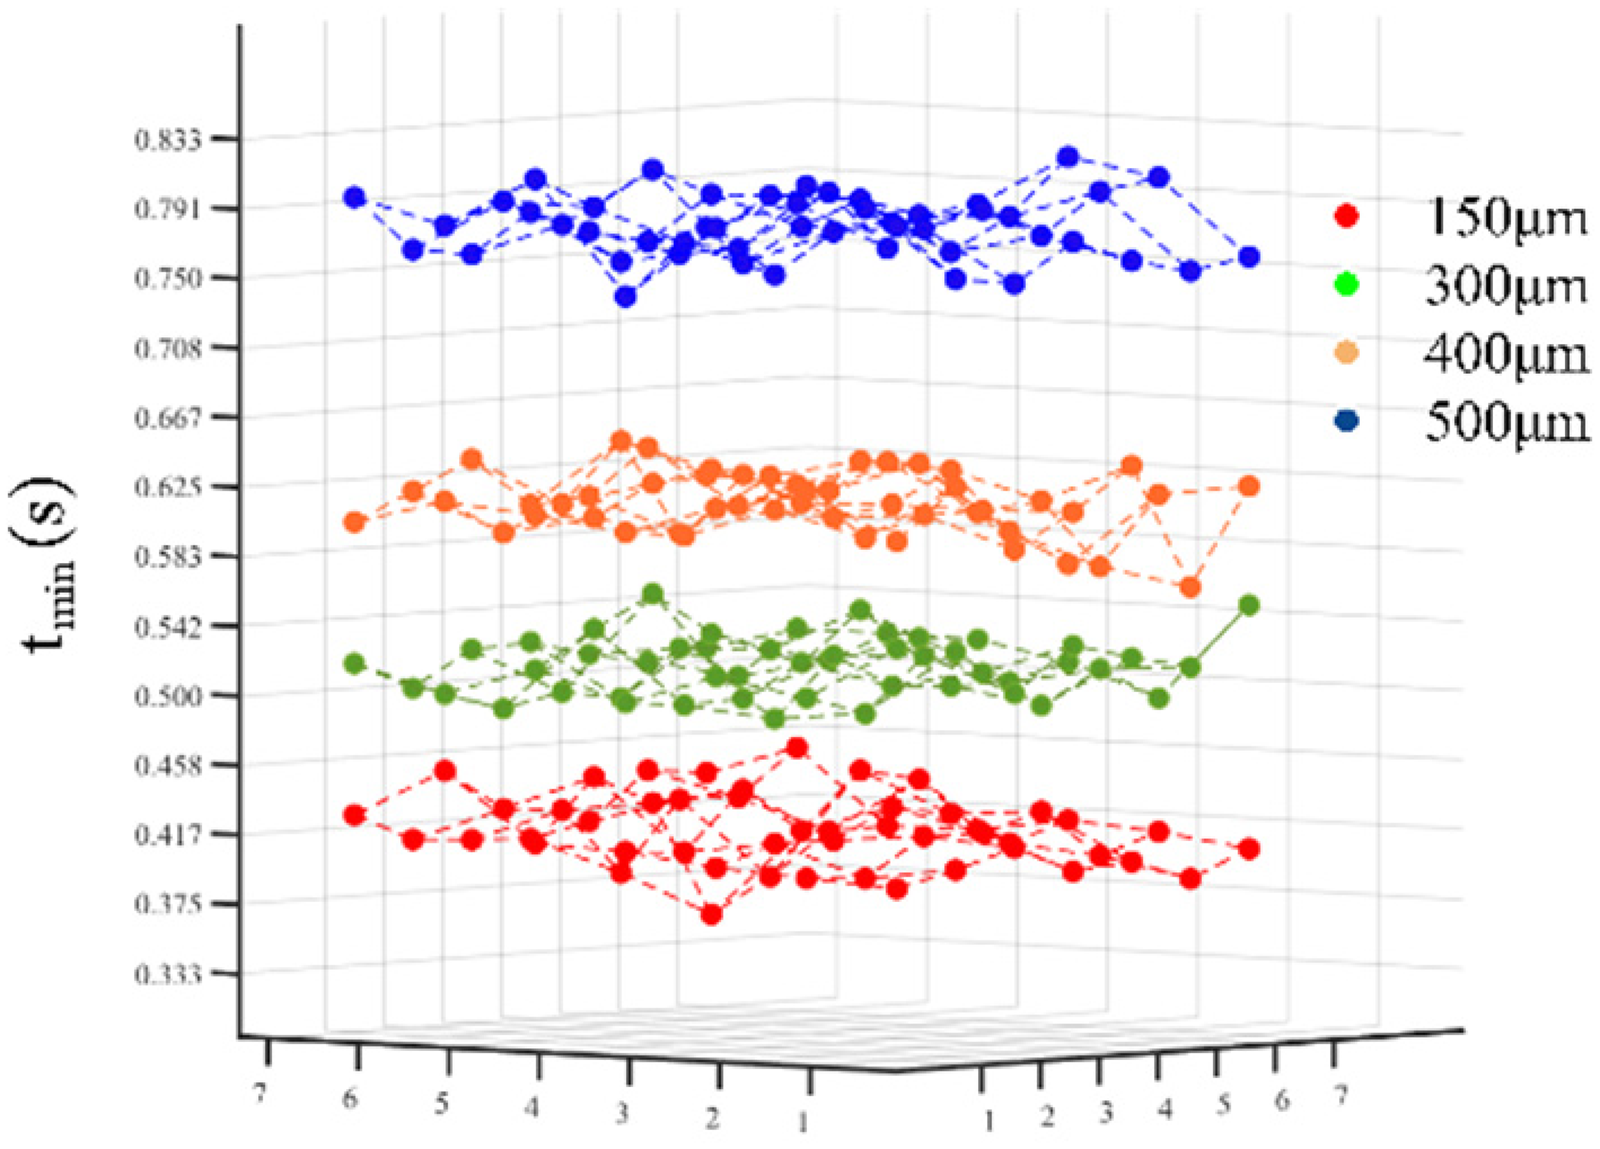
Tmin distribution for different TC thickness.
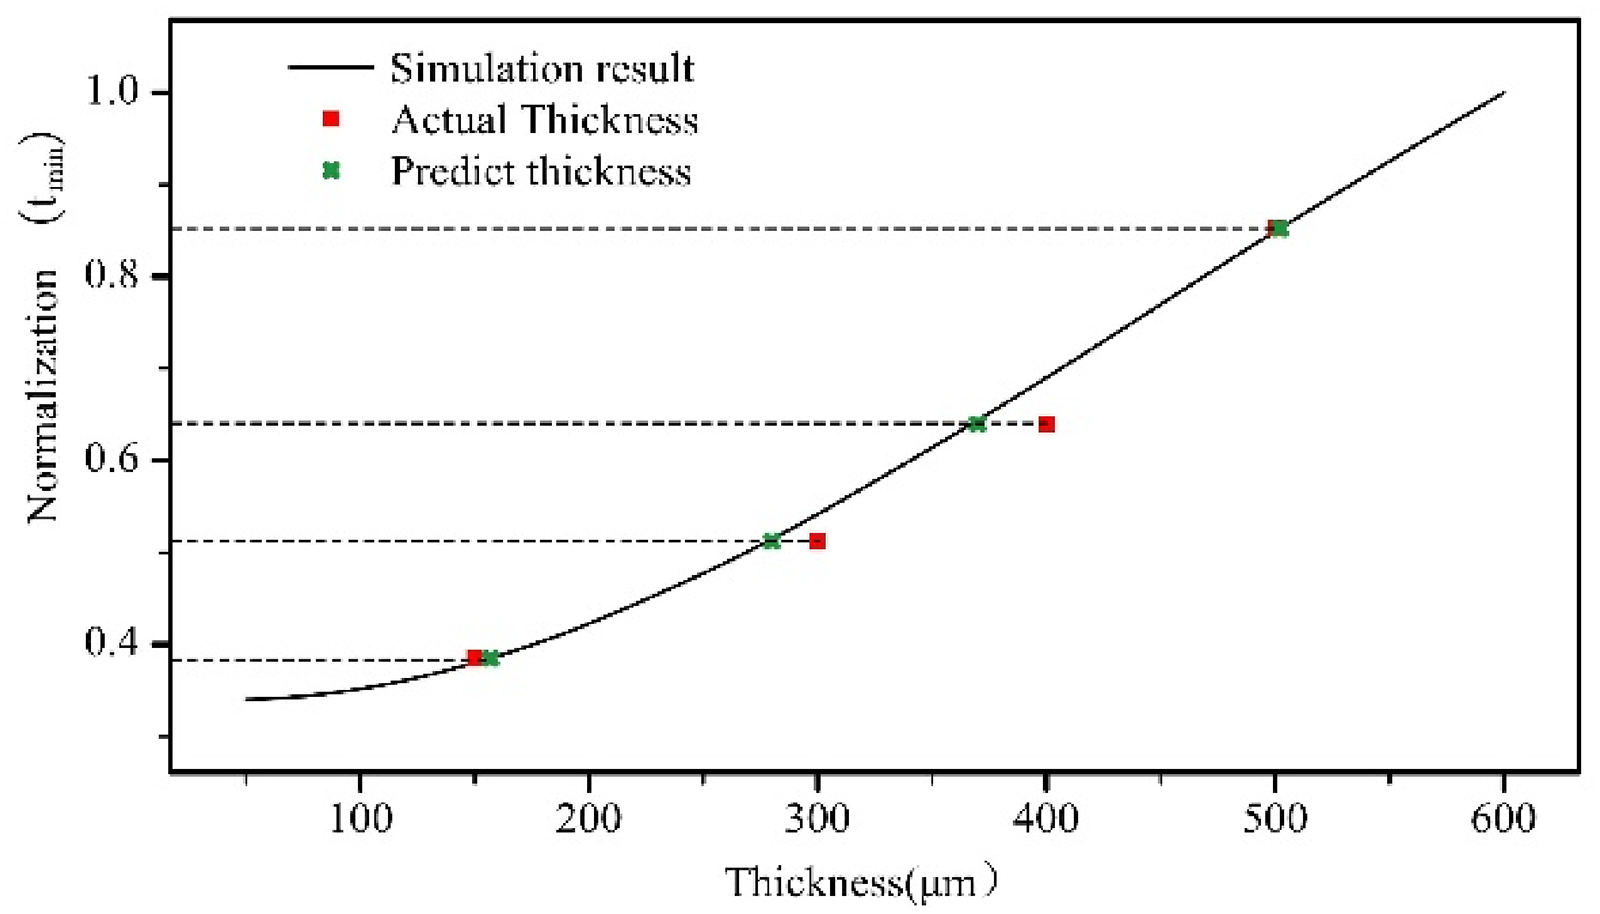
Figure 17 shows a comparison of simulated and measured results of the correlations between the normalized tmin and the TC thickness. It is evident that the experimental results are in good agreement with the simulated ones, i.e., the measured tmin show the same increasing tendency as the numerical results with the TC thickness. In addition, the gradient of measured tmin referring to the TC thickness increases for relative large thickness value but approaches to a constant, i.e., tmin becomes linearly correlated to the TC thickness for a thick top coating.
Comparison of numerical and experimental results.
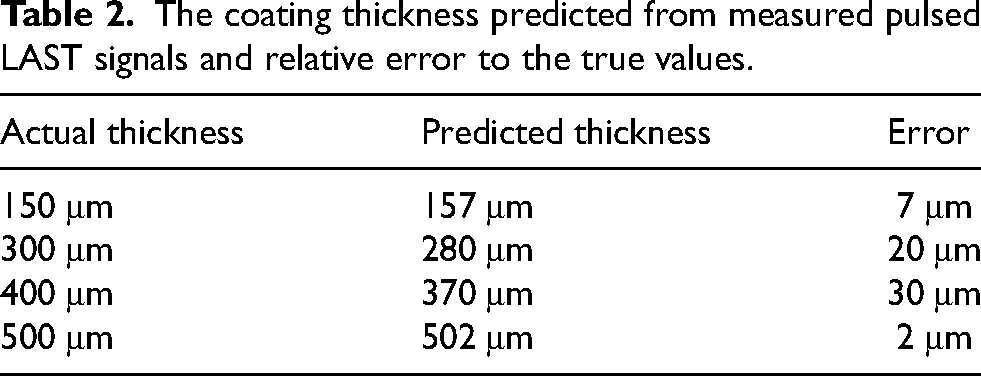
As shown in Figure 17, the “actual thickness” of TC are the measured data using a micrometer for the fabricated practical specimens, by substituting the tmin value calculated by the “actual thickness” into thickness-tmin calibration curve which obtained from Figure 8, the “predicted thickness” corresponding to tmin can be obtained easily. Table 2 shows the predicted TC thickness from the measured pulsed LAST information and corresponding relative error. The relative errors between the actual thickness and the prediction results are less than 30 μm. Considering the good efficiency for NDE of TC thickness, the method based on the pulsed LAST and the second logarithmic derivative values is feasible for a fast evaluaiton of the TC thickness.
The coating thickness predicted from measured pulsed LAST signals and relative error to the true values.
As a discussion to improve the performance further, the measurement area of the pulsed LAST can be enlarged by using a larger heating distance (distance between the laser shaper and the specimen surface) to extend the coverage of the laser array spots in principle. Increasing the number of laser spots is also a possible way to offer a larger measurement area and more evaluation points. However, the maximum number of laser spots is not only depending on the configuration of the DOE but also the power of the laser generator. Moreover, a higher laser power output is also helpful to reduce the heating duration, i.e., the total measurement time. A proper distance and spot number can be chosen considering these effects to ensure the evaluation efficiency and accuracy.
Conclusions
In this paper, the feasibility of the pulsed LAST is studied both numerically and experimentally for NDE of the TC thickness. Numerical simulations are conducted at first to find an efficient feature parameter of the temperature information for thickness evaluation and also adopted to select proper key parameters of the laser array spots. A pulsed LAST system is then established and the feasibility of the proposed thickness evaluation method is demonstrated by using the established system and the TBC specimens of different thickness. The major conclusions of the paper are as follows:
Numerical simulation results show that the pulsed LAST is valid for the efficient thickness evaluation of top coating of the TBC system. In practice, the relationship between tmin and thickness can be preliminary obtained using numerical simulations for the given inspection object. Notably, the TC thickness depends on the minimum time instant of the second logarithmic derivative tmin nonlinearly especially in the range of a small TC thickness. Numerical simulations are also conducted to explore the influence of spacing between laser spots on the pulsed LAST signals and the thickness evaluation precision. It is found that a spacing-diameter ratio of 1.5 or higher allows independent heating of different laser spot, and enables a better thickness evaluation result. The feasibility of the proposed TC thickness evaluation method was also experimentally validated. The experimental results show that the thickness of a region as least as 50 mm by 50 mm can be measured at the same time. The error between predicted thickness which obtained by numerical simulations and the actual thickness is better than 30 μm. In this paper, TBCs on plate were considered. In future, the tmin-TC thickness calibration of actual TBC system will be constructed for a practical turbine blade.
Footnotes
Acknowledgements
This paper is supported in part by the national key R&D program of China (2022YFB3707202) and NSFC (11927801).
Funding
The author(s) received no financial support for the research, authorship, and/or publication of this article.
Declaration of conflicting interests
The author(s) declared no potential conflicts of interest with respect to the research, authorship, and/or publication of this article.