
Abstract
The goal of this research is the modelling by Magnetic Equivalent Circuit and topology optimization of a magnetic core, in order to maximize the inductance value function of an imposed material volume. A penalization is used in order to obtain density-based optimization results strictly made of air and magnetic material. The shapes of three magnetic cores resulting of the topology optimization are printed by additive manufacturing with fused granular fabrication process, being subject to a thermal treatment, and then compared by characterization and modelling to a reference shape in terms of magnetic properties.
Keywords
Introduction
Magnetic cores are widely used in power electronics applications, such as converters and inductors. As other applications in electrical engineering, they are subject to many challenges, like compacity increase leading to worse thermal behaviour, or cost reduction. 1 To overcome these challenges, topology optimization (TO) could be the key by taking into account trade-offs between these parameters. Since the beginning of TO studies, 2 a lot of optimization approaches appeared in the literature. 3 There is a wide range of applications for TO in electrical engineering, and especially for power electronics.4,5
Additive manufacturing (AM) has many advantages to produce shapes from TO: important geometrical printing liberty; material loss reduced compared to conventional subtractive manufacturing; on demand manufacturing. AM is used for several years now to manufacture electrical engineering parts. Focusing on magnetic cores for low frequency applications, the majority of the work has been done with the selective laser melting (SLM, also called laser power bed fusion, LPB-F) process,6–12 or binder-jetting.13,14 Despite being more accessible in terms of cost or ease of use, 3D printings by extrusion of filament (FFF, fused filament fabrication) or pellets (FGM, fused granular fabrication) are more rarely studied.15–17
The interest of linking TO and AM in electrical engineering has been shown in some studies, like 18 in which Huber et al. optimized a Nd-Fe-B permanent magnet to maximize the magnetic field with a volume constraint. In 19 a switched reluctance motor has been optimized to maximize its torque, and printed by laser power bed fusion (L-PBF). But the large cross-sectional areas allow more eddy currents to establish. A problem identified in, 8 in which the material distribution in the cross section of a simple ring core is optimized to minimize the eddy currents. The ring core is then printed by L-PBF with Fe-49Co-2V powder. In 20 a magneto-mechanical optimization is done on permanent magnet motor, by 2D then 3D, to increase the average torque and maintain structural integrity of the machine. The rotor is then printed by L-PBF, but there were no experimental tests.
Based on these previous contributions, it could be interesting to link TO and AM with application to a very simple inductance magnetic core, which has not been done before. Also, all previous printings were done with L-PBF, a precise but expansive process. In this study, the more convenient and cheaper fused granular fabrication (FGM) process is chosen.
This paper is structured into four parts. Firstly, the reference magnetic core is presented, and modelled in a meshed reluctance model called Magnetic Equivalent Circuit (MEC). Secondly, the density-based optimization process is applied to the reference core, to maximize the inductance for different volumes targets. For each volume, a shape of the optimized magnetic core is obtained from the optimization process. Thirdly, these shapes given by the optimization process are converted into printable ones. Lastly, the printing and thermal treatment processes are presented, as well as magnetic characterization of the printed cores.
Studied magnetic component and its modelling
Selection of a reference magnetic core
In order to start this study with a real case, the shape of the reference magnetic core is chosen from an industrial partner. It is the wound C-core (reference D30011, from Isolectra Martin company) shown on Figure 1. It is made with grain oriented electrical steel sheets of 0.30 mm thickness. The dimensions of the core are shown in Table 1.
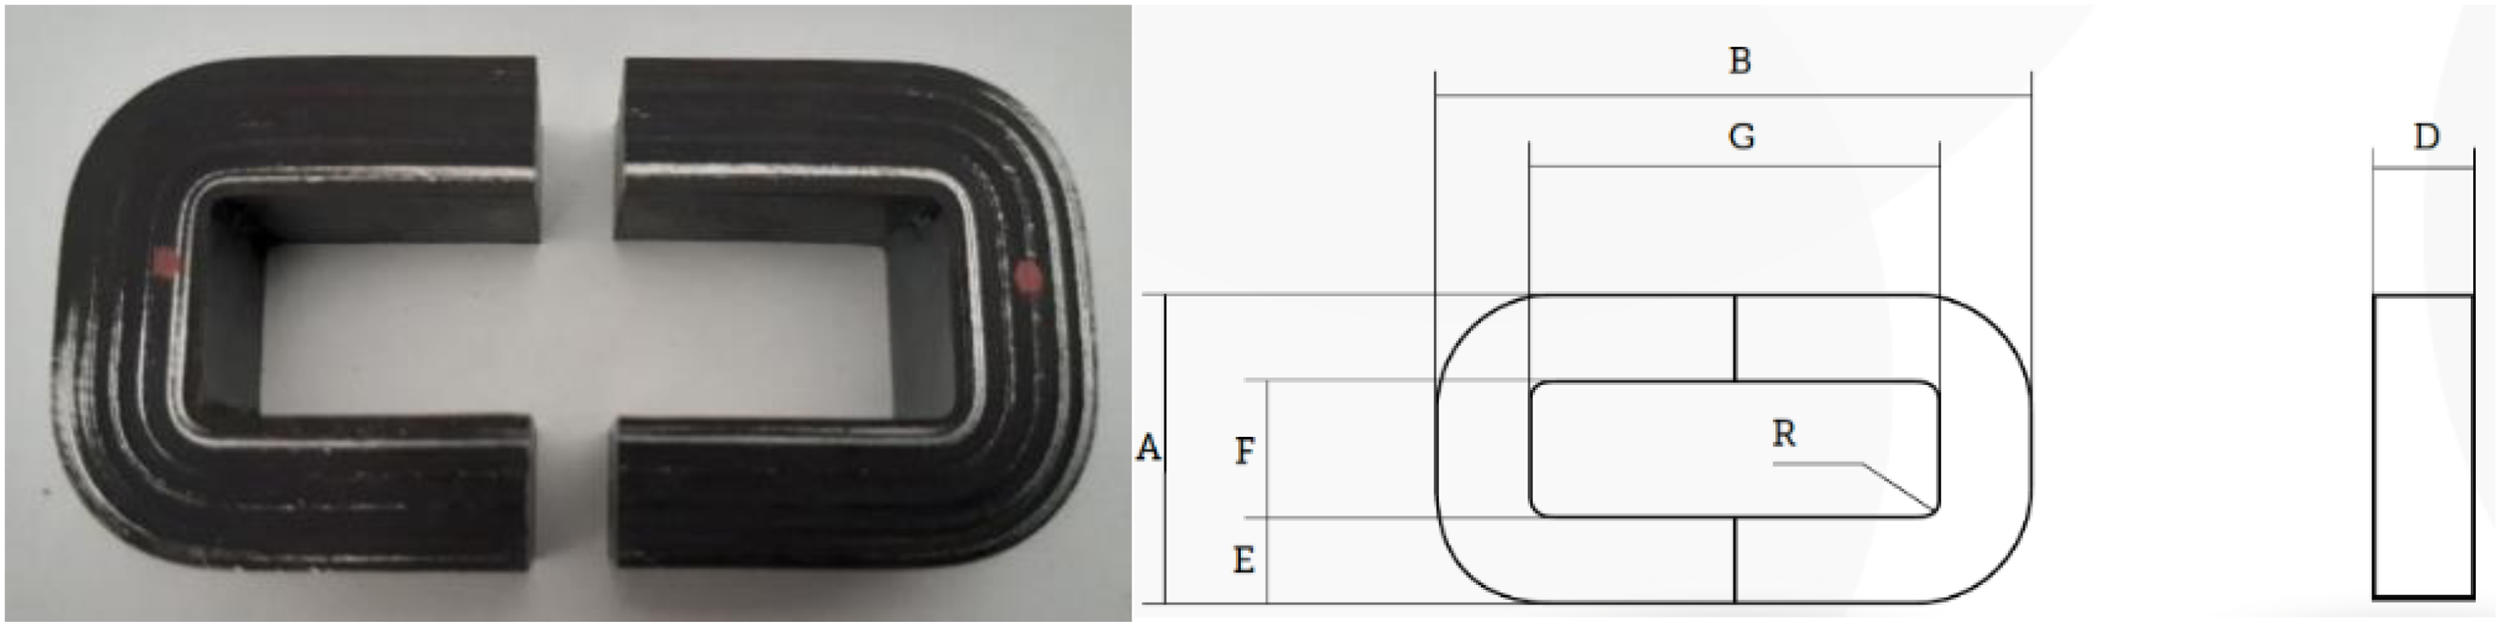
Reference shape of the magnetic core.
Dimensions of the reference shape.
Modelling of the reference shape
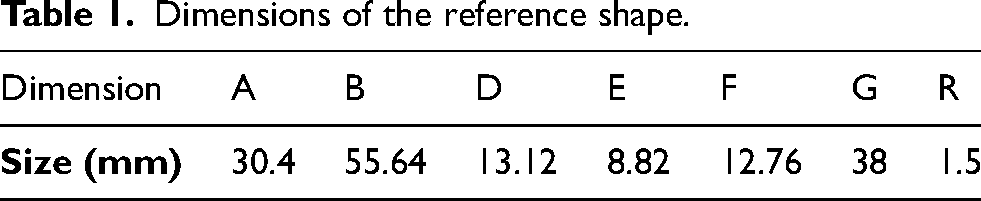
In order to facilitate its management, the MEC model is developed in Matlab, as well as the optimization process described in the next part. As shown on Figure 2, it is a 2D meshed reluctance network made of rectangular elements. A value 
(a) example of a square shaped magnetic core modelled with MEC; (b) example of a detailed 3-by-3 elements MEC model; (c) detail of an element.
Each element is made of 4 branches with a reluctance
Each element of the mesh is associated with its neighbours to obtain closed magnetic circuits. Although, the branches at the boundaries of the modelling space are not connected to anything to create a Dirichlet boundary condition. In each of the magnetic circuits, a mesh flux 
The volume V in 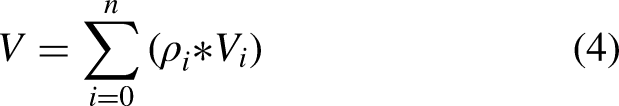
The MEC is used to model the reference magnetic of Figure 1. Figure 3 presents the density matrix created to model the reference shape. The window size is 70 mm by 50 mm. The element size is 0.1 mm by 0.1 mm. The number of elements is 700 horizontally, 500 vertically, and then 350,000 in total, resulting in 348,801 loop fluxes to solve. A trapezoidal MMF is applied to the part of the model where the primary winding is placed.
MEC modelling of the reference magnetic core, and principle of MMF imposition.
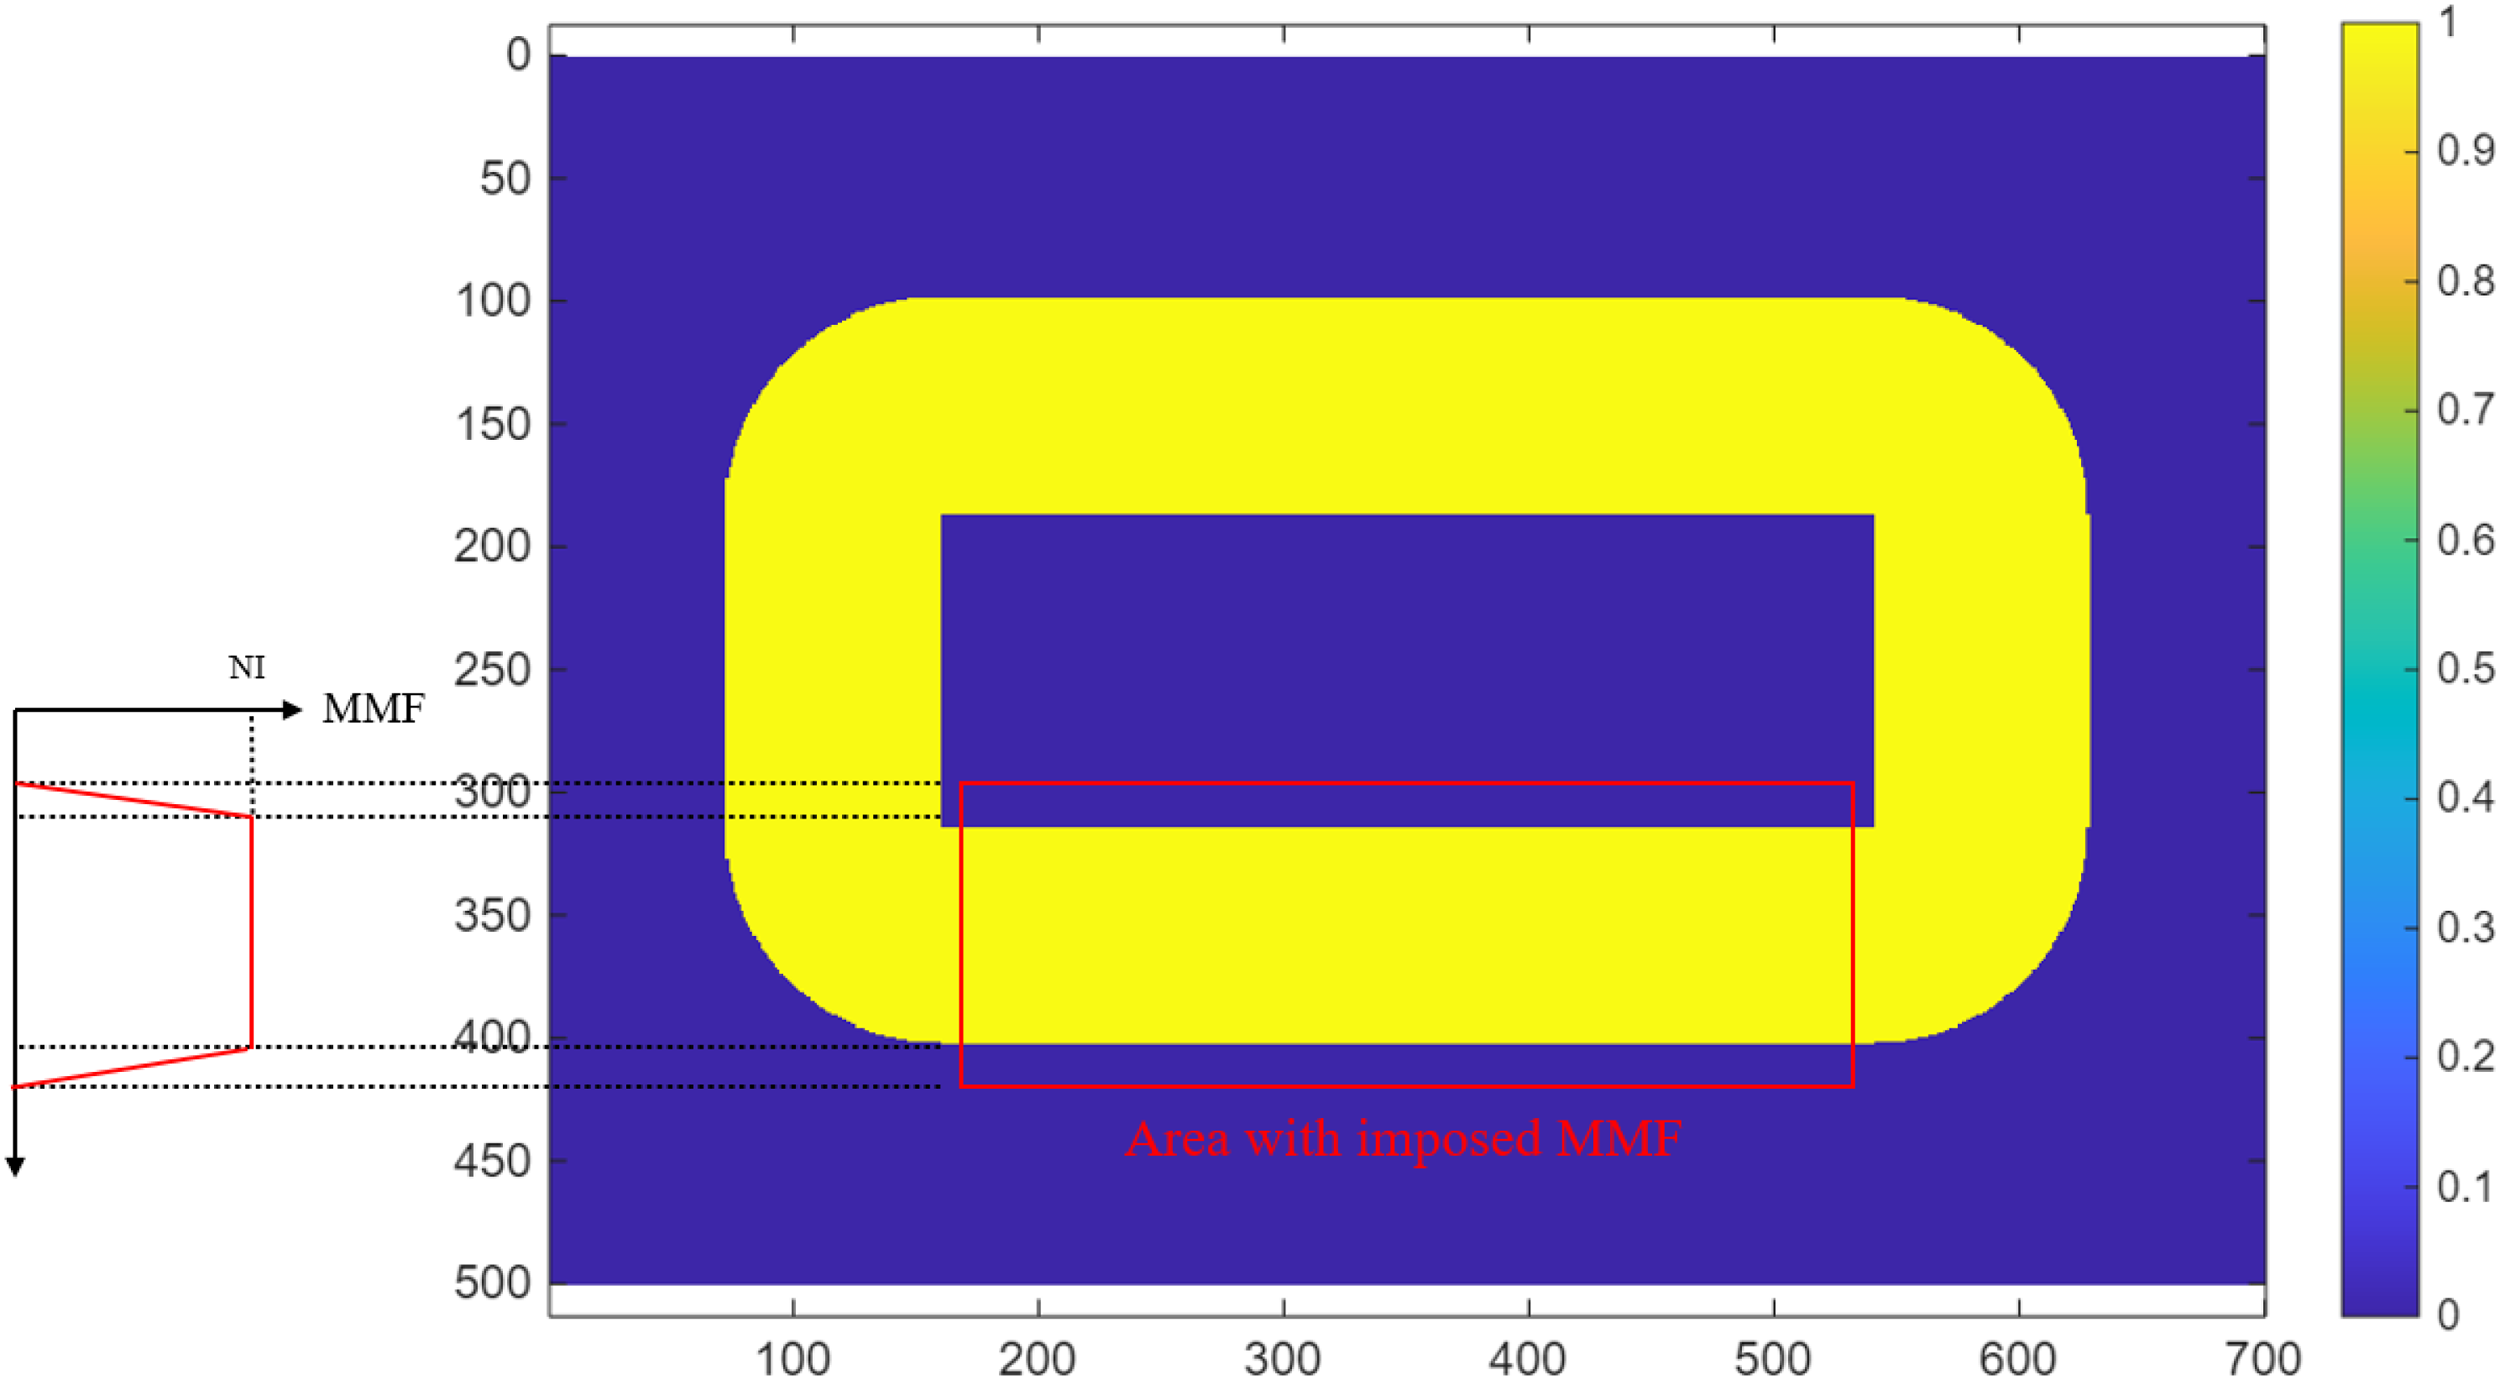
The magnetic permeability of the material used for AM is also an input of this model. As described in15,21 the permeability of a ring core is analysed. This ring core has an external diameter of 42 mm, an internal one of 26 mm, and a 2 mm thickness. It is printed with the same pellets used in this work, and being post-treated in the same way as the one described in section 4.2. The corresponding permeability curve is shown on Figure 4, characterized with peak flux densities varying from 0.1 T to 1.65 T. As the permeability value used in the MEC model is considered as constant, the maximum value from the characterization (
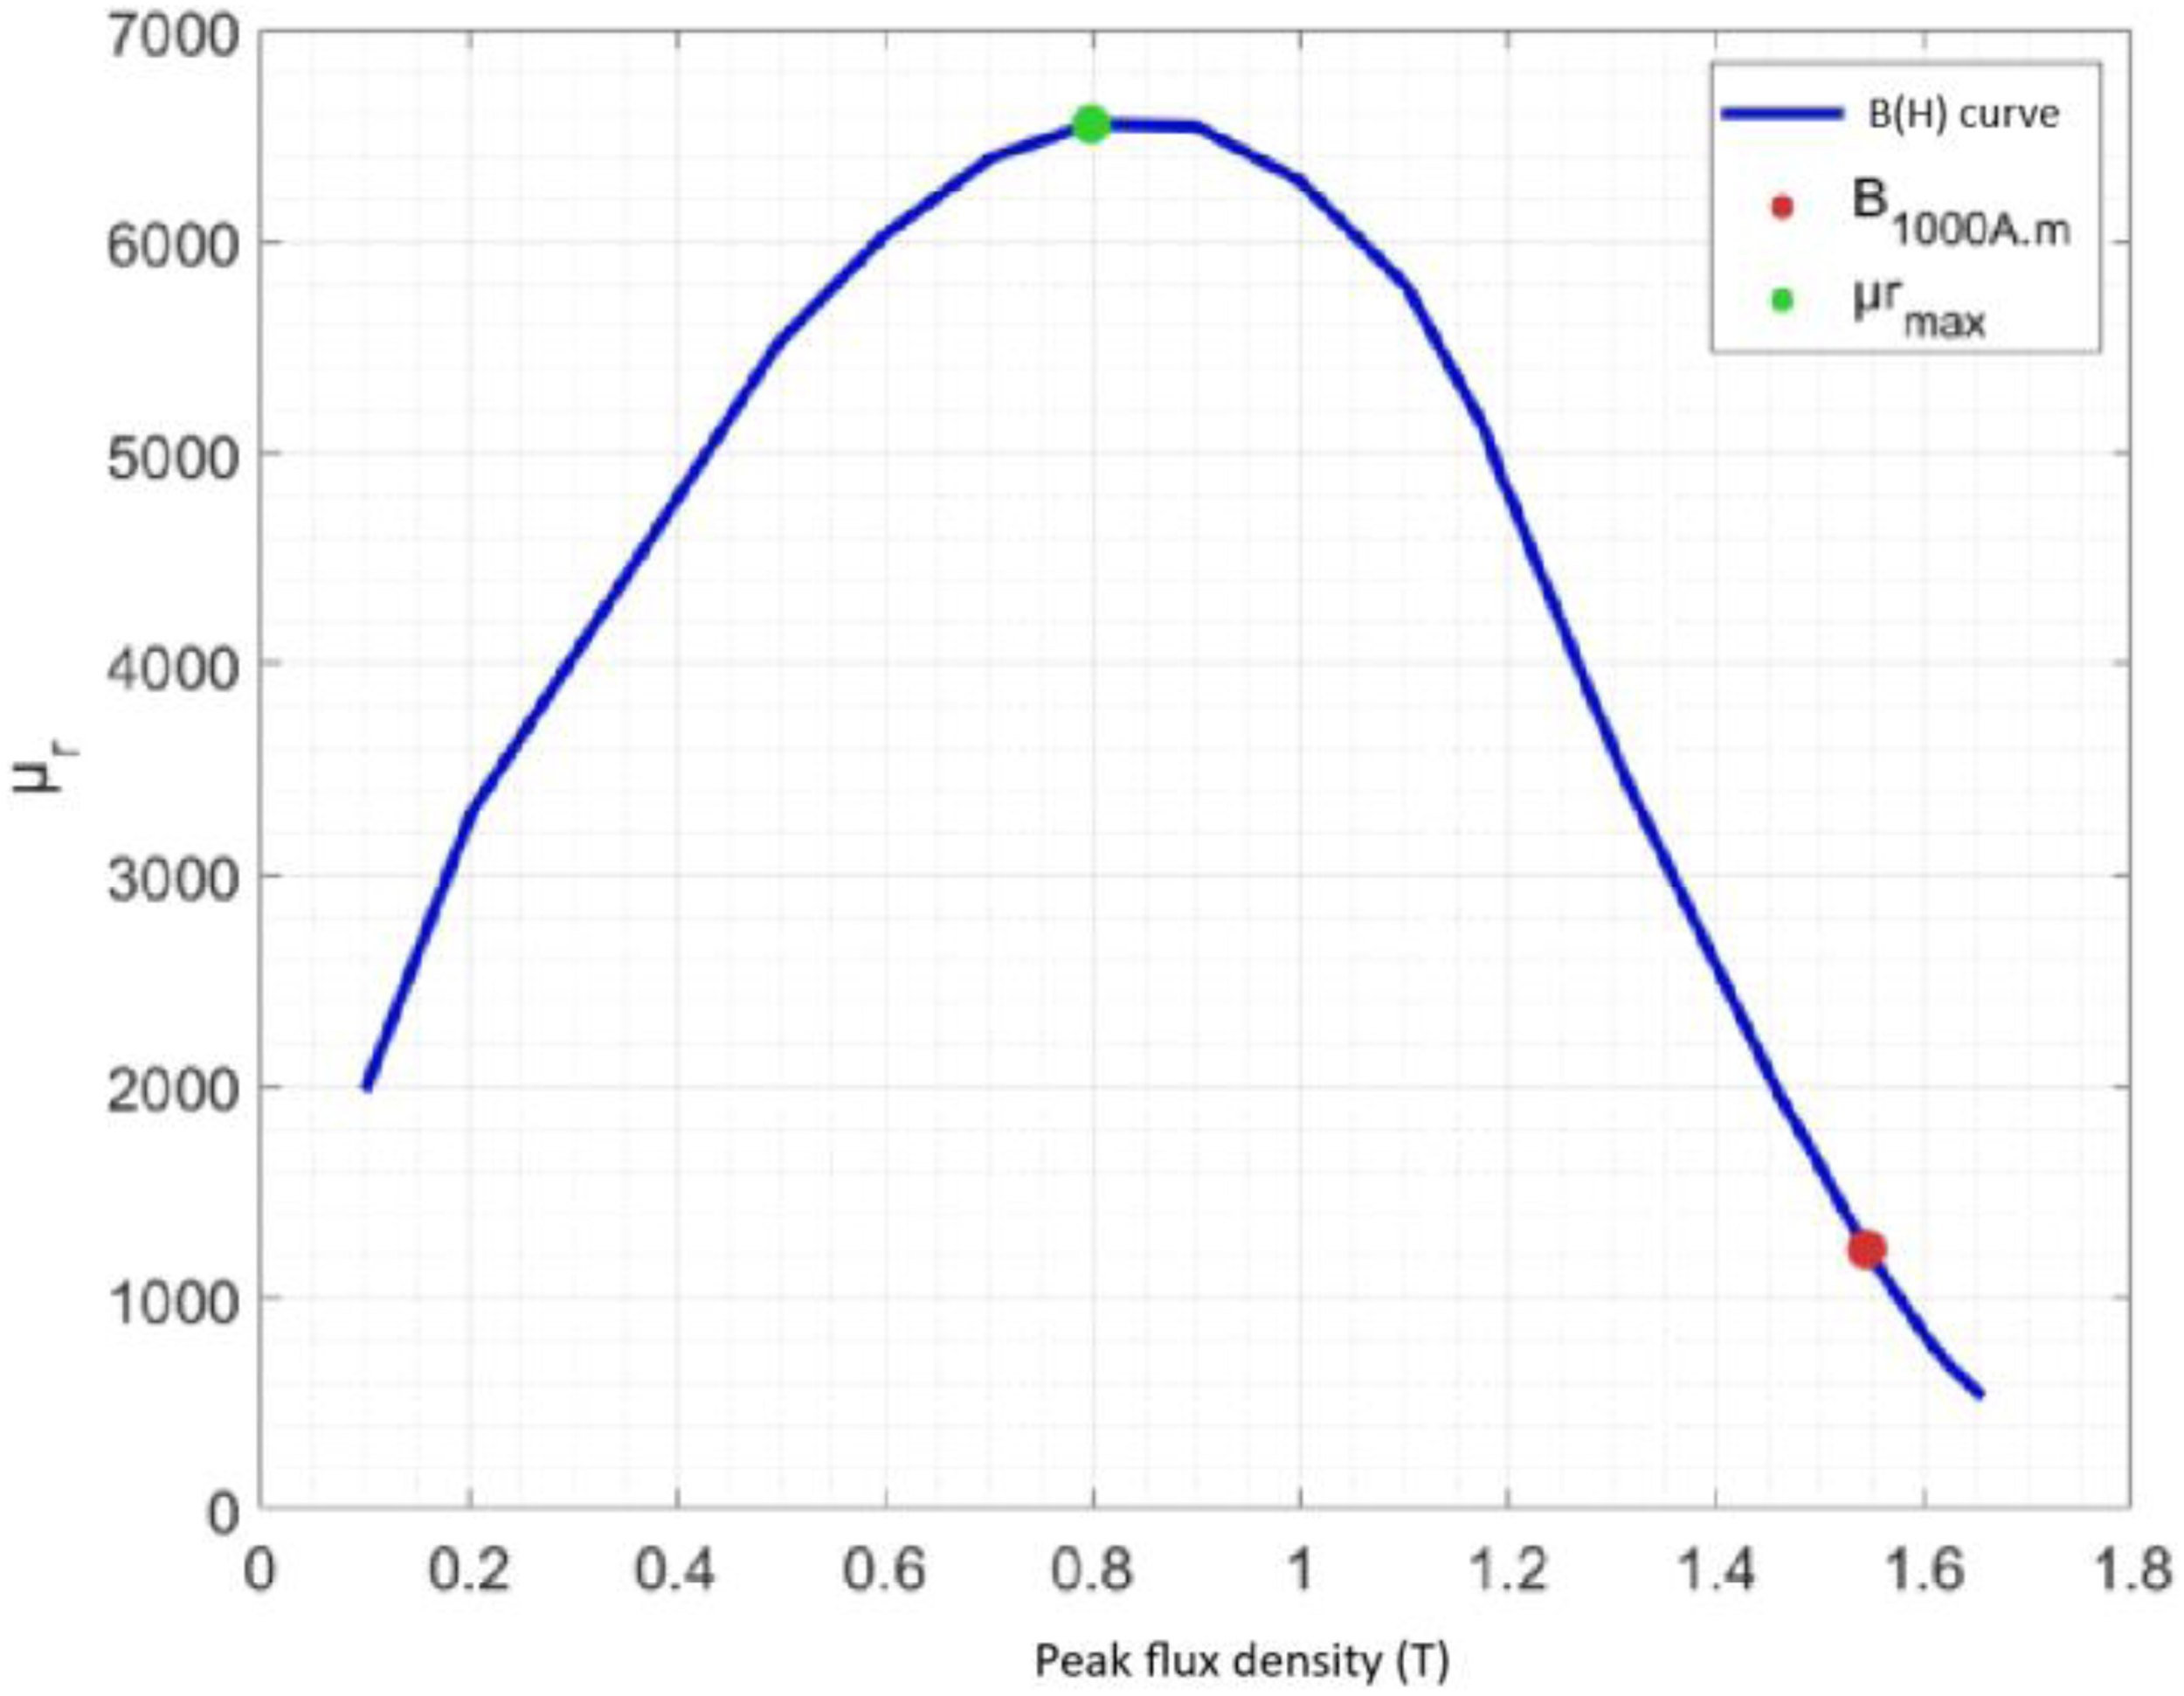
B(H) curve of the 42 mm/26 mm/2 mm ring core made of the material used in this work, under a 5 Hz frequency.
The viability of the MEC model has been assessed in 21 by comparing with finite element modelling. Between MEC and FEM, the local flux density at three locations differs by 0.8% maximum, and the inductance by 0.5%, which shows a very good computation of local and global values with MEC modelling.
Optimization of the magnetic core
Topology optimization principles and application
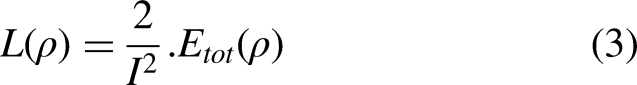
An optimization process, linked with the modelling code, is used to maximize the magnetic core's inductance (3) with the volume constraint (4). The topological method used is a density method with a penalty function added in the objective function in order to suppress intermediate values of the density 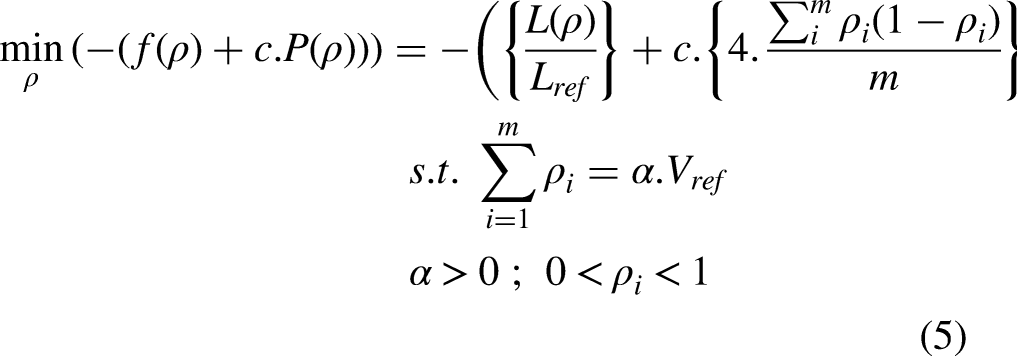
The objective function is constructed from a goal
Impact of “c” penalization coefficient on optimization.
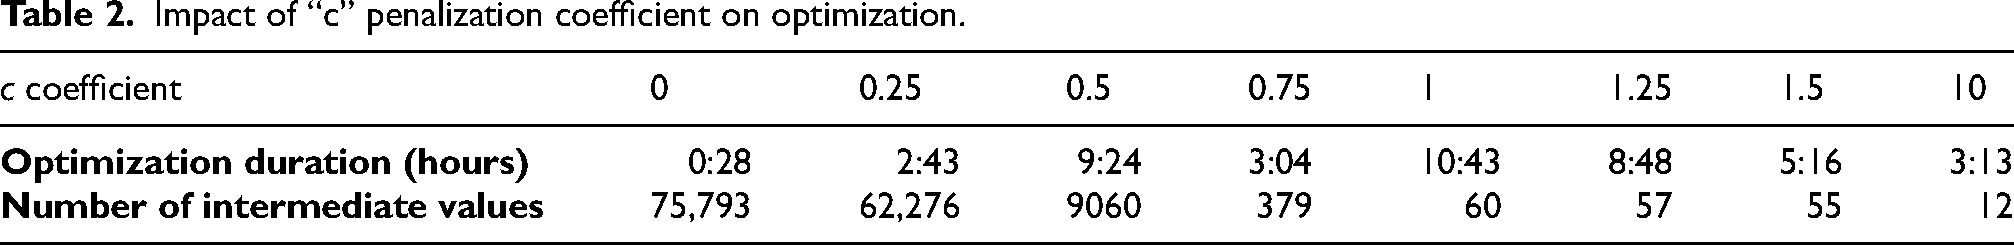
For this optimization process, the fmincon function is used. The number of variables m on which the optimization is performed is strictly lower than the modelling space, because modifications in the area of winding and the inner rectangular window are forbidden. Then, the number m of optimization variables in the design space is 232,760. This value seems high, but it could be solved in a reasonable computing time due to the fact that the model provides the derivative of the objective function
The choice of the optimization starting point, i.e., design space fully made of “0”, “1”, or random values, does not significantly impact the final number of intermediate values. It varies between 59 and 64 for a c coefficient of 1.
Optimization results
The values of the optimized inductances are given on Figure 5. The inductance value increases with volume fraction
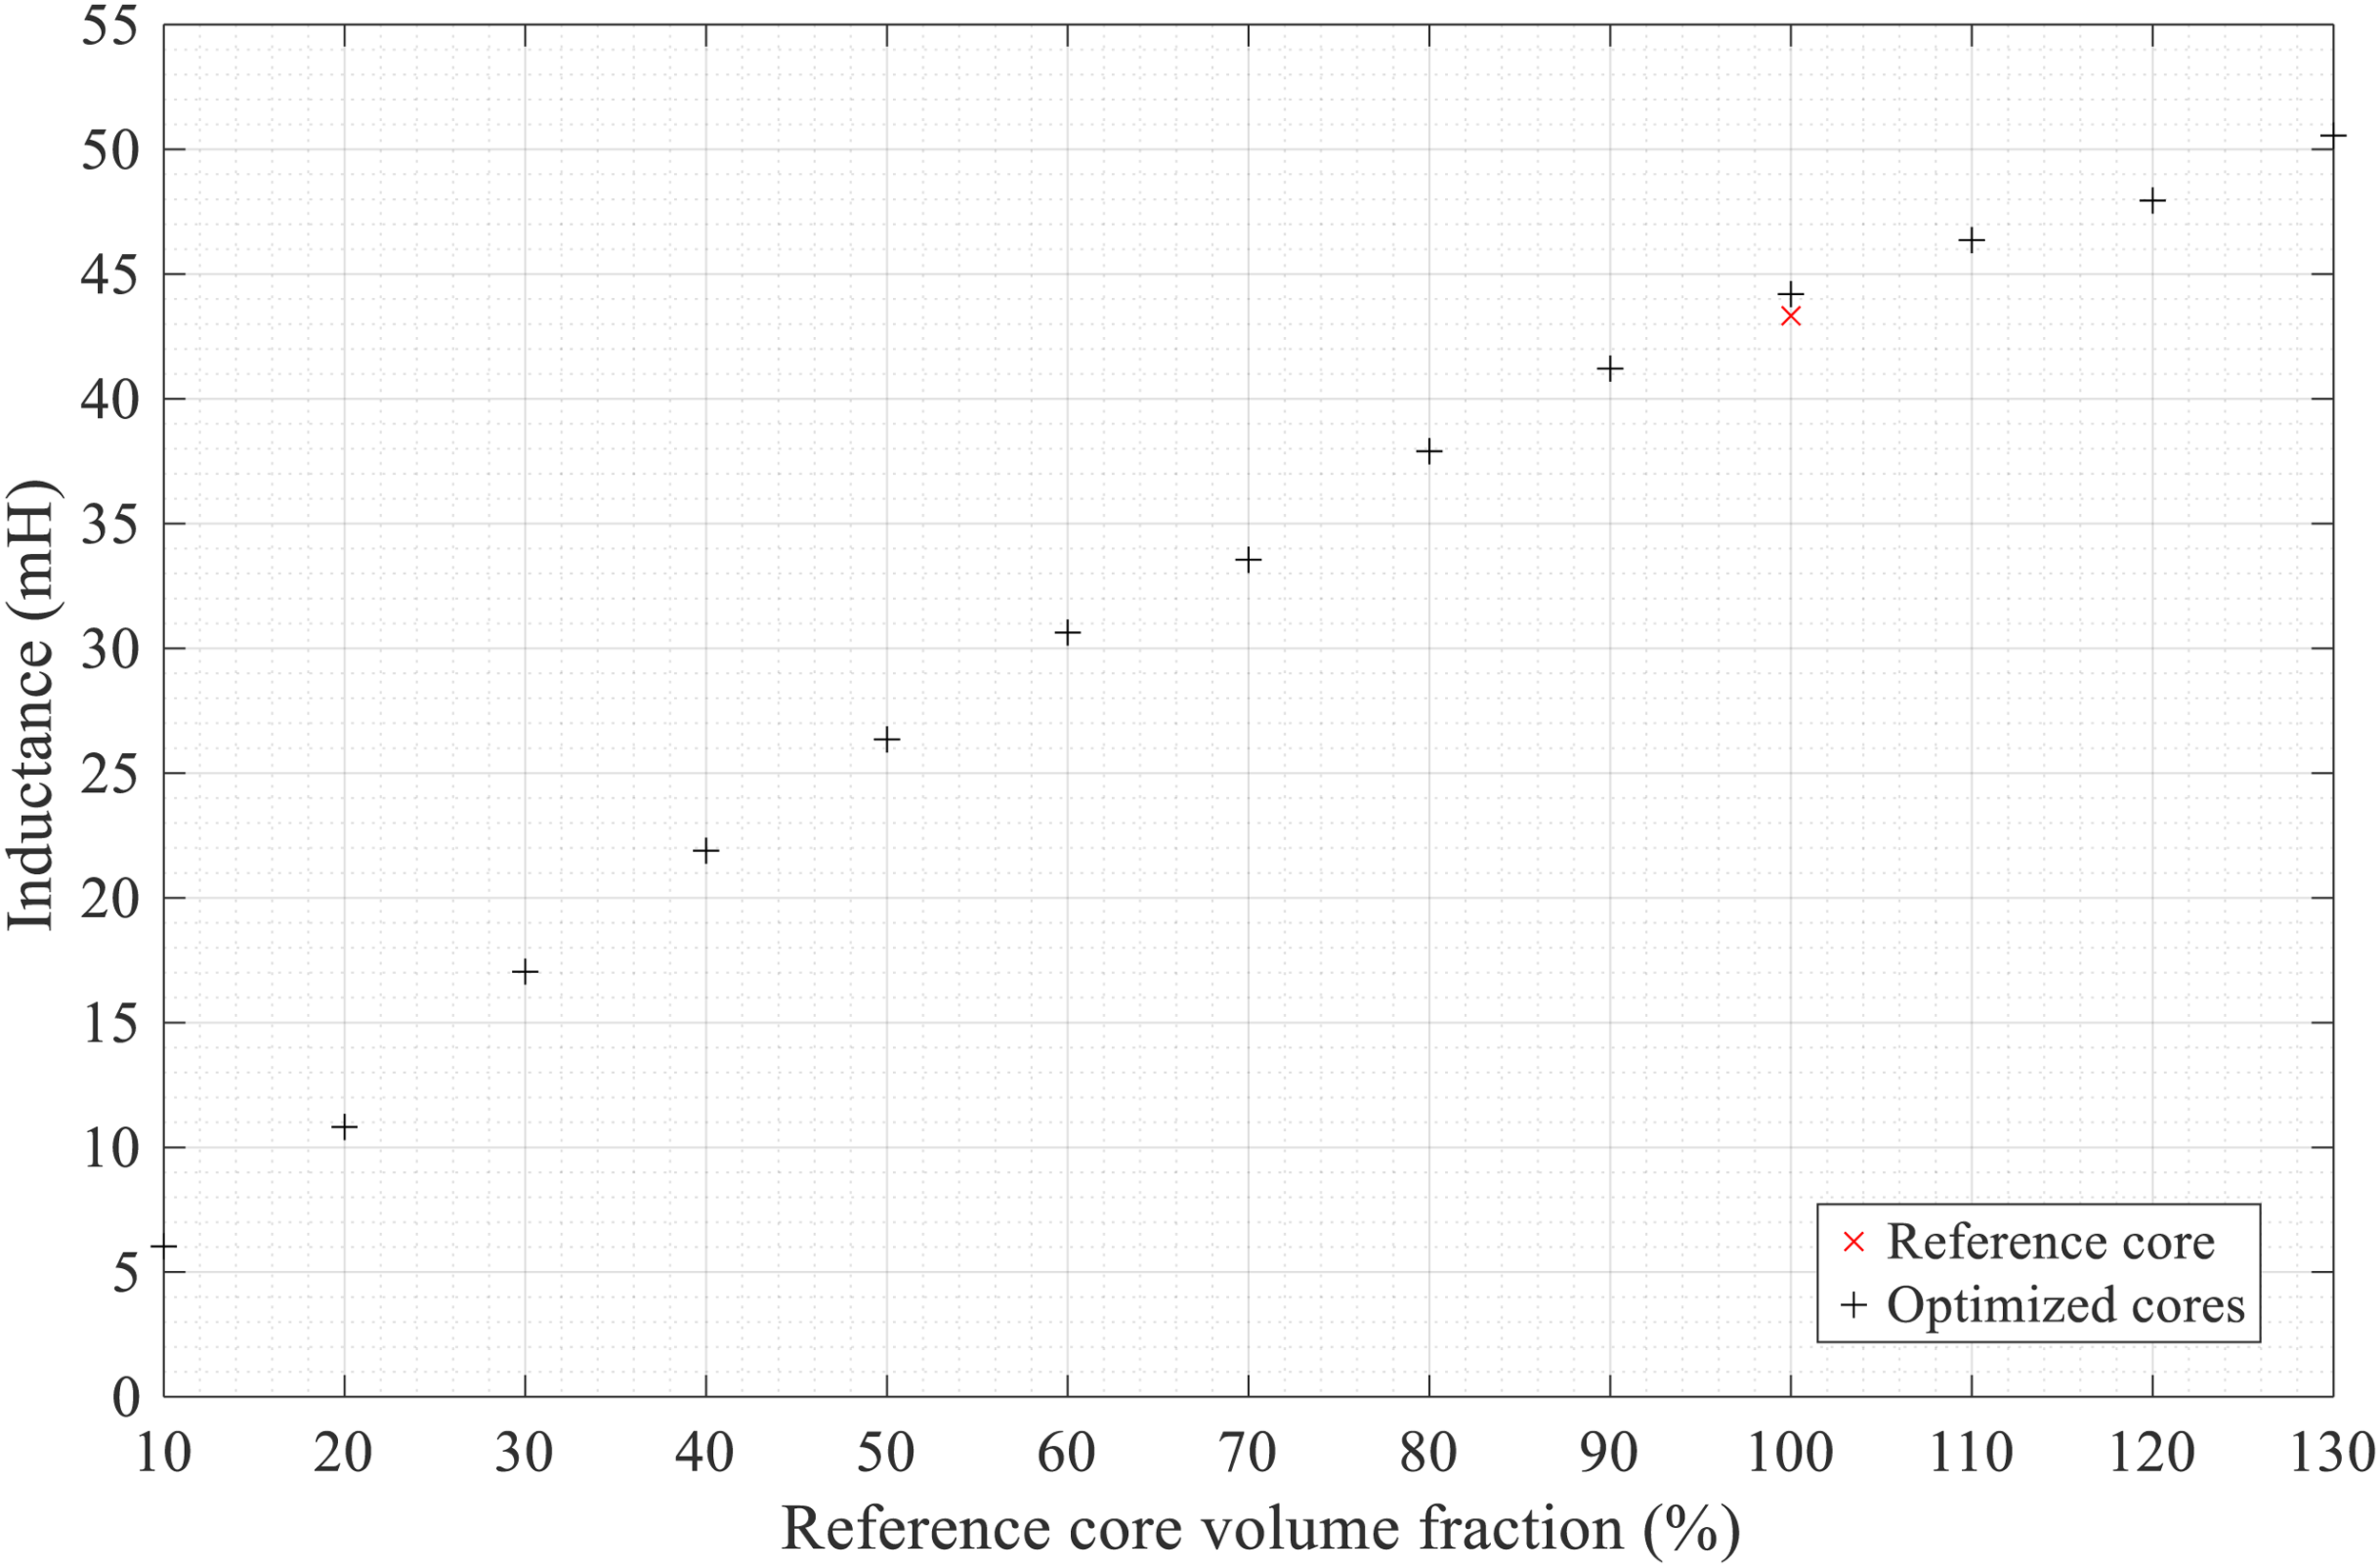
Cores inductances function of the imposed volume faction for optimization.
Optimized magnetic cores printing
After 3D printing and sintering the shapes of optimized magnetic cores for different volume fractions, they are characterized in order to be compared to modelling, and so validate the solution found by the TO.
Conversion of optimized cores to printable shapes
As summarized on Figure 6, The Matlab figures’ data of the selected cores are saved as a .mat file, exported as a .pdf file, and imported into a CAD software (Autodesk Fusion) to make it a 3D shape saved as a .stl file. The final desired thickness of the cores is 1,72 mm. But as the printing material is polymer loaded with FeSi powder, an oversize factor (1163 in our case) must be applied to the all dimensions of the shapes after optimization to take into account polymer removal during debinding. The oversized 3D CAD files are then loaded into the slicing software Cura. 22 The slicing transforms the CAD file into a .gcode file hosting the pattern for the printing head, taking into account many parameters (nozzle diameter and temperature, printing speed…).
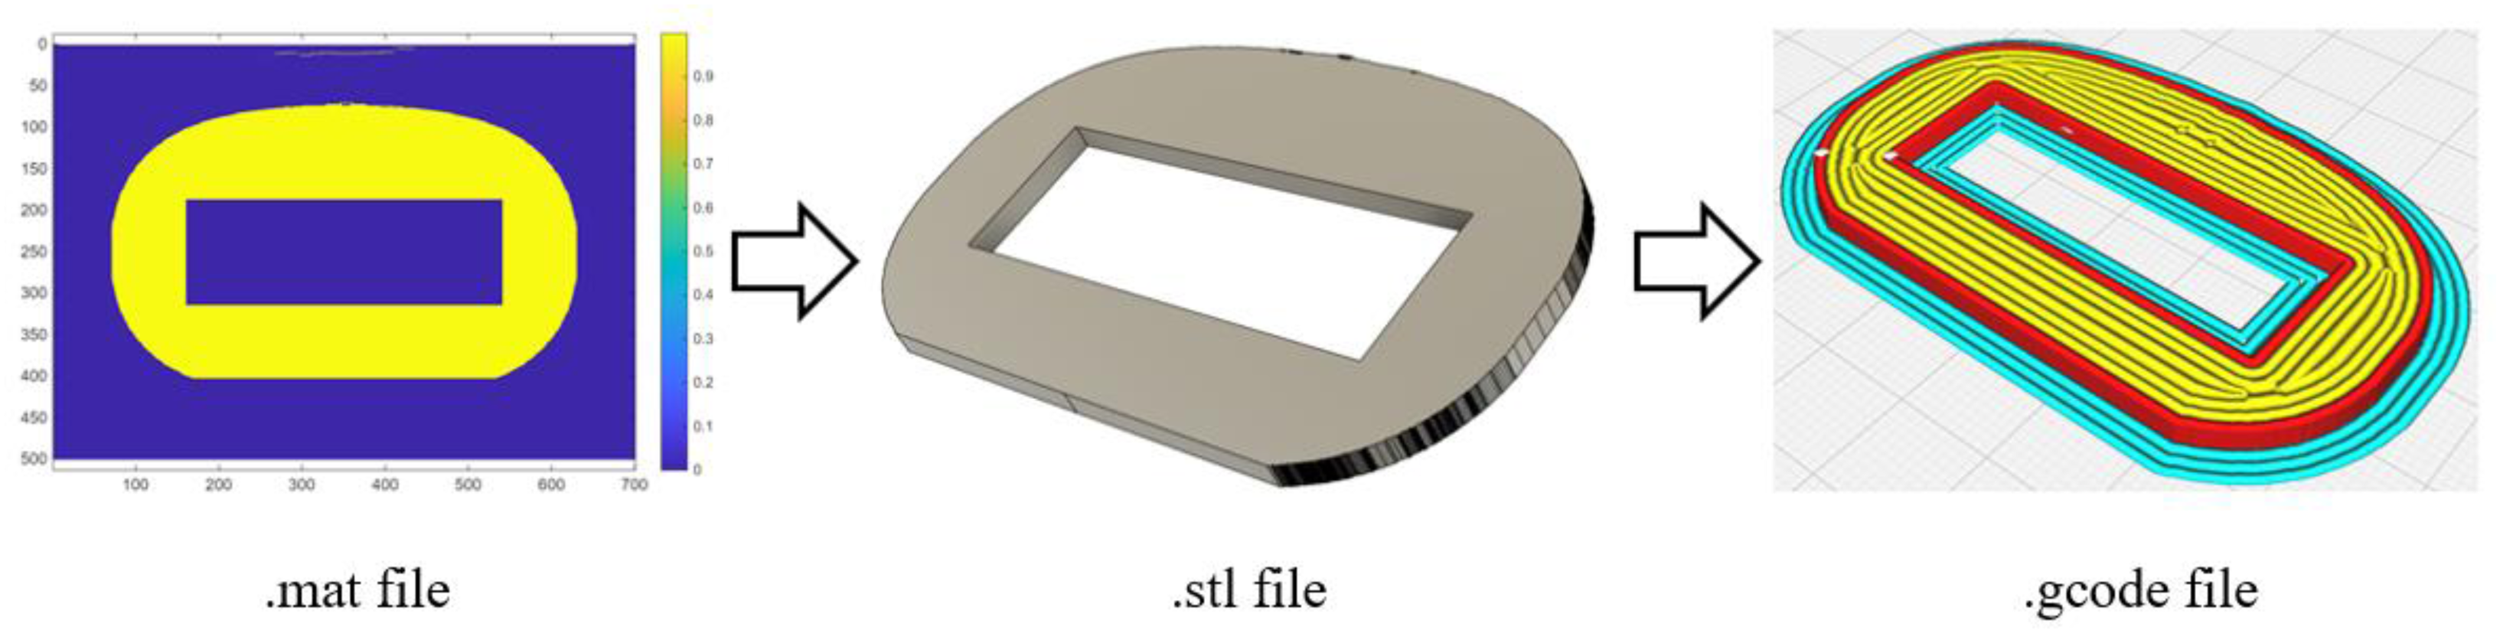
Transformation of the optimized shape into a printable 3D pattern.
Printing and thermal treatment
From the slicing pattern, the printing is done with a Proforge 4 printer (from Makertech 3D company) equipped with a Pulsar Atom pellet printing head (from Dyze Design company). The pellets used are made of polymer and FeSi-3% (from Polymim company). As shown on Figure 7, these green parts are put into a tubular oven in Argon atmosphere for the described thermal treatment. There is a first debinding stage at 600°C during 2 h, then a pre-sintering stage at 900°C during 1 h, and lastly the sintering stage at 1325°C during 2 h.
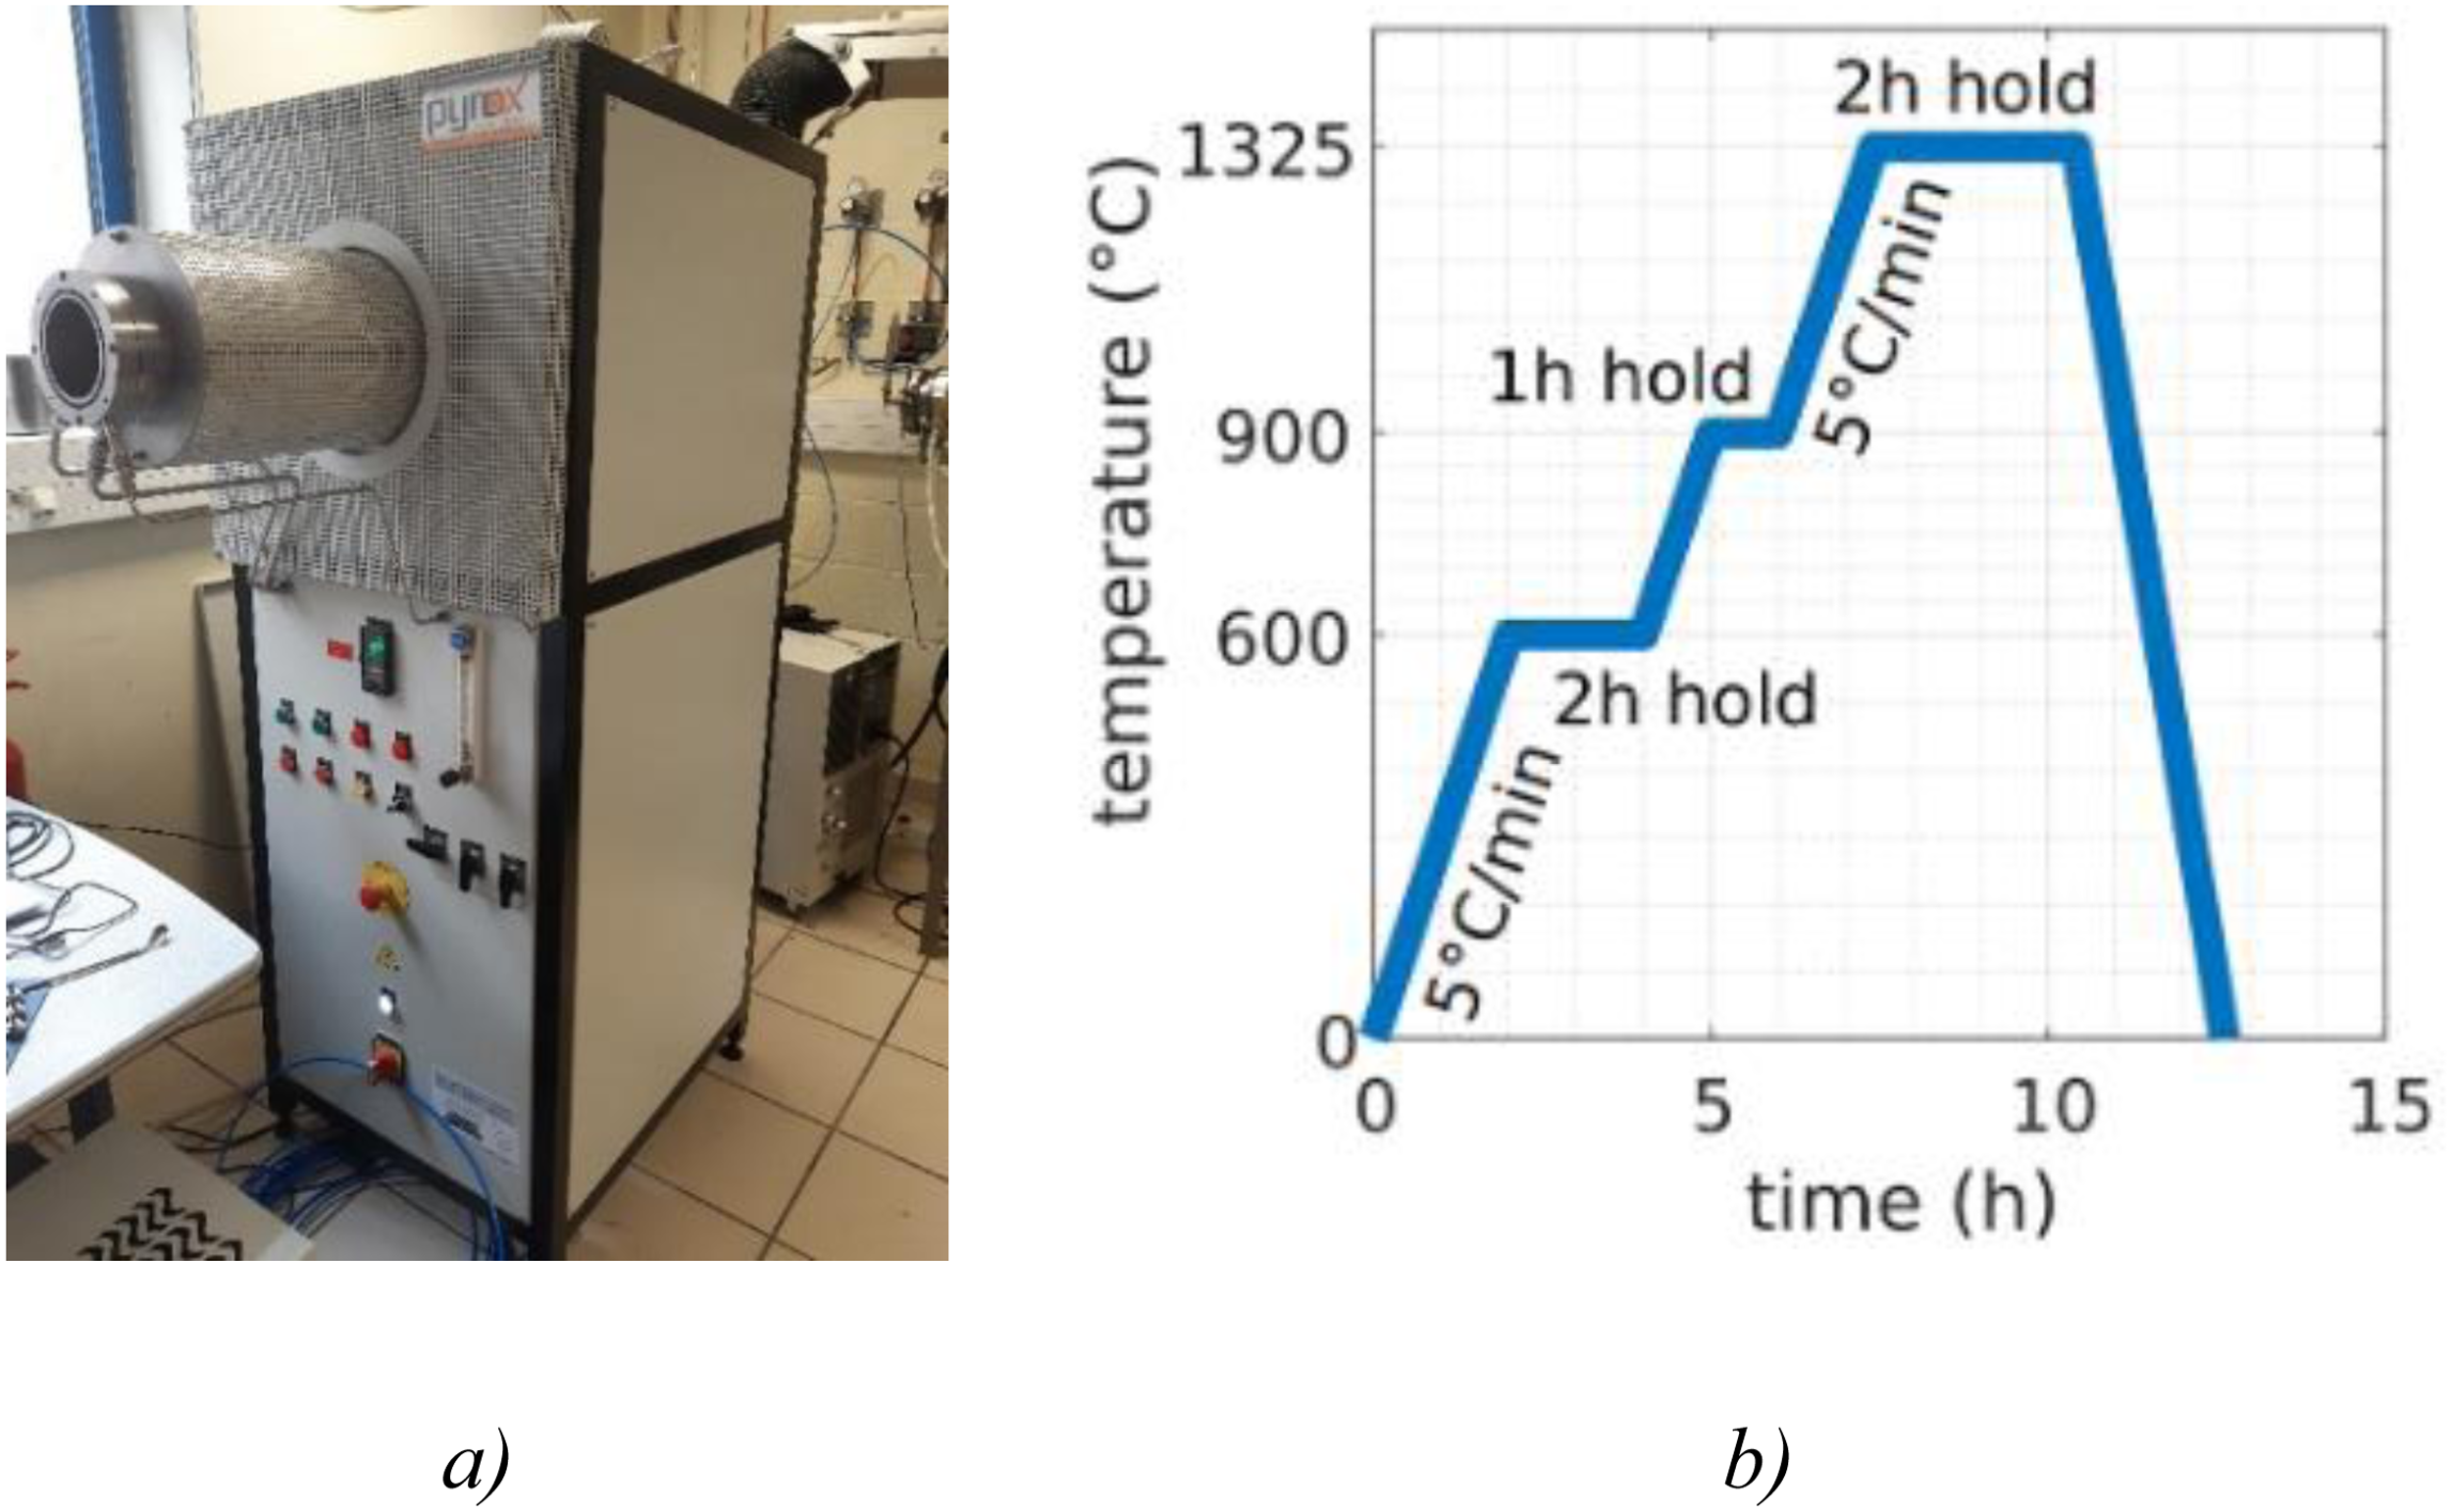
(a) Pyrox oven used for the thermal treatment; (b) manufacturer's debinding and sintering cycle of FeSi3% wt. pellets used for printing.
Printing of selected cores
As shown on Figure 8, four relevant cores will be printed, sintered, and characterized to be compared with modelling: the two 100% cores, optimized and reference, the 70%, and the 130%.
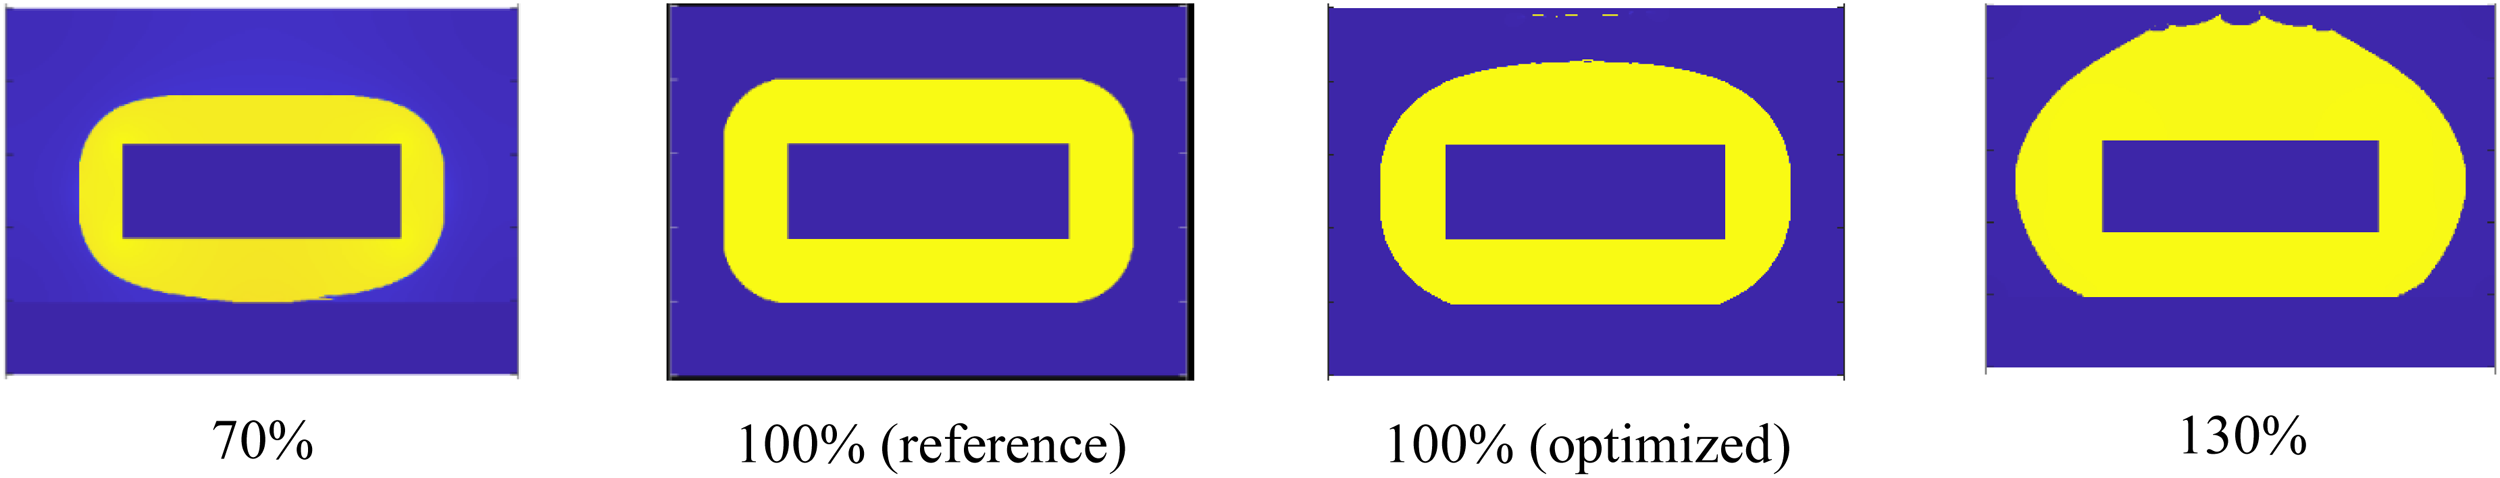
Shapes of the selected optimized cores for printing.
These shapes of the selected cores are sliced and printed. The top side of the Figure 9 shows the four selected cores after printing. The printing duration is approximately 8 min for the 70% core, up to 12 min for the 130% one. Each core is being printed twice. It can be seen that the printed cores have some defects, like little holes between printing lines, especially for 70% cores. It is due to the large size of the printing nozzle, 1,2 mm in our case. Then, the cores are being subject to the thermal treatment, as shown on the bottom side of Figure 9. The difference of color of the cores after thermal treatment can be noticed, attesting that the polymer is removed and they are fully made of FeSi.
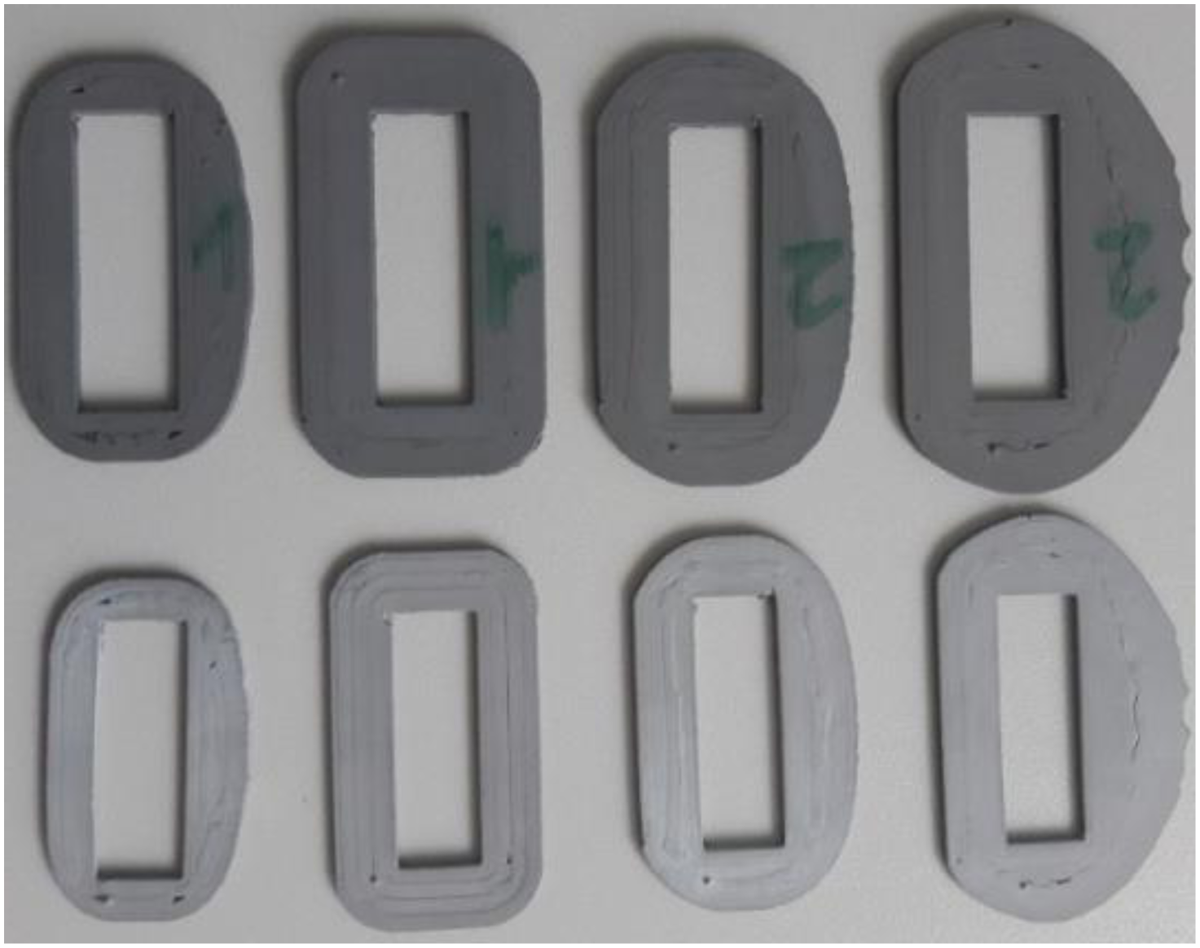
The printed cores. From left to right: 70%, 100% reference, 100% optimized, and 130% cores.
The principal characteristics (dimensions, mass…) of the cores must be analysed to see if the volume ratios imposed in the optimization are respected after printing, or if there are differences of volume having an effect on the measured inductance. The comparison of the masses of the printed cores are shown in Table 3. It can be said that the target ratios are globally coherent, even if for the 100% optimized printed core, there is the maximum difference of 3.51% noticed compared to the target. The differences can be due to the humidity of the pellets, as more humid pellets increase the material flow.
Masses, mass ratios and thicknesses of the printed cores.
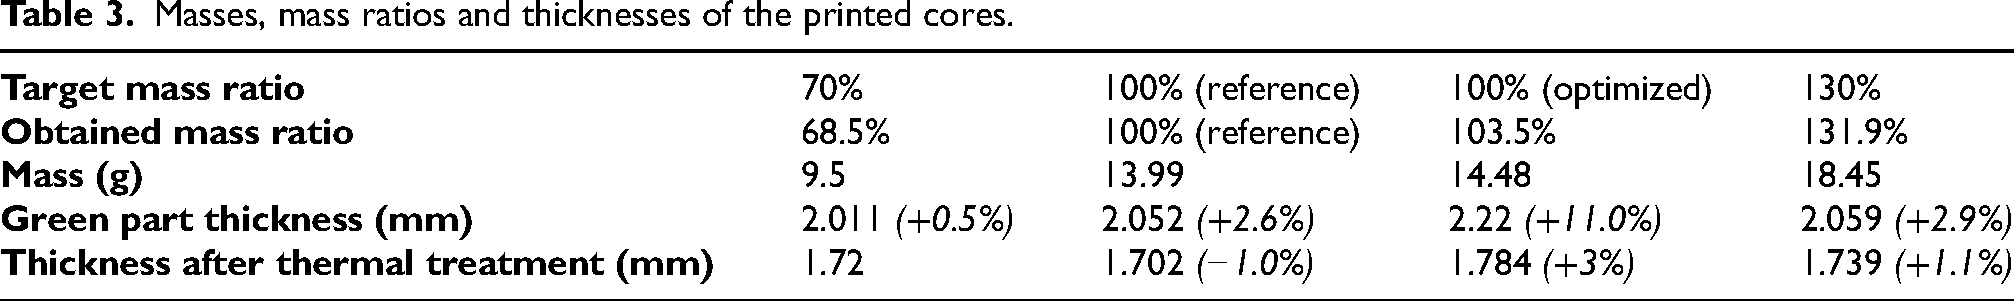
The thicknesses of the printed core are also shown in Table 3. There are some differences (written in italic) of thicknesses between printed cores compared to the target. The thickness of the 100% optimized green part is for instance higher by 11% compared to the 2 mm target, but this difference is reduced to 3.72% after thermal treatment. Although the other difference could be acceptable, it prevents the comparison of the two 100% cores, as the inductances difference could be in the same range as the thickness one.
Characterization of printed cores
Magnetic characterization process
To obtain the inductance of the printed cores and compare them to the modelling, a process of magnetic characterization is done. Firstly, the primary and secondary circuits are manually wound with two windings of 50 turns of 0.4 mm diameter enamelled copper wire. These windings are placed around the straight parts of the post-treated magnetic cores. An insulation by a simple adhesive is added between the core and the secondary winding, and then between the secondary and primary windings. An example of a wound core is shown on Figure 10.
A printed and post-treated core, after winding.
The core's parameters (weight, thickness, windings’ number of turns and resistance, density) are listed before the measurement sequence starts.
The last required parameter for magnetic characterization is the core's mean flux path length. It is easy to compute for a real ring core knowing its external and internal diameters, but more complex with the shape resulting from the TO. To do so, the shapes shown on Figure 8 are separately imported into the FEMM finite element software. After import, the inner window size is controlled to see if it is consistent with the expected one, F x G (Table 1). Two areas are also added to model the winding. An example of a resulting model is shown on Figure 11.
Example of flux density distribution for the reference core imported into FEMM software.
After that, a continuous current I is imposed in the areas dedicated to the winding having a known number of turns N. Then, the mean value of magnetic field H in the core is computed. Thanks to the Ampere's law
These ones are done with the ring core tester of a Brockhaus MPG 200 D magnetic measurements unit. The frequency is 50 Hz. The flux density varies by 50 mT steps, from 50 mT to the maximum possible one, manually defined before the real measurements because of the varying magnetic mean flux length between printed cores, and the maximum input current the ring core tester can give, 12 A. This maximum flux density varies from 1.45 T for the 130% core, to 1.70 T for the 70% one. The MPG 200 D is controlled to keep a sinusoidal flux density (or secondary voltage), having a form factor close to the limits of 1.1107 ± 1%.
Experimental results, and comparison with modelling
Figure 12 shows the inductance function of the input current. The inductance increases with material volume. The hierarchy between the inductances of the 4 cores is indeed respected, the 130% core having the highest inductance. Also, even if the volume gap of 70% and 130% core with 100% ones is the same at 30%, we can see that the increase of inductance is not the same.
Inductance versus peak current of the printed cores. The black dashed line represents the current's value of 0.43A used for cores comparisons.
A comparison of inductances is done at 0.43A, a current allowing to stay in the linear behaviour of all cores, as it was a hypothesis during the modelling stage. The optimized 100% optimized core has an inductance 24.6% higher than the 70% core. On the other hand, the 130% core has an inductance only 12.3% higher than the 100% optimized one. The tendencies are quite consistent with the numerical ones after optimization shown and explained in Figure 5, giving increases of 31.7% and 14.4% respectively.
Comparison of inductances values between experiments and modelling is done in Table 4. The only noticeable difference is for the 70% core, as the printed one has an inductance 8.8% higher than the modelled one. This difference can be explained by the little voids in the core which are not present in the shape during modelling. But globally, there is a good agreement of inductances between modelled and printed cores. Some refinements can be done in the future, but the principle of linking between TO and AM can be validated for this example of a magnetic inductance with a FeSi soft magnetic material.
Comparison of inductances values obtained by computation and measurement.
Regarding to the quality of measurements, the final form factor can be analysed up to a current of 0.5A. The greatest form factor appears to have a value of 1.17, which is 5.3% higher than the theoretical value of 1.1107 for a sinusoidal waveform, and slightly exceeds the tolerated divergence of 1%.
Conclusion
In this study, a link between TO and low-cost AM process is established. A meshed reluctances model has been implemented in an optimization process in order to maximize the inductance of a magnetic core having a volume constraint. The magnetic cores’ shapes resulting from the optimization are then printed with a fused pellets process, and the subjected to a thermal treatment. For a particular current, there is a good agreement of inductances values between modelling and experiment, attesting the validity of both the optimization process and AM processes.
As future prospects, the modelling process could evolve by taking into account non-linear material characteristics. Also, the magnetic cores could be printed with a thinner nozzle diameter, allowing to reduce the number of printing defects.
Footnotes
Acknowledgements
This work was done in the perimeter of “Energie Electrique 4.0” project, funded by Hauts-de-France regional council, European Union and French government. The help of additive manufacturing platform in Centrale Lille by sharing experiences and equipment was important, many thanks to Denis Najjar and Jean-François Witz.
Ethical approval
Not applicable.
Funding
The authors disclosed receipt of the following financial support for the research, authorship, and/or publication of this article: This work was supported by the Région Hauts-de-France, (grant number Energie Electrique 4.0 project).
Declaration of conflicting interests
The authors declared no potential conflicts of interest with respect to the research, authorship, and/or publication of this article.