
Abstract
The Halbach array arrangement optimizes the magnetic field distribution and enhances the conversion efficiency of electromagnetic energy conversion. In this experiment, the Halbach array arrangement was used to design and build a microgenerator system that integrates three parts: brushless motor drive, energy conversion, and high-precision measurement and recording. By innovatively combining field-oriented control (FOC) with an Arduino high-precision acquisition system, real-time precise measurement of mechanical input power and electrical output power was achieved. The influence of ten key factors, including the properties of the magnetic field lines, air gaps, and coils, on energy conversion efficiency was systematically investigated. The performance advantages of the Halbach array in improving energy conversion efficiency were verified. At the optimal parameter combination (air gap 1 mm, strong magnet, 6 coils, load 30 Ω, speed 360 r/min), the energy conversion efficiency reached 83.9%, about 20% higher than the traditional arrangement, providing experimental basis for efficiency optimization design of micro-generators.
Introduction
Since Faraday discovered electromagnetic induction in 1831, generator technology has evolved over nearly two centuries to become a core component of modern industrial and renewable energy systems. In recent years, the rise of new energy technologies has put forward higher requirements for the lightweight and efficiency of generators, and the optimization of electromagnetic induction systems has once again become a research hotspot.
The Halbach array is a special arrangement of permanent magnets that enhances the magnetic field on one side while nearly completely shielding it on the other by regulating the magnetization direction. This configuration has the potential to significantly improve magnetic field utilization. As Liu et al. 1 found in disc motors, the Halbach array can increase the air-gap magnetic density by 30%; Mafi et al. 2 verified the advantages of the Halbach array in optimizing the magnetic field from the perspective of mechanical output; Zhao et al. 3 and Zhu et al. 4 demonstrated in large wind turbines and axial flux generators that the Halbach array could significantly increase the sinusoidal flux density of the air gap and reduce the harmonic content. Li et al. 5 also reached a similar conclusion in the permanent magnet linear synchronous motor through finite element analysis, preliminarily verifying the advantages of the Halbach array in magnetic field regulation.
However, these studies have mostly focused on simulation analysis or the influence of a single factor, lacking systematic experimental research on the coupling of multiple parameters in micro-systems. For example, Deng et al. 6 designed a micro-generator driven by the recoil force of a cannonball, converting linear motion into rotational motion through a lead screw mechanism, and explored the influence of parameters such as coil turns, rotational speed, and air gap on the induced electromotive force. But it uses a traditional magnet arrangement and does not involve the optimization effect of the Halbach array. Zhang et al. 7 applied the annular Halbach array to the energy harvesting of bearing motion and achieved output power of 50.8 to 131.1 mW and power density of 4.43 mW/cm3 at 600 to 1000 r/min, verifying the feasibility of the Halbach array in the micro-energy conversion system. Shuaibu et al. 8 also noted in the review that although Halbach arrays are widely used in various types of motors, the combined impact of Halbach arrays on energy conversion efficiency under actual dynamic operating conditions has not been fully validated.
To this end, this study provides several innovations and advancements in the following aspects. First, unlike existing studies that rely on simulations or single-parameter tests, this study designed and built an integrated micro-generator experimental system comprising three modules: motor drive, energy conversion, and high-precision measurement. We further innovatively integrated FOC with an Arduino-based system to measure energy conversion efficiency. Second, this study comprehensively evaluated the impact of ten key factors, including rotor diameter, air gap size, magnetic field strength, load resistance, rotor speed, number of magnets, coil specifications and quantity, on energy conversion efficiency in micro-generators under dynamic operating conditions. Third, this study quantitatively verified the performance advantages of Halbach arrays in actual dynamic systems. Experimental results show that the energy conversion efficiency can reach 83.9% under the optimal combination of parameters. This study provides a systematic experimental basis and optimization direction for the efficient design and engineering application of micro-generators.
Experimental system
This experimental setup consists of three parts: the motor drive system, the energy conversion system, and the measurement and recording system. The physical diagram of the setup is shown in Figure 1.
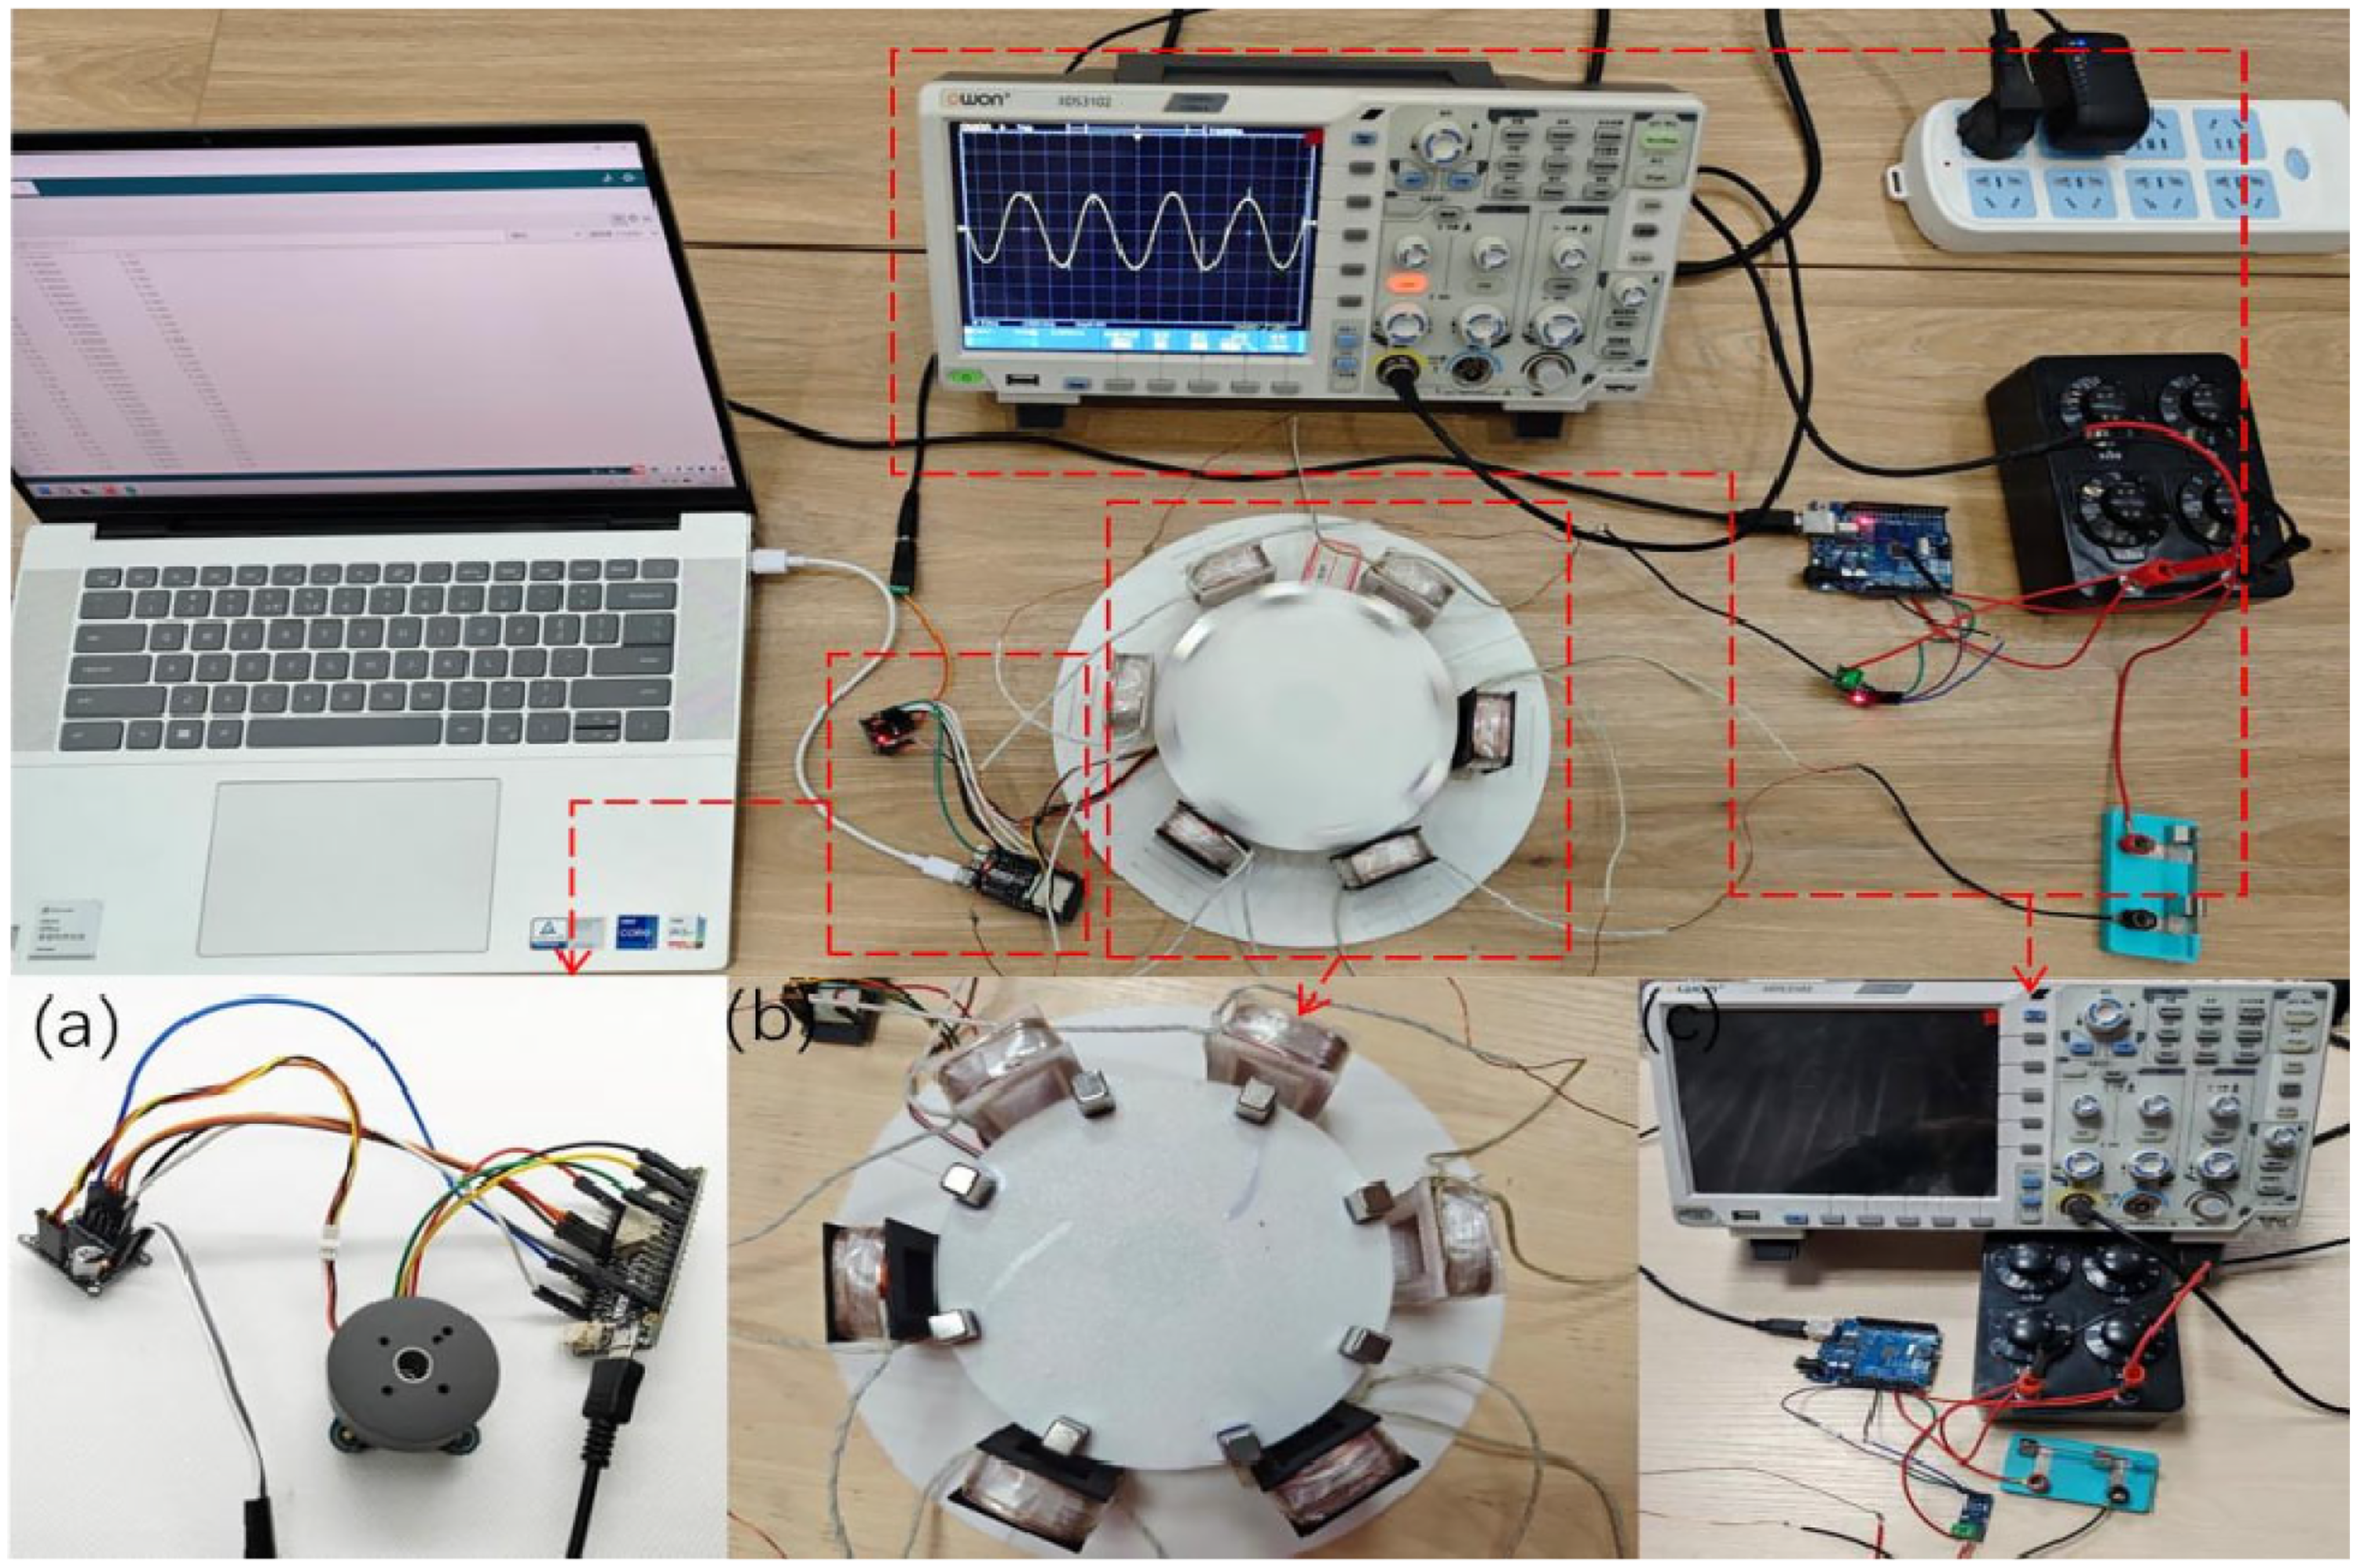
Physical diagram of the entire device:(a) motor drive system. (b) energy conversion system. (c) measurement and recording system.
Motor drive system
In this experiment, a 2804 brushless DC motor (Figure 2(a)) was used as the drive unit for the micro-generator. When the motor is running, the ESP32 main control board (Figure 2(c)) generates PWM control signals according to the preset speed instructions. This signal is sent to the SimpleFOC driver board, which uses its internal three-phase inverter circuit to regulate the switching sequence of the U, V, and W phase lines. When the driver board supplies power to the motor's three-phase lines in a specific order, the rotor generates a rotating magnetic field, driving the permanent magnet rotor to rotate synchronously. The magnetic encoder continuously detects the rotor position and feeds back to the ESP32, forming a closed-loop control to ensure smooth motor operation.
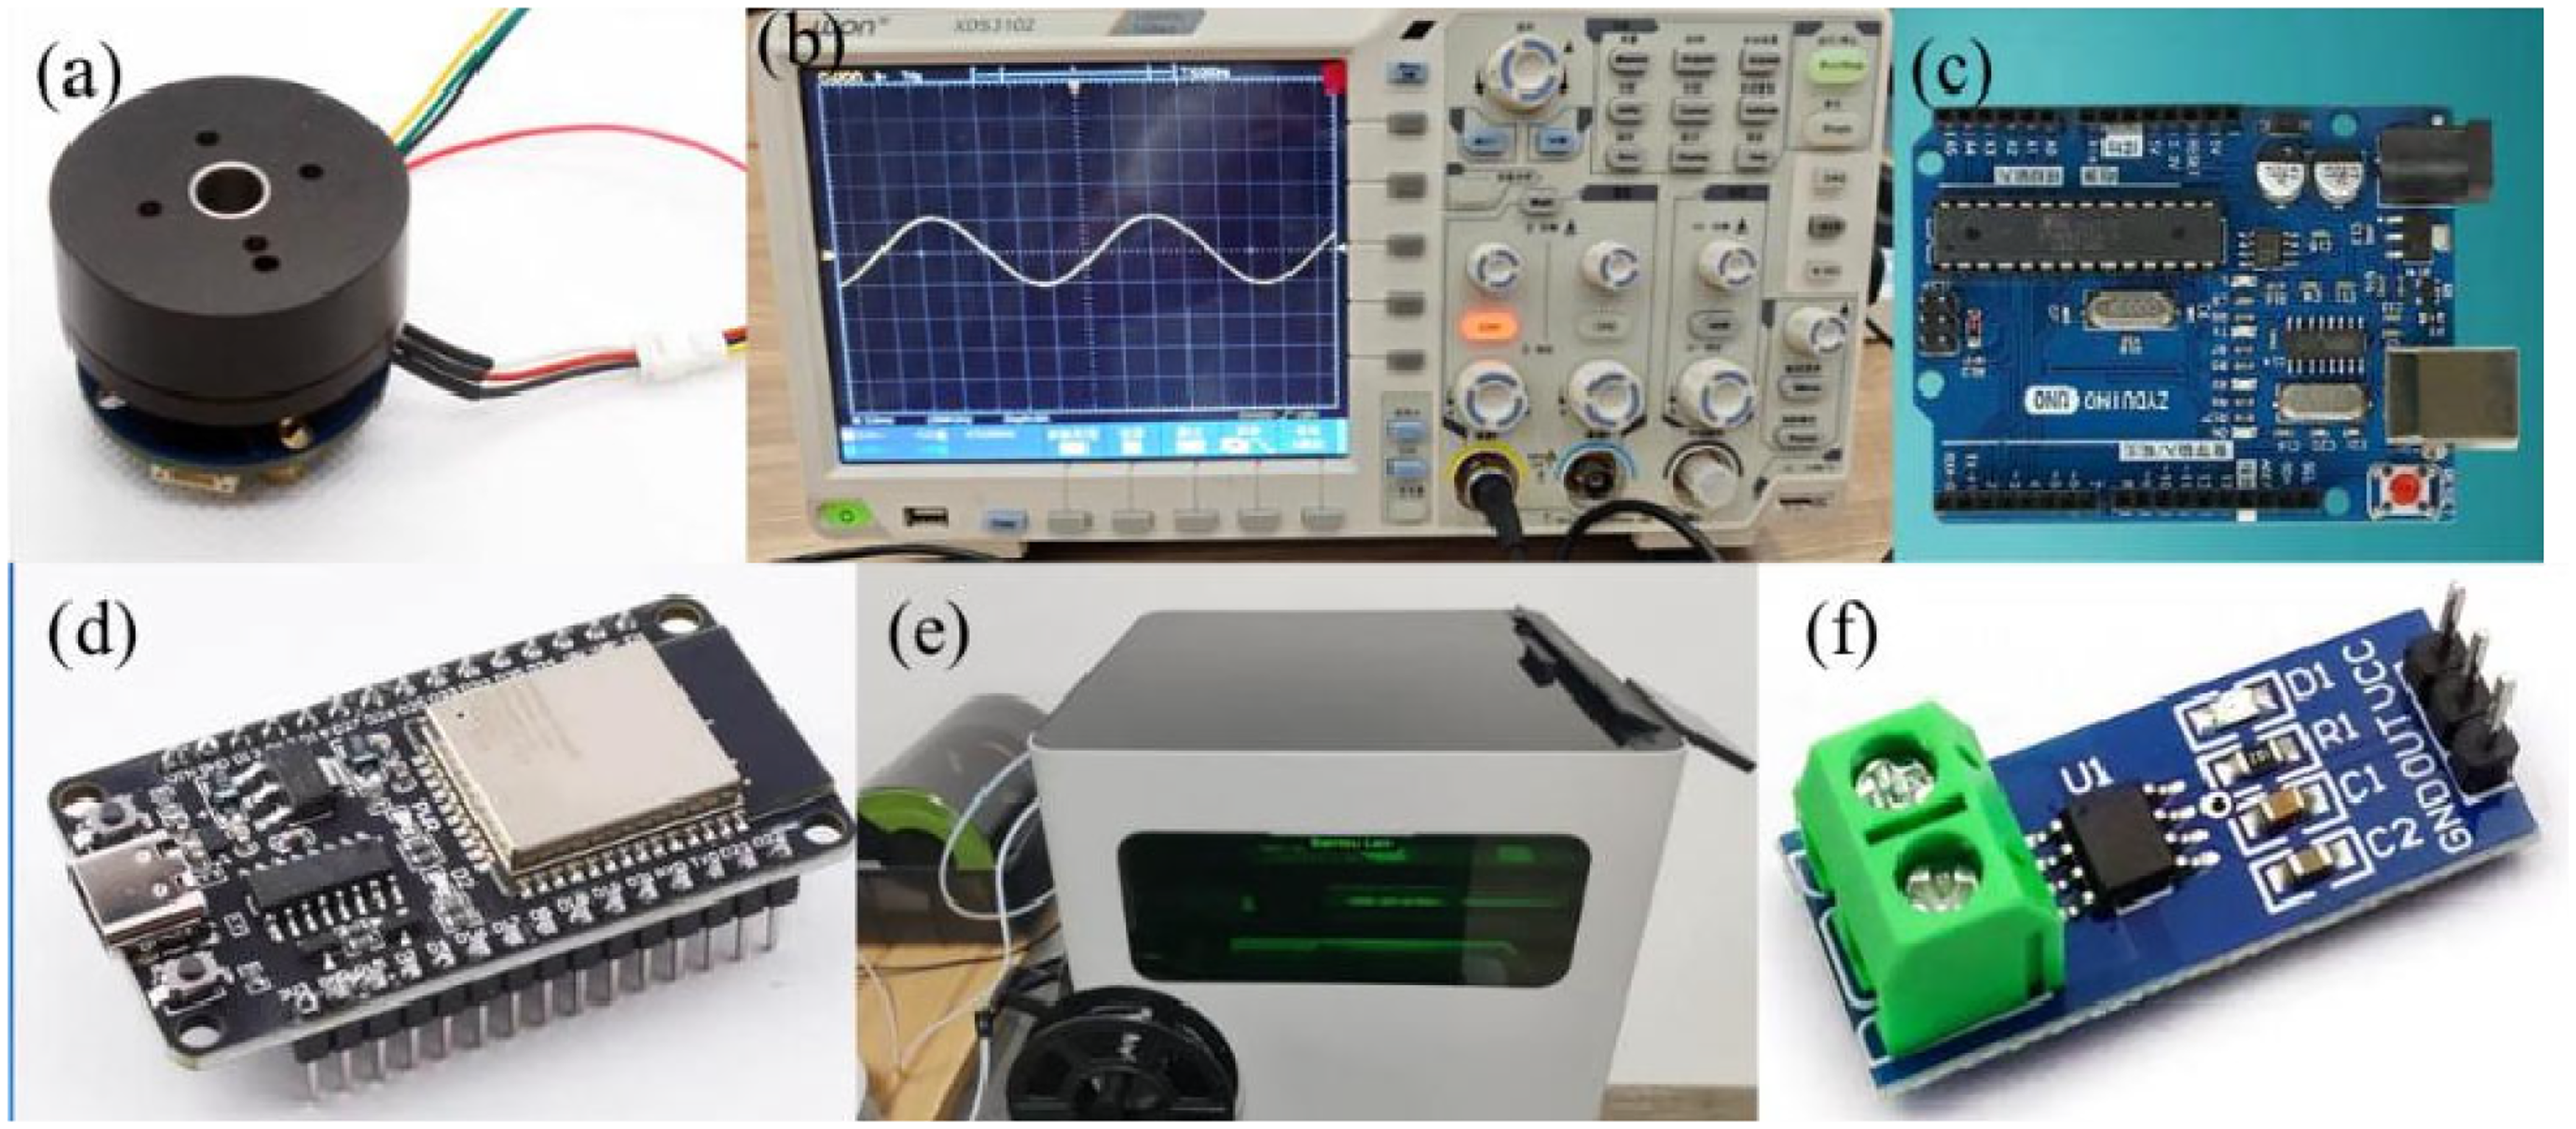
Physical image of the experimental apparatus.
The speed control uses the field-oriented control (FOC) algorithm. When the command “v” is input, the system automatically enters the closed-loop speed mode, and the micromotor operates at a fixed speed. When an external force is applied to the disk, the rotational speed initially drops. The ESP32 reads the speed signal and controls the SimpleFOC mini driver board to apply a greater torque to the motor. Through this feedback loop, the motor speed stabilizes, and the increase in torque corresponds to the torque exerted by the external force.
Energy conversion system
The energy conversion system consists of rotor magnets and stator coils. In recent years, 3D printing technology has developed rapidly in the field of precision manufacturing, enabling the rapid formation of complex structures and reducing manufacturing costs. 9 This paper makes full use of 3D printers (Figure 2(e)) to achieve integrated design and manufacturing of rotor discs, base plates and coil frames. In the rotor section, neodymium iron boron magnets were evenly distributed along the edge of the disk, and the motor was fixed in a circular groove beneath it, forming a concentric circle layout for synchronous rotation. In the stator section, the coil was inserted into the corresponding groove on the base plate, ensuring that the center of the stator coil is tangent to the rotor disk. By adjusting the distance between the groove and the center, the air gap between the rotor magnet and the stator coil can be indirectly controlled, ensuring experimental repeatability.
The rotor disk is driven by a micromotor to rotate, and the stator coil cuts the magnetic field lines to generate an induced electromotive force. When the circuit is closed, an induced current is generated, which is conducted through the wires to the circuit of the measurement and recording system.
Measurement and recording system
The measurement and recording system is mainly composed of the ACS712 current sensor (Figure 2(f)), the voltage measurement unit (resistance box and Arduino analog input pins), the data acquisition equipment (Arduino Uno development board (Figure 2(d)) and the computer), and the digital oscilloscope (Figure 2(b)). Data acquisition systems based on Arduino have been proven to be a low-cost, highly reliable solution in areas such as photovoltaic testing 10 and electromagnetic generators. 11
In the experiment, the generator output is connected in series with the resistance box and current sensor to form a closed loop, and the current signal is converted to voltage by the sensor and input to the Arduino analog pin; Both ends of the resistance box are connected to the other two analog pins of the Arduino to measure the voltage difference, and the waveforms are observed in parallel with the oscilloscope probes. The Arduino transmits the collected instantaneous current and voltage values to the computer, where real-time monitoring is achieved through programming and the energy conversion efficiency is automatically calculated in combination with parameters such as torque.
Theoretical model and simulation verification
Magnetic field attenuation and average magnetic flux density
The magnet dimensions are 30
Magnetic field attenuation of the magnet
The magnetic field produced by permanent magnets follows the magnetic dipole theory, but in the near-field region, the influence of its physical size needs to be taken into account. Taking the magnetization direction as the reference, we define a characteristic length
According to the far-field characteristics of the magnetic dipole, when
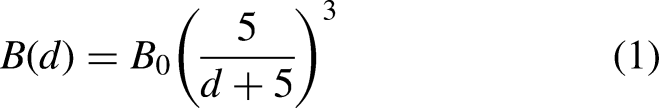
The surface magnetic flux density of a magnet measured with a Gauss meter is 0.25 T. A comparison between the measured values and the theoretical values is shown in Table 1.
Variation of magnetic flux density of a permanent magnet with distance.
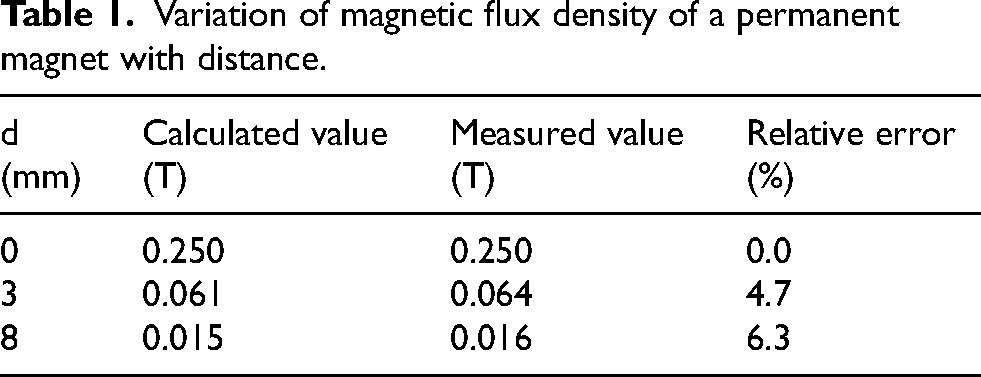
The relative errors between the measured values and the calculated values from Formula (1) at the three distances in Table 1 indicate that this empirical model has high prediction accuracy within the range of 0–8 mm. A comparison reveals that the error increases slightly with distance, indicating a decrease in the model's fitting accuracy at larger distances.
Calculation of the average magnetic field intensity in the coil area
Radwan-Praglowska et al.
12
pointed out in their modeling study of axial flux generators that there is a significant magnetic field attenuation effect at the edge of the magnet, and the coil has a 15 mm thickness radially, which requires the integration and averaging of the nonlinear attenuation magnetic field: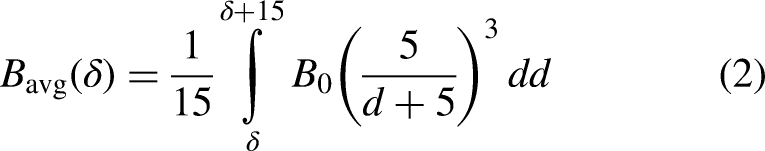
Let
Replace the variables and simplify the above integration to get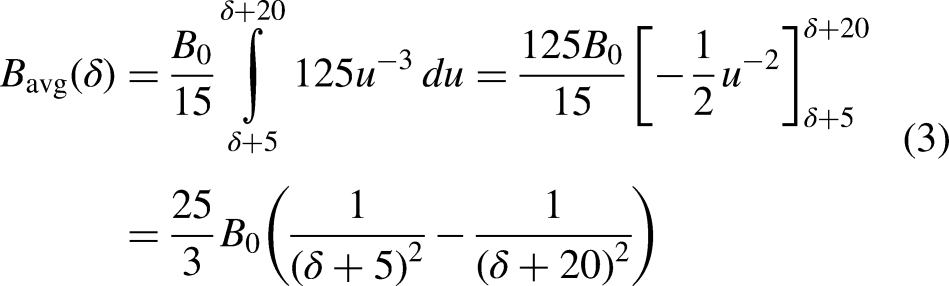
Here,
Generator output voltage
Let the number of turns of the coil be N, the radius of the rotor disk be R, the rotational speed be n (r/min), the number of magnets be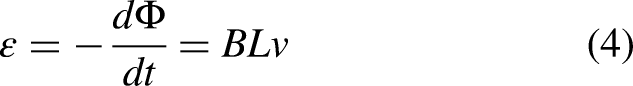
In this device, the coil is fixed, the magnet rotates, and the cutting speed is determined by the rotational speed and the radius of the rotor disk. Then the centerline velocity of the magnet: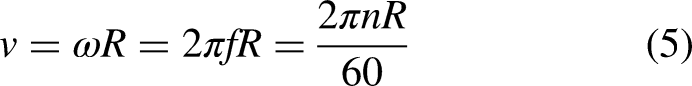
If the effective cutting length of a single-turn coil is taken as the tangential width 
Here, k is an empirical correction factor that accounts for the number of magnets, the spatial distribution of the magnetic field, and the coil configuration; its value is determined experimentally.
Transient analysis of COMSOL generator model
To gain a deeper understanding of the magnetic field distribution of the microgenerator and to quantitatively validate the efficiency enhancement principle of the Halbach array before the formal experiment, this paper uses COMSOL Multiphysics 6.3 to establish a two-dimensional electromagnetic field model. The accuracy and reliability of the software in magnetic field simulation have been widely verified. Li et al. 13 and Fang Z 14 conducted simulation analyses for the magnetic field distribution of Halbach arrays and permanent magnets respectively. By comparing the simulation results with the theoretical model, the effectiveness of COMSOL in magnetic field visualization and quantitative analysis was confirmed. Based on this, this paper sets the stator and rotor parameters according to the actual size, presents the flux density in each region intuitively through transient analysis, and predicts the output voltage waveforms under different operating conditions.
To enhance magnetic flux guidance and visualize field distribution, a guard iron (composed of soft iron material with a conductivity of 0) was placed outside the coil in the virtual simulation experiment. Figure 3 and 4 show the flux density mode distribution in alternating and Halbach arrangements when the number of magnets is eight and four respectively, as well as the relationship between the X-component of the flux density mode at a point on the stator and the coil voltage over time in both arrangements. It can be seen from the graph that the magnetic field distribution of the Halbach array does have the function of concentrating the magnetic field on the outside, and for the peak output voltage, the Halbach array arrangement is superior to the alternating arrangement, verifying the advantages of the Halbach array magnet arrangement through simulation.
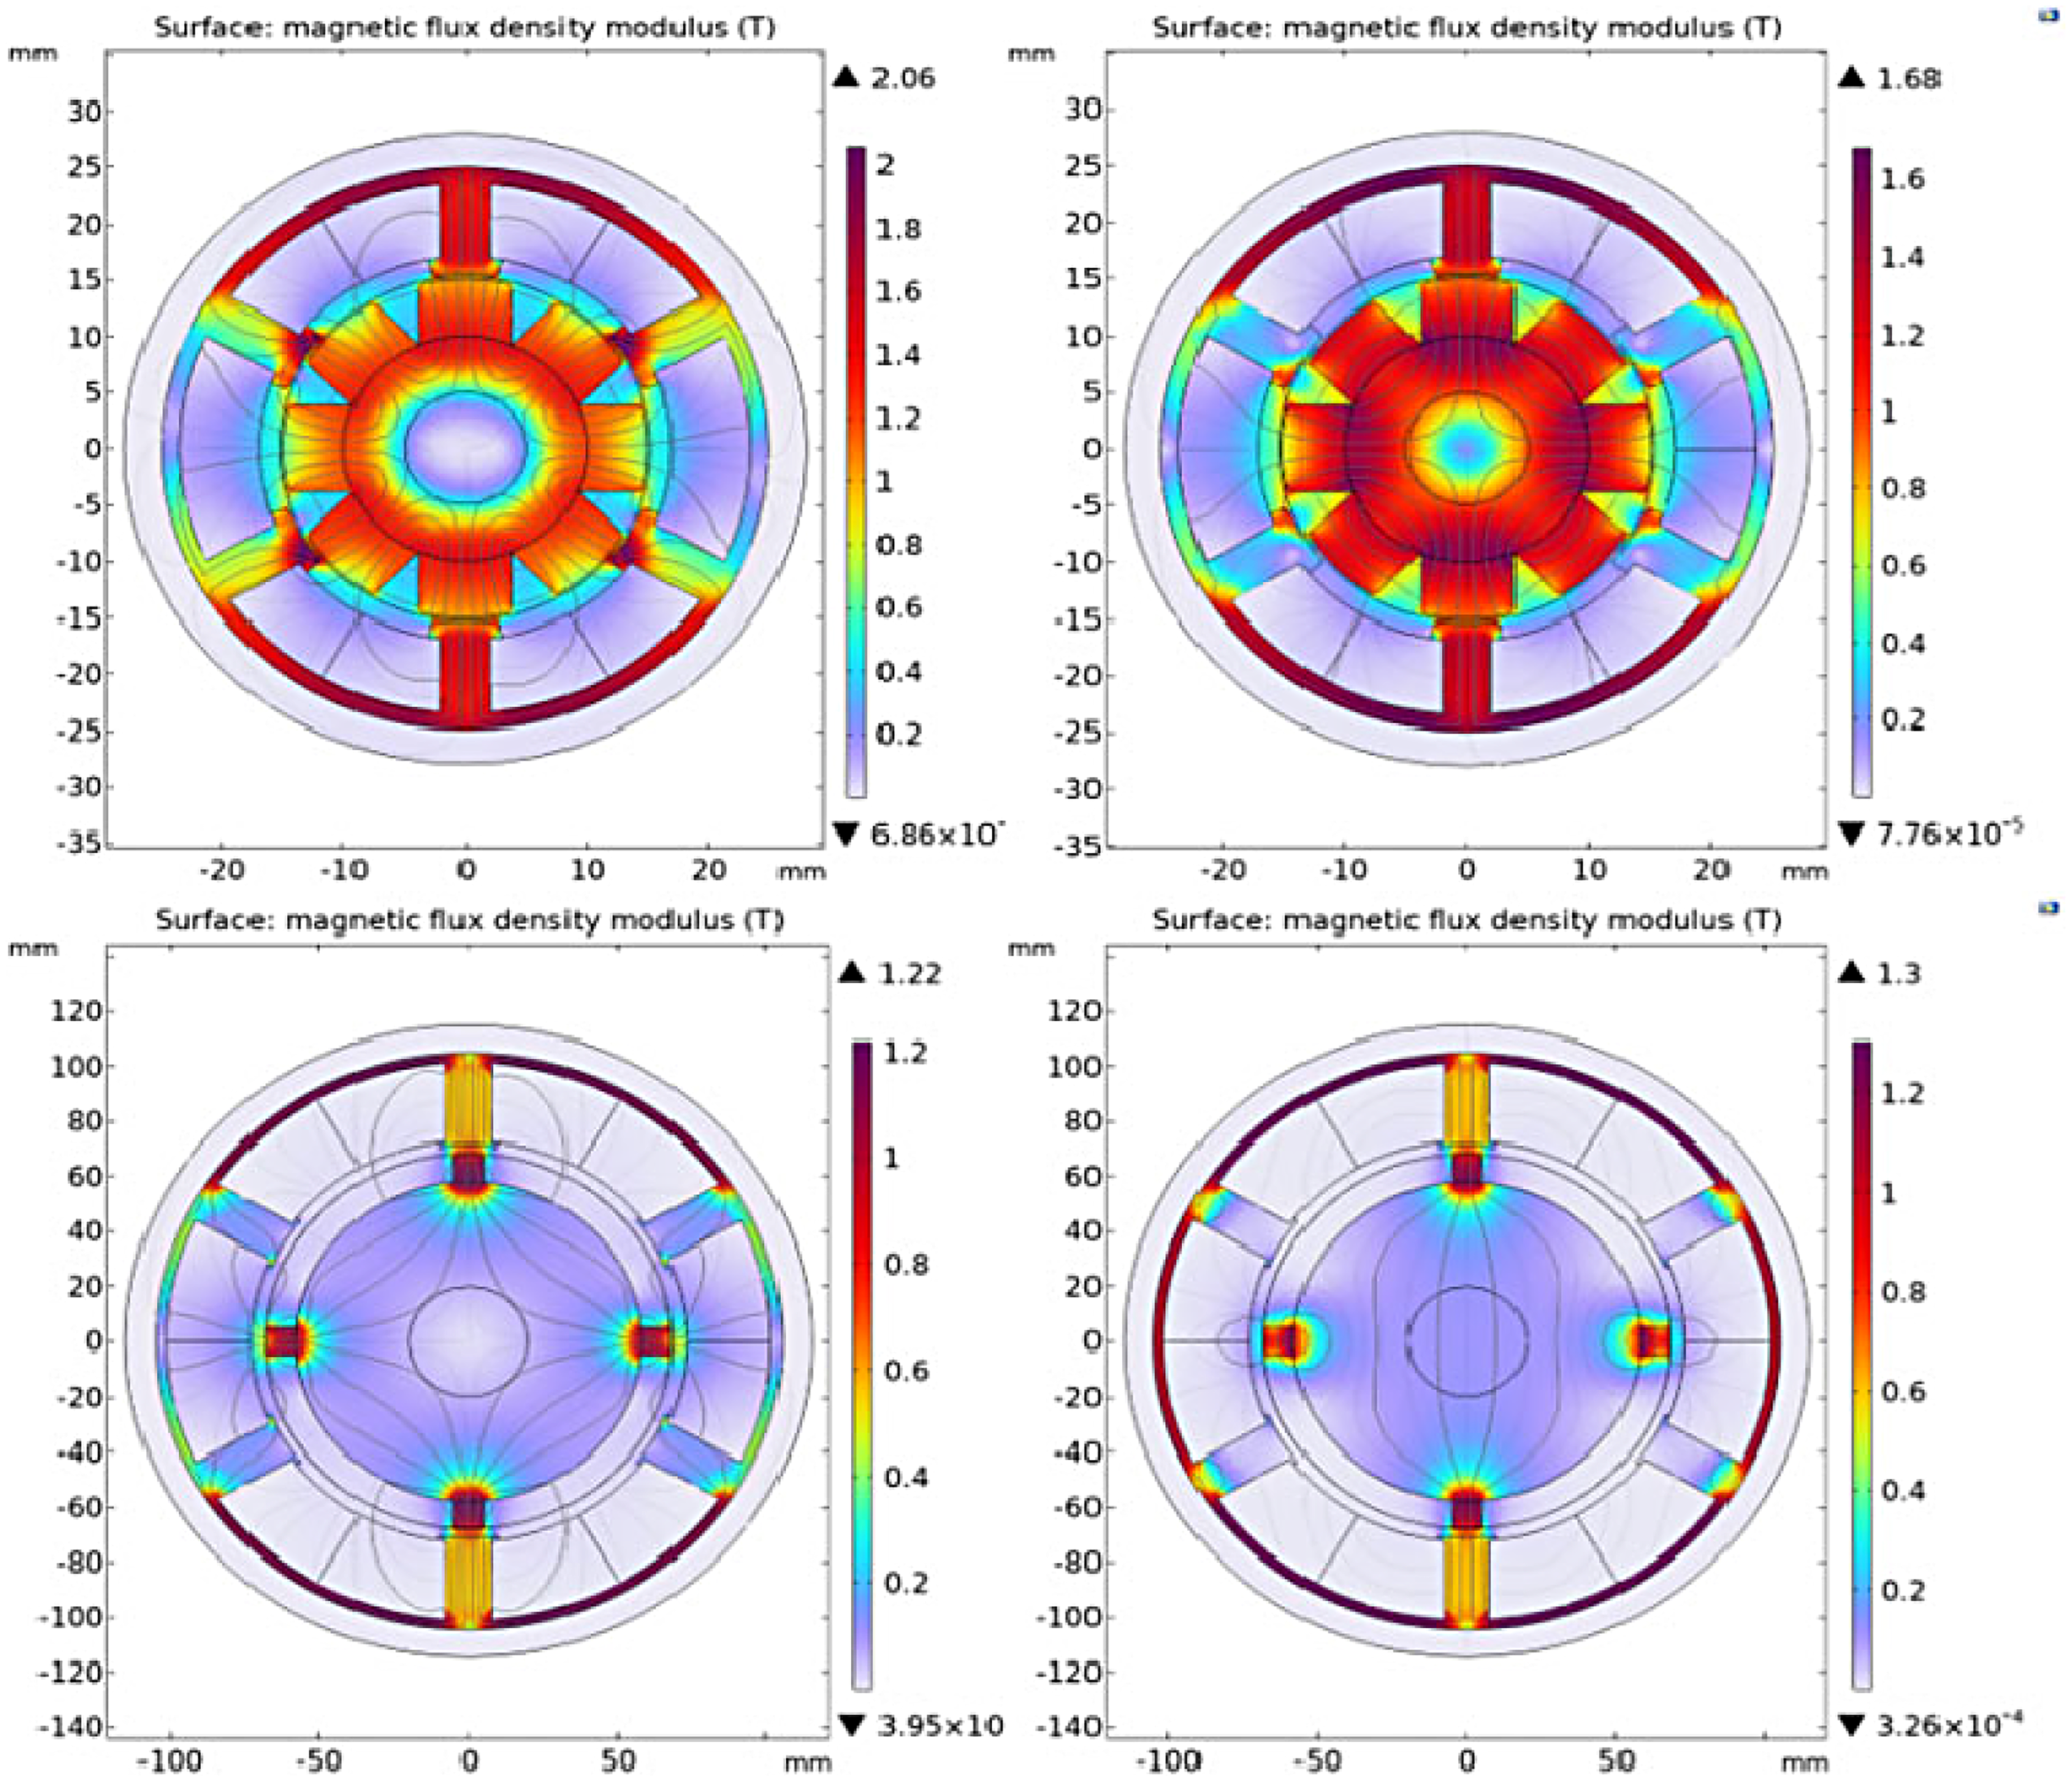
Simulation of flux density mode distribution.
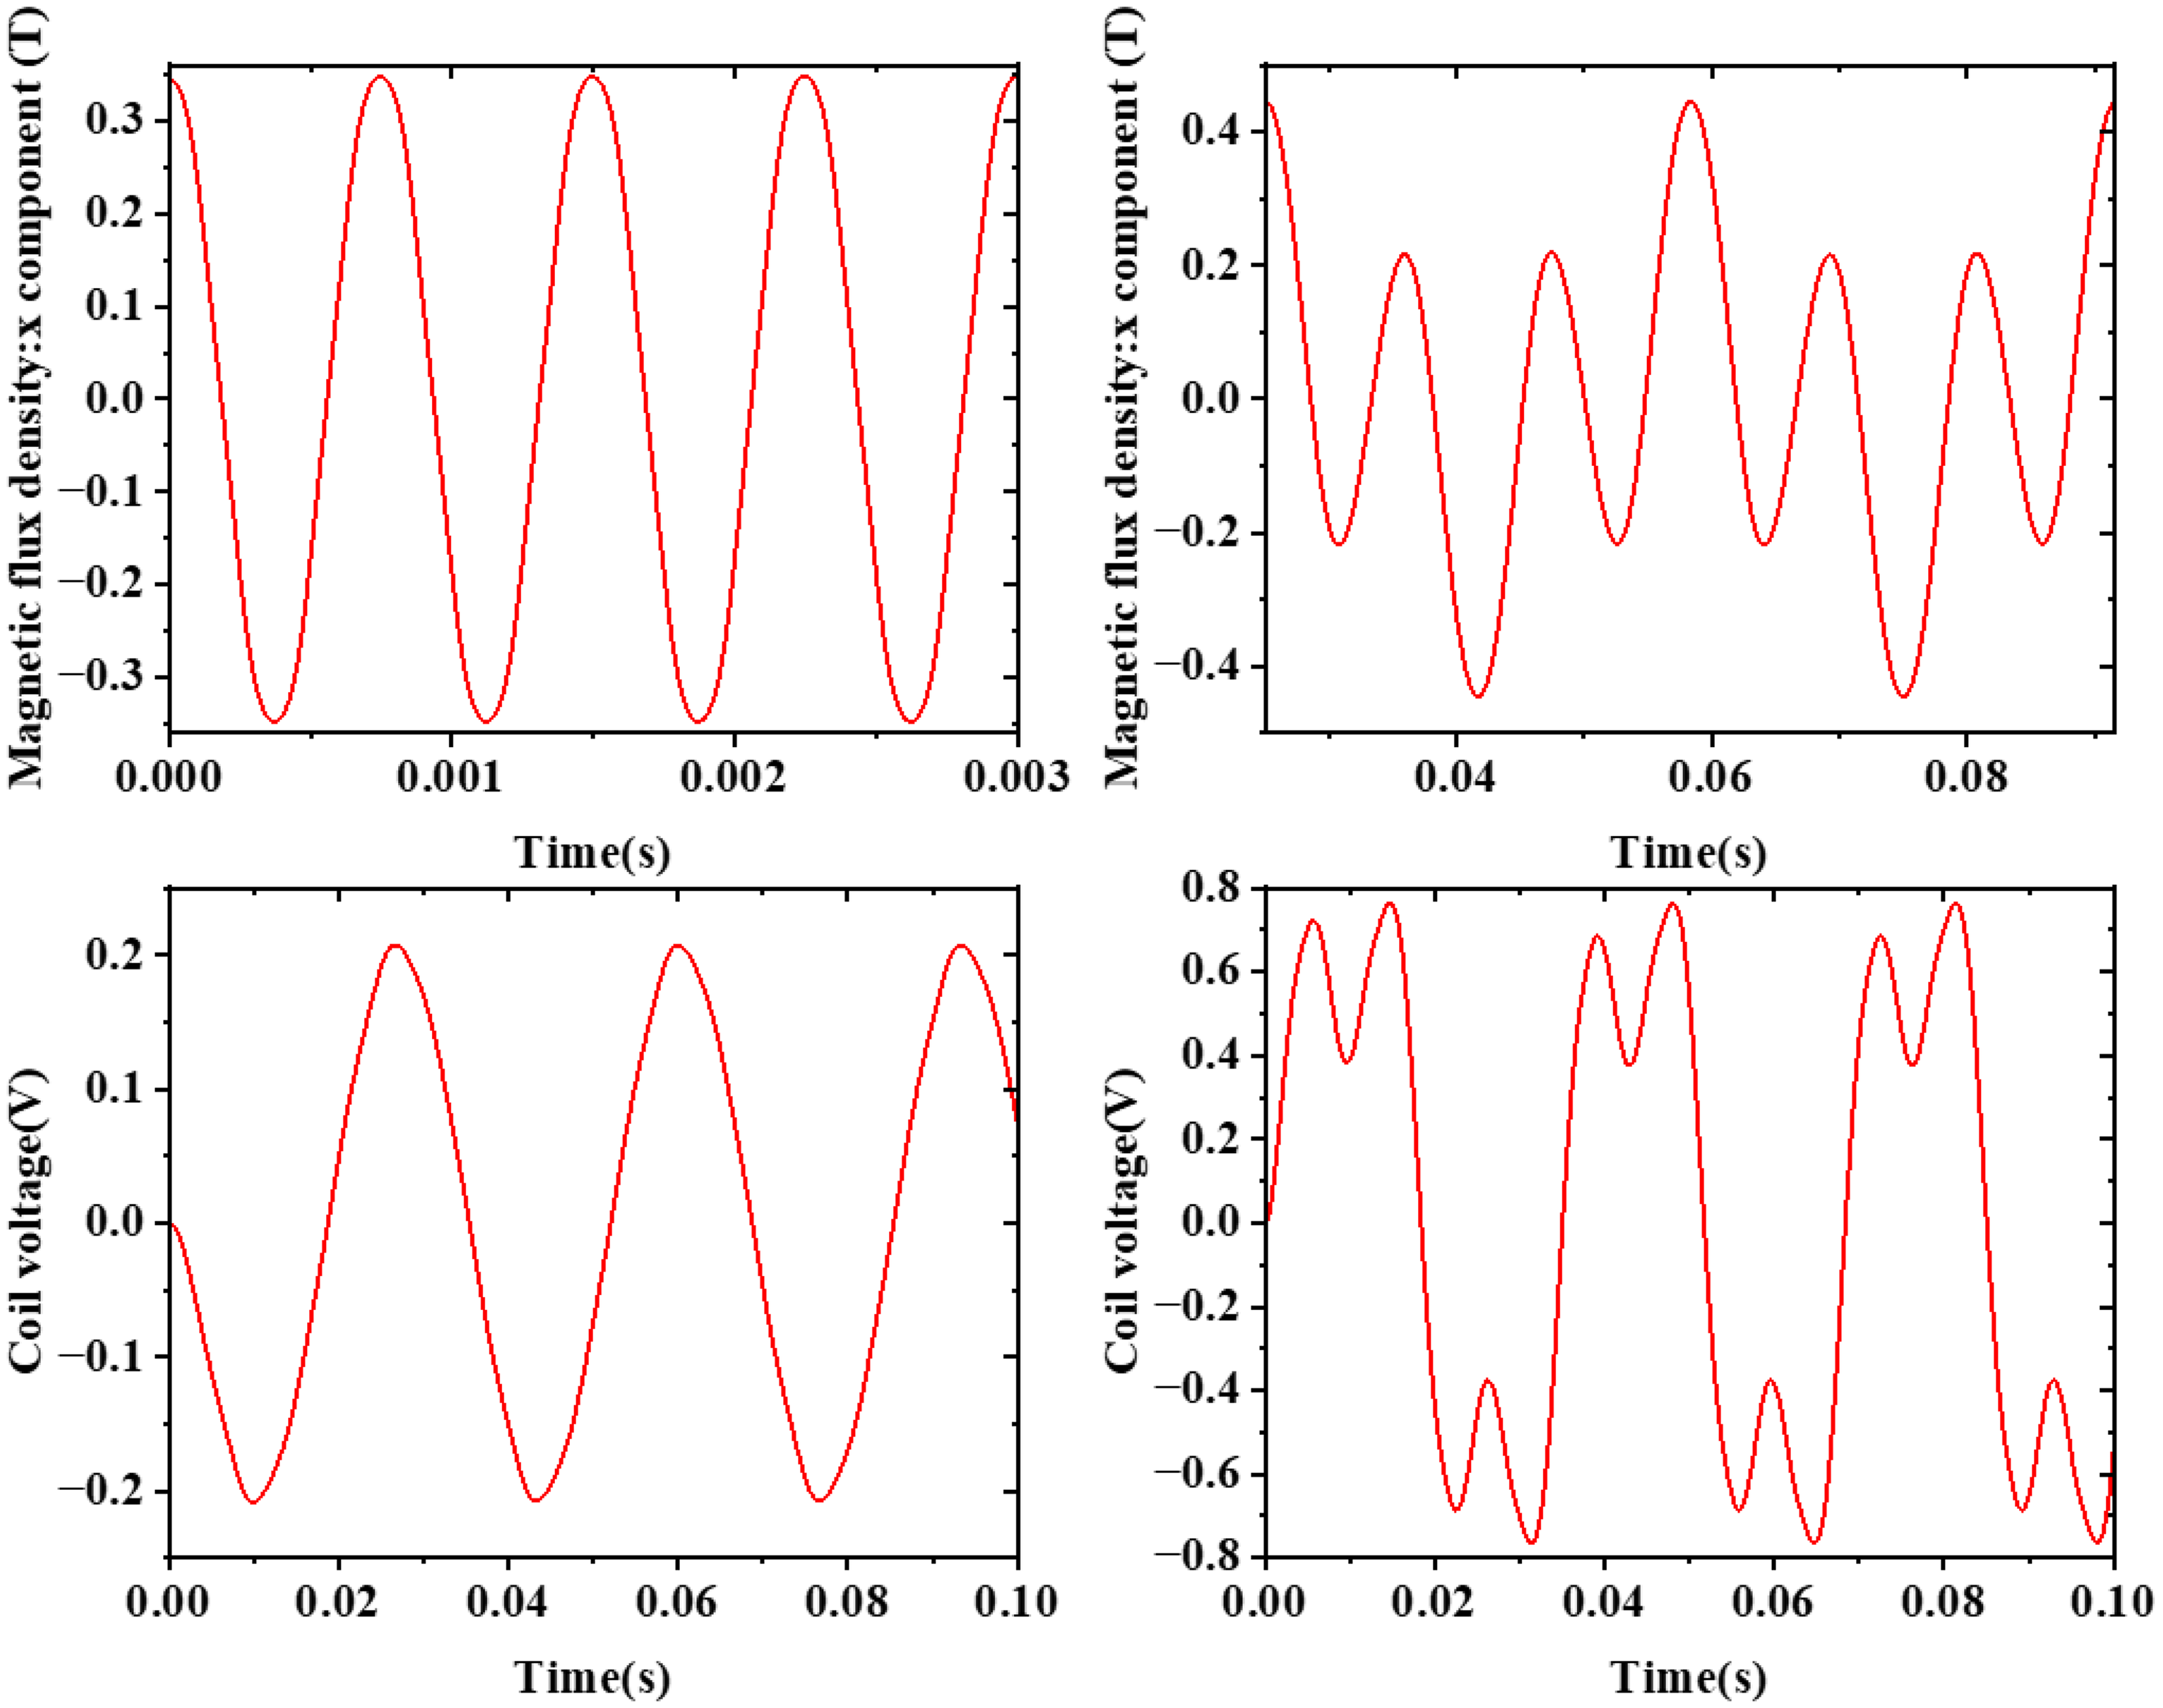
Air-gap flux density and voltage over time under alternating arrangement (left) and halbach arrangement (right).
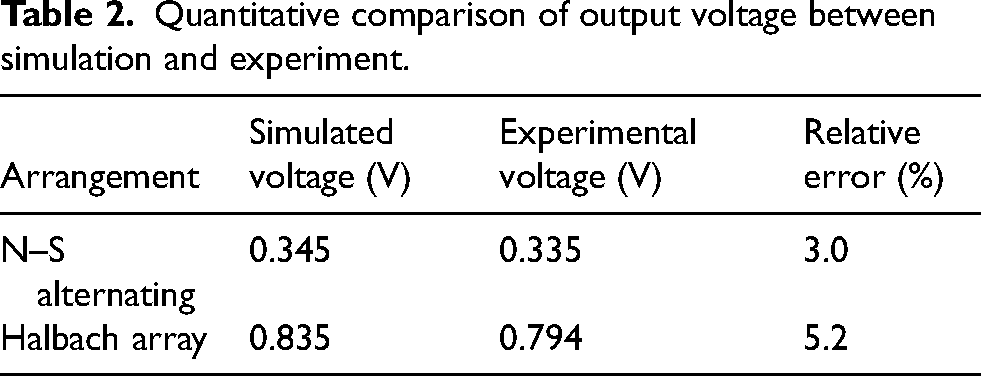
To further quantitatively evaluate the consistency between simulation and experiment, we removed the guard iron previously set in the simulation and compared the output voltage predicted by the simulation with the experimental measurements under the same conditions, as shown in Table 2. The results indicate that the relative errors of the output voltage between simulation and experiment for both arrangements are below 6%, confirming the reliability of the simulation model.
Quantitative comparison of output voltage between simulation and experiment.
Calibration data.
Measurement procedures
The experimental procedure is shown in Figure 5, and the specific measurement method is as follows.
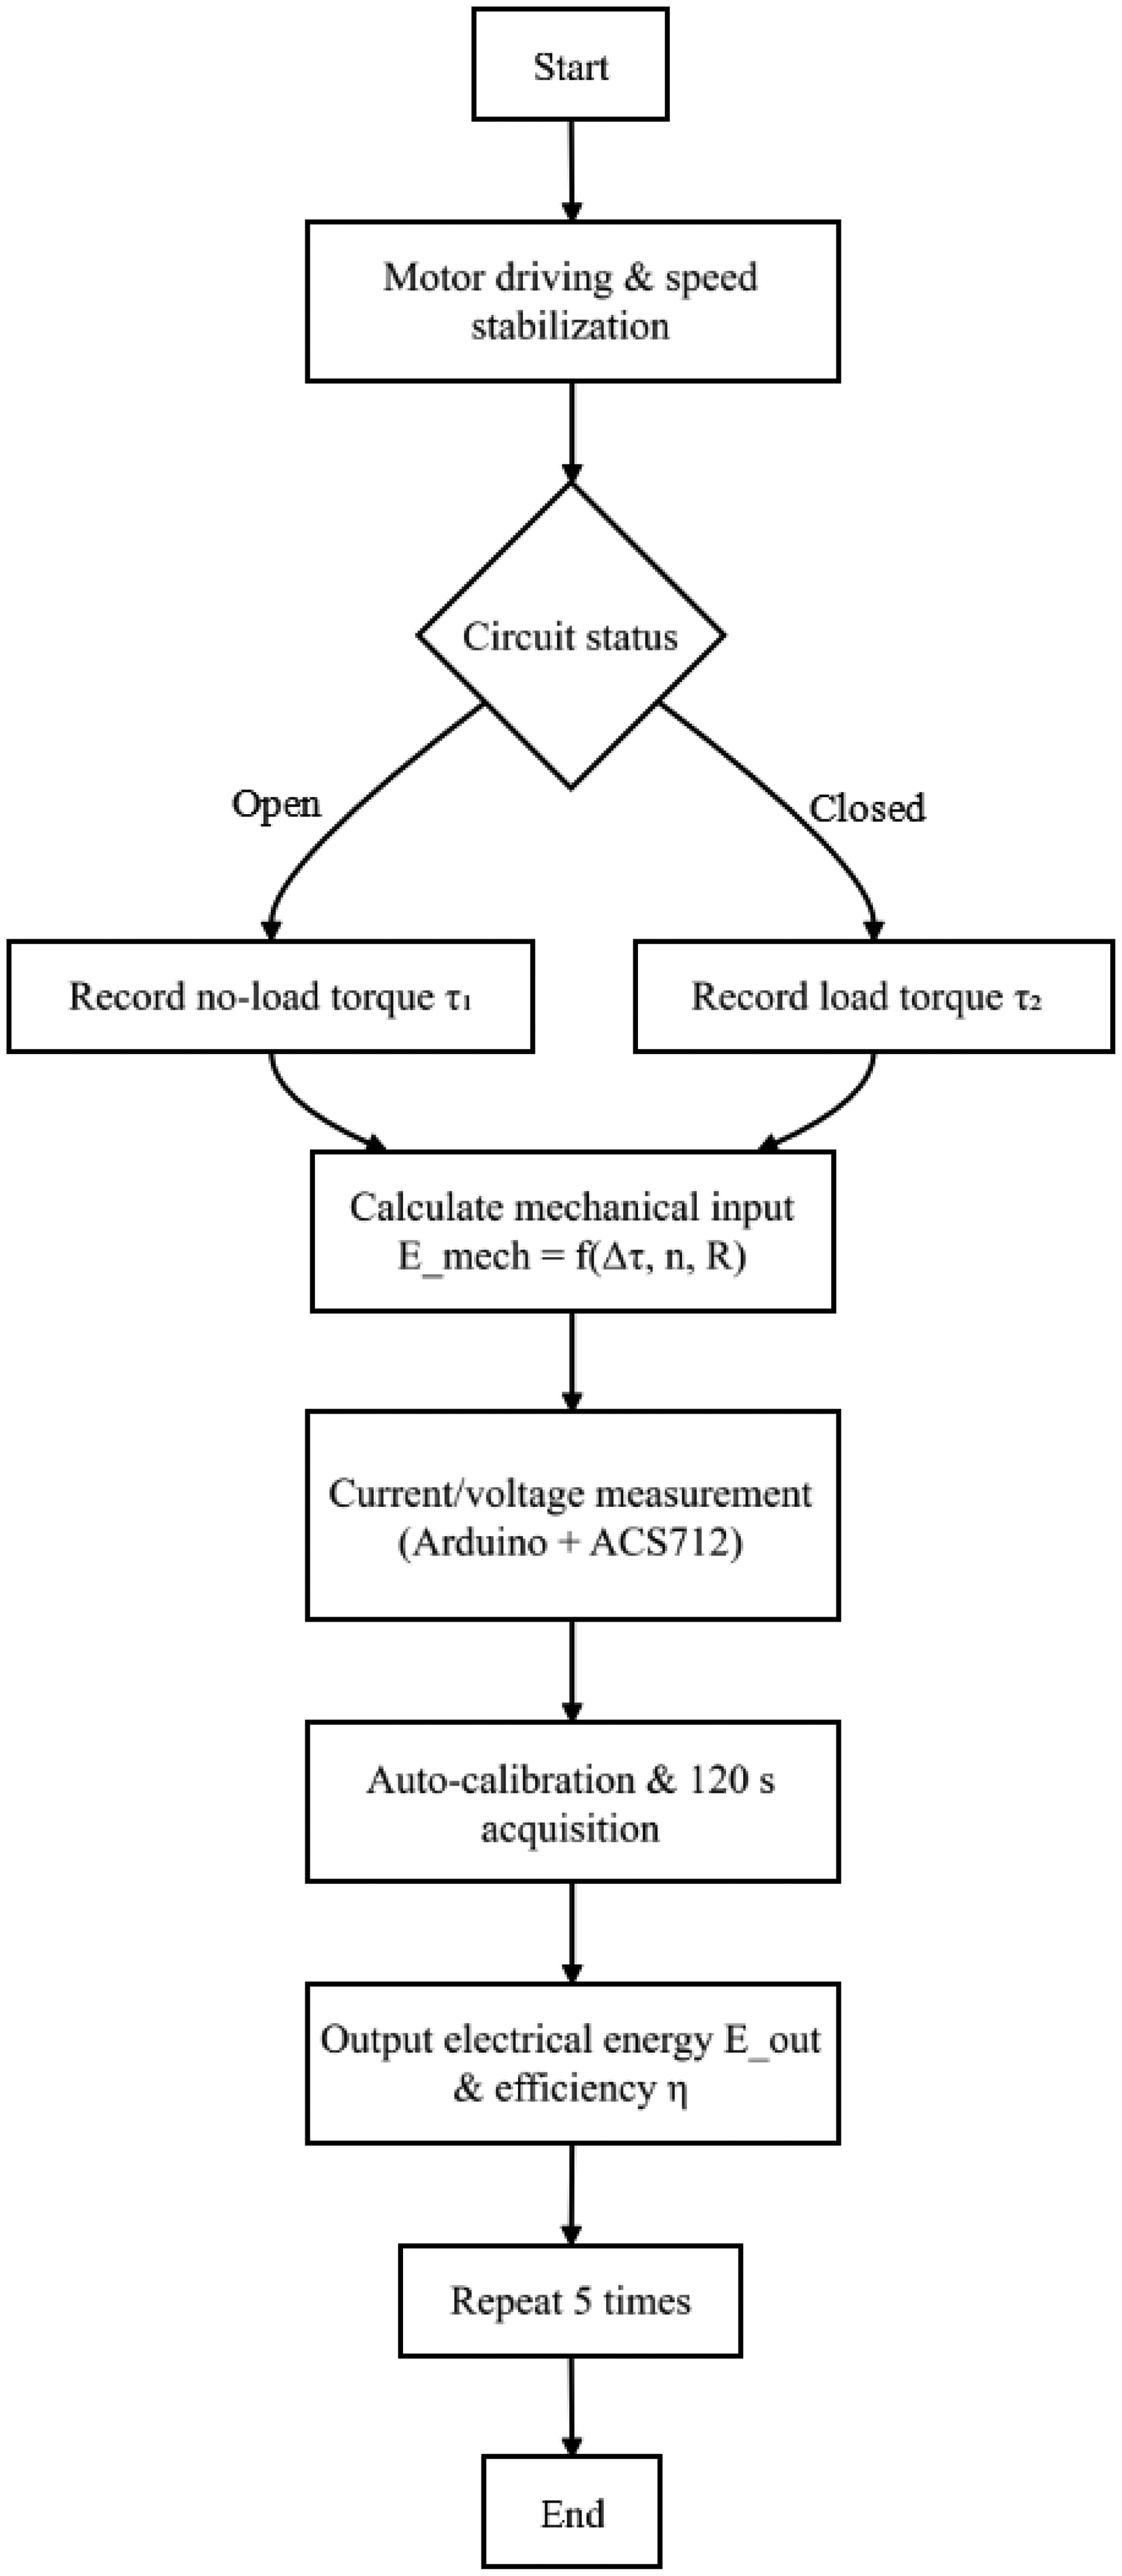
Flowchart for measuring energy conversion efficiency.
Speed control and torque measurement
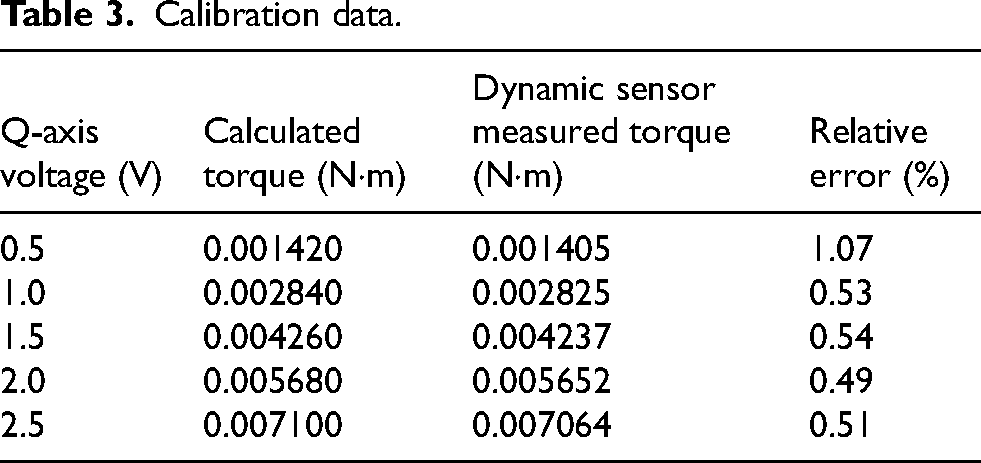
The motor is operated in FOC speed closed-loop mode by sending speed commands (e.g., ‘v200’ for 200 r/min) to the ESP32 via the serial port. When the speed stabilizes, first turn off the circuit switch, and the system automatically collects 10 s of data to average and records the idle torque τ1; then close the switch and record the load torque τ2 after the torque stabilizes again. The torque value is converted from the Q-axis voltage output by the FOC controller, with a conversion factor of 0.00284 N·m/V. The conversion coefficient was determined using a dynamic inertia calibration method: The motor was operated in open-loop torque mode with the Q-axis voltage fixed at V, driving the rotor system to rotate without load. The angular acceleration of the rotor was measured in real time using an AS5600 magnetic encoder with a sampling frequency of 10 kHz. After applying moving average filtering, the average angular acceleration α during the steady-state phase was calculated. The moment of inertia I of the rotor system was readily obtained, and the output torque τ was derived from the rigid body rotation law: τ = I·α, from which the conversion coefficient k = τ / V was determined. This procedure was repeated at Q-axis voltages of 0.5 V, 1.0 V, 1.5 V, 2.0 V, and 2.5 V. The average of the conversion coefficients calculated at the five voltage points was taken as the final calibrated value.
To verify the accuracy of the calibrated conversion coefficient, an additional high-precision dynamic torque sensor was introduced for parallel calibration alongside the dynamic inertia calibration method. The dynamic torque sensor was connected in series between the motor and the load, and the actual output torque values of the motor were measured under the same Q-axis voltage conditions. These measured values were compared with the torque values calculated using the conversion coefficient k = 0.00284 N·m/V. The results show that the relative errors between the two sets of data are all less than 1.1%, confirming the good linearity and accuracy of the conversion coefficient within the common operating range, as shown in Table 3.
Based on the accuracy of the dynamic torque sensor (±0.1% F.S.) and the relative error data from five repeated measurements, evaluated according to the JJF 1059.1-2012 method, taking the 1.5 V point as an example, the relative standard uncertainty of the torque measurement was found to be u = 1.36%. The main uncertainty component is introduced by the sensor's measurement range.
Let 

Thus, the mechanical power consumed by the motor to overcome the electromagnetic drag torque is: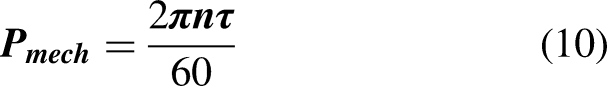
Then, the mechanical energy input to the generator system is: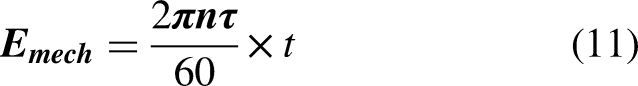
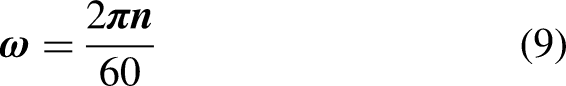
Here, n represents the rotational speed (r/min), and t is the measurement time (120 s).
Electrical energy acquisition and efficiency calculation
The power measurement system consists of an Arduino Uno development board and an ACS712 current sensor. The ACS712 current sensor has a measurement range of ±5 A, a sensitivity of 185 mV/A, and a quiescent output voltage of 2.5 V. This sensor operates based on the Hall effect and is susceptible to external magnetic field interference. In this experiment, the sensor was placed at a distance of more than 10 cm from the rotor magnets to reduce this influence. The Arduino Uno development board features a 10-bit ADC with a default reference voltage of 5 V, resulting in a quantization step (LSB) of 5 V / 1024 ≈ 4.9 mV. The quantization error of the Arduino ADC is ±2.45 mV. Before measurement, the system automatically performs zero-point calibration and collects 15–20 s of background noise. After closing the switch, once the average of two consecutive voltage readings exceeds the previously recorded baseline by 0.2 V, the system enters a 10-s preheating phase, followed by a 120-s formal measurement at a sampling interval of 1 ms. Output electrical energy is calculated by the following formula:
Where, 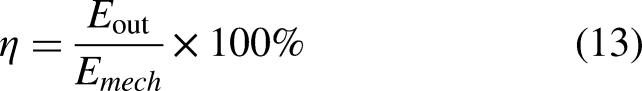
Here,
Parameter design
Design the experimental parameters based on the theoretical model established earlier. The law of magnetic field attenuation described in Formula (1) indicates that the magnetic induction intensity B0 on the surface of the magnet is the key to determining the effective magnetic flux ; It is known from Formula (3) that the average magnetic induction intensity
Partial parameters: (a) coil specification. (b) rotor disk diameter. (c) number of stator coils. (d) number of magnets. (e) magnet arrangement. (f) air gap size.
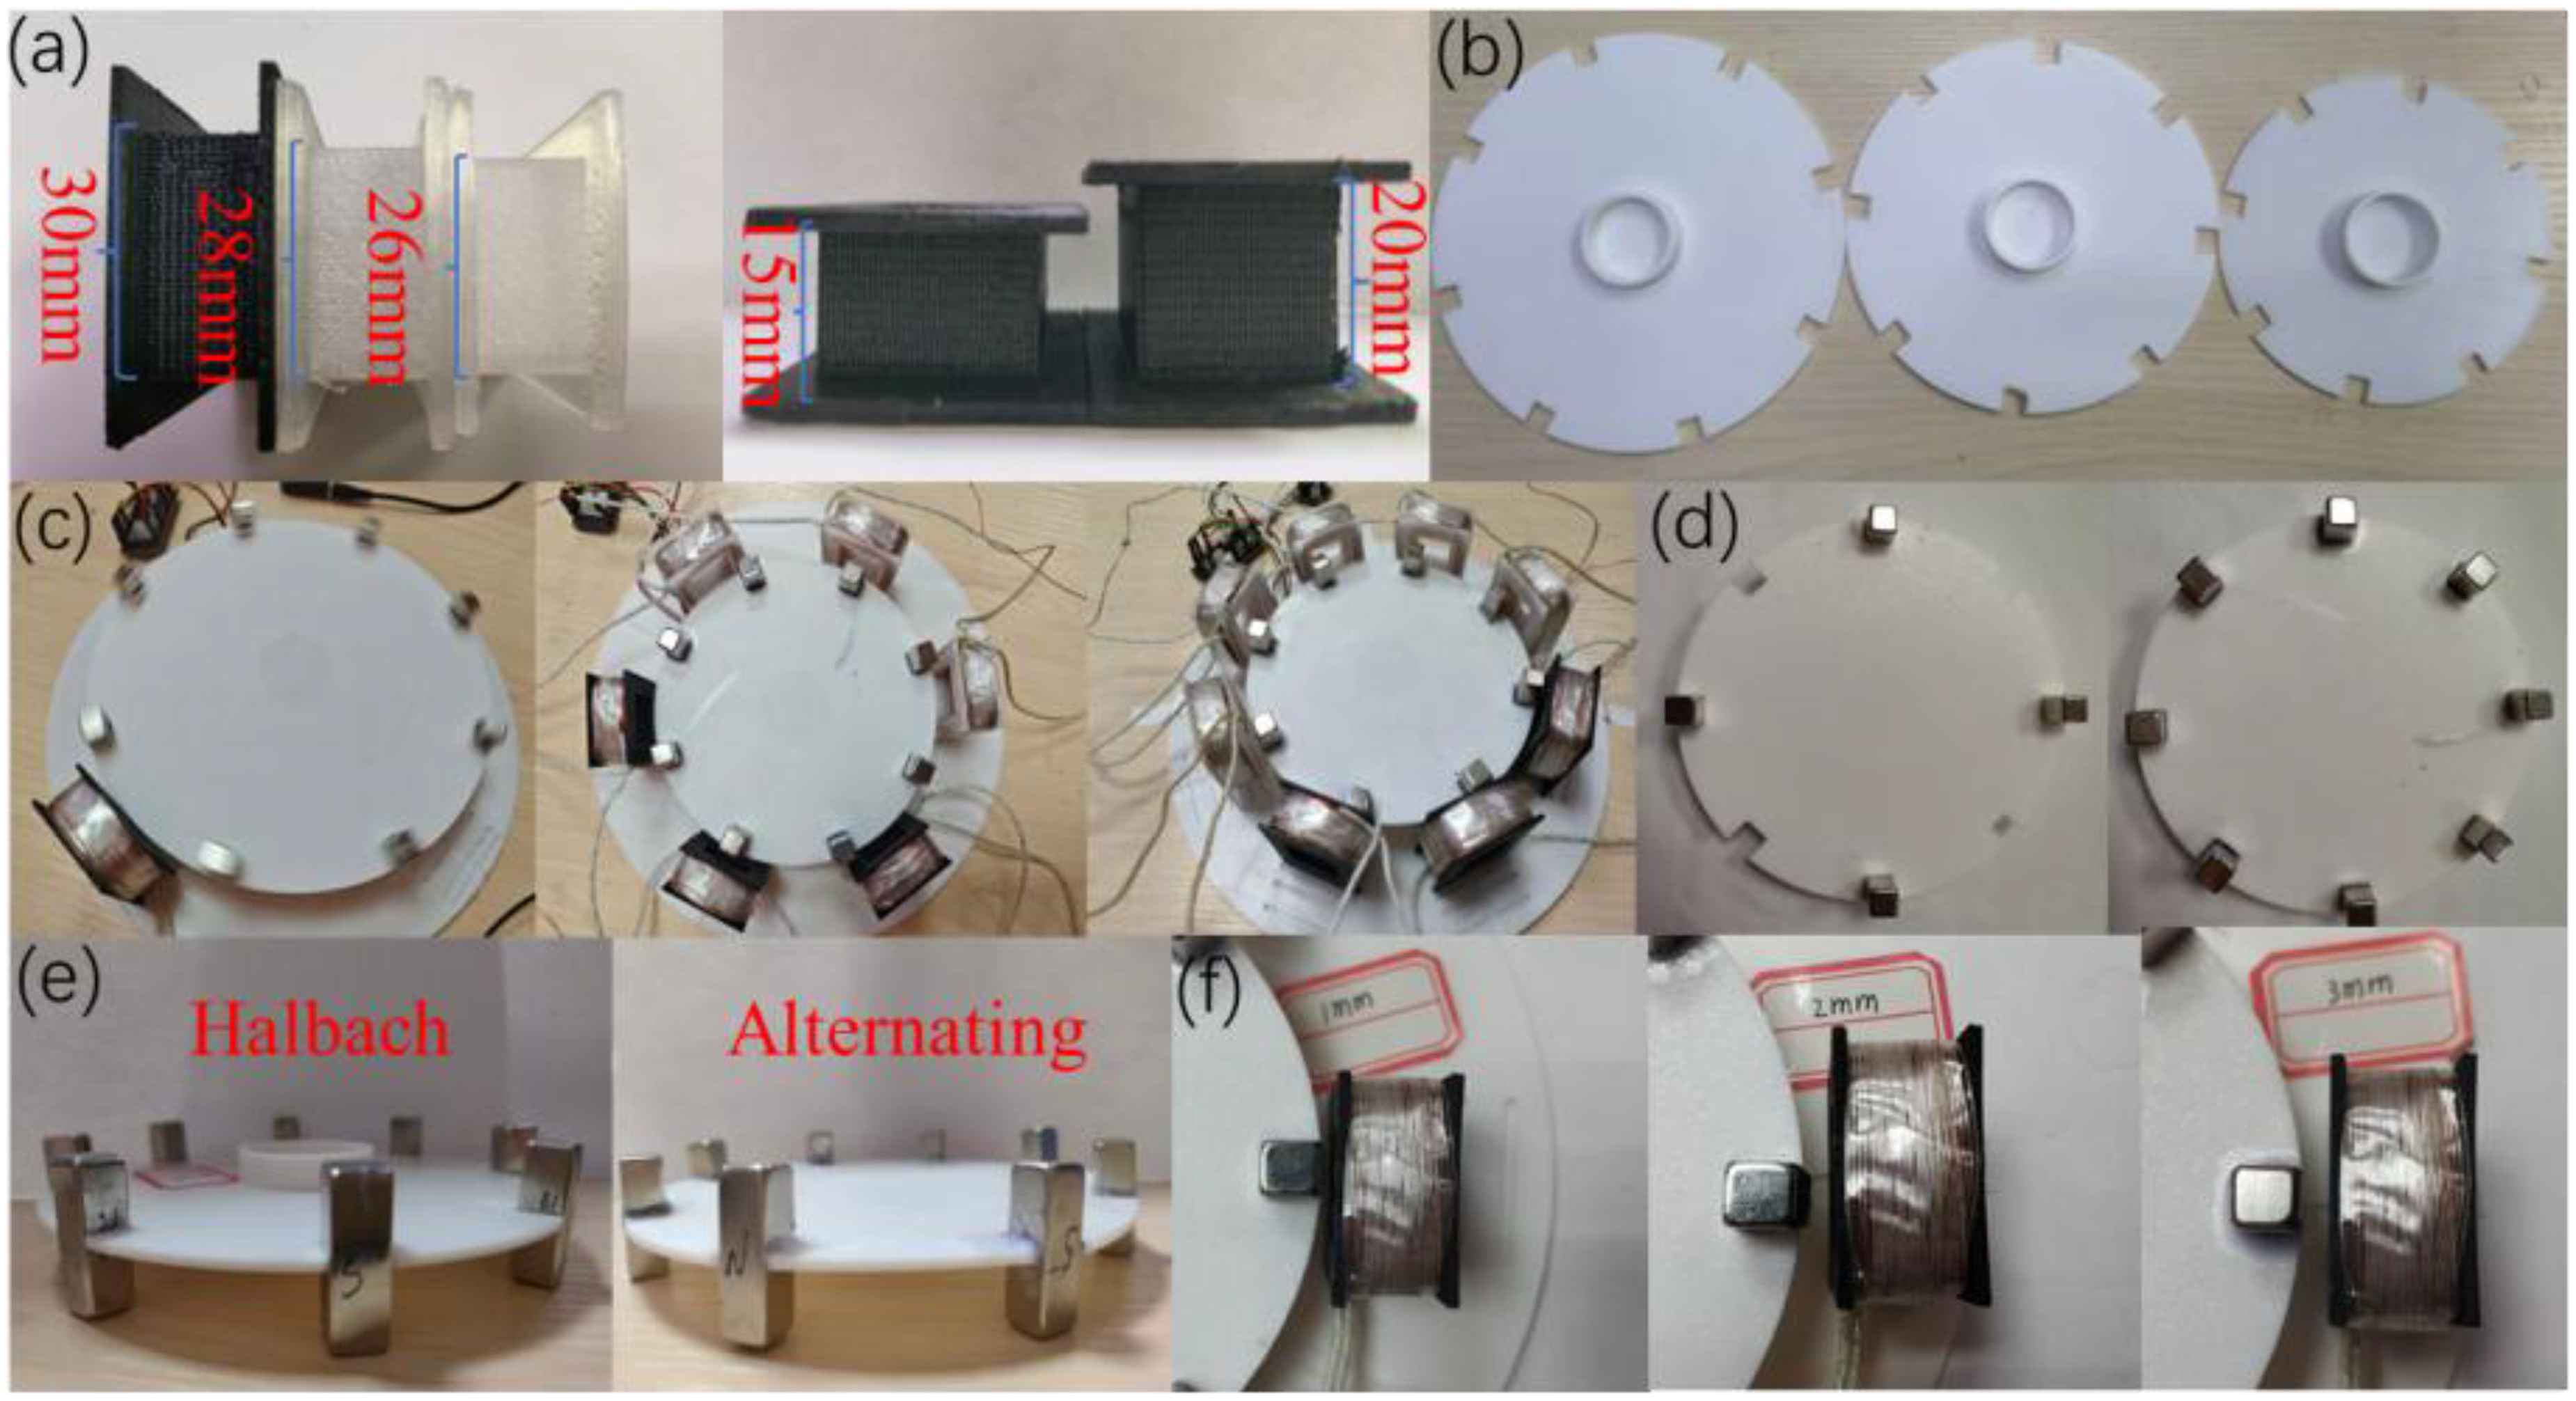
Ten experimental parameters of the micro-generator system.
Adjust the parameters and repeat the experiment
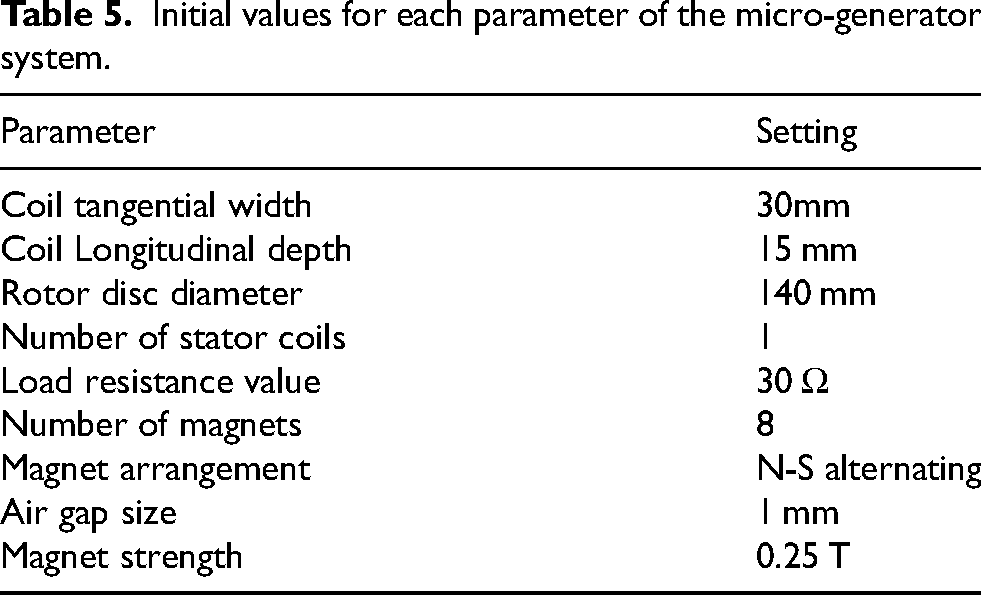
Based on the initial parameters shown in Table 5, change one influencing factor each time, measure each group of parameters five times, record the efficiency values under each condition, and take the average as the final result.
Initial values for each parameter of the micro-generator system.
Experimental results and discussion
The impact of each parameter on efficiency
Experimental data show that in the range of 100–460 r/min, the energy conversion efficiency initially increases, then decreases with increasing speed, peaking at a specific rotational speed. According to Formula (5), the rotor speed directly affects the linear velocity v in Formula (4), which in turn determines the magnitude of the induced electromotive force. Theoretically, the higher the rotational speed, the greater the induced electromotive force. However, excessively high rotational speeds will intensify losses such as eddy currents and hysteresis losses, thereby reducing the intrinsic efficiency of electromagnetic conversion. Therefore, there exists an optimal rotational speed range.
Figure 7(a)-(b) show that at the same rotational speed, the energy conversion efficiency is the highest at a coil tangential width of 26 mm, superior to 28 mm and 30 mm, and higher at a coil longitudinal depth of 15 mm than 20 mm.
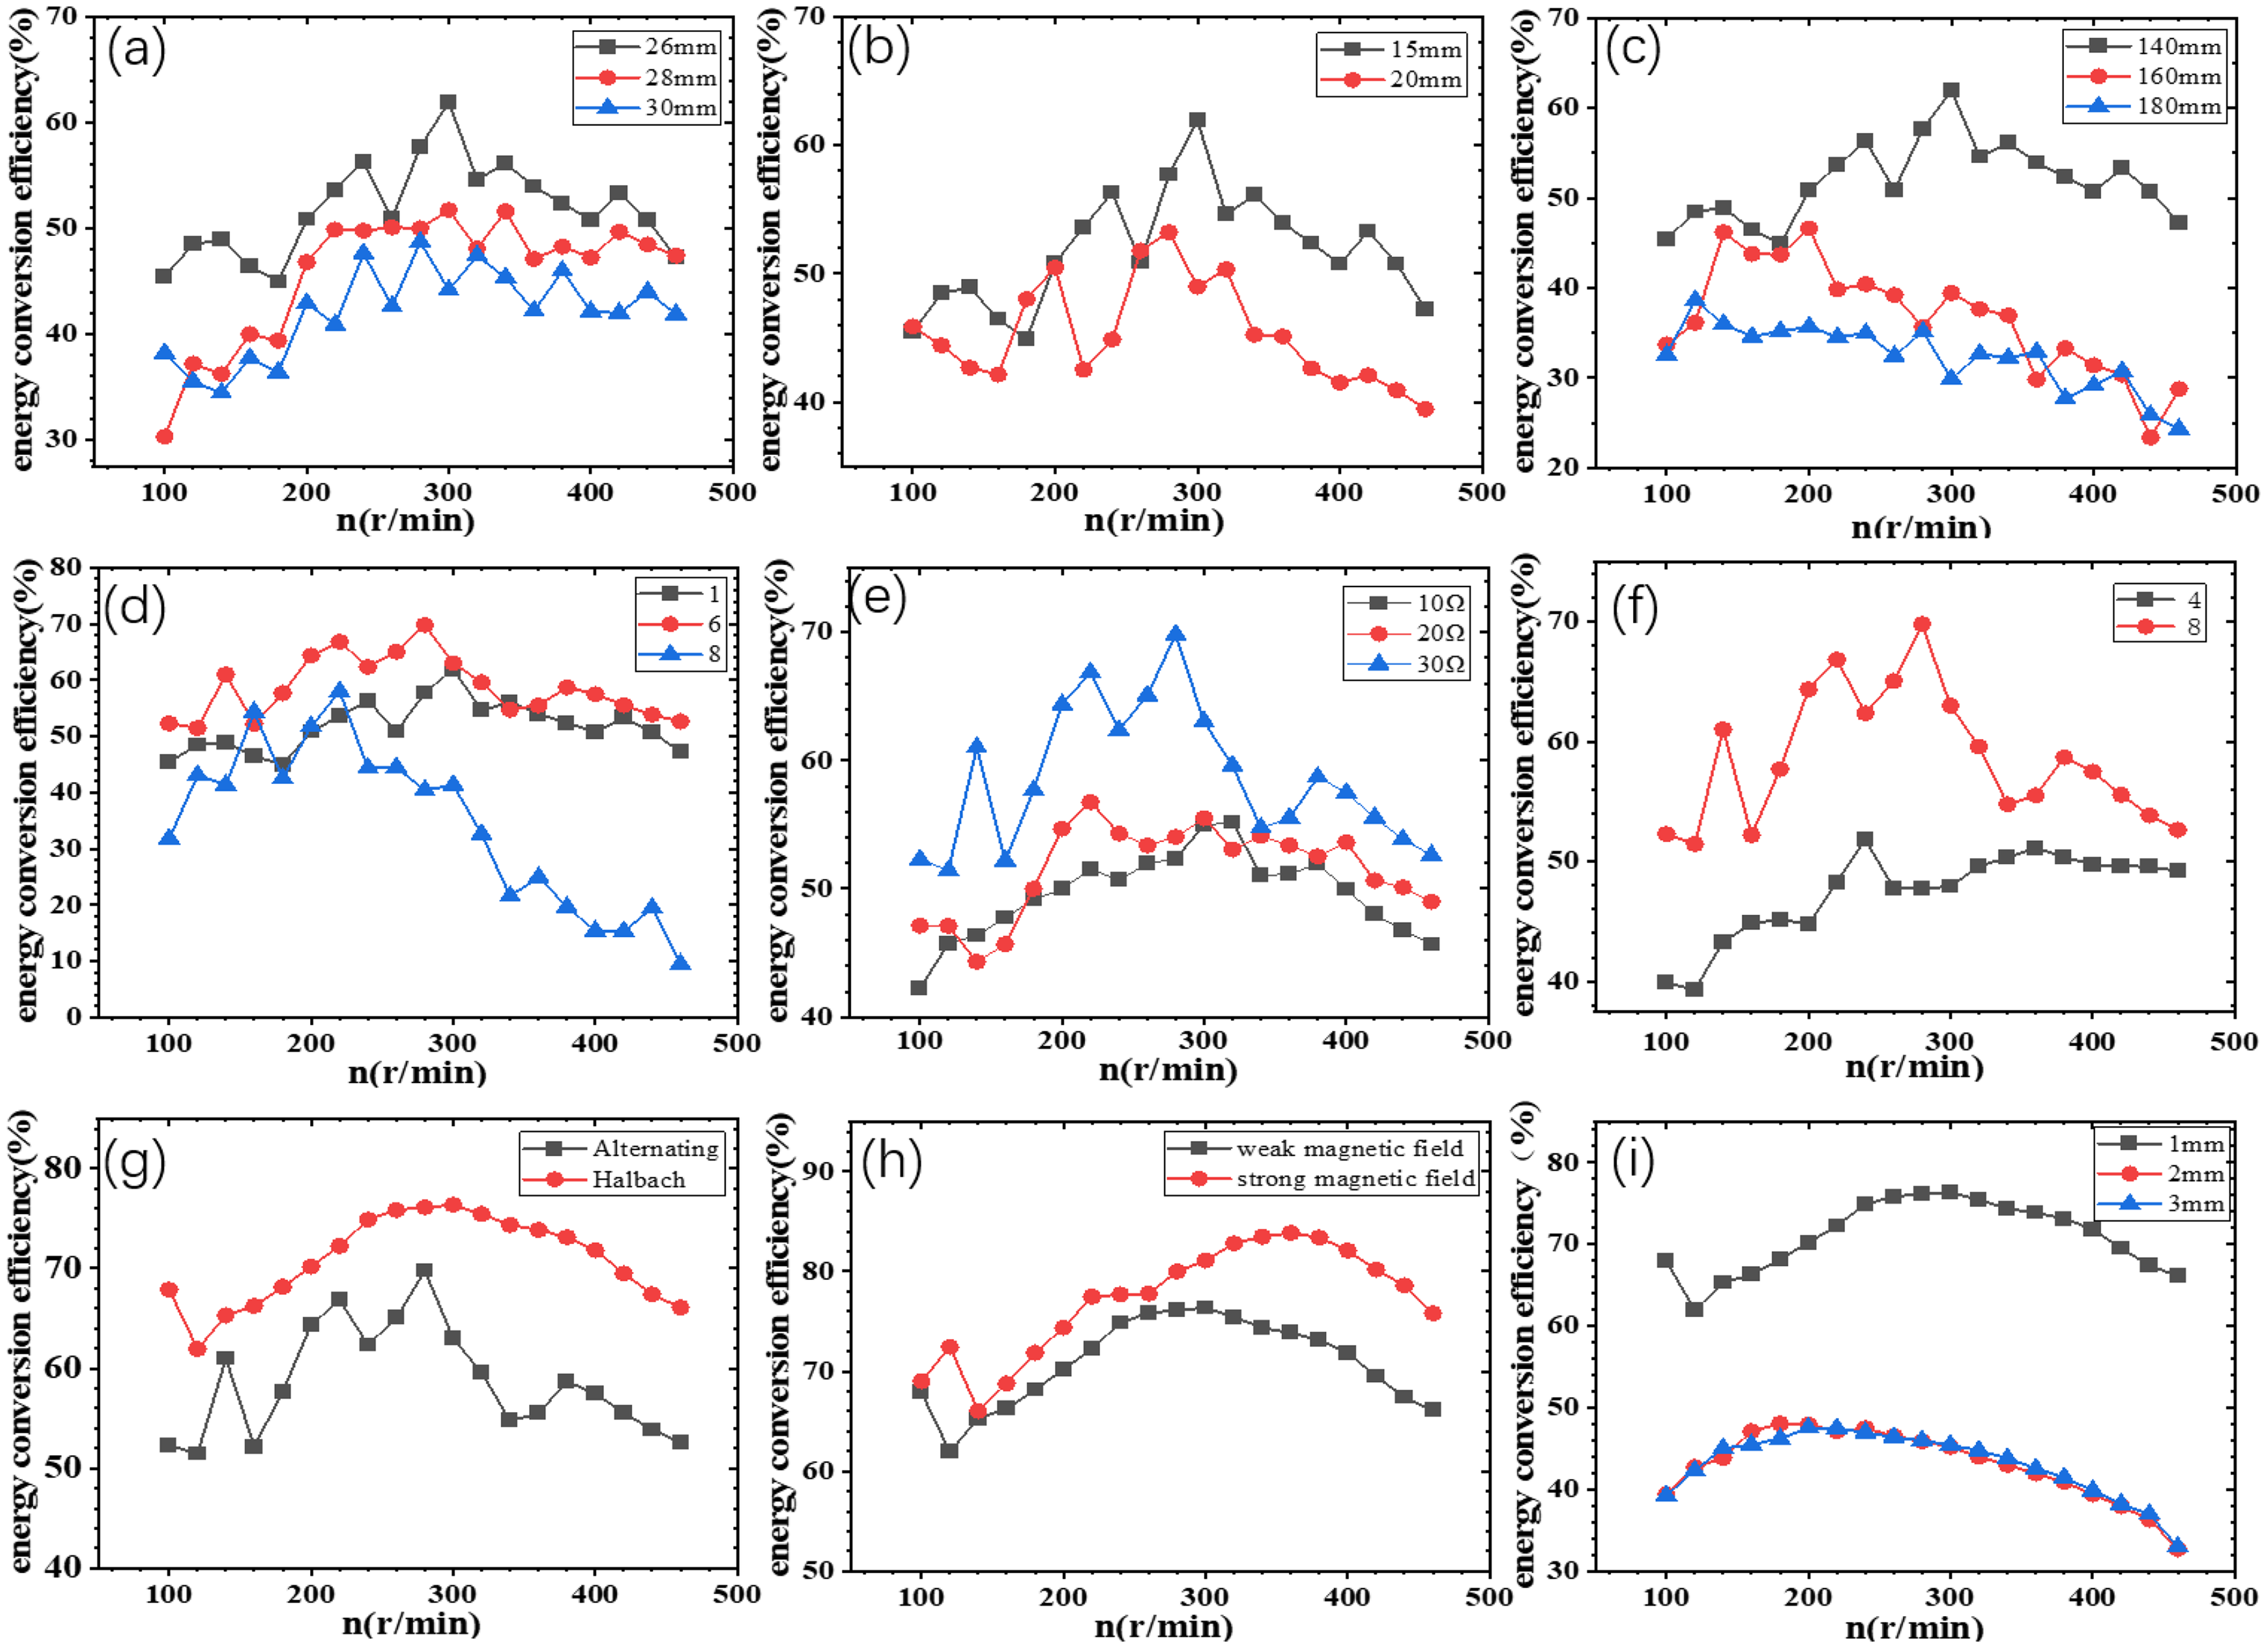
Influence of each parameter on efficiency: (a) tangential width of coil. (b) longitudinal depth of coil. (c) disk diameter. (d) number of coils. (e) load resistance. (f) number of magnets. (g) magnet arrangement. (h) magnet strength. (i) air gap size.
The tangential width affects the effective length of conductor that cuts the magnetic field lines. According to Faraday's law of electromagnetic induction, the induced electromotive force is proportional to the effective length of the magnetic field lines cut by the conductor. The greater the tangential width, the greater the effective cutting length L1 of the single-turn coil, and theoretically, the induced electromotive force should be increased. However, the actual magnetic field distribution is not uniform. An excessive width may place the ends of the coil in a weaker magnetic field area, resulting in a decrease in the overall average magnetic flux density, weakening the actual contribution of Bavg in Formula (6), and instead reducing efficiency.
Longitudinal depth affects the spatial distribution of the coil in the magnetic field. According to Formula (1) in the theoretical modeling, the magnetic field strength of a permanent magnet decays inversely with distance (
Figure 7(c) shows that the highest energy conversion efficiency is achieved when the rotor disk diameter is 140 mm, and the efficiency decreases successively when it is 160 mm and 180 mm. According to Formula (5), an increase in diameter can boost the tangential velocity v and enhance the induced electromotive force. But too large a diameter will significantly increase the moment of inertia, increasing the portion of mechanical energy input in Formula (7) used to overcome losses, thereby reducing the net efficiency.
Figure 7(d) shows that the energy conversion efficiency is the highest with six coils. Increasing the number of coils may enhance the output, but a tight arrangement may cause the magnetic fields of adjacent coils to interfere with each other, disrupt the uniformity of the magnetic field distribution, and reduce the rate of change of the effective magnetic flux.
The load resistance affects efficiency by influencing the proportion of copper loss. As discussed by Reich et al.
15
from the perspective of electromagnetic energy balance, they established a theoretical framework for the conversion of mechanical power into Joule heat and electrical power supplied to an external load. In this experiment, the energy loss in the micro-generator system mainly originates from the heating of the copper coils. The copper coil system is represented by an equivalent resistance
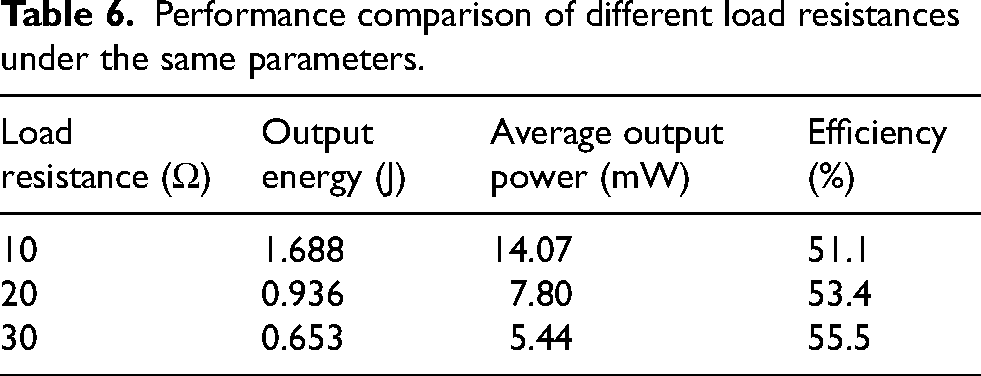
Table 6 presents the values of average output power and efficiency for different load resistances at 360 r/min, corresponding to Figure 7(e). It can be seen that as the load resistance increases from 10 Ω to 30 Ω, the efficiency rises from 51.1% to 55.5%, while the average output power decreases from 14.07 mW to 5.44 mW. In this study, because the primary focus is on maximizing the energy conversion efficiency, a load resistance of 30 Ω was adopted for all subsequent experiments. If the goal is to power low-power electronic devices, a trade-off between output power and efficiency should be considered to select an appropriate load resistance.
Performance comparison of different load resistances under the same parameters.
According to Formula (6), the number of magnets affects the output voltage through the correction factor k. An increase in the number of magnets can raise the alternating frequency of the magnetic field and reduce the leakage magnetic field, allowing the coil to make more fully utilize the magnetic field energy and increase the output electrical energy, thereby improving efficiency.
The Halbach array concentrates the magnetic field energy on the coil cutting side by rotating the magnetization direction in a directional manner. Compared with the NS alternating arrangement, the magnetic field strength on the outside is enhanced. A stronger effective magnetic field generates a higher induced electromotive force when the coil cuts the magnetic field lines. From the perspective of conservation of energy, the input mechanical energy is mainly used to overcome the electromagnetic resistance moment and mechanical loss. Amri et al. 16 confirmed in their study of the rim drive motor that the use of Halbach arrays can reduce torque ripple from more than 20% of the traditional structure to less than 1%. Under the same electrical output, the Halbach array requires less mechanical input owing to its stronger magnetic field; conversely, for the same mechanical input, it delivers higher electrical output. Figure 7(g) shows that under optimal conditions, the energy conversion efficiency of the Halbach array is about 15%-20% higher than that of the alternating arrangement, which is consistent with the conclusions of Huang et al. 17 that the thrust constant increases by 1.37 times and the back electromotive force increases by 1.5 times in the iron-free linear motor. It is also consistent with the research of Wang et al.,18 which fully validates its significant advantages in optimizing the magnetic field and improving energy efficiency in micro-generators.
In this experiment, the strong magnet (0.45 T) produced a significantly stronger magnetic field than the weak magnet (0.25 T). From Formula (4),
The size of the air gap directly affects the magnetic resistance. Ugwuogo et al. 19 and Susilo et al. 20 found in experiments with adjustable air gap generators and permanent magnet generators that for every 1 mm increase in the air gap, the output voltage, power, and frequency decreased. Therefore, experiments were conducted with two gradients of 1 mm and 2 mm set while ensuring a safe distance. Figure 7(i) shows that small air gap is better than large air gap.
Efficiency curves under optimal parameter combinations
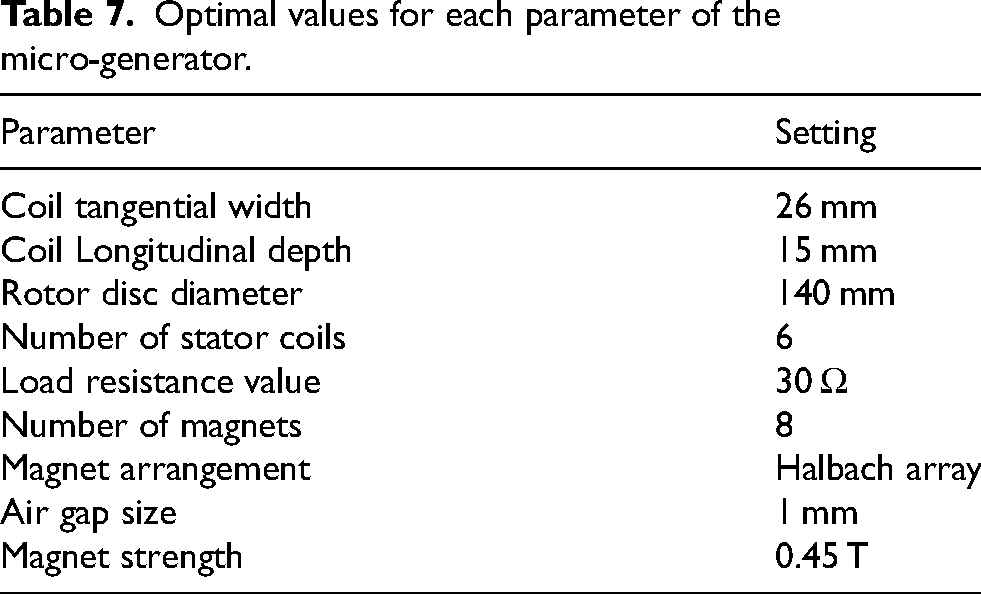
Based on the above experimental results, we obtained the optimal conditions for each variable, as shown in Table 7. The system was assembled according to the optimal conditions for each parameter. The physical diagram of the experimental setup is shown in Figure 1, and the relationship between the measured energy conversion efficiency and the rotational speed is shown in Figure 8.
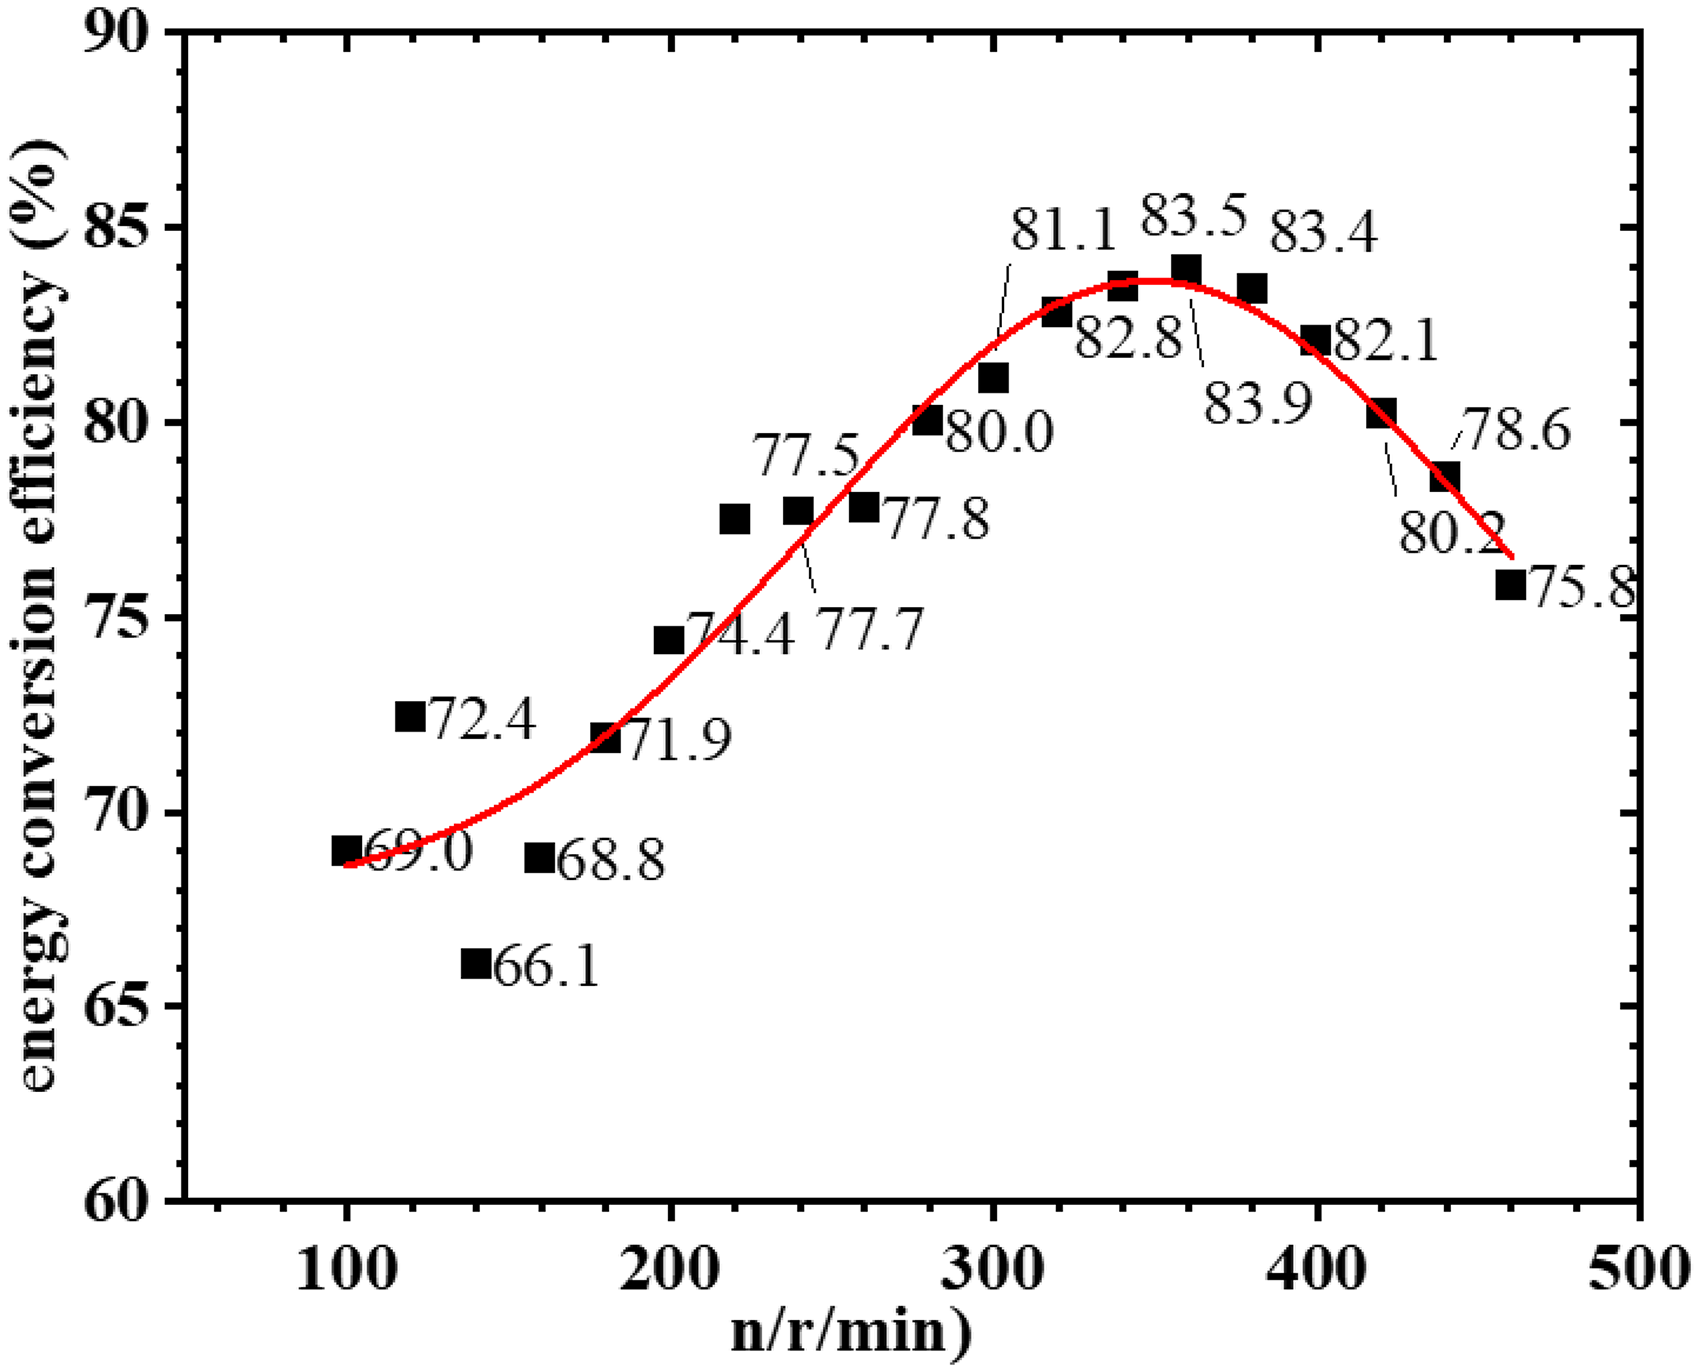
Relationship of energy conversion efficiency with speed under optimal conditions.
Optimal values for each parameter of the micro-generator.
As shown in Figure 8, the energy conversion efficiency reaches its peak at 83.9% at a rotational speed of 360 r/min.
It should be noted that the experimental design in this study adopts a one-factor-at-a-time approach, which cannot capture the interactions between parameters. Therefore, the obtained “optimum” is local and conditional, valid only for the parameter levels set in this experiment.
Accuracy and uncertainty
Experimental accuracy
As shown in Table 8, for the five sets of data recorded under optimal conditions, the standard deviation is calculated as
Error analysis.
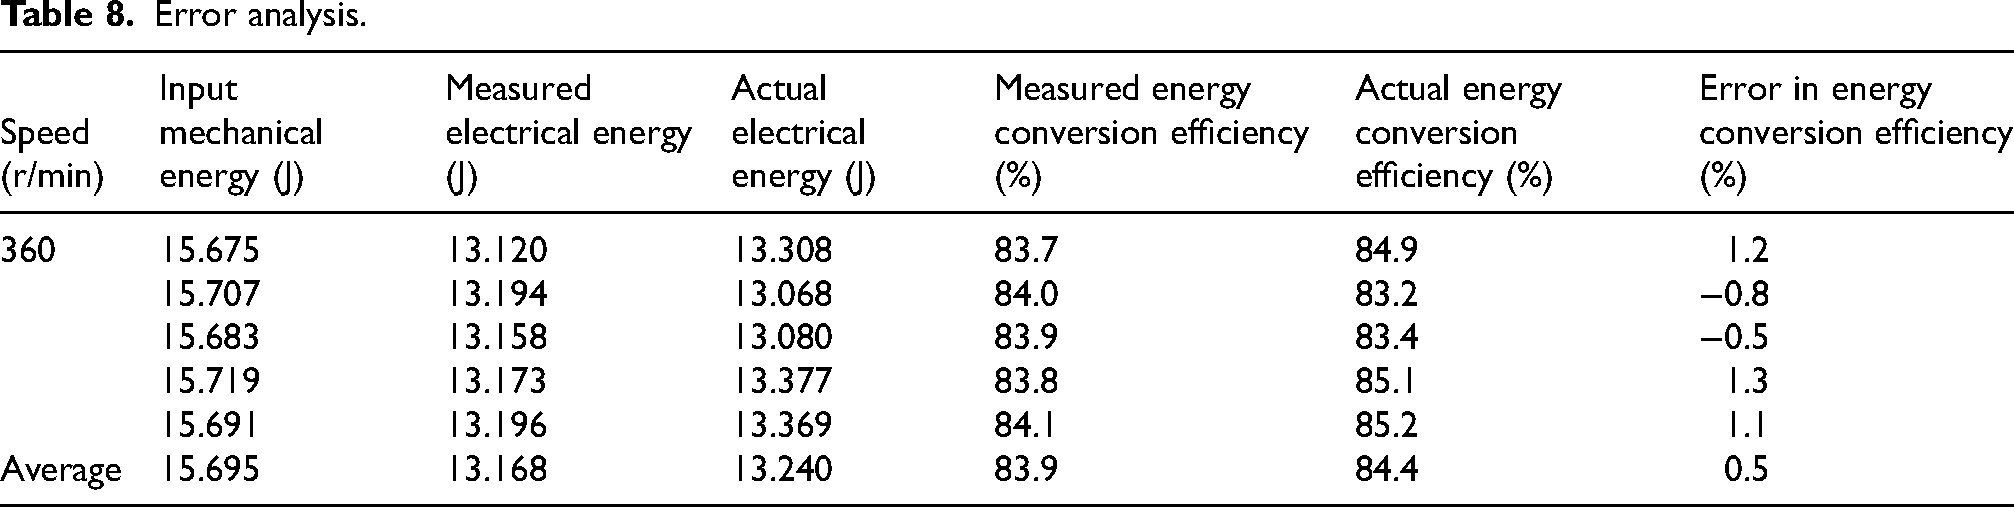
In summary, the optimal parameters reported in this paper and the main effects of each factor all reach a distinguishable level of significance, and the conclusions are statistically reliable.
Uncertainty analysis
According to the national metrology technical specifications, the uncertainty of the measurement results under optimal conditions of this setup is evaluated. The uncertainty of the measurement results consists of a Type A evaluation (statistical method) and a Type B evaluation (non-statistical method).
The Type A standard uncertainty is evaluated by statistical analysis of the measured values. Because the number of measurements is limited, the t-distribution is used for estimation. For a confidence probability of P = 0.683, the coverage factor is t = 1.14.
The Type A standard uncertainty of the input mechanical energy is
The Type A standard uncertainty of the output electrical energy is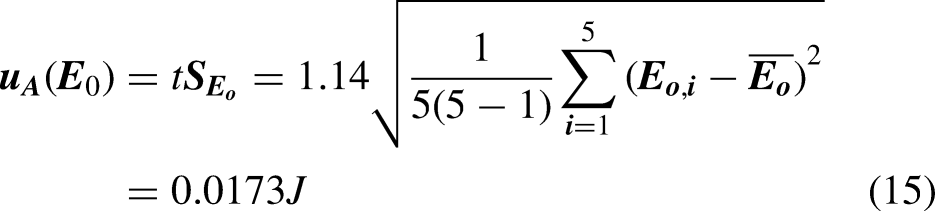
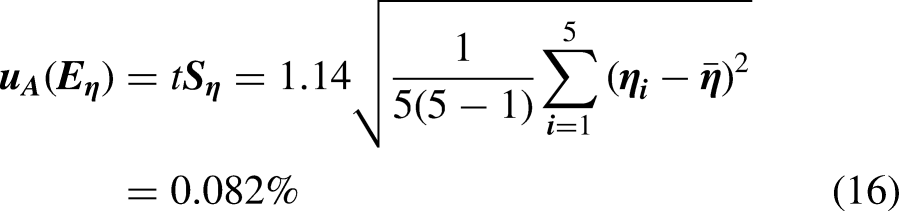
The Type A standard uncertainty of the energy conversion efficiency is
The Type B standard uncertainty is evaluated from instrument error information. The main instrument errors are as follows:
FOC closed-loop speed control: n = 360 r/min, speed fluctuation ±1 r/min. Torque obtained from Q-axis voltage via calibration coefficient. According to the dynamic torque sensor calibration results in Section 4.1, the standard uncertainty of torque measurement is Arduino ADC voltage measurement: U = 1.841 V, quantization error ±2.45 mV. ACS712 current sensor: linearity error ±1.5%.
The Type B uncertainty is
Relative Type B uncertainty of input mechanical energy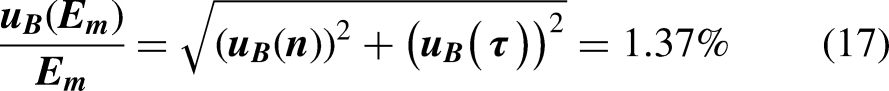

Relative Type B uncertainty of output electrical energy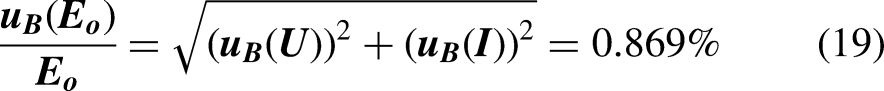

Combined standard uncertainty of input mechanical energy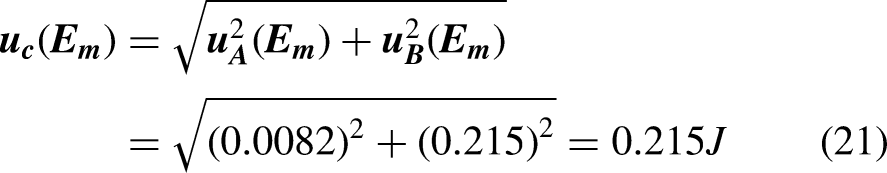
Combined standard uncertainty of output electrical energy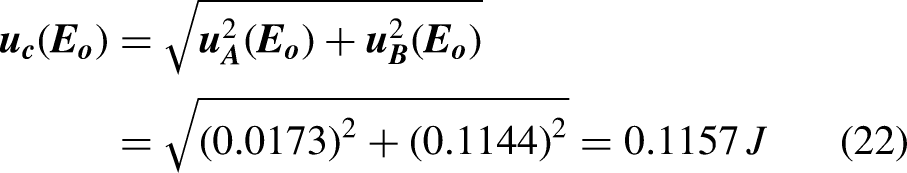
Combined standard uncertainty of efficiency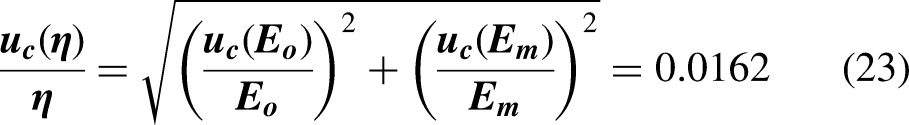

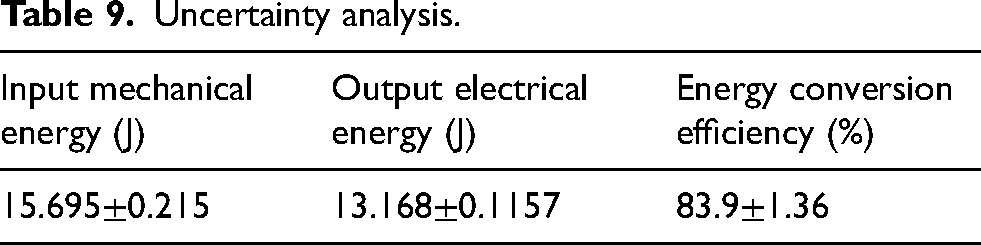
Therefore, the uncertainty analysis under optimal conditions is summarized in Table 9.
Uncertainty analysis.
Conclusions and prospects
We successfully constructed a micro-generator system integrating drive, conversion and measurement. It systematically explored the influence of ten key factors such as rotational speed on the energy conversion efficiency of electromagnetic induction, verified the advantages of the Halbach array in improving the utilization rate of the magnetic field and the energy conversion efficiency, and identified the optimal parameter combination through systematic investigation of ten influencing factors. A high energy conversion efficiency of 83.9% was achieved. The study also revealed a non-monotonic efficiency-speed relationship, with efficiency first increasing and then decreasing with speed. It further confirmed the beneficial effects of high load resistance, a strong magnetic field, and properly selected coil specifications on efficiency improvement, providing solid experimental evidence and actionable improvement directions for optimizing generator devices based on electromagnetic induction.
Supplemental Material
sj-pdf-1-aem-10.1177_13835416261463073 - Supplemental material for Experimental study on energy conversion efficiency of micro-generators based on Halbach array
Supplemental material, sj-pdf-1-aem-10.1177_13835416261463073 for Experimental study on energy conversion efficiency of micro-generators based on Halbach array by Yifei Chu, Xiaokang Wang, Mingfei Wu and Guilin Song in International Journal of Applied Electromagnetics and Mechanics
Footnotes
Ethical considerations
Not applicable. This study did not involve human participants, human data, or animal subjects. All experiments were conducted on electromagnetic equipment only.
Consent to participate
Not applicable. No human participants were involved in this study.
Consent for publication
Not applicable. This manuscript does not contain any individual person's data in any form (including individual details, images, or videos).
Funding
This work was supported by the Key Scientific Research Projects of Colleges and Universities in Henan Province, China (Project Nos. 25A140007 and 26A140008), the Natural Science Foundation of Henan Province, China (Project No. 252300420046), and the Henan Normal University College Students' Innovation and Entrepreneurship Training Program Project (XJ202503).
Declaration of conflicting interests
The authors declared no potential conflicts of interest with respect to the research, authorship, and/or publication of this article.
Data availability
The data that support the findings of this study are available from the corresponding author upon reasonable request.
Supplemental material
Supplemental material for this article is available online.
References
Supplementary Material
Please find the following supplemental material available below.
For Open Access articles published under a Creative Commons License, all supplemental material carries the same license as the article it is associated with.
For non-Open Access articles published, all supplemental material carries a non-exclusive license, and permission requests for re-use of supplemental material or any part of supplemental material shall be sent directly to the copyright owner as specified in the copyright notice associated with the article.