
Abstract
Introduction
Stroke is the leading cause of morbidity and mortality, and its management differs among ischemic stroke, hemorrhagic stroke, and stroke mimics. Non-contrast CT has limited sensitivity for early ischemia. This study compared blood and plasma viscosity across different stroke types and identified cutoff values for predicting stroke type.
Method
A cross-sectional study at the Emergency Department of Dr. Cipto Mangunkusumo National Referral Hospital (March–June 2025). Blood and plasma viscosity were measured using the Neo Digital Microcapillary device then compared using appropriate statistic tests. A p-value < 0.05 was considered statistically significant.
Results
Seventy of 97 suspect stroke patients were included (36 ischemic, 16 hemorrhagic, 18 mimics). There were significant differences of blood viscocity between ischemic and hemorrhagic stroke compared with stroke mimic (median 5.65 cP ischemic; 5.29 cP hemorrhagic; 4.84 cP mimic; p < 0.0001), whereas no significant difference was observed in plasma viscosity across the groups (p = 0.411). A blood viscosity cutoff of 5.17 cP yielded an AUC of 0.84 (p < 0.0001), 71.2% sensitivity, 94.4% specificity, 97.37% PPV, and 53.13% NPV for stroke prediction.
Conclusion
Blood viscosity shows potential as an adjunctive diagnostic tool for distinguishing stroke from stroke mimics with high specificity, aiding in predicting types of stroke.
Introduction
Stroke is a major cause of morbidity and mortality worldwide, including in Indonesia. In Indonesia, the prevalence of stroke is reported to be 2097.2 per 100,000 population, with ischemic stroke accounting for the majority of cases, with approximately 1417.8 per 100,000 individuals. In contrast, hemorrhagic stroke comprises approximately 15–20% of all stroke cases, including intracerebral (663.9 per 100,000 population) and subarachnoid hemorrhage (117.1 per 100,000 population). The burden of stroke in Indonesia is relatively high compared to several Asian countries, exceeding reported prevalence in Korea and Thailand, although still lower than in China and India.1,2 These conditions present a significant clinical challenge, particularly in the early differentiation of stroke subtypes and other conditions with similar presentations. Stroke mimics occur in 20–50% of suspected acute stroke cases.3,4
Early differentiation of stroke types is essential because treatment strategies differ substantially. Intravenous thrombolysis for ischemic stroke must be administered within 4.5 h after onset, while blood pressure targets differ between ischemic and hemorrhagic stroke. Non-contrast CT scan is the diagnostic gold standard; however, its sensitivity for detecting early ischemic lesions within the first hours after symptom onset is limited. 5 A multimodal CT study showed that 94.2% of patients had cerebral hypoperfusion without visible hypodensity on non-contrast CT within the thrombolysis window. 6 Blood viscosity may provide additional diagnostic value during this early phase.
Several clinical scoring systems, such as the Gadjah Mada algorithm and the Siriraj Stroke Score, have been developed to predict stroke pathology based on history and physical examination. The Gadjah Mada algorithm has a sensitivity of 61.2% and specificity of 77.4%, while the Siriraj Stroke Score demonstrates a sensitivity of 89.7% and specificity of 69.4% for differentiating ischemic and hemorrhagic stroke. 7 Despite their usefulness, the diagnostic accuracy of these scoring systems remains limited, highlighting the need for additional objective biomarkers.
Increased blood viscosity contributes to ischemic stroke pathogenesis by increasing vascular resistance, reducing cerebral perfusion, and promoting thrombosis. 8 Factors contributing to hyperviscosity in acute ischemic stroke include increased hematocrit, erythrocyte aggregation, elevated plasma viscosity, and reduced erythrocyte deformability. In contrast, hemorrhagic stroke is not directly related to increased blood viscosity; however, low blood viscosity may impair coagulation efficiency and increase bleeding risk.5,9 Stroke mimics do not involve vascular pathology and are unrelated to blood viscosity, arising instead from metabolic or neurological dysfunction.3,4
Previous studies have demonstrated differences in blood viscosity among ischemic stroke, hemorrhagic stroke, and stroke mimics, with ischemic stroke showing the highest viscosity values. Significant differences have been reported, particularly between ischemic stroke and stroke mimics.8,10 However, data on blood viscosity differences among these conditions in the Indonesian population are lacking. This study aims to compare mean blood viscosity among ischemic stroke, hemorrhagic stroke, and stroke mimics, and to determine viscosity cutoff values for predicting stroke type at Dr. Cipto Mangunkusumo National Referral Hospital.
Method
Study design
We conducted an analytic observational study using a cross-sectional design to evaluate whether whole blood and plasma viscosity differ across three diagnostic categories, including ischemic stroke, hemorrhagic stroke, and stroke mimic, among patients presenting with suspected stroke to Dr. Cipto Mangunkusumo National Referral Hospital. Participants were recruited consecutively until the predefined sample size was reached.
Setting and study period
The study was performed in the Emergency Department and the Clinical Pathology sub-unit of the Integrated Laboratory Services at Dr. Cipto Mangunkusumo National Referral Hospital, Jakarta, Indonesia. Enrollment and laboratory measurements took place from March 2025 through June 2025 and continued until the target number of participants had been achieved.
Participants and specimen source
The study subjects consisted of patients with ischemic stroke, hemorrhagic stroke, or stroke mimic who presented to the Emergency Department of Dr. Cipto Mangunkusumo National Referral Hospital during the study period and met the study eligibility criteria. The study samples consisted of residual EDTA-anticoagulated blood obtained from study subjects before the administration of intravenous fluids or medications.
Eligibility criteria
Eligible participants were aged 18 years or older, presented with symptoms consistent with suspected stroke, and received a clinical diagnosis of ischemic stroke, hemorrhagic stroke, or stroke mimic. We included only patients whose EDTA blood sample was collected before exposure to infusion fluids and before receiving hemorheologically active medications (pentoxifylline, aspirin, clopidogrel, or cilostazol).
We excluded patients with documented conditions that could materially alter blood viscosity independent of the study variables, including severe anemia (hemoglobin <8 g/dL), severe thrombophilia, dengue hemorrhagic fever, sepsis, malignancy or myeloproliferative disorders, massive bleeding, severe dehydration, or moderate-to-severe head trauma. Patients with transient ischemic attack, those who did not undergo head CT imaging, and those with inadequate or compromised residual specimens were also excluded. Specimen-related exclusions included residual EDTA volume <2 mL, clot formation, or plasma that was visibly hemolyzed, icteric, or lipemic.
Diagnostic classification
Suspected stroke was defined clinically as acute-onset neurologic dysfunction documented in the medical record, including asymmetric weakness, sensory disturbance, language impairment, altered mental status, dizziness, or visual symptoms. Final diagnostic categorization followed clinician assessment supported by head CT findings. Ischemic stroke was defined as a clinical stroke syndrome with CT findings consistent with ischemic infarction or a normal scan, in the absence of intracranial hemorrhage or brain tumor. Hemorrhagic stroke was defined as a clinical stroke syndrome with CT evidence of intracranial hemorrhage and without imaging evidence of ischemic infarction or brain tumor. Stroke mimic referred to non-cerebrovascular conditions presenting with stroke-like symptoms.
Sample size considerations
Sample size was determined using two complementary approaches. First, for between-group comparisons of viscosity, we used an unpaired mean-difference formula (α = 0.05, power = 80%) with a pooled standard deviation of 5.8 and an expected clinically meaningful mean difference of 6.4, yielding a minimum of 13 participants per group (39 total). Second, to derive diagnostic cut-off values, the minimum sample size was calculated assuming an expected sensitivity of 85%, a precision of 10%, ischemic stroke comprising approximately 87% of confirmed stroke cases, and stroke accounting for approximately 80% of suspected stroke presentations, yielding a minimum of 70 participants.
Viscosity measurement and quality assurance
All measurements were performed on residual EDTA-anticoagulated blood samples collected prior to administration of intravenous fluids or medications. Samples were processed immediately after collection under standardized laboratory conditions to minimize pre-analytical variability. Only samples meeting quality criteria (non-hemolyzed, non-lipemic, and without clot formation) were included for analysis.
Whole blood and plasma viscosity were measured using the Neo Digital Microcapillary device and reported in centipoise (cP). The device operates based on microcapillary flow dynamics, in which a small volume of sample is drawn through a standardized microcapillary tube. Viscosity is derived from the transit time required for the sample to traverse the microcapillary, detected by two blue-laser sensors positioned along the flow path. The time interval between sensor activation is used to derive viscosity, reflecting resistance to flow within the microcapillary system.
Because blood flow within a microcapillary exhibits a range of shear conditions due to its laminar flow profile, the device does not measure viscosity at a single predefined shear rate. Instead, the resulting value represents an integrated viscosity derived from dynamic flow conditions across the microcapillary.
Before patient testing, we verified analytical precision. Within-run precision was assessed by performing 10 consecutive measurements on two materials (2% eosin solution and EDTA whole blood) and calculating the coefficient of variation (CV), with a target CV <5% for both. Between-day precision was evaluated over five consecutive days by repeating five measurements per day using 2% eosin.
For whole blood viscosity, 600 μL of residual EDTA blood was transferred into a sample container and brought into contact with the microcapillary inlet. The device automatically recorded the transit time and displayed the corresponding viscosity value. For plasma viscosity, EDTA blood samples were centrifuged at 2000 g for 15 min to obtain plasma. A mixture of 500 μL plasma and 100 μL eosin was prepared and analyzed using the same microcapillary procedure as described for whole blood. Reference intervals used by the laboratory were 4.85–5.06 cP for males and 4.37–4.99 cP for females for whole blood viscosity, and 1.90–2.11 cP for males and 1.87–2.03 cP for females for plasma viscosity.
Data collection and management
Demographic and clinical variables, diagnostic category, CT findings, exposure to infusion fluids or hemorheologically active medications, and exclusion diagnoses were abstracted from medical records. Data were entered and cleaned in Microsoft Excel before analysis in Stata version 14.
Statistical analysis
We assessed distributional assumptions using Kolmogorov–Smirnov and Shapiro–Wilk tests. Continuous variables with a normal distribution were summarized as mean ± standard deviation, whereas non-normally distributed data were summarized as median with interquartile range, and the minimum and maximum values were also reported to describe the age distribution. Because viscosity measures did not meet parametric assumptions across groups, we compared whole blood and plasma viscosity among ischemic stroke, hemorrhagic stroke, and stroke mimic using the Kruskal–Wallis test; when the overall test was significant, pairwise comparisons were performed using the Mann–Whitney test.
To evaluate diagnostic performance and identify candidate thresholds, we constructed receiver operating characteristic (ROC) curves for viscosity measures in comparisons where clinically relevant group differences were observed. From the selected cut-off points, we calculated sensitivity, specificity, positive predictive value (PPV), and negative predictive value (NPV). To explore covariates and potential confounding, we conducted bivariate analyses using independent t-tests or Mann–Whitney tests for continuous variables and Chi-square or Fisher's exact tests for categorical variables. Crude prevalence ratios (PRs) were estimated, and variables with p < 0.20 were entered into multivariable modeling. Multivariable analysis used Poisson regression to obtain adjusted prevalence ratios (aPRs). Variables that changed the PR by more than 10% relative to the crude estimate were considered confounders.
Ethical approval
The study was approved by the Health Research Ethics Committee of the Faculty of Medicine, Dr Cipto Mangunkusumo National Referral Hospital (KET-694/UN2.F1/ETIK/PPM.00.02/2025). The study relied exclusively on residual clinical specimens and routinely collected clinical data, with no additional interventions. Permission for use of residual samples and clinical information was covered under the hospital's general consent signed at the time of registration; therefore, separate study-specific informed consent was not required. We adhered to the STROBE guideline for reporting current study. 8
Results
Participant flow
A total of 97 patients presented with suspected stroke. Twenty-seven patients were excluded due to hemoglobin <8 g/dL (n = 3), malignancy (n = 5), sepsis (n = 1), transient ischemic attack (n = 1), or no head CT scan performed (n = 17). Seventy patients underwent whole blood and plasma viscosity testing, and all 70 were included in the final analysis (Figure 1).
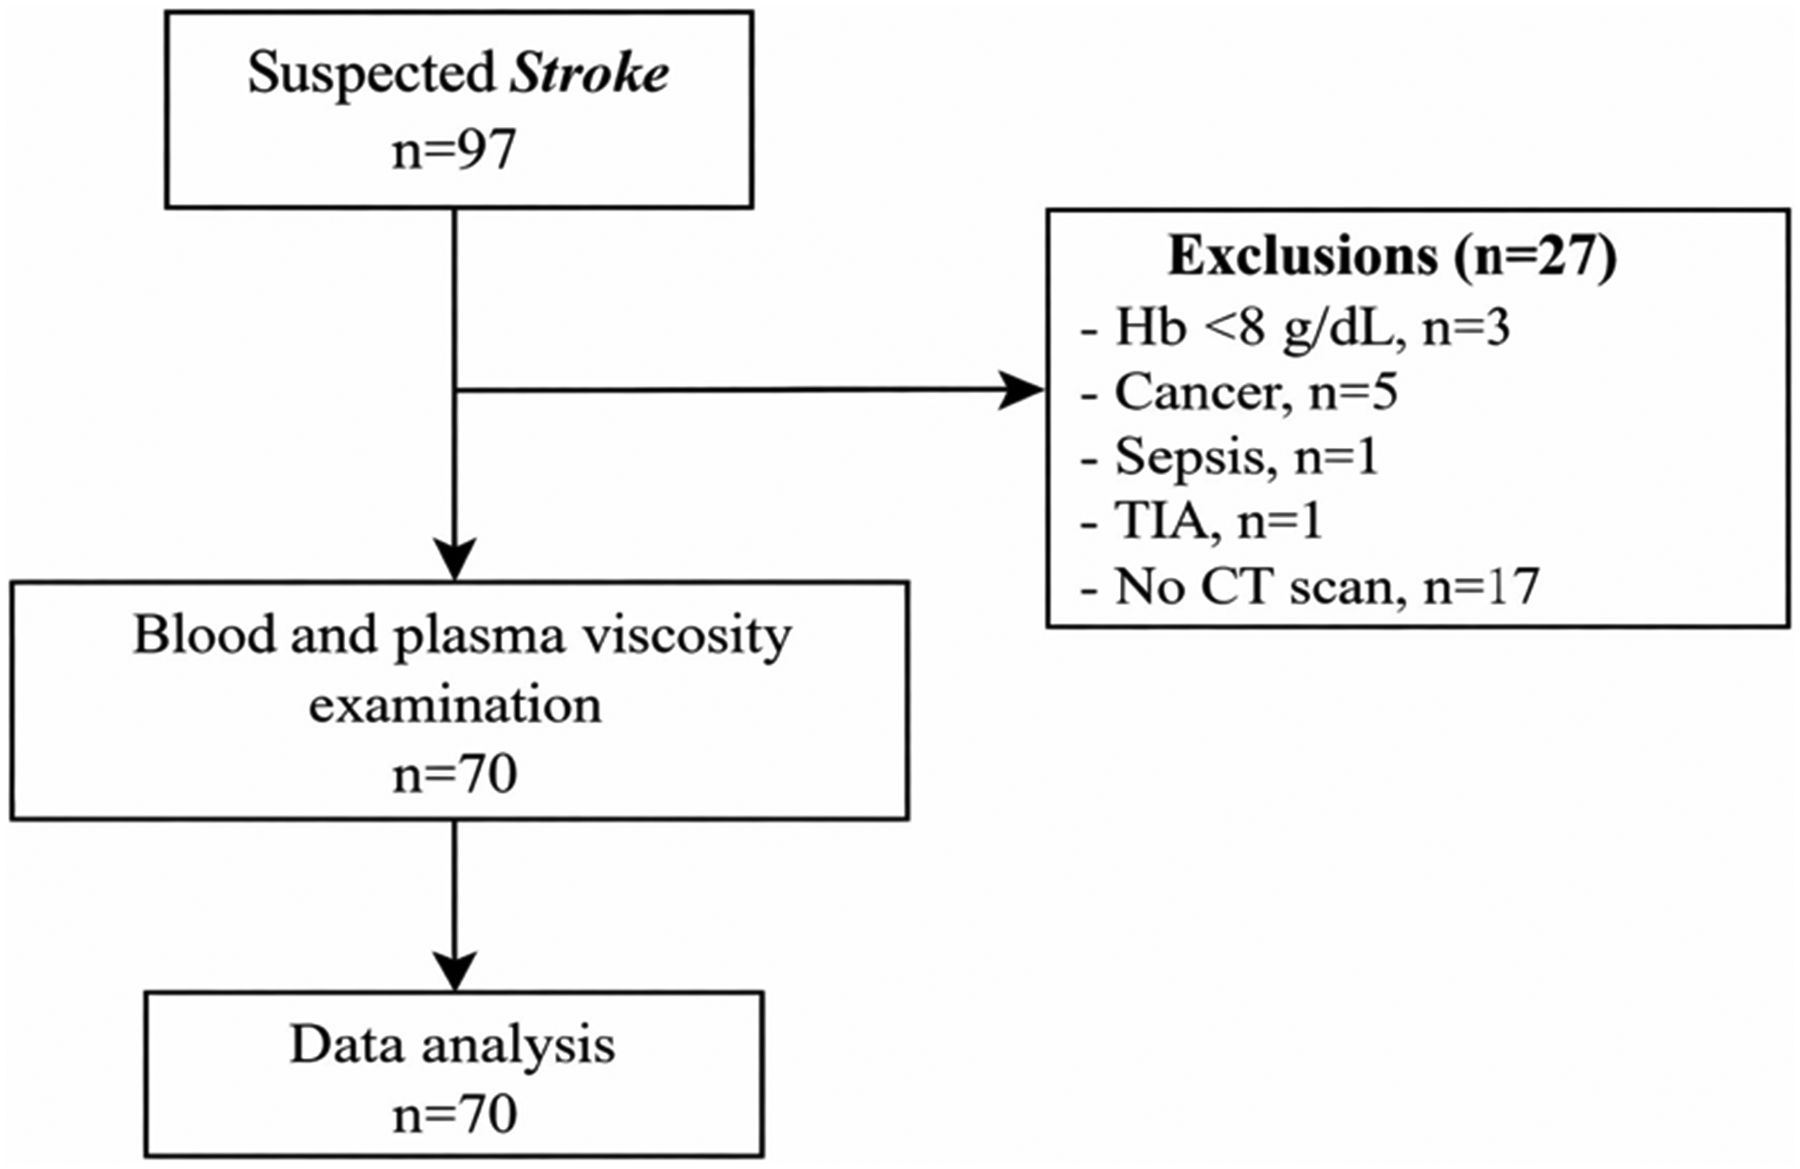
Flowchart of study subject selection.
Participant characteristics
Among the 70 included participants, 36 were classified as ischemic stroke, 16 as hemorrhagic stroke, and 18 as stroke mimic. Overall, 39/70 (55.7%) were male, and 31/70 (44.3%) were female. Median age was 52.5 years (Q1–Q3: 37–62). Hypertension was present in 47/70 (67.1%), ischemic heart disease in 7/70 (10.0%), smoking history in 18/70 (25.7%), and diabetes mellitus in 29/70 (41.4%). Median whole blood viscosity was 5.28 cP (Q1–Q3: 4.80–5.87), and median plasma viscosity was 2.17 cP (Q1–Q3: 2.08–2.38) (Table 1).
Characteristics of study participants.
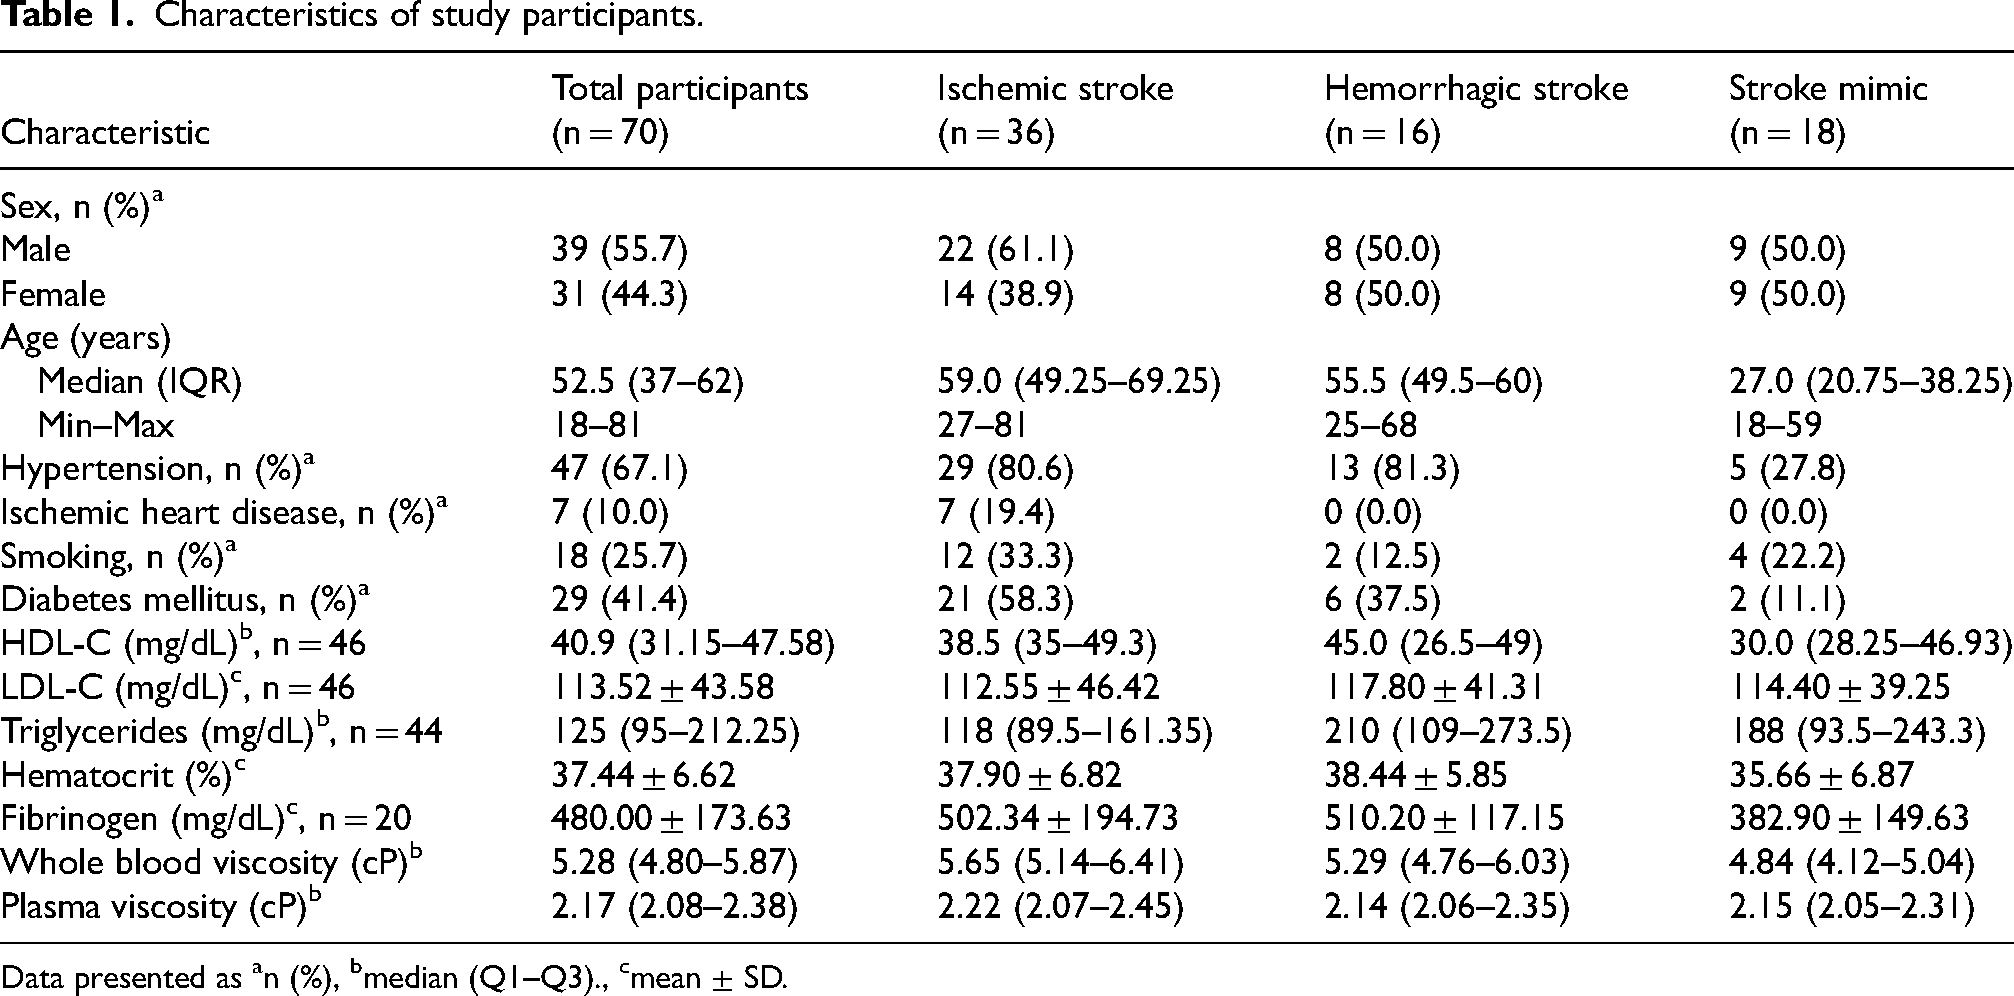
Data presented as an (%), bmedian (Q1–Q3)., cmean ± SD.
Diagnoses within the stroke mimic group
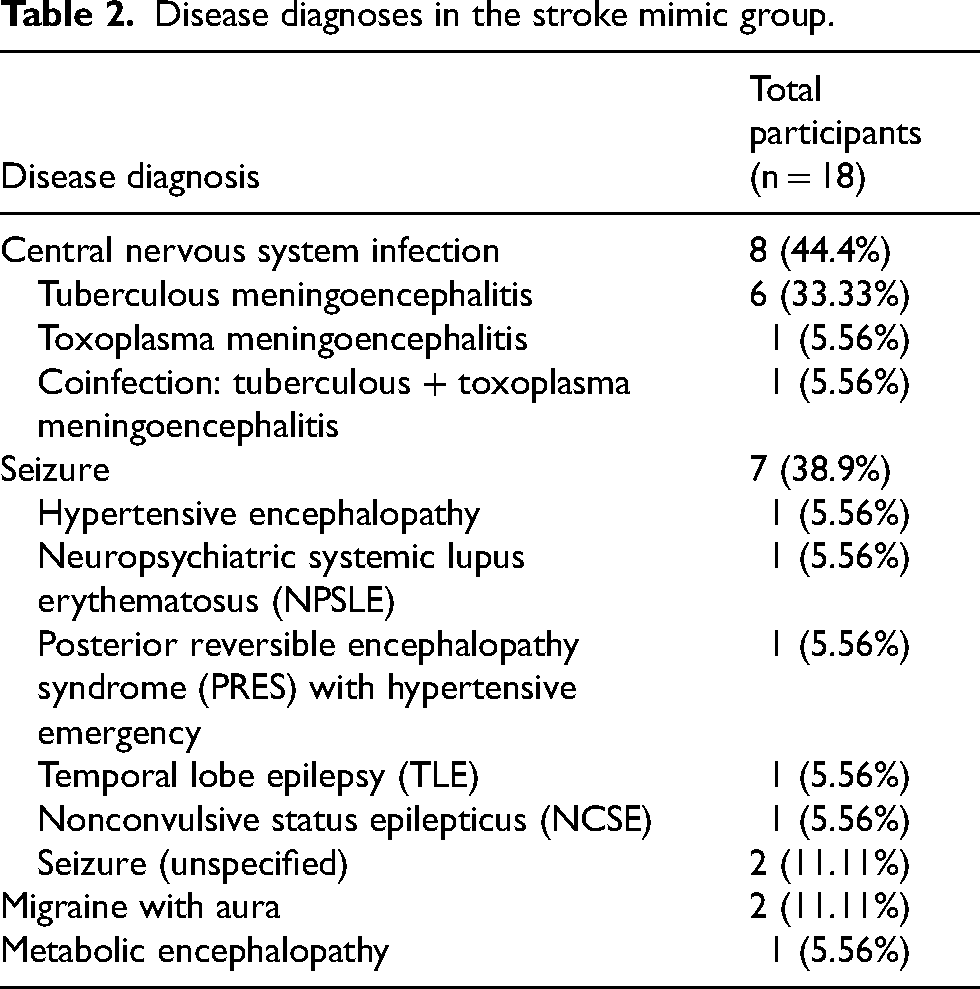
Within the stroke mimic group (n = 18), the most frequent diagnostic category was central nervous system infection (n = 8; 44.4%), followed by seizure-related diagnoses (n = 7; 38.9%), migraine with aura (n = 2; 11.1%), and metabolic encephalopathy (n = 1; 5.6%). Central nervous system infections included tuberculous meningoencephalitis (n = 6; 33.33%), toxoplasma meningoencephalitis (n = 1; 5.56%), and TB–toxoplasma coinfection (n = 1; 5.56%). Seizure-related diagnoses included hypertensive encephalopathy (n = 1; 5.56%), neuropsychiatric systemic lupus erythematosus (NPSLE) (n = 1; 5.56%), posterior reversible encephalopathy syndrome (PRES) with hypertensive emergency (n = 1; 5.56%), temporal lobe epilepsy (n = 1; 5.56%), nonconvulsive status epilepticus (n = 1; 5.56%), and unspecified seizures (n = 2; 11.11%) (Table 2).
Disease diagnoses in the stroke mimic group.
Precision testing of the neo digital microcapillary device
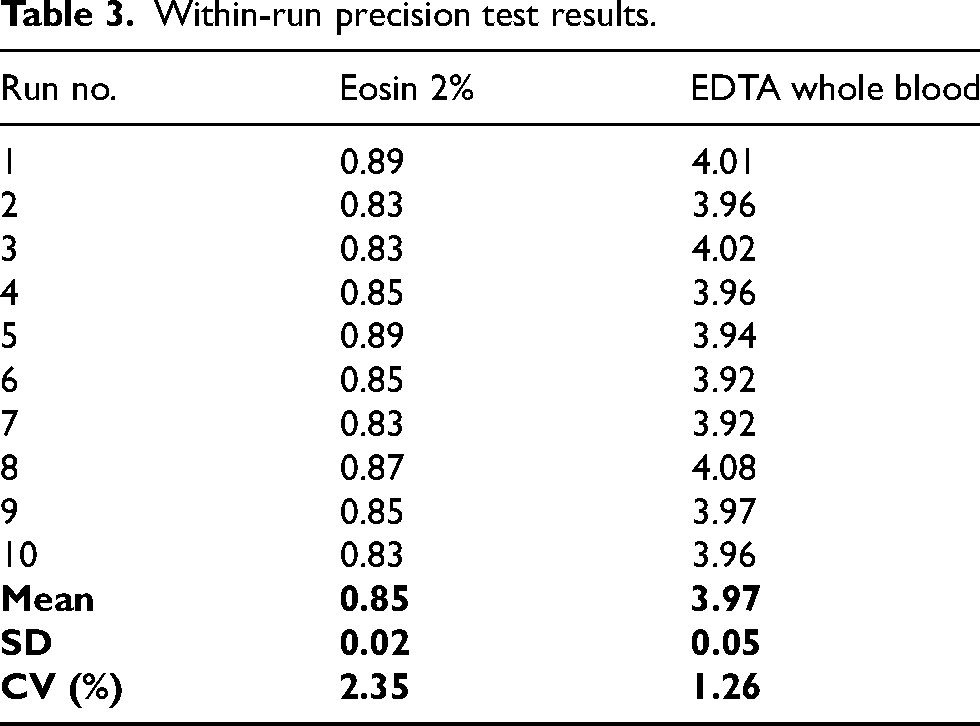
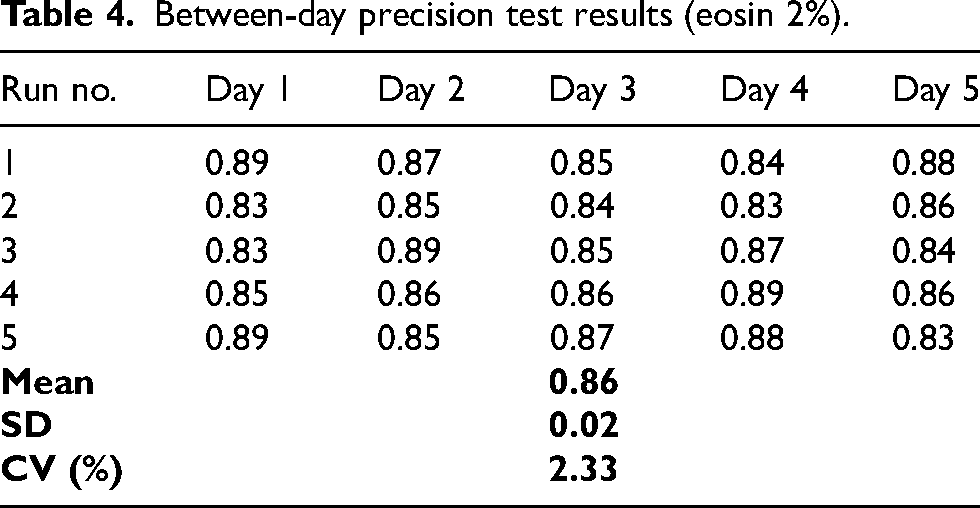
Within-run precision testing (10 consecutive measurements) yielded a mean (SD) of 0.85 (0.02) for eosin 2% with CV 2.35%, and 3.97 (0.05) for EDTA whole blood with CV 1.26% (Table 3). Between-day precision testing of eosin 2% over five days yielded a mean (SD) of 0.86 (0.02) with CV 2.33% (Table 4).
Within-run precision test results.
Between-day precision test results (eosin 2%).
Whole blood viscosity by diagnostic group
Median whole blood viscosity (Q1–Q3) was 5.65 cP (5.14–6.41) in ischemic stroke, 5.29 cP (4.76–6.03) in hemorrhagic stroke, and 4.84 cP (4.12–5.04) in stroke mimic (Table 5; Figure 2). The overall Kruskal–Wallis test yielded p < 0.0001, and pairwise Mann–Whitney p-values versus the reference (stroke mimic) were <0.0001 for ischemic stroke and 0.005 for hemorrhagic stroke; however, no statistically significant difference was observed between ischemic and hemorrhagic stroke (p = 0.184) (Table 5).
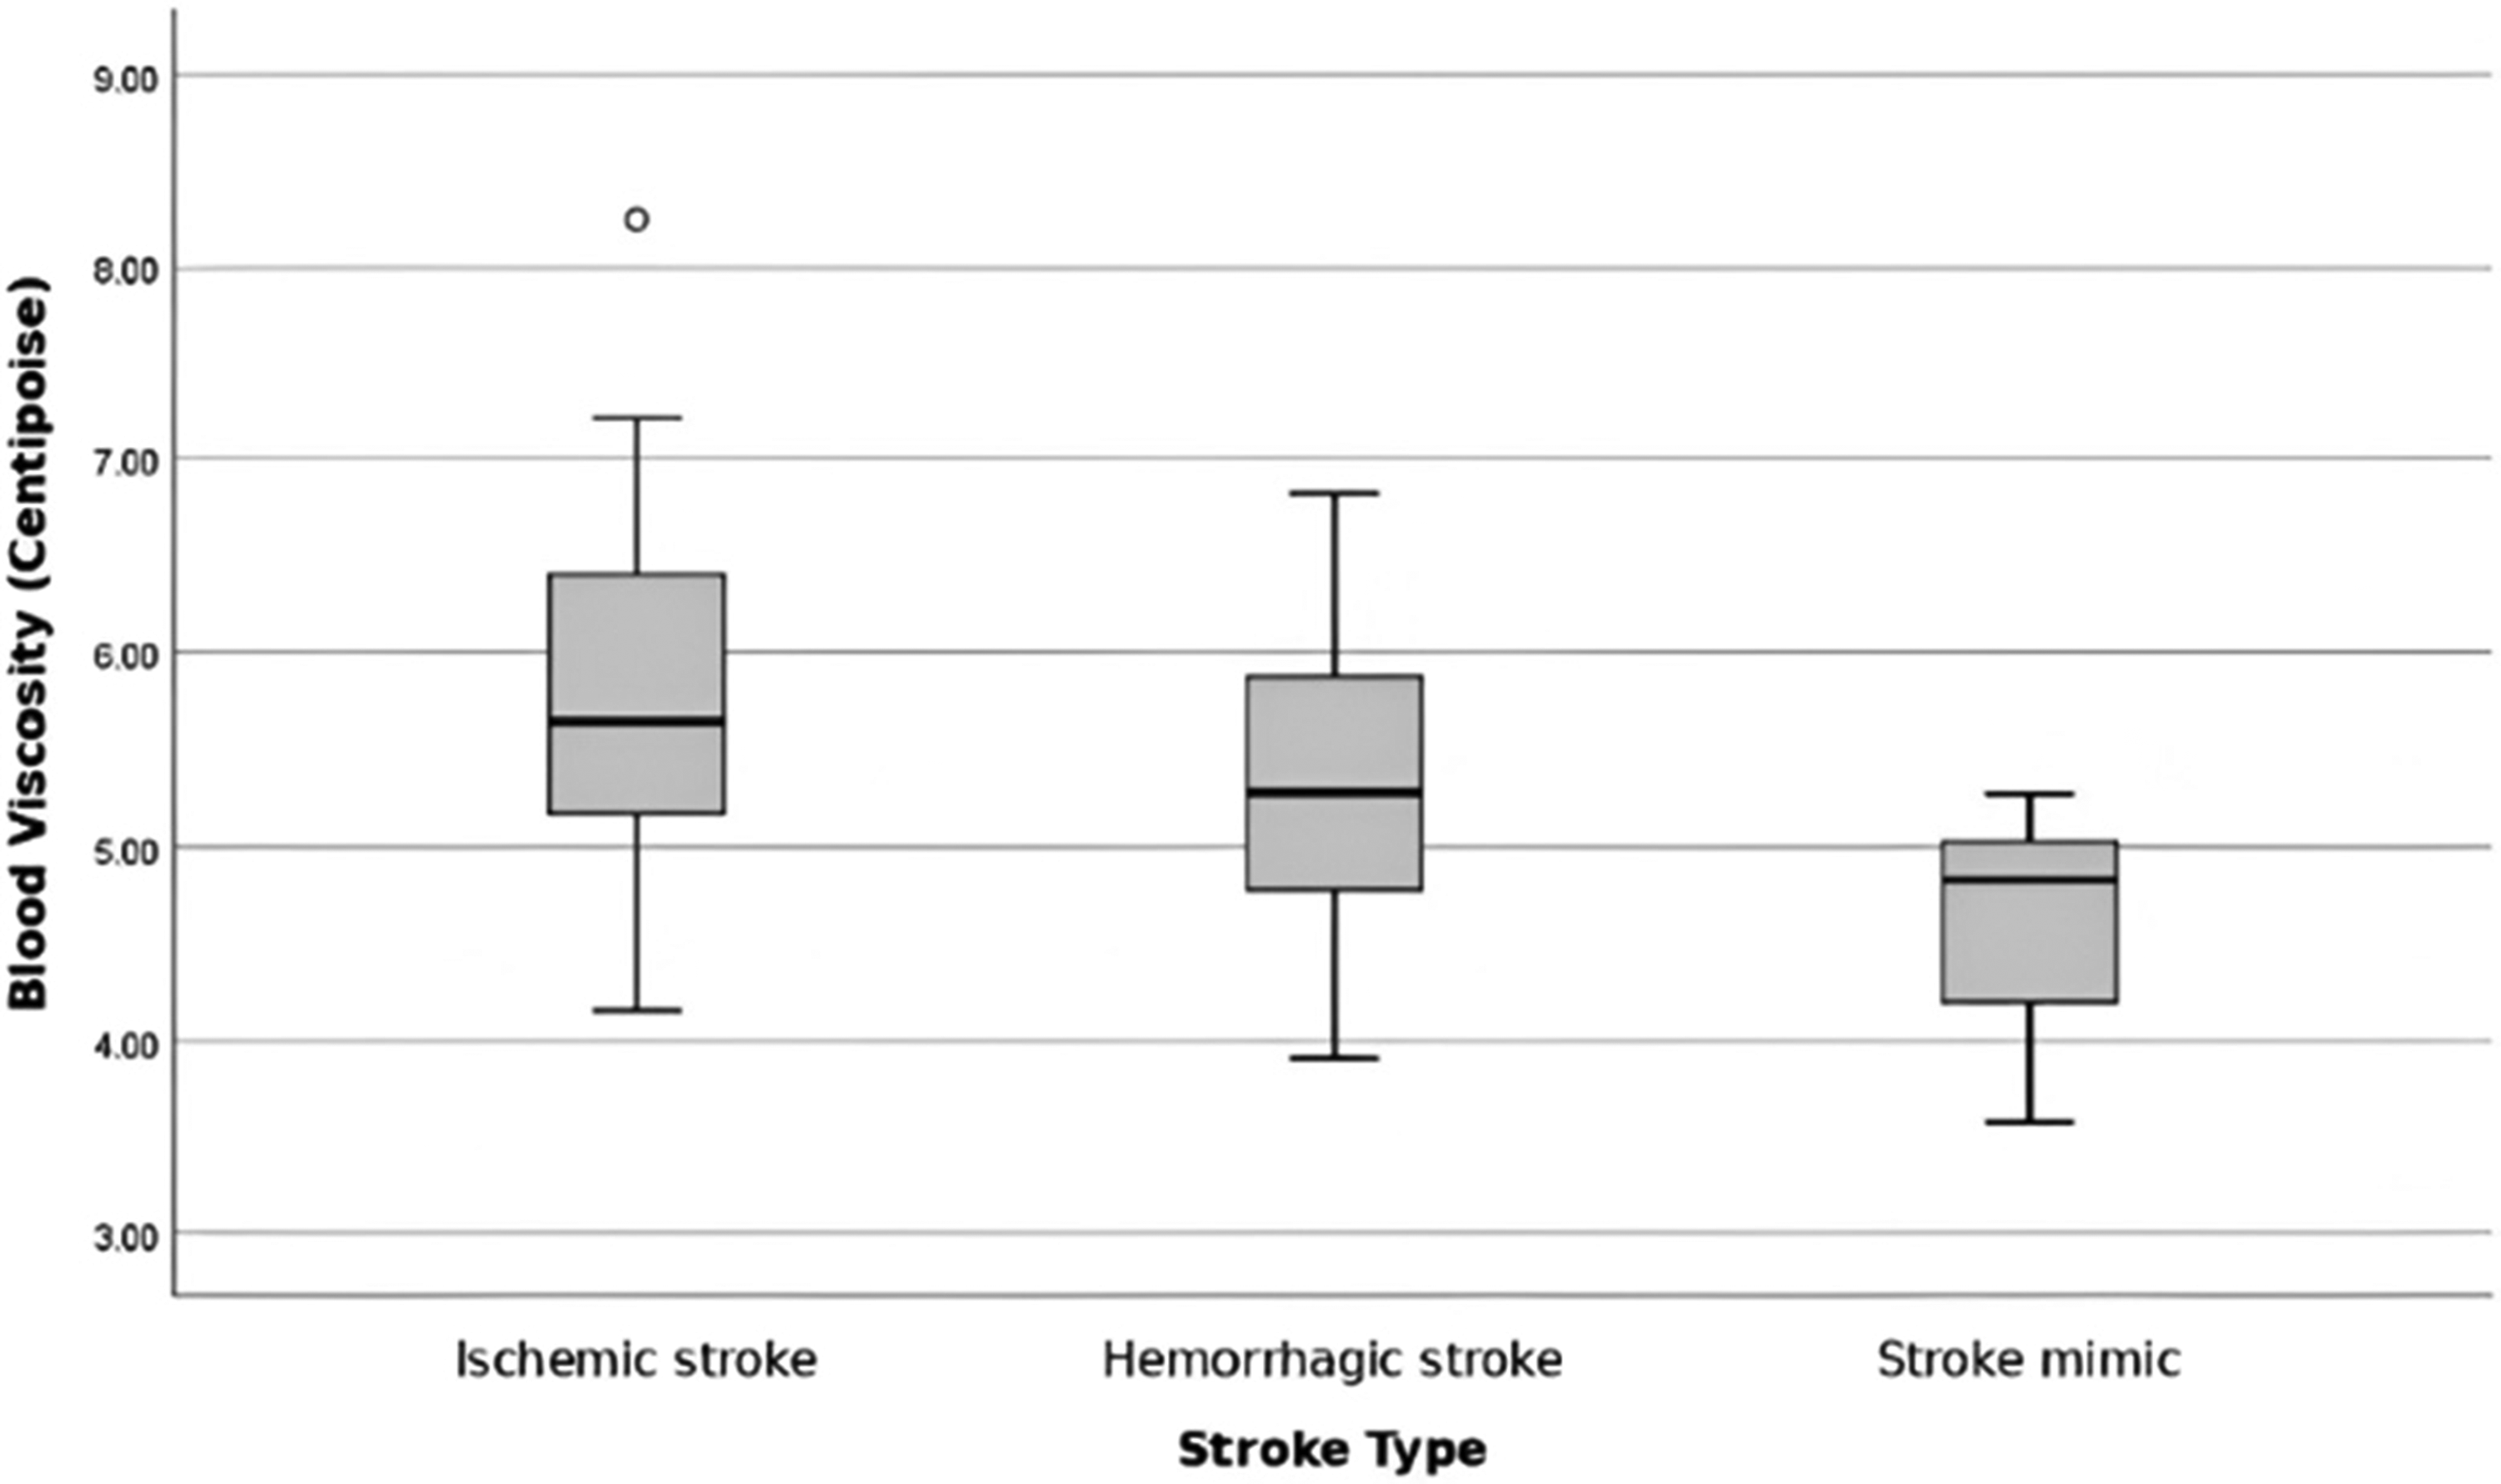
Boxplot of blood viscosity in ischemic stroke, hemorrhagic stroke, and stroke mimic groups.
Whole blood viscosity by stroke type (ischemic, hemorrhagic, and stroke mimic).
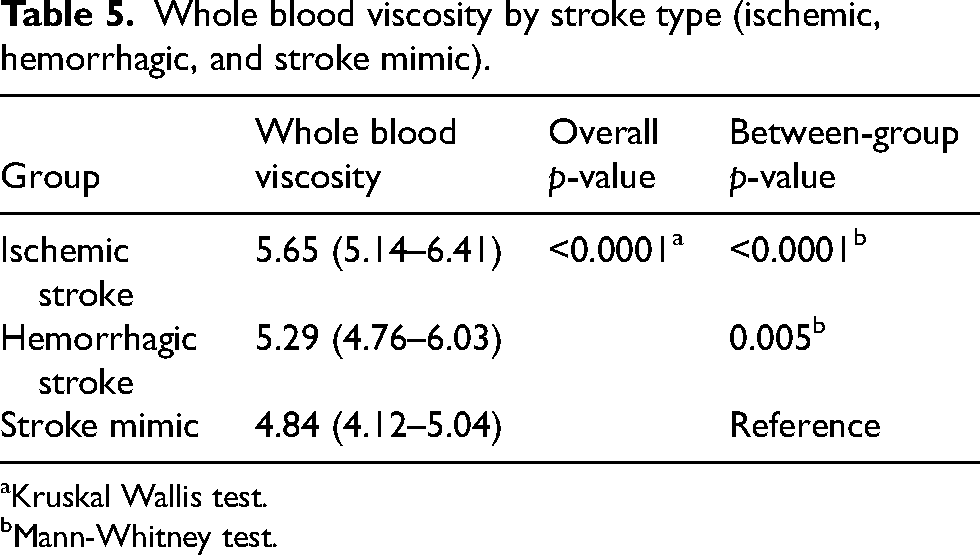
Kruskal Wallis test.
Mann-Whitney test.
Plasma viscosity by diagnostic group
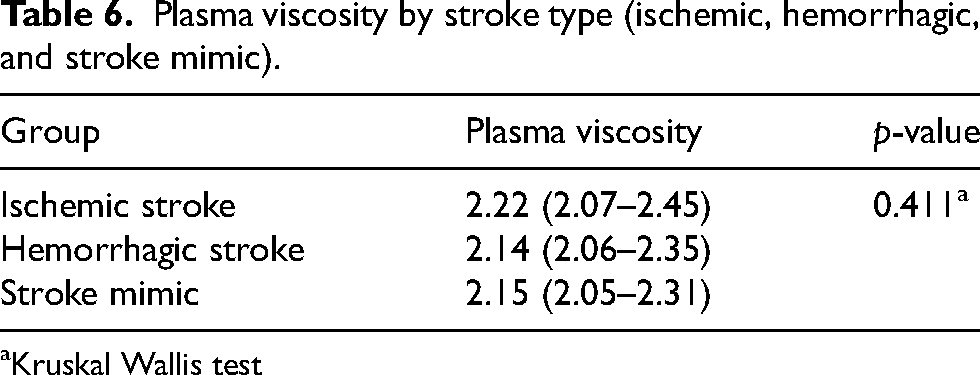
Median plasma viscosity (Q1–Q3) was 2.22 cP (2.07–2.45) in ischemic stroke, 2.14 cP (2.06–2.35) in hemorrhagic stroke, and 2.15 cP (2.05–2.31) in stroke mimic (Table 6; Figure 3). The overall Kruskal–Wallis test yielded p = 0.411 (Table 6).
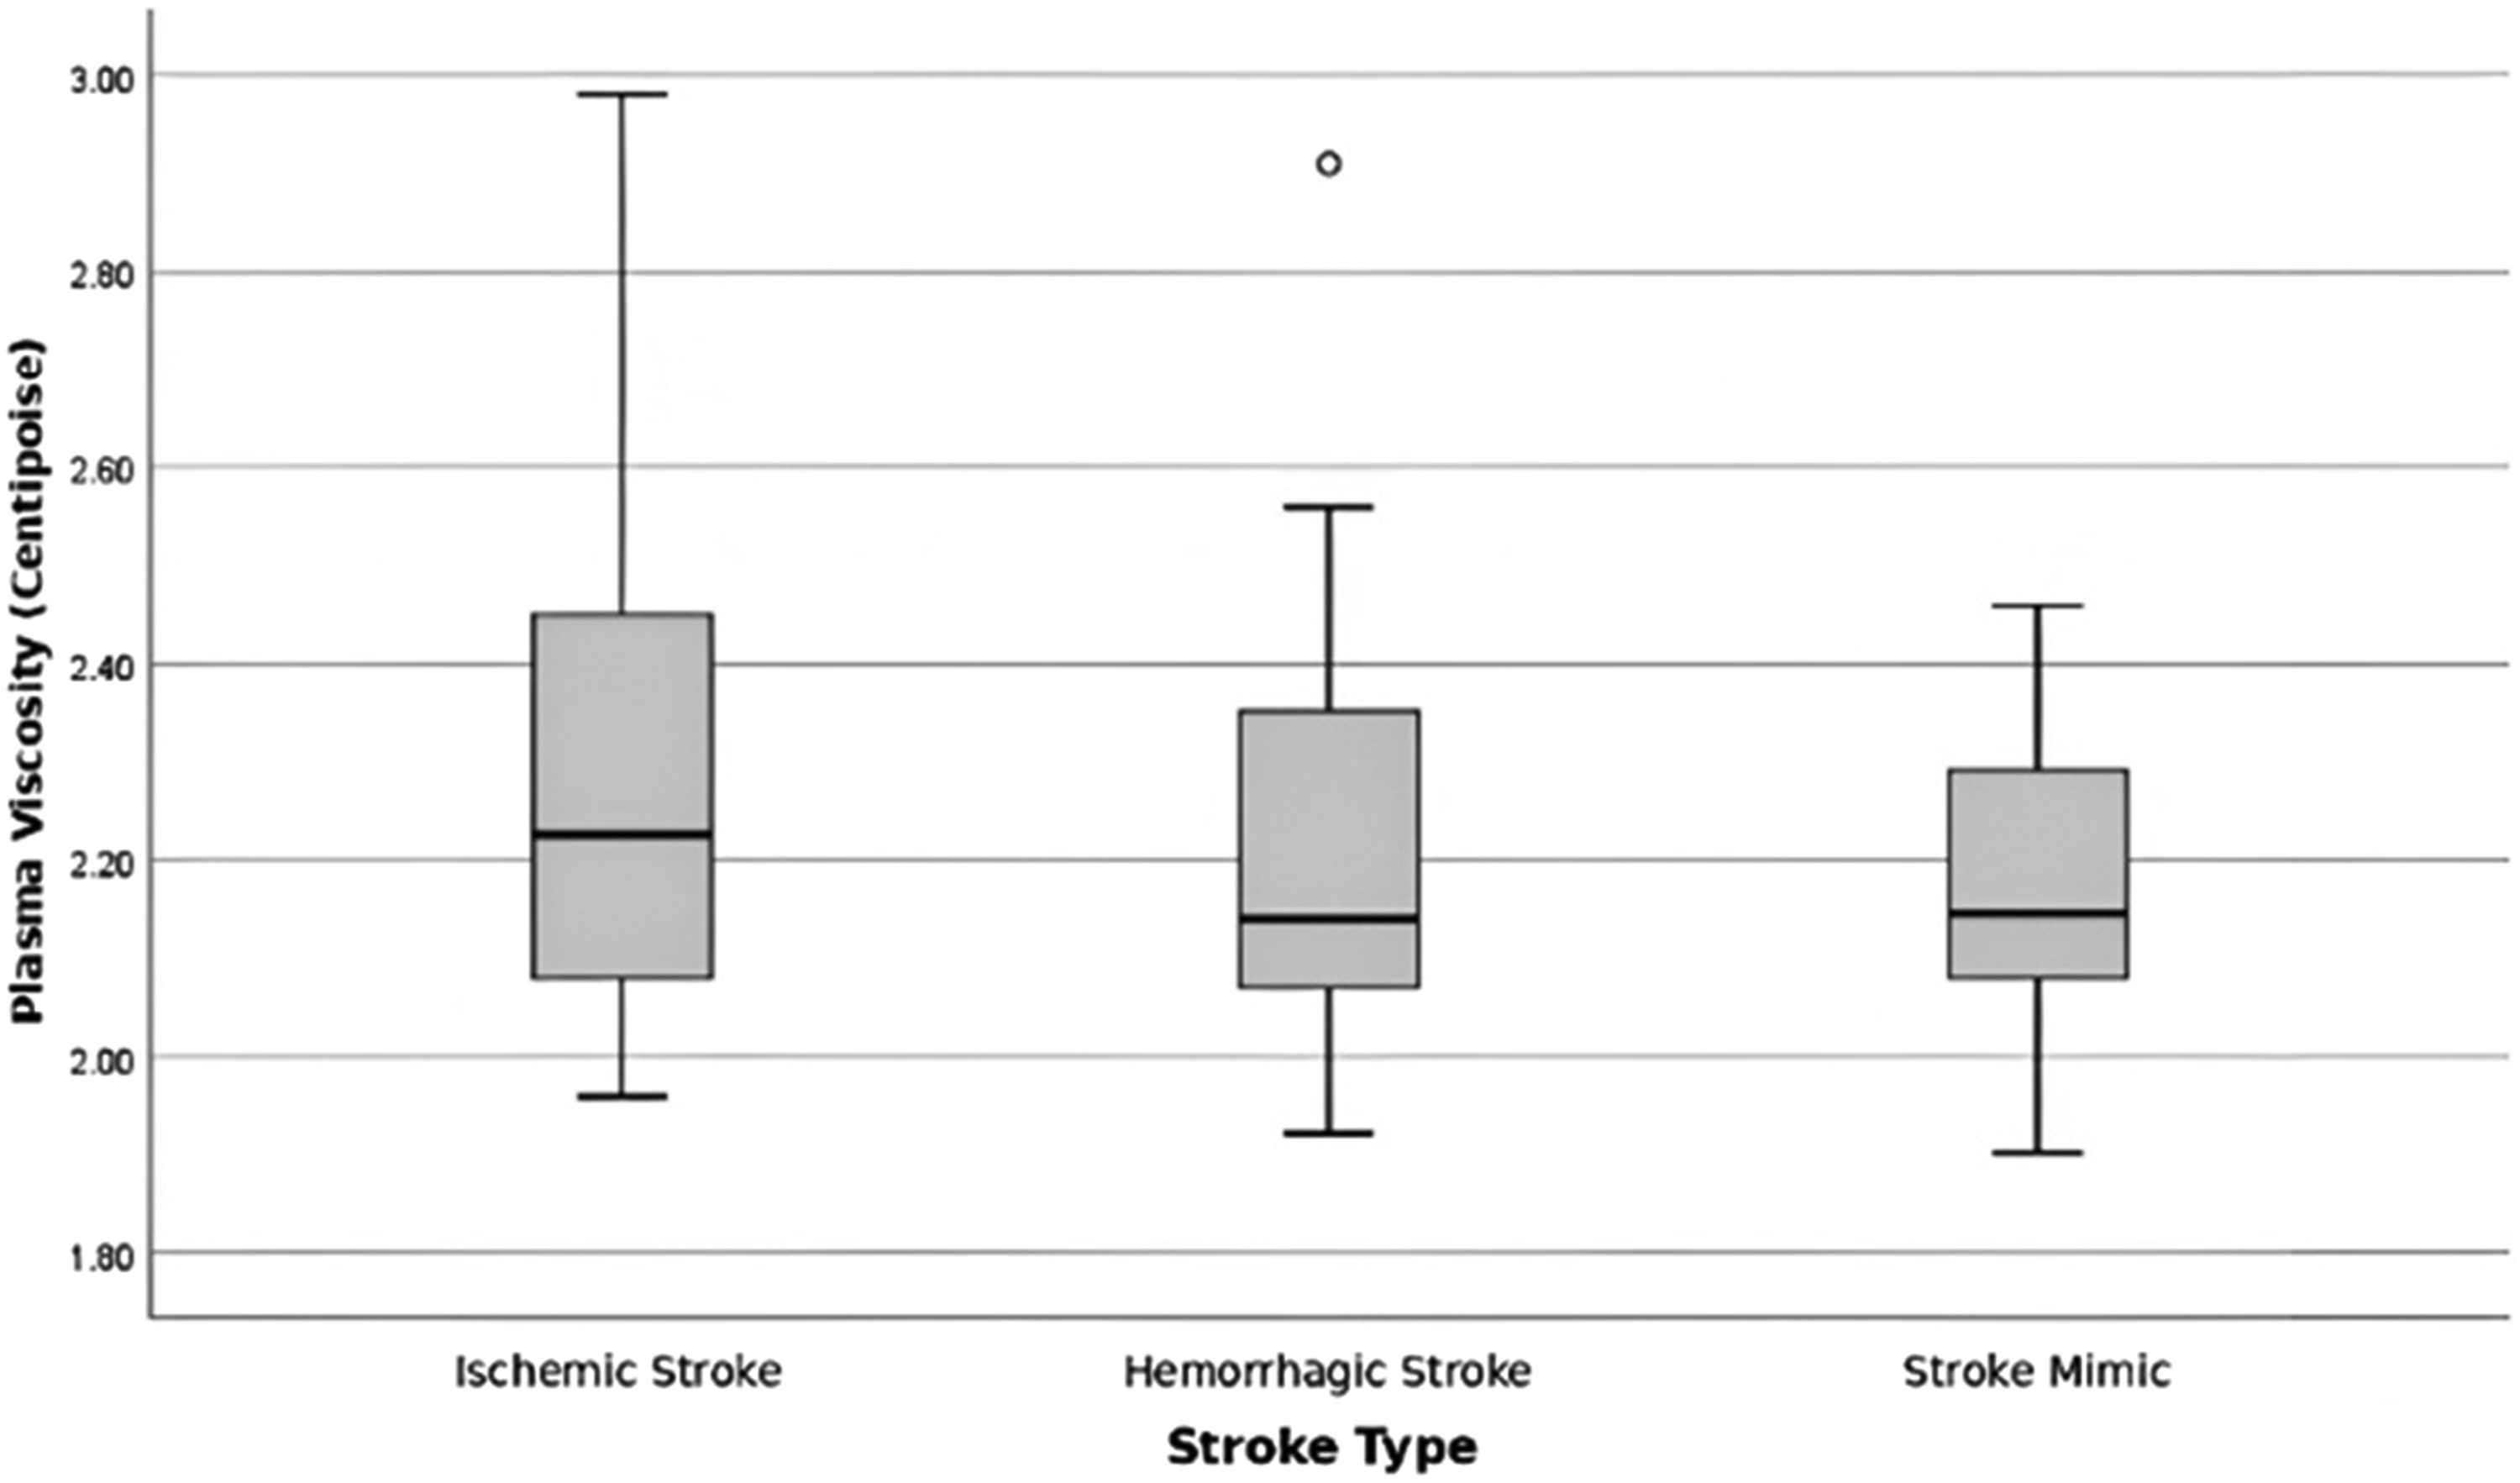
Boxplot of plasma viscosity in ischemic stroke, hemorrhagic stroke, and stroke mimic groups.
Plasma viscosity by stroke type (ischemic, hemorrhagic, and stroke mimic).
Kruskal Wallis test
ROC analysis for whole blood viscosity (stroke vs stroke mimic)
Receiver operating characteristic analysis for whole blood viscosity to predict stroke (ischemic/hemorrhagic) versus stroke mimic showed an AUC of 0.84 with p < 0.0001 (Figure 4). The optimal cut-off value was 5.17, with a sensitivity of 71.2%, specificity of 94.4%, PPV of 97.37%, and NPV of 53.13%.
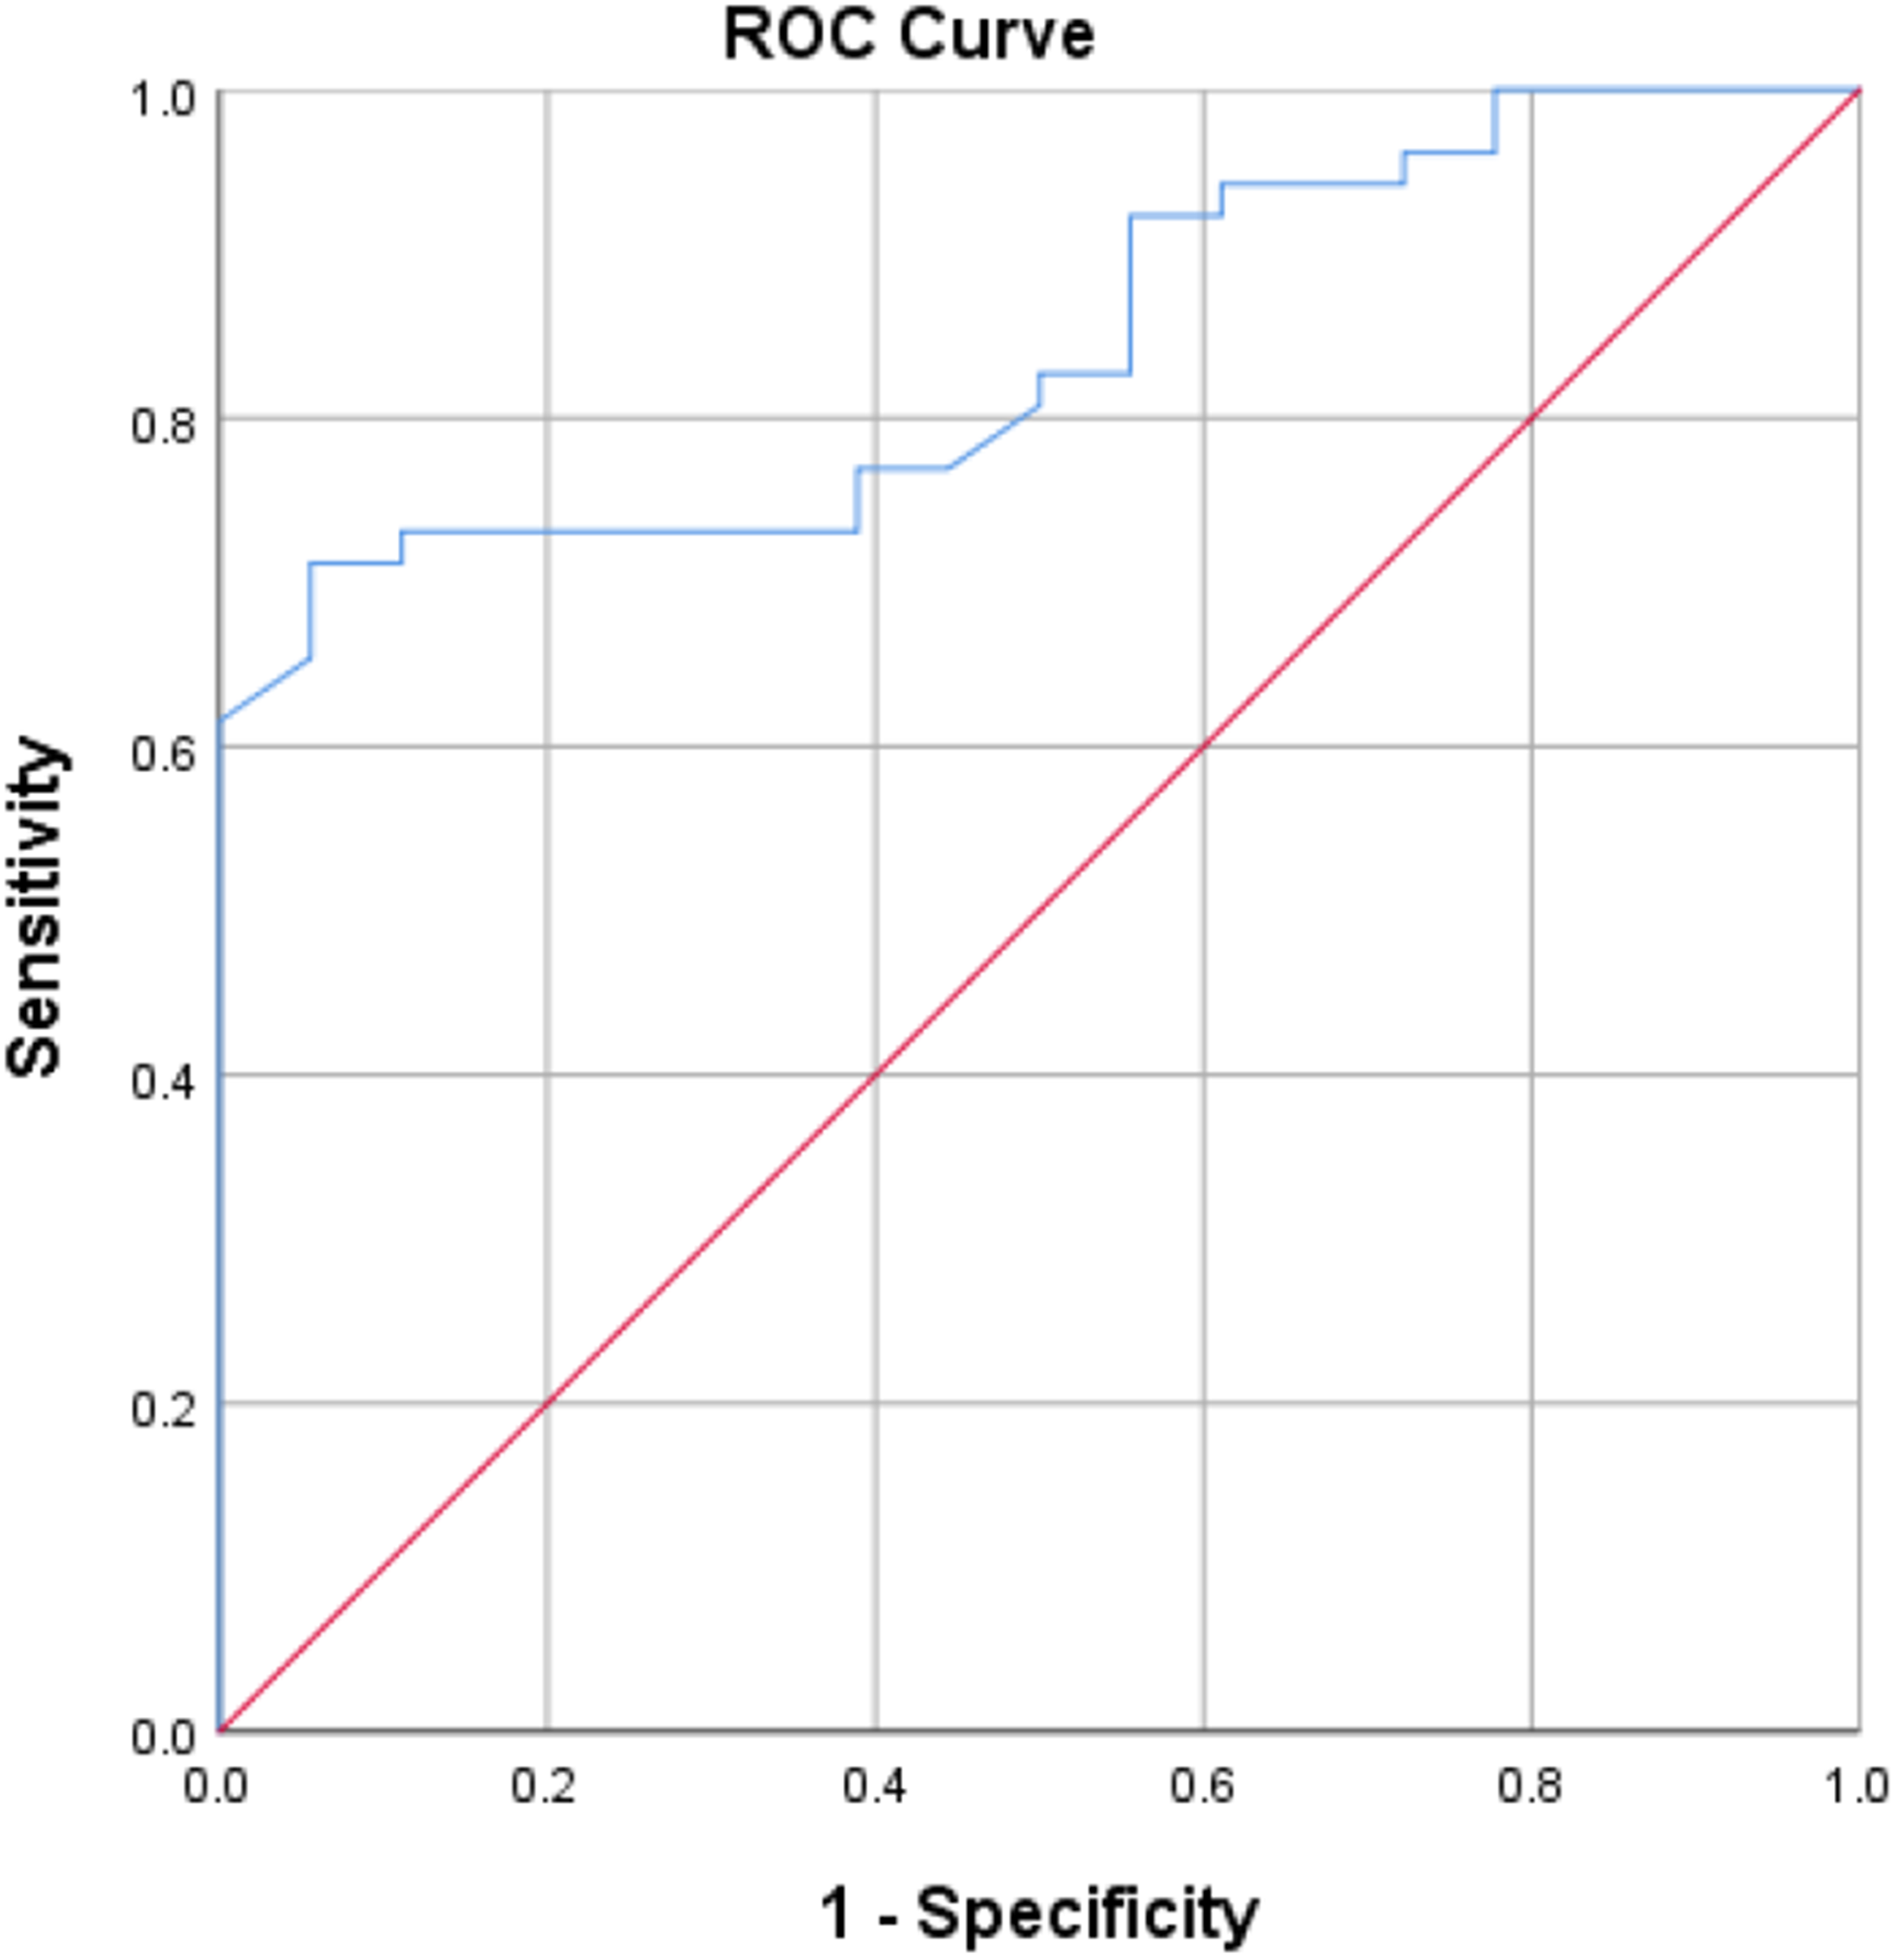
ROC curve of blood viscosity for predicting stroke and stroke mimic.
Bivariate analysis of covariates and whole blood viscosity classification
In the combined stroke group (ischemic/hemorrhagic; n = 52) versus stroke mimic (n = 18), high whole blood viscosity (≥5.17 cP) was observed in 37 (97.37%) stroke cases and 1 (2.63%) stroke mimic case; low viscosity (<5.17 cP) was observed in 15 (46.88%) stroke cases and 17 (53.13%) stroke mimic cases (p < 0.0001; PR 2.077, 95% CI 1.427–3.022) (Table 7). Mean (SD) age was 56.13 (12.52) years in the stroke group and 30.78 (12.13) years in the stroke mimic group (p < 0.0001) (Table 7). Hypertension was present in 42 (89.36%) stroke cases and 5 (10.64%) stroke mimic cases (p = 0.003; PR 2.055, 95% CI 1.272–3.321). Ischemic heart disease was present in 7 (100.0%) stroke cases and 0 (0.0%) stroke mimic cases (p < 0.0001; PR 1.400, 95% CI 1.196–1.638). Diabetes mellitus was present in 27 (93.10%) stroke cases and 2 (6.90%) stroke mimic cases (p = 0.002; PR 1.527, 95% CI 1.170–1.992). Smoking status yielded p = 0.683 (PR 1.064, 95% CI 0.789–1.435). HDL-C (n = 46) was 42.33 ± 11.53 vs 36.91 ± 15.29 mg/dL (p = 0.228); LDL-C (n = 46) was 111 (76.5–142) vs 107.5 (91–119) mg/dL (p = 0.915); triglycerides (n = 44) were 124.5 (94–207) vs 188 (99–243) mg/dL (p = 0.484); hematocrit was 38.07 ± 6.49% vs 35.66 ± 6.87% (p = 0.185); and fibrinogen (n = 20) was 504.31 ± 174.83 vs 328.9 ± 149.62 mg/dL (p = 0.220) (Table 7).
Bivariate analysis of potential confounders associated with viscosity in stroke (ischemic/hemorrhagic) versus stroke mimic.
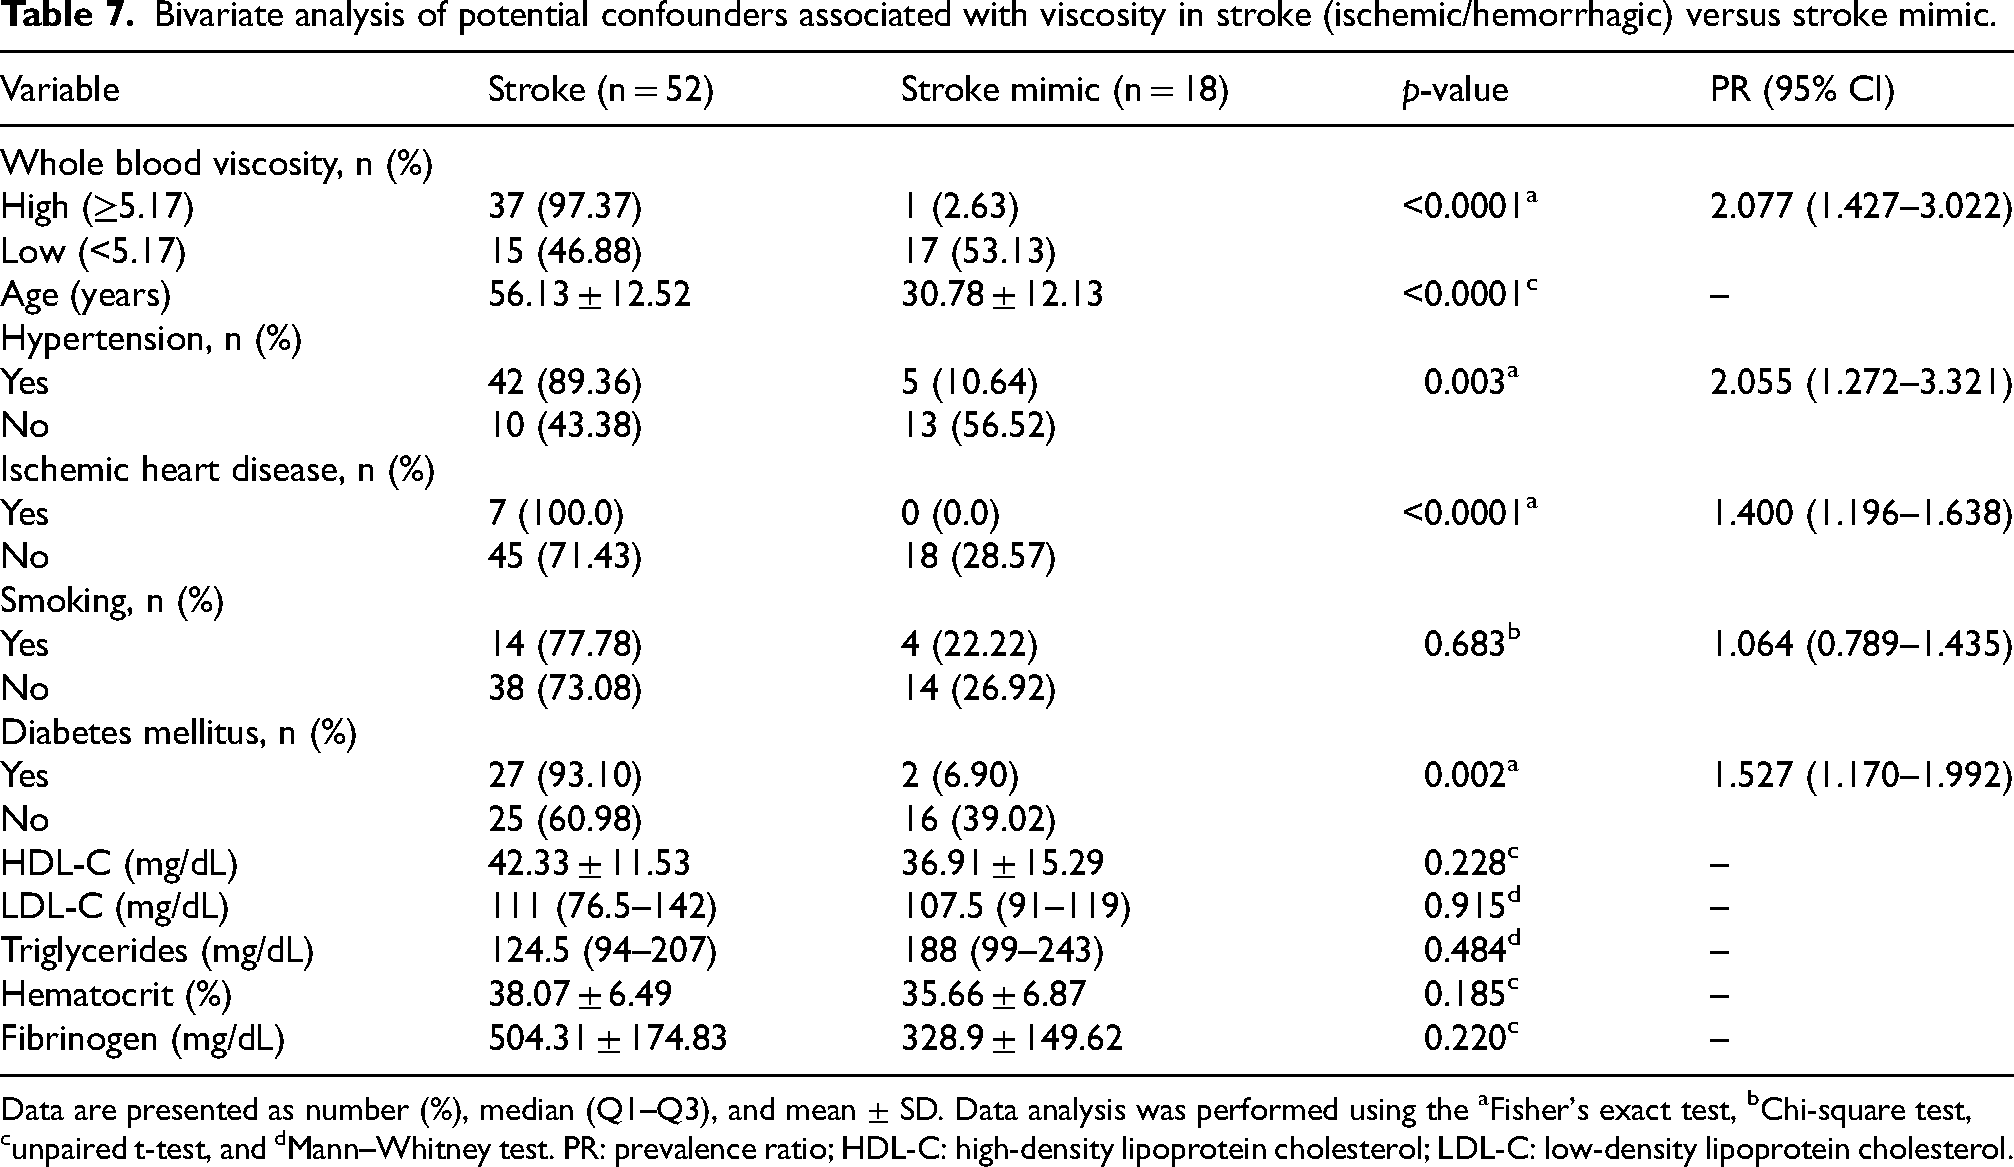
Data are presented as number (%), median (Q1–Q3), and mean ± SD. Data analysis was performed using the aFisher's exact test, bChi-square test, cunpaired t-test, and dMann–Whitney test. PR: prevalence ratio; HDL-C: high-density lipoprotein cholesterol; LDL-C: low-density lipoprotein cholesterol.
Multivariable analysis
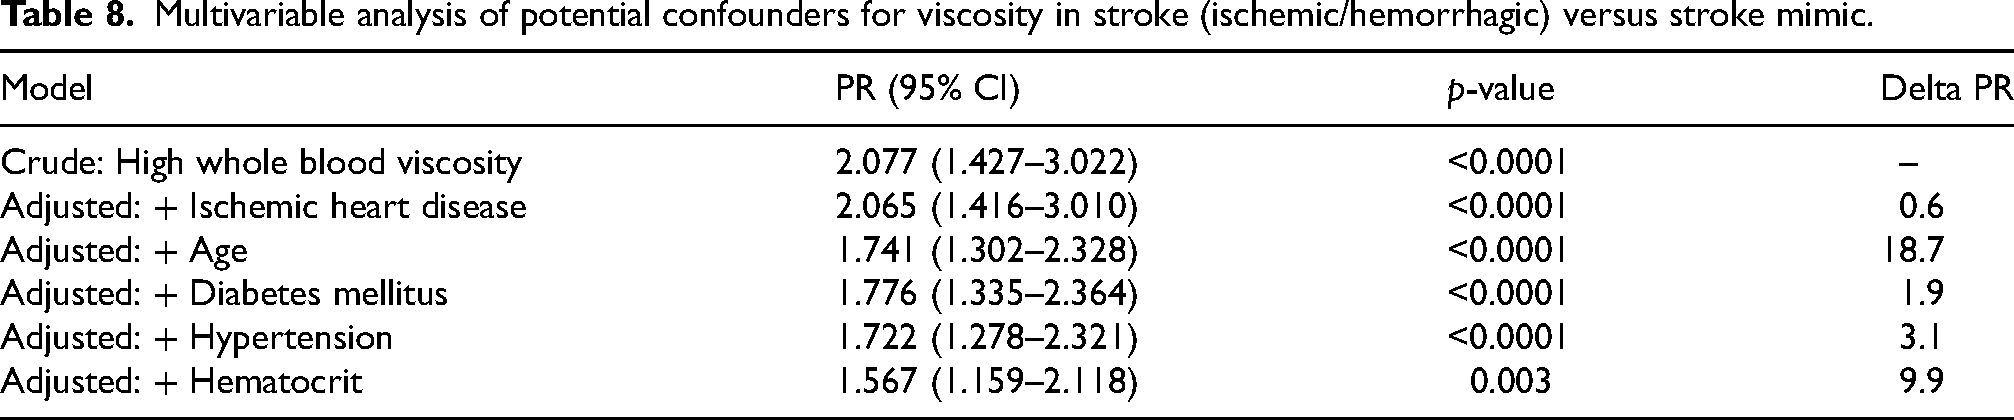
The crude prevalence ratio (PR) for high whole blood viscosity (≥5.17 cP) was 2.077 (95% CI 1.427–3.022; p < 0.0001). Adjusted models yielded: PR 2.065 (95% CI 1.416–3.010; p < 0.0001) after adjustment for ischemic heart disease (delta PR 0.6); PR 1.741 (95% CI 1.302–2.328; p < 0.0001) after adjustment for age (delta PR 18.7); PR 1.776 (95% CI 1.335–2.364; p < 0.0001) after adjustment for diabetes mellitus (delta PR 1.9); PR 1.722 (95% CI 1.278–2.321; p < 0.0001) after adjustment for hypertension (delta PR 3.1); and PR 1.567 (95% CI 1.159–2.118; p = 0.003) after adjustment for hematocrit (delta PR 9.9) (Table 8).
Multivariable analysis of potential confounders for viscosity in stroke (ischemic/hemorrhagic) versus stroke mimic.
Discussion
Cerebrovascular disease is associated with chronic blood hyperviscosity, with higher blood viscosity observed in stroke patients and an increased risk of stroke. Hematocrit is the primary determinant of blood viscosity, followed by erythrocyte aggregation and deformability, while plasma viscosity also contributes through plasma components such as fibrinogen and lipoproteins that influence blood flow properties. 11 In this cohort, whole blood viscosity differed significantly across the three diagnostic groups, with higher values in ischemic stroke and hemorrhagic stroke than in stroke mimics, whereas plasma viscosity did not differ significantly between groups.
In ischemic stroke, elevated blood viscosity is driven by increased hematocrit, fibrinogen, and erythrocyte aggregation, and is further influenced by vascular risk factors such as advanced age, hypertension, diabetes mellitus, dyslipidemia, smoking, and ischemic heart disease.12,13 In hemorrhagic stroke, inflammatory responses and coagulation activation following intracranial bleeding may also increase blood viscosity.14,15 Although plasma viscosity is an important parameter reflecting plasma protein and lipid contributions, its lack of significant difference in this study may be explained by early presentation within 24 h of symptom onset, before the fibrinogen-mediated increases in plasma viscosity peak. 16 This finding suggests that whole blood viscosity may be a more relevant and practical biomarker for stroke type differentiation in the hyperacute phase.
ROC curve analysis identified a whole blood viscosity cut-off value of 5.17 cP for differentiating stroke from non-stroke patients, yielding a sensitivity of 71.2%, specificity of 94.4%, PPV of 97.37%, and NPV of 53.13%. This cut-off correctly identified 71.2% of stroke cases and accurately classified most non-stroke individuals, as reflected by the high specificity. The high PPV indicates a low false-positive rate, supporting the utility of blood viscosity measurement for confirming stroke diagnosis, whereas the moderate sensitivity and NPV suggest limited suitability for population screening due to the risk of false-negative results. The AUC of 0.84 (p < 0.0001) demonstrates excellent overall discriminative performance of blood viscosity in predicting stroke, indicating that the Neo Digital Microcapillary Viscometer is a valuable adjunctive diagnostic tool in acute clinical settings.
In bivariate analyses, age, hypertension, ischemic heart disease, diabetes mellitus, and hematocrit (p < 0.20) were included in multivariable Poisson regression to evaluate the association between blood viscosity and ischemic/hemorrhagic stroke after covariate adjustment. High blood viscosity was associated with stroke in the crude model (PR 2.08; 95% CI 1.43–3.02) and remained statistically significant after full adjustment, although attenuated (PR 1.57; 95% CI 1.16–2.12). Age produced a > 10% change in the PR estimate, confirming its role as a confounder, consistent with its independent association with stroke and its influence on blood viscosity through age-related plasma volume reduction and increased hematocrit.12,17,18 After adjustment, hypertension, diabetes mellitus, ischemic heart disease, and hematocrit were no longer significantly associated with stroke, indicating that their bivariate associations were largely explained by age. Lipid profile parameters and fibrinogen were not significantly associated with stroke, likely due to limited sample size and wide data variability.
The present study demonstrates that blood viscosity measurement using a microcapillary-based system may provide clinically meaningful information without requiring assessment at predefined shear rates. Given that blood flow in vivo is inherently dynamic and characterized by continuously varying shear conditions, the use of integrated viscosity measurement can reflect some aspect of blood flow behavior. This approach may also simplify clinical implementation compared to conventional methods that rely on shear-specific measurements.
Whole blood viscosity measurement may be positioned as a rapid adjunctive test in the emergency evaluation of suspected stroke, particularly in settings where immediate access to advanced neuroimaging is limited or when diagnostic uncertainty persists after initial clinical assessment. By integrating cellular and plasma determinants of flow resistance, this measurement may provide an objective physiological signal that complements bedside neurological examination and routine laboratory tests while awaiting imaging confirmation. Importantly, whole blood viscosity should be regarded strictly as a decision-support adjunct rather than a triage or stand-alone diagnostic tool, as it lacks sufficient sensitivity to reliably exclude stroke and cannot differentiate ischemic from hemorrhagic stroke with the certainty required for acute therapeutic decisions.
This study is the first to evaluate the diagnostic value of blood viscosity in stroke patients in Indonesia. This study has several limitations. Incomplete data for confounder analyses, particularly lipid profile and fibrinogen levels, may reduce the accuracy of multivariable analysis. In addition, the absence of a healthy control group limits the ability to distinguish the effect of blood viscosity on stroke from the confounding effect of age.
Conclusion
Our findings show that whole blood viscosity differs across suspected stroke diagnoses and provides discriminatory information between stroke (ischemic/hemorrhagic) and stroke mimic, whereas plasma viscosity does not show the same separation in this cohort. These results support the physiological relevance of cellular hemorheological determinants in acute neurovascular presentations and suggest that whole blood viscosity may serve as a practical adjunct variable in emergency stroke evaluation. A whole blood viscosity cut-off of 5.17 cP was identified for stroke prediction, yielding a sensitivity of 71.2%, specificity of 94.4%, positive predictive value of 97.37%, and negative predictive value of 53.13%. Accordingly, values ≥5.17 cP may support the diagnosis of stroke, while values below this threshold do not exclude stroke because of the residual risk of false-negative results. Blood viscosity, together with hematocrit, plays an important role in altering blood flow properties and may contribute to impaired cerebral circulation. Future prospective studies with complete fibrinogen and lipid profile data, as well as age-stratified analyses, are warranted to further clarify the relationship between blood viscosity and stroke.
Footnotes
Acknowledgements
None.
Ethical approval and informed consent statement
This study was approved by the Health Research Ethics Committee of the Faculty of Medicine, Universitas Indonesia/Dr. Cipto Mangunkusumo National Referral Hospital (KET-694/UN2.F1/ETIK/PPM.00.02/2025). Informed consent was not applicable
Funding
The authors received no financial support for the research, authorship, and/or publication of this article.
Declaration of conflicting interests
The authors declared no potential conflicts of interest with respect to the research, authorship, and/or publication of this article.
Data availability statement
The data were available from corresponding author on reasonnable request.