






Abstract
Background
We have previously shown that droplet degeneration (DD) signifies the beginning of neuritic plaque formation during Alzheimer's disease (AD) pathogenesis. As microglia associated with neuritic plaques exhibited strong ferritin expression and Perl's iron staining showed iron in microglia, droplet spheres and neuritic plaque cores, we hypothesized that DD is a form of ferroptosis.
Objective
Detection of molecular markers of ferroptosis in AD brains.
Methods
Immunohistochemical detection of transferrin receptor (TfR) and ferritin as ferroptosis markers in prefrontal cortex of AD brains, investigation of spatial correlation of these with histopathological hallmarks of AD, visualization of ferroptotic marker genes by in situ hybridization, comparison of expression of ferroptosis genes with snRNAseq analyses and comparison of TfR and ferritin expression in different neurofibrillary tangle (NFT) stages.
Results
TfR was found on neurons that appeared to be degenerating and exhibited typical features of droplet degeneration. Co-localization with hyperphosphorylated tau (p-tau) was a rare event. TfR-positive neurons increased with higher NFT stages as did ferritin expression in microglia. mRNA of genes linked to ferroptosis was detected in pretangles and p-tau negative neurons, less in DD. snRNAseq analyses support a link between AD, ferroptosis and TfR as a ferroptosis marker.
Conclusions
Increased expression of TfR and ferritin in high NFT stages, demonstration of ferroptotic marker genes in Alzheimer's lesions, as well as snRNAseq analyses strengthen our hypothesis that DD represents ferroptosis. Because of the morphological similarity between TfR-positive structures and DD, TfR might be an early ferroptosis marker expressed transiently during AD pathogenesis.
Introduction
Ferroptosis is suspected to be a cause of neuronal death in Alzheimer's disease (AD), but direct molecular evidence of ferroptosis in AD brain is still lacking. AD reveals several histologically detectable pathological structures, such as extracellular deposits of amyloid-β (Aβ) peptides and intracellular aggregates of hyperphosphorylated tau protein (p-tau) visible as pretangles, neurofibrillary tangles (NFT), neuropil threads and neuritic plaques. 1 Pretangles, which precede formation of neurofibrillary tangles2,3 can display near-normal neuronal morphology together with p-tau immunoreactivity. Based on prior work, 4 we believe that pretangles can develop into either NFTs via filamentous transformation, or into neuritic plaques via droplet degeneration. Droplet degeneration (DD) refers to retraction and balling-up of neurites and breakup of neurons into numerous p-tau + spherules (droplets) and dystrophic neurites of different sizes that arise from somata, axons, dendrites, and synaptic spines. During DD the neuronal membrane ruptures releasing high levels of intraneuronal iron into the extracellular space, which is detectable using Perl's iron stain. Thus, many of the p-tau + degenerating neuronal structures in AD brain can be co-localized with high levels of free iron. 4 An age-related increase in permeability of the blood-brain barrier could also contribute to rising brain iron, 5 particularly in the hippocampus 6 and temporal cortex, 7 regions known to be severely affected by neuronal degeneration and brain atrophy in AD.5,8–11 In response to the continuously increasing iron levels in the brain, a subpopulation of microglial cells shows increased ferritin expression and dystrophy. 12 A high level of iron is not only toxic to neurons but could also drive microglial dystrophy, which is characterized by atrophic or pseudo-fragmented cytoplasmic processes 13 and high ferritin levels. Microglial dystrophy precedes the onset of neurofibrillary degeneration in AD, 14 suggesting that waning of microglial integrity and neuroprotection is a factor contributing to neurodegeneration. Furthermore, high intraneuronal iron can exert an influence on kinase activities 15 and may therefore promote tau-hyperphosphorylation, aggregation and ultimately cell toxicity.16–18
Ferroptosis is a form of non-apoptotic cell death caused by excessively high iron levels and was first described by Dixon et al. in 2012. 19 Iron can be cytotoxic at high concentrations due to its redox activity, which promotes the formation of reactive oxygen species causing oxidative stress, lipid peroxidation and ultimately DNA damage and cell death. 20 Therefore, pathological changes in mitochondrial ultrastructure can be observed in ferroptotic cells, such as reduction in mitochondrial volume, increase in mitochondrial membrane density and disappearance of mitochondrial cristae. 21 Furthermore, ferroptosis differs from apoptosis and necrosis in that the nucleus remains intact.22,23 Membrane blebbing is described during ferroptosis, whereby the ferroptotic cell transforms into multiple bubbles that reach the size of the entire original cell. 24 These morphological attributes of ferroptosis are highly reminiscent of those seen in DD, supporting our hypothesis. Ferroptosis is also controlled by epigenetic, transcriptional and post-translational mechanisms. 25
In the current study, we established staining for molecular markers of ferroptosis in order to test whether p-tau + degenerating neurons stain positively. Besides ferritin, 26 we stained for the transferrin receptor (TfR). Feng et al. 27 described an extensive expression of TfR as a marker of ferroptosis because they observed increased accumulation of this receptor on membranes of cultured Ht-1080 cells with induced ferroptosis. 27 Physiologically, TfR is located on cell membranes and is responsible for iron uptake. Two isoforms of TfR, TfR1 and TfR2, are distinguished, with TfR1 in particular being responsible for iron uptake due to its higher iron affinity and expression pattern. 26 Iron is transported in the blood coupled to transferrin and this transferrin-iron complex can ultimately be taken up by the TfR to deliver iron to the brain, where it is required for multiple metabolic functions in neurons. 28 In order to ensure iron homeostasis, microglial cells are responsible for sequestering excess iron by synthesizing ferritin and thus storing iron within their cytoplasm. 29 In conclusion, TfR and ferritin are two important key proteins of iron metabolism. To determine if TfR expression is altered in AD brains and whether or not its expression is correlated with p-tau + structures, we have examined brains of humans with both, early and late NFT stages.
Furthermore, we have examined the expression of iron homeostasis and lipid peroxidation genes. According to the ferroptosis database FerrDB 30 we differentiate between ferroptosis drivers, suppressors and markers. The PTGS2 gene codes for prostaglandin endoperoxide synthase 2, which is an enzyme that influences the conversion of arachidonic acid to prostaglandin. 31 However, the inhibition of this gene does not lead to prevention of ferroptosis, yet it is the most upregulated gene of ferroptotic cell death and represents one of the most important marker genes.30,32 We have investigated whether the mRNA of a ferroptosis promotor, PTGS2, and the transferrin receptor gene, TFRC, can be detected in pretangles and nascent neuritic plaques.
Finally, we performed snRNAseq analyses to determine whether the ferroptosis tendency differs between AD and control and whether TfR is a suitable ferroptosis marker by comparing gene expression of common ferroptosis markers, drivers and suppressors in individuals affected and not affected by AD.
Methods
To detect expression of molecular ferroptosis markers in AD brains, we performed immunohistochemistry and immunofluorescence with anti-TfR antibodies and anti-ferritin antibodies. Special attention was paid to the co-localization of these signals with p-tau + structures. Furthermore, to detect ferroptosis at transcriptomic level, we performed in situ hybridization and snRNAseq analyses with typical ferroptosis related genes.
Subjects and case selection
The investigations were performed on postmortem human brain tissue from the Institute of Neuropathology and from the brain bank of the Institute of Anatomy at Leipzig University. All donors signed a written declaration of consent for this purpose, whereby the use of human tissues for scientific purposes is approved by the Ethics Committee of the University of Leipzig (registration number: 129-21 ek). Twenty cases with a low NFT stage ≤ I and 20 cases with a high NFT stage ≥ IV were used (Supplemental Table 1). NFT staging was performed as described by Braak et al. 33 The age range of the donors was from 46 to 93 years. We focused our research on the prefrontal cortex (PFC) because material of this brain region was sufficiently available from all cases. In three cases (41, 42, 43), we also analyzed TfR expression in the hippocampal region. In addition, we used hippocampal and prefrontal brain slices from three children, which were either stillborn or a few weeks old, to investigate expression of ferritin and TfR (Supplemental Table 1). Furthermore, we used liver sections from the Leipzig body donation bank as a positive control for TfR since this receptor is known to be expressed in hepatocytes. 34 Exclusion criteria for case selection were a postmortem delay (PMD) of more than 48 h, cerebral hemorrhage, brain tumors, and ischemia as a cause of death because of the possible impairment of brain iron metabolism.
Sample preparation and fixation
After removal the human tissue material was fixed in 4% phosphate-buffered formaldehyde. Tissue samples were dehydrated, embedded in paraffin and cut into 10–12 μm thick sections. We also used fresh-frozen material, which after removal was embedded in Tissue-Tek (Tissue- Tek® O.C.T.™ Compound
Immunohistochemistry (IHC)
Brain sections were deparaffinized and antigen retrieval was performed in citrate buffer at pH 6 for 20 min in the microwave at 95°C. After cooling and washing the sections in 0.02 M phosphate-buffered saline (PBS) pH7.4, endogenous peroxidase was blocked with H2O2 in PBS for 30 min at room temperature (RT). The sections were washed with PBS and a barrier created with Dako Pen (ScienceServices). After washing with PBS containing 0.3%Triton TX-100 (PBS-T), blocking was performed with normal goat serum (NGS, Jackson Cat# 005-000-121) diluted 1:20 in PBS-T for 2 h at RT. Sections were incubated overnight at 4°C with the respective primary antibodies diluted in PBS-T with 1% NGS. Anti-TfR1 3F3 FMA, CD71 3B8 2A, TfR H68.4 and anti-TfR, anti-ferritin (rb) (Supplemental Table 2). Negative controls were kept overnight without primary antibodies in blocking solution. The next day, after washing with PBS-T, sections were incubated with the respective biotinylated secondary antibodies for 2 h at RT using goat anti-mouse and goat anti-rabbit IgG antibodies diluted in PBS-T with 2% human serum (HS). After washing again in PBS-T, sections were incubated with ExtrAvidin peroxidase (Sigma, E2886) at a dilution of 1:200 in PBS-T for 1 h at RT. To visualize the antibody signals in brown/black, DAB H2O2 (Sigma, D-4418) or Vector substrate (Vector, Cat# SK-4700) was used. In single-stained preparations selected sections were counterstained with Mayer's hemalum for 30 s.
For double staining, incubation with the second primary antibodies was performed sequentially overnight at 4°C. Antibodies directed against Factor VIII, AT8, anti-β-amyloid, MBP, MOG and anti-ferritin (rb) were employed. Biotinylated secondary antibodies were applied and binding sites were visualized with Vector substrate or DAB H2O2. Selective sections were counterstained. Sections were dehydrated in ascending alcohols, placed in xylene and cover slipped with Histokitt (Roth).
Immunofluorescence (IF)
Sections were deparaffinized, antigen retrieval was performed by microwave treatment and sections encircled with the Dako-Pen. For staining of neurofilament proteins we used fresh frozen sections that were equilibrated to RT, washed in PBS and fixed with 100% EtOH for 20 s. After washing in PBS-T, all sections were blocked with NGS diluted 1:20 in PBS-T and subsequently incubated overnight at 4°C with the primary antibodies: anti-ferritin (rb), anti-ferritin (gt), anti-TfR, AT8, anti-GFAP, anti-Iba1, anti-MHCII, anti-NeuN, anti-MAP2, anti-neurofilament 68 kDa (NFL), anti-NFM, anti-NFH and anti-β-amyloid in PBS-T with 1% NGS. On day two, after washing in PBS-T, incubation with the appropriate secondary antibodies: goat anti-rabbit-AF568, goat anti-mouse-AF488, goat anti-guinea pig-AF488 diluted 1:200 in PBS-T with 2% HS for 2 h at RT was performed. For triple staining, the sections were first incubated with anti-TfR and AT8 with the secondary antibodies goat anti-rabbit-AF568 and goat anti-mouse-AF647. This was followed by incubation with anti-β-amyloid, biotin-goat anti-mouse IgG2a and FITC-Avidin. After several washing steps nuclear staining with DAPI for 12 min followed. Finally, auto-fluorescence was blocked with True Black (Biotium, Cat#23007) for 15 s. All sections were cover slipped with Dako Fluorescence Mounting Medium (Dako, Cat#C0563).
Fluorescence in situ hybridization (FISH)
FISH was performed with the Multiplex Fluorescent Reagent Kit v2 (Advanced Cell Diagnostic (ACD), Berlin Germany) using hippocampal brain slices of one case with NFT stage II and one with NFT stage IV from the brain bank of the Anatomy Institute Leipzig, which were fixed in 4% buffered formaldehyde for 24 h only and were paraffin embedded. Here, we combined the probe of the PTGS2 gene/TFRC gene with RBFOX3 and performed immunofluorescence staining with AT8.
Sections were first baked at 60°C for 1 h, followed by deparaffinization and antigen retrieval. Following the kit instructions, a sample was prepared with 1:50 diluted TFRC (ACD, Cat# 437351)/PTGS2 (ACD, Cat# 406801) and RBFOX3 (ACD, Cat# 415591-C3) and the sections were incubated for 2 h at 40°C in a manual HybEZ™ II assay hybridization system (ACD). After 3 amplification steps, the combination with the corresponding opals at dilution 1:750 followed. PTGS2/TFRC was coupled with Opal 570 (ACD, Cat# OP-001003) and RBFOX3 with Opal 690 (ACD, Cat# OP-001006). Between each step the slices were washed with wash buffer. This was followed by immunofluorescence staining in which AT8 was coupled with goat anti-mouse-AF488 as described above.
Image acquisition and analysis
Images of the IHC stainings were taken with the Olympus photomicroscope using OM Capture software version 3.0. Images of IF stainings were taken with Olympus BX 40 epifluorescence and Cell Sens standard 1.18 software. LSM 700 confocal laser scanning microscopy was used to acquire FISH images.
For analysis whole slide brightfield images of IHC staining were acquired using a digital slide scanner (Pannoramic Scan II, 3D HISTECH Ltd, Budapest, Hungary) at 20x magnification. Data sets were examined and manually cropped to relevant image regions using CaseViewer (Version 2.3, 3D HISTECH Ldt., Budapest, Hungary). Resulting images were imported into QuPath (Version 0.4.3) 35 and analyzed with the StarDist plugin (Version 0.4). 36 Tissue detection of anti-ferritin (rb) and anti-TfR stained images was performed by applying a simple thresholder at full resolution (2500 µm2 minimum hole area).
Within the tissue area of the ferritin-stained images a pixel classifier trained on ferritin-positive structures was applied. Classification results underwent manual inspection and regions with insufficient segmentation quality due to staining artifacts, folded or overlapping tissue and out-of-focus tissue areas were omitted from further analysis. Finally, the percentage of ferritin-positive area within the remaining tissue area was calculated.
Within the tissue area of the anti-TfR stained images a two-step process for the detection of dot-like TfR-positive structures was employed to exclude false positive findings from further analysis. In a first run, endothelia stained by the anti-FVIII antibody in brown were detected using a simple thresholder for brown intensities (DAB channel in QuPath) and performing a cell detection with StarDist for other structures (mainly endothelium) with modified parameters (threshold = 0.0005; pixel size = 2.0). Resulting detection areas were merged and dilated by 1 µm. Subsequently, TfR-positive structures were detected with StarDist and another set of parameters (preprocessing with a 2pixel wide median filter; threshold = 0.6; pixel size = 0.085). Due to the variability of staining quality (TfR-signal color ranged from blue/purple to brown) and different tissue characteristics (light refraction, visual “granularity”) depending on the fixation time an appropriate detection correction had to be implemented. Objects were excluded based on the following criteria: (1) area size > 7 µm2, (2) blue intensity median < 0.165, (3) blue intensity deviation > brown intensity deviation and (4) blue intensity max < brown intensity max. Finally, the large structure detection areas from the previous step were subtracted from the remaining signal detections and the percentage of final TfR-positive area within the tissue area was calculated.
Using CaseViewer, the number of cells stained by anti-TfR and the TfR-positive accumulations was counted manually and respective densities were calculated based on the relevant tissue area.
Whole slide fluorescence images were acquired using a digital slide scanner (Zeiss Axioscan 7, Carl Zeiss Microscopy GmbH, Jena, Germany) at 20x magnification (red channel: anti-ferritin or anti-TfR, respectively; green channel: AT8; blue channel: DAPI). Data sets were examined and center positions of AT8-positive DD were manually marked using the microscope software ZEN (Version 3.7, Carl Zeiss Microscopy GmbH, Jena, Germany).
Marker coordinates were imported into Mathematica (Version 12.2, Wolfram Research Inc., Champaign, IL, USA) and 401 × 401 pixel (about 140 × 140 µm) wide image sections centered around the marker coordinates were exported using CZIcmd. 37 These images were imported into Mathematica, split into the corresponding color channels and submitted to segmentation.
AT8-positive DD (green channel), TfR-positive structures (red channel) and nuclei (blue channel) were detected by local adaptive segmentation (25-pixel window width).
Local DD boundaries were defined by multiplication and subsequent thresholding (Otsu's method) 38 of the detected DD with a 75-pixel wide Gaussian filter. Within these boundaries the number of DD with and without TfR-positive signals was counted.
Single nucleus RNA sequencing (snRNAseq) analyses
For the snRNAseq analyses, we chose a total of three publicly available datasets that applied snRNAseq with the 10x Genomics platform to healthy and AD-affected human postmortem brain samples.
Respective to our own analyses using either FISH or IHC/IF, we chose to include data from the entorhinal and the prefrontal cortex. We additionally included a dataset of the prefrontal cortex that consists of aged-dependent data. The raw datasets were downloaded from the National Center for Biotechnology Information Gene Expression Omnibus (data accessible at NCBI GEO database, accession GSE138852, 39 GSE174367, 40 GSE129308, 41 for the age-dependent dataset accession GSE168408 42 ) and imported into the Python runtime using the Scanpy package version 0.1.0. We applied preprocessing to all datasets and manually assigned cell-type annotations to UMAP partitions using canonical marker genes. We classified oligodendrocytes with MOBP and MOG, astrocytes with AQP4, GFAP, and SLC1A2, oligodendrocyte precursor cells with VCAN, PDGFRA, and OLIG1, microglia with APBB1IP and ITGAM, inhibitory neurons with SYT1 and GAD1, excitatory neurons with SYT1 and SLC17A7, pericytes with PDGFRB, epithelial cells with HTR2C, endothelial cells with FLT1 and PECAM1, mesenchymal cells with COL1A1, lymphocytes with CD96 and monocytes/macrophages with CD163. We chose this method instead of taking over the authors assignments to ensure a better similarity of cell-type specific groups across the datasets. All plots were created using either seaborn 0.13.1 and Matplotlib 3.8.2 or Bokeh 2.4.3.
Age dependent data
For the Herring et al. 42 dataset, we mapped the normalized TFRC expression values according to their age for each cell type on a line plot and measured the linear correlation of the TFRC expression over time by calculating Pearson's correlation coefficients with SciPy 1.12.0.
Gene set enrichment analysis (GSEA)
Differential gene expression analyses were carried out with Scanpy's rank_genes_groups function using the Wilcoxon test between either conditional groups (AD versus control) or groups that were created based on TFRC gene expression (TFRC Z-score < 0 versus TFRC Z-score > 1). The genes were considered to be differentially expressed if they had an absolute log fold change greater than 0.25 and a p value less than 0.05.
GSEApy 1.1.1 was used to perform gene set and gene set enrichment analysis. For gene set analysis, we carried out the hypergeometric enrichment test using GSEApy's enrichr function and the GO Biological Process 2018 dataset. For gene set enrichment analysis, we first filtered for genes expressed in at least 30 cells and then used GSEApy's prerank function and the KEGG_2021_HUMAN gene set to determine relevant enriched KEGG pathways (Supplemental Figure 1).
Gene set variation analysis (GSVA)
For evaluating ferroptosis driver/suppressor/marker enrichment scores in individual pseudobulk groups, we downloaded each dataset from the FerrDB V2 website 30 and then filtered the candidate genes by only including genes of a certain confidence level (marked as “validated”) and genes that were tested in humans. We were left with 207 ferroptosis driver, 203 ferroptosis suppressor and 3 ferroptosis marker genes and removed TFRC as this was our gene of interest.
We then subdivided excitatory and inhibitory neurons in each dataset and performed pseudobulking (at least 10 cells, at least 100 counts) of these clusters for individual samples and condition groups (depending on TFRC expression). For evaluating the possibility of TFRC being a specific marker gene for any of the examined ferroptosis gene sets, we used different TFRC expression groups: TFRC baseline expression, TFRC Z-Score > 1, TFRC Z-Score > 2, TFRC Z-Score > 4. These bulk groups were then mapped with the ferroptosis gene sets and GSVA was performed for each gene set, condition group and individual (respectively, every bulk group). The calculated scores were imported to GraphPad Prism and compared according to the relevant comparing algorithm (TFRC high versus low expression, AD/NFT versus control) (Supplemental Figure 1).
Statistical analyses
Statistical analysis of parameters from image processing was performed using Mathematica. Descriptive statistics were calculated and bar charts, boxplots as well as scatter plots were generated. Data were tested for normal distribution using Shapiro-Wilk test and Kolmogorov-Smirnov test, respectively. Group comparisons were tested using the Mann-Whitney-U test. Correlation analysis was performed using Spearman rank correlation. Level of significance for all tests was set at p < 0.05.
For the snRNAseq analyses we either performed two-way ANOVA between multiple condition groups or Mann-Whitney U test to compare between two condition groups with a significance level of p < 0.05.
Results
As we hypothesized that DD is a form of ferroptosis, we first looked for ferroptosis markers (TfR and ferritin) and ferroptosis genes in NFT-staged brains.
TfR expression on neuronal structures displays typical features of DD
To detect TfR as a potential molecular marker of ferroptosis in the AD brain, we first tested monoclonal mouse antibodies of different clones against TfR1/CD71, i.e., [3F3 FMA], [3B8 2A1], and [H68.4] as well as a polyclonal rabbit antibody, anti-TfR, which all should bind TfR1. In our hands, the mouse monoclonal antibodies showed no signals on fresh frozen, fixed cryostat and paraffin-embedded human brain tissues except for faint endothelial staining, as has been reported. 43 The rabbit polyclonal anti-TfR showed membrane-bound signals not only at the endothelium, but also revealed beaded neurites in grey and white matter in IF (Figure 1) and IHC (Figure 2). Hepatocytes which are known to express TfR 34 served as positive controls (Figure 2(h)).

Fluorescence staining with anti-TfR. Fresh frozen sections of human prefrontal cortex stained with anti-TfR in red and cell nuclei with DAPI in blue. The endothelium (*) and a beaded neuritic process (arrow) are stained (a). Beaded neuritic processes surrounding a cell nucleus can be seen (b, arrowhead). Scale bar = 20 μm.

Comparison of AT8 and TfR immunostaining. (a, b) Paffin sections of human hippocampus show AT8-positive DD. (c-g) Paraffin-sections of human prefrontal cortex stained with anti-TfR in black. Beaded TfR-positive neurites resemble DD in (c, d). Cell bodies connected to beaded processes are visible in (e, f). Beaded neuritic processes of different lengths are shown in (g). (h) Paraffin-section of human liver stained with anti-TfR serves as a positive control. TfR signals can be seen in hepatocytes and on their membrane. (h*) omission control. Scale bar = 20 μm.
We detected a striking morphological similarity between droplet degeneration spheres positive for AT8 (Figure 2(a), (b)) and TfR staining patterns (TfR accumulations) occasionally observed in PFC and hippocampus (Figure 2(c), (d)). In addition, TfR-positive cells with stained soma and fragmented processes suggestive of degeneration (Figure 2(e)-(g)) were present. To identify these TfR-positive cell types, we performed IHC and IF double staining with antibodies against neuronal markers such as NeuN, MAP2, Neurofilament 68 kDa (NFL), NFM and NFH, astrocyte marker GFAP, oligodendrocyte markers such as MOG and MBP and microglia markers such as Iba1 and MHCII. Since the antibodies against different neurofilaments and MAP2 were not suitable for paraffin-embedded tissues, fresh-frozen material was used.
We found co-localization of TfR-positive neuronal spheres with neurofilament markers NFM (Figure 3(a), (b)) and NFL (Figure 3(c)). TfR signals surrounded NFL-stained neurofilaments in cross section (Figure 3(c)), suggesting that the signals are membrane-bound and located on the surface of neurites. This location would be expected from TfR as a transmembrane glycoprotein.44,45 However, it must be noted that the resolution of this staining makes it difficult to distinguish between internal labeling and the cell surface. TfR signals were not co-localized with GFAP, Iba1, MAP2, MBP, MOG, and MHC II and no direct overlap of TfR-positive cells with NeuN was seen (Supplemental Figure 2). We conclude that TfR is not only present in endothelial cells 46 but also in neurites and a population of degenerating neurons as observed in AT8-labeled sections.

Comparison of TfR and neurofilament immunostaining. Fresh frozen human prefrontal cortex stained with anti-TfR in red, anti-NFL or NFM proteins in green, and nuclei with DAPI in blue. Co-localization of TfR-positive structures with NFM (a, b) and NFL (c) can be seen. In (c) cross sectioned neurofilaments (positive for NFL) co-localize with TfR-positive beads (arrows).
mRNA of signature genes of ferroptosis are detected in pretangles and p-tau negative neurons, but less in DD
To investigate whether typical marker genes of ferroptosis are detectable in p-tau + structures, we performed FISH using probes of TFRC and PTGS2 as ferroptosis marker genes and RBFOX3 to identify neurons. FISH was followed by IF staining using AT8 antibody to visualize AD pathologies. Here we examined one case with NFT stage IV and one with NFT stage II and analyzed the FISH quantitatively. Signals from both probes clearly occurred in the endothelium, consistent with analyses of the human protein atlas. 46 Outside the endothelium, PTGS2 and TFRC were present in cells including neurons in or around cell nuclei. More signals of the TFRC probe were detectable compared to PTGS2 in both cases. We could not detect a clear quantitative difference of TFRC and PTGS2 between both NFT stages but were able to detect PTGS2 and TFRC in pretangles, in p-tau negative neurons located in the vicinity of p-tau + structures and less in DD (Figure 4).

FISH with probes for ferroptosis related genes. Paraffin sections of human hippocampus were hybridized with PTGS2 (a-c)/TFRC (d-e) in red and RBFOX3 in white, stained with AT8 in green and DAPI in blue for nuclear staining. Signals of the mRNA of PTGS2 (circle in b, c) and TFRC (circles in d) can be seen in pretangles, but less in DD (a, e). There is also mRNA of the PTGS2 and TFRC gene in neurons around p-tau + structures (arrows in a, d, e). Scale bar = 20 μm.
GSEA reveals downregulation of pathways involved in fatty acid metabolism in AD
To explore a tendency to ferroptosis in individuals affected and not affected by AD, we compared the gene expression of common ferroptosis markers, drivers and suppressors by visualizing the cumulative gene expression scores for each individual cell cluster. This comparison revealed only minor differences in the mean expression values of the genes of interest, with slightly higher mean expression of all genes in the low NFT stages. It is noteworthy that specific ferroptosis markers like GPX4, PTGS2 and TFRC showed an enrichment in both excitatory and inhibitory neurons, but gene expression did not differ between the AD-affected and AD-unaffected individuals (Figure 5(a)).
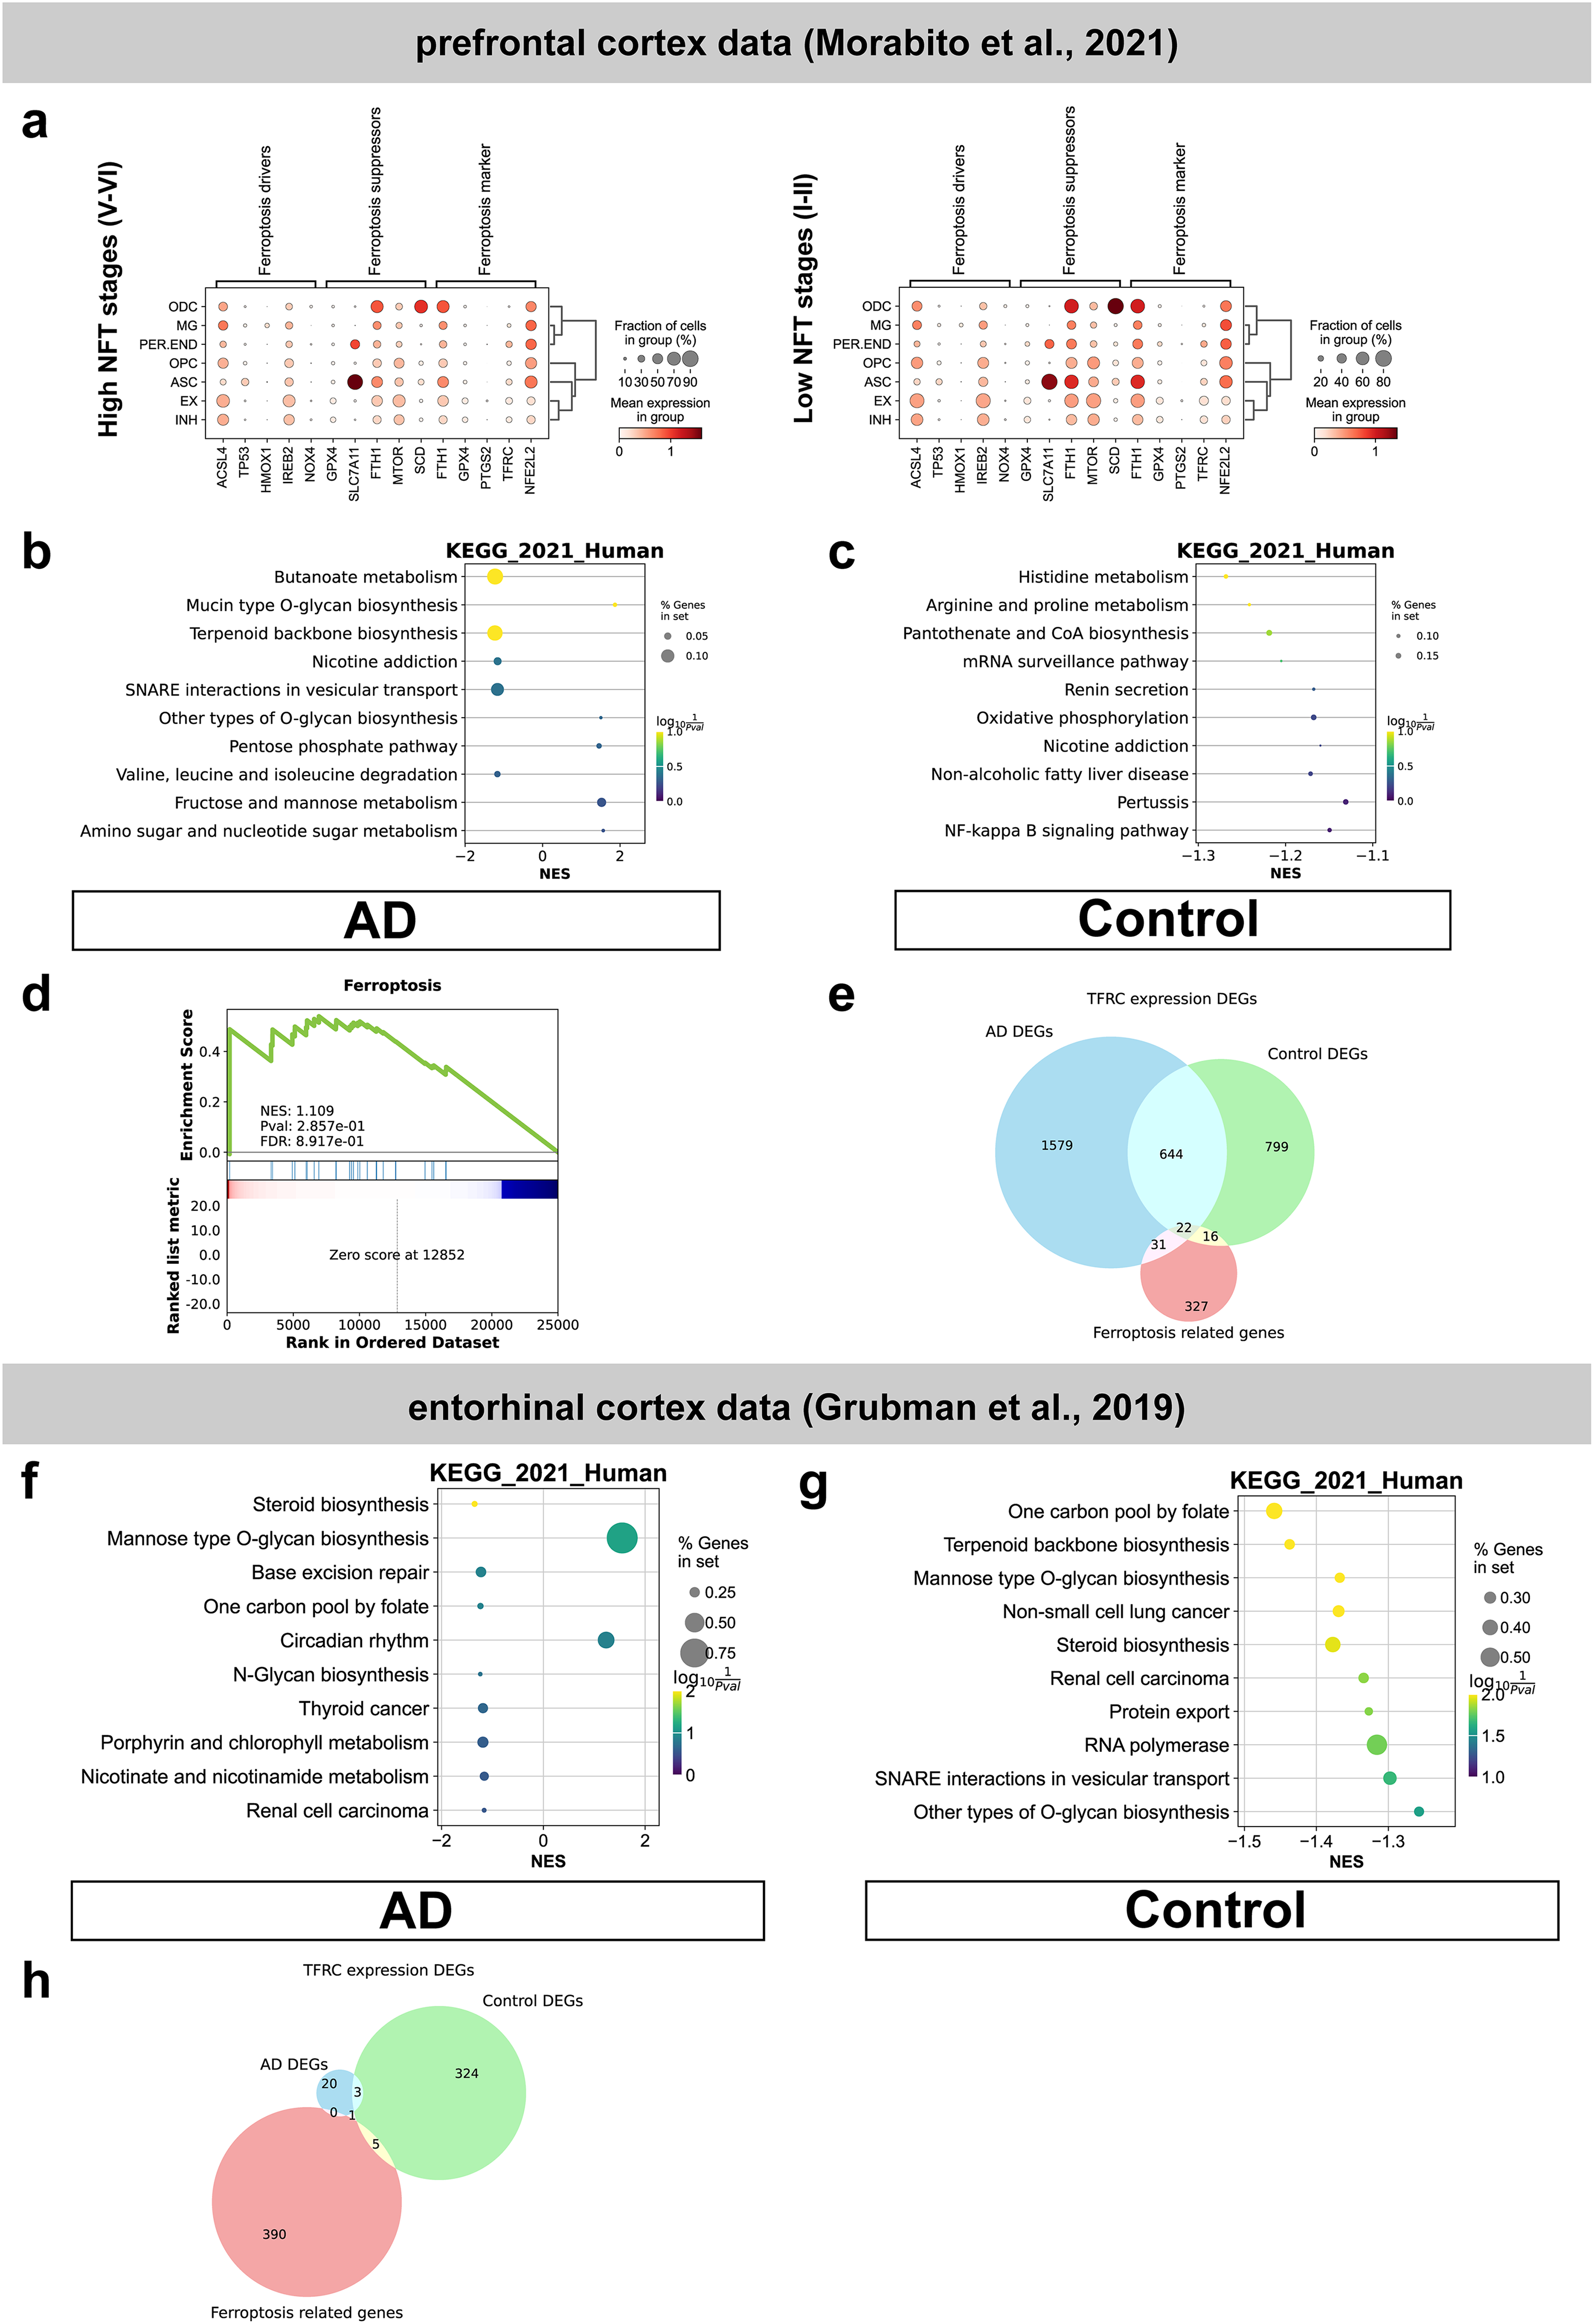
Differential gene expression and gene set enrichment analysis for TFRC expressing neurons. To explore a tendency to ferroptosis in individuals affected and not affected by AD, we compared the gene expression of common ferroptosis markers, drivers and suppressors by visualizing the cumulative gene expression scores for each individual cell cluster (a). Differential gene expression analysis was performed with two snRNAseq datasets between TFRC expressing neurons (TFRC expression higher than 1 standard deviation of mean TFRC expression) and TFRC non-expressing neurons (TFRC expression lower than mean expression) in the AD and control group (b, c, f, g). Venn diagrams of the DEGs and ferroptosis related genes showed partial overlaps, indicating the presence of ferroptosis related genes in the DEG groups (e, h). Further GSEA of the DEG list showed certain ferroptosis associated pathways to be either up- or downregulated in the TFRC expressing cells in both the AD and the control group. The major pathways identified were terpenoid backbone synthesis, O-glycan biosynthesis and butyrate metabolism. Specific GSEA of the ferroptosis pathway in the DEG list of TFRC expressing neurons of the high NFT stages showed overrepresentation of ferroptosis related genes (d). It is to note that this GSEA did not reach significancy (p = 0.2857). (ODC: oligodendrocytes; MG: microglia; PER.END: pericytes, endothelial cells; OPC: oligodendrocytes precursor cells; ASC: astrocytes; EX: excitatory neurons; INH: inhibitory neurons).
We then investigated differentially expressed genes (DEGs) in TFRC expressing neurons (TFRC expression higher than 1 standard deviation of mean TFRC expression) and TFRC non-expressing neurons (TFRC expression lower than mean expression). Differential gene expression analysis revealed a total of 329 to 2223 genes to be differentially expressed (p-value < 0.05), depending on the conditional group and used dataset.
By performing TFRC DEG analysis, we found many genes of both the AD and control groups to be ferroptosis related (Figure 5(e), (h)). According to the data of Grubman et al. 39 there were less genes overlapping, because of the lower number of the AD DEGs (Figure 5(h)).
We did not find ferroptosis to be a significantly regulated pathway in either group or dataset. Nevertheless, for the high NFT stages of the prefrontal cortex neurons, we identified certain genes of the KEGG pathways that are part of the fatty acid metabolism (butanoate metabolism ↓, mucin type O-glycan biosynthesis ↑, terpenoid backbone synthesis ↓) and vesicular transport (↓). Interestingly, especially genes of pathways that are relevant for glycolysis were highly enriched (pentose phosphate pathway, fructose and mannose metabolism) (Figure 5(b)).
For the low NFT stages of the prefrontal cortex neurons, we only found negatively enriched genes of pathways, that are mainly part of anabolic cellular processes (histidine, arginine, proline metabolism, oxidative phosphorylation) (Figure 5(c)).
We additionally evaluated the ferroptosis pathway to point out a general overrepresentation of ferroptosis related genes. The enrichment plot shows a clear enrichment of ferroptosis in the present DEG list of the high NFT stages with a distinct peak in the beginning, indicating besides not being a significant pathway that TFRC expression might be accompanied by the expression of ferroptosis-related genes (Figure 5(d)).
We similarly carried out these analyses in the Grubman et al. 39 dataset (entorhinal cortex cells). GSEA results showed a similar picture in comparison to the pathways described above. In the AD group, pathways for vesicular transport were downregulated and pathways of fatty acid metabolism (mannose type O-glycan biosynthesis, terpenoid backbone synthesis, steroid biosynthesis) were downregulated as well (Figure 5(f)).
In the control group, we found comparable results with the exception of a high enrichment of O-glycan biosynthesis (Figure 5(g)).
GSVA indicated TFRC as an early marker of ferroptosis
The second part of our snRNAseq analyses focused on evaluating GSVA scores for ferroptosis markers, drivers and suppressors in different conditions, namely comparing TFRC high expressing neurons versus low expressing neurons and AD versus control/neurons affected by neurofibrillary tangle pathology versus control neurons.
In the dataset of Otero-Garcia et al. 41 consisting of neurons affected and unaffected by neurofibrillary tangle pathology, we found a significant difference in the GSVA scores of both ferroptosis markers (p = 0.0005) and suppressors (p = 0.007) between the AT8 and control group (Figure 6(a), (b)). Also, there was a significant difference in the ferroptosis marker GSVA scores between AT8 and MAP2 cells (p = 0.0012; Figure 6(a)). While there were no significant differences between the high and low groups when setting the cut-off value for TFRC high expression at Z-score > 2 (more than two standard deviations), we found a significant difference for ferroptosis drivers between the high and low groups for a Z-score > 4 (AT8: p = 0.0093; MAP2: p = 0.0217; Figure 6(c)). This indicates that only cells with very high TFRC expression are currently undergoing a shift towards ferroptosis, as ferroptosis driver genes are then enriched in these groups.
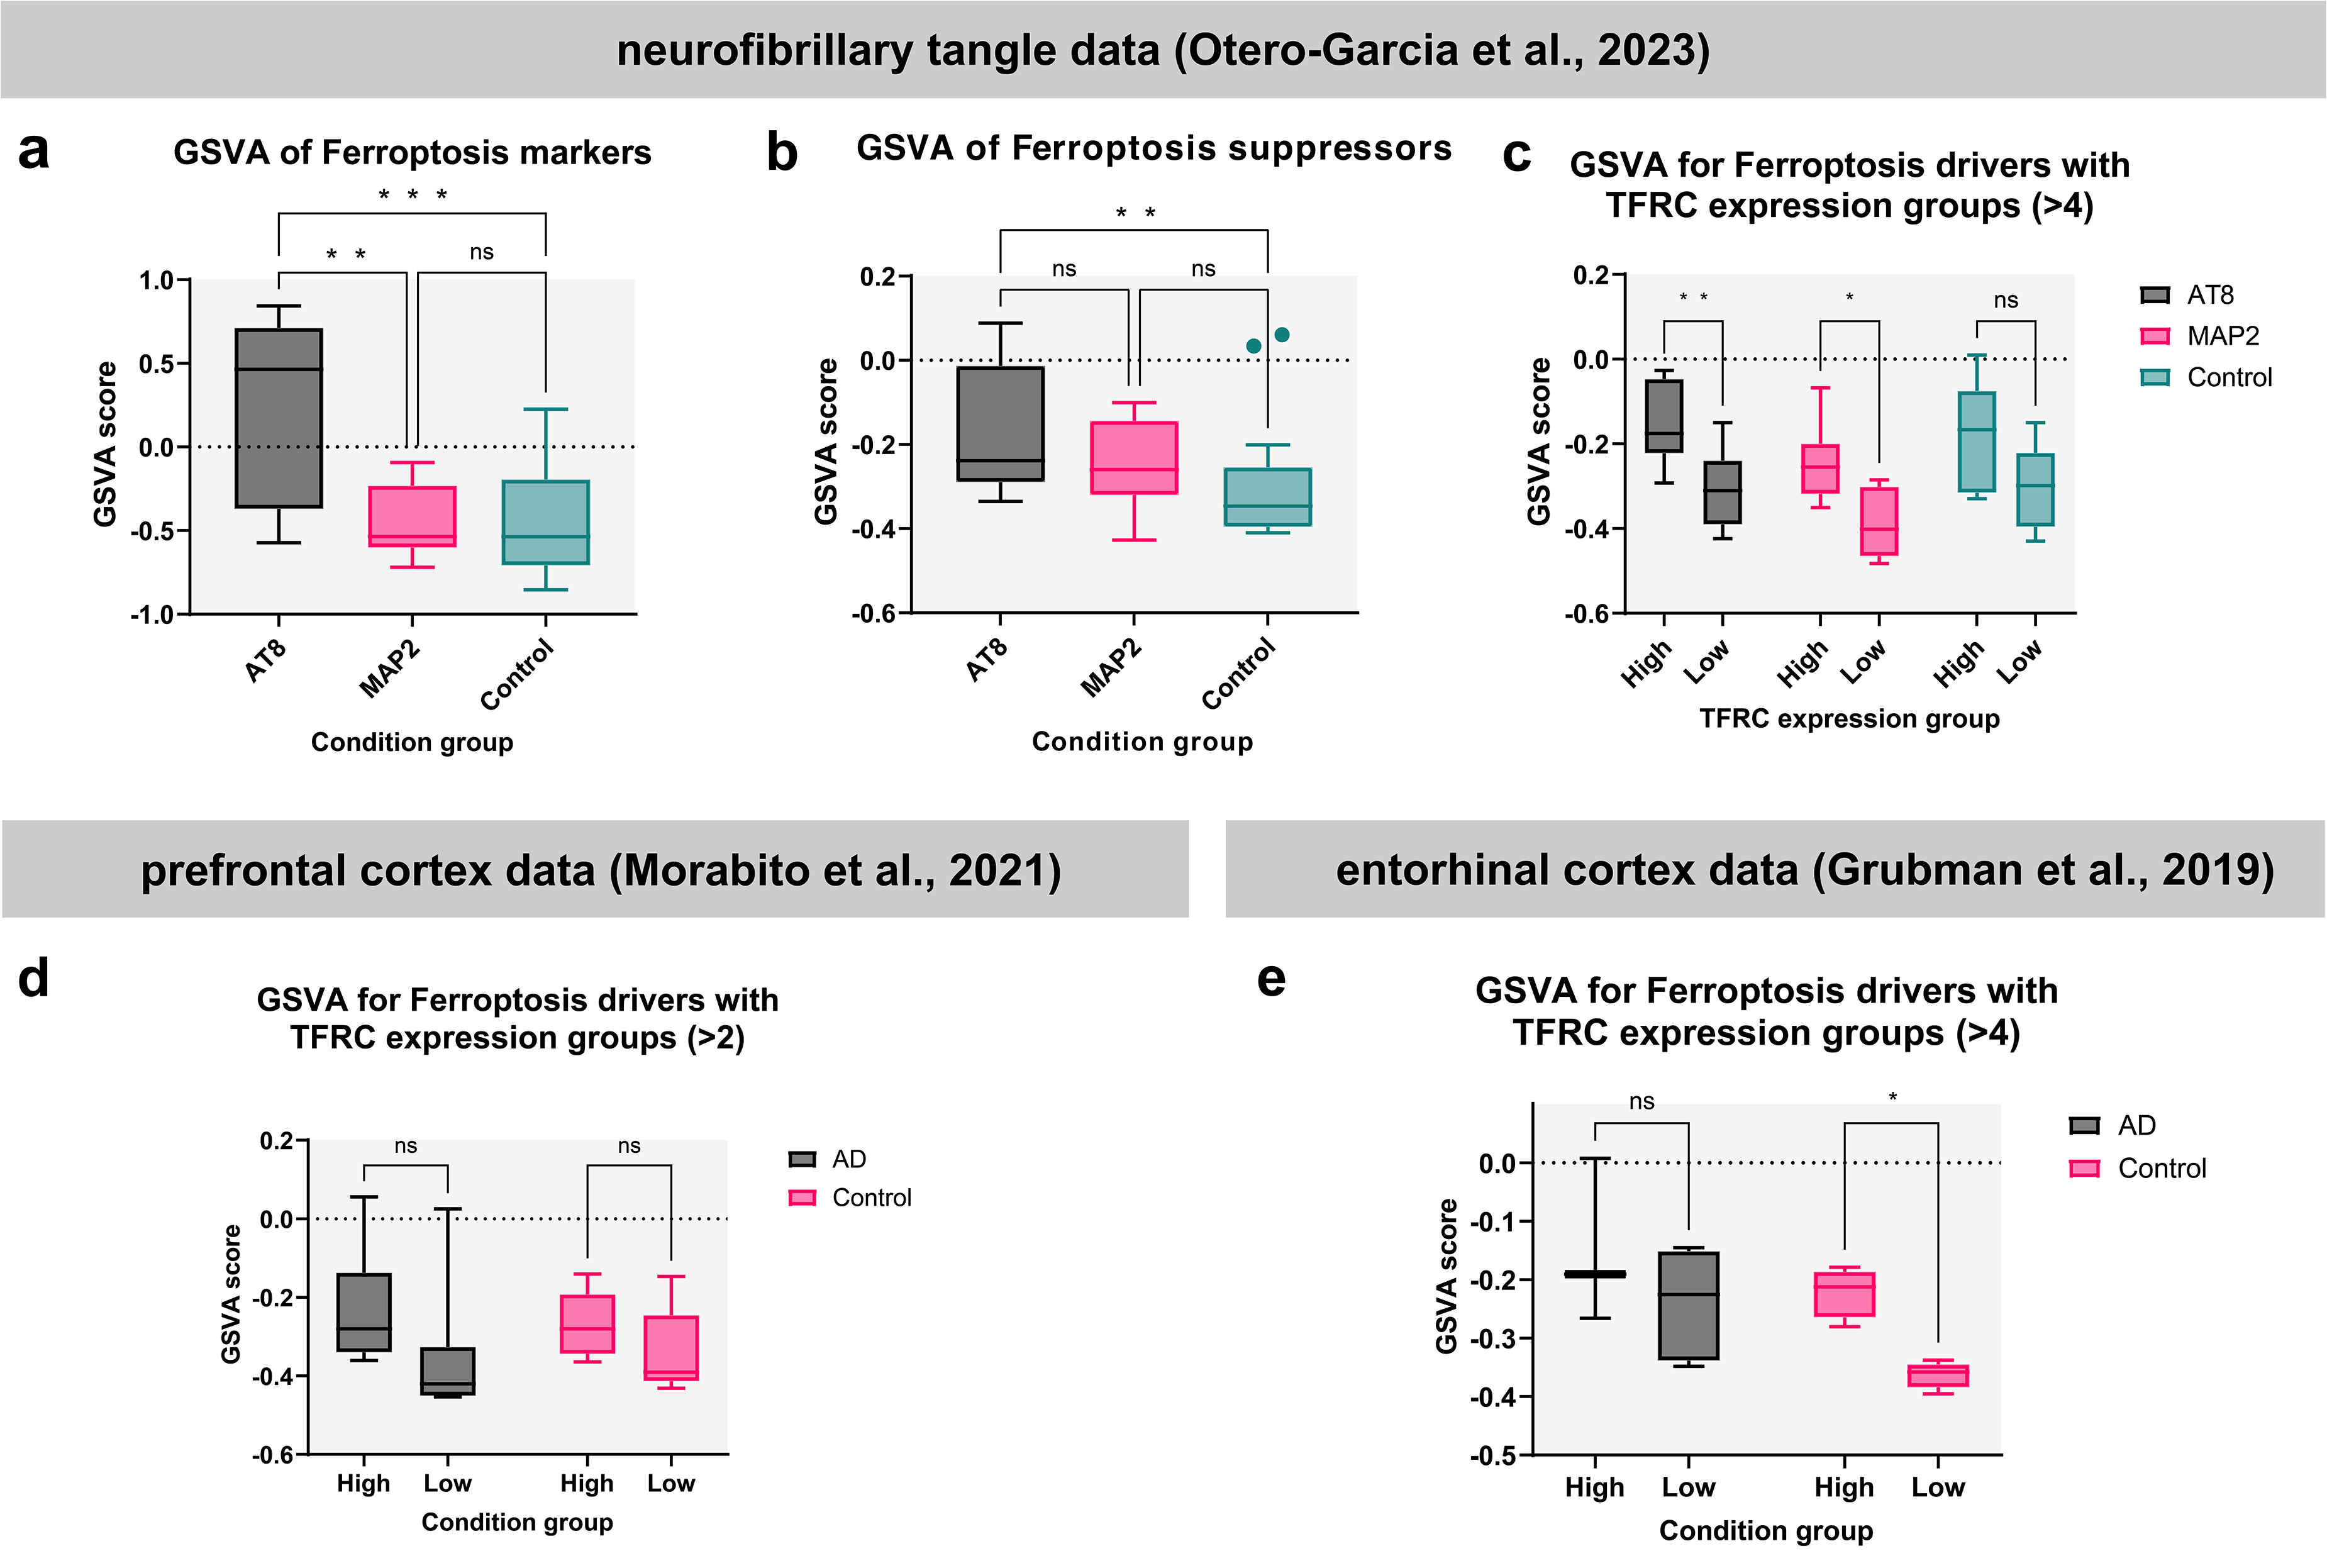
Gene set variation analysis for ferroptosis gene sets. We evaluated GSVA scores for ferroptosis markers, drivers and suppressors in different conditions, namely comparing TFRC high expressing neurons versus low expressing neurons, and AD versus control / neurons affected by neurofibrillary tangle pathology versus control neurons. In the Otero-Garcia et al. dataset significant differences in the GSVA scores of both ferroptosis markers (p = 0.0005) and suppressors (p = 0.007) between the AT8 and control group (a, b) and in the ferroptosis marker GSVA scores between AT8 and MAP2 cells (p = 0.0012) (a) were present. For ferroptosis drivers there were no significant differences between the high and low groups. When setting the cutoff value for TFRC high expression at Z-score > 4 (expression four standard deviations higher than mean expression), we found a significant difference between the high and low groups (AT8: p = 0.0093; MAP2: p = 0.0217) (c). The other two datasets showed similar results that did not reach significancy (d, e), except for the control group of the Grubman et al. dataset that showed a significant difference (p = 0.033) in the GSVA scores of ferroptosis drivers between the high and low group (e).
The above observations were relatively similar in the other two datasets. Although only reaching significance (p = 0.033) for the control group in the Grubman et al. 39 dataset, in the TFRC high expression groups, we were able to observe a difference in the GSVA scores of ferroptosis drivers between the high and low groups, which goes in line with the above findings (Figure 6(d), (e)). This indicates that TFRC might function as an early marker of ferroptosis that is that cells might co-express ferroptosis driver genes but have not yet reached the ongoing process of ferroptosis.
Direct co-localization between TfR- and p-tau + structures is a rare event
To investigate whether p-tau + structures express ferroptosis markers, we performed double staining with anti-TfR/anti-ferritin (rb) and AT8. We could not detect TfR (Figure 7(a)) or ferritin at pretangles. Direct co-localizations of TfR-positive structures and AT8-positive DD were rarely noted (Figure 7(b)). In a few cases, TfR signals were detected in the DD spheres of debris (Figure 8(a)). More often, an adjacency of the TfR signals to the DDs was observed (Figure 7(c)-(e); Figure 8(b)-(e)). In most cases, the DDs remained negative for TfR both within and in the vicinity (Figure 8(f)). To describe this quantitatively, we evaluated 44 DDs from four cases (case numbers 22, 24, 26 and 27), of which 17 (38.6%) were positive for TfR. A DD was considered positive for TfR, if TfR signals were detectable directly within the DD spheres of debris or directly outside in a defined distance from the DD center as described above. TfR-positive structures resembling DD, did not co-localize with p-tau in most, but not all cases. Neurons stained with the anti-TfR were also not p-tau + . In summary, TfR-positive structures often exist in the vicinity of AT8-positive DD.

Immunohistochemical double staining with anti-TfR and AT8. Paraffin sections of human prefrontal cortex double-stained with anti-TfR (black) and AT8 (brown). There is no TfR signal in pretangles (a). A rare direct overlap of TfR-positive structures and p-tau + DD can be seen in (b). More often there is adjacency of DD and TfR-positive structures (c-e). Scale bar = 20 μm.

Fluorescence staining with anti-TfR and AT8. Paraffin sections of human prefrontal cortex stained with anti-TfR in red, AT8 in green and cell nuclei with DAPI in blue. Beaded neuritic processes in DD can be seen (a), but more often there is adjacency of DD and TfR-positive structures (b-e). In most cases, DD spheres occur without TfR-positive structures (f). Scale bar = 10 μm.
Ferritin-positive microglia were usually present at sites of DD (Figure 9(a)-(c)), as described previously. 4 However, occasionally they were undetectable (Figure 9(d)).

Fluorescence staining with anti-ferritin and AT8. Paraffin sections of human prefrontal cortex stained with anti-ferritin in red and AT8 in green and cell nuclei with DAPI in blue. Ferritin-positive microglia in or around DD spheres can be seen (a-c). DD spheres occur rarely without ferritin-positive microglia (d). Scale bar = 10 μm.
IHC double staining with anti-TfR and anti-ß-amyloid antibodies showed that most amyloid deposits were negative for TfR signals. In some cases, beaded processes were seen in amyloid deposits (Figure 10(a)). To identify neuritic plaques, we performed IF triple staining with anti-ß-amyloid, AT8 and anti-TfR. Again, neuritic plaques remained negative for TfR in most instances. In Figure 10(b) a rare case with TfR signals in a neuritic plaque is shown.

Spatial correlation between Aß and TfR. (a) Paraffin sections of human prefrontal cortex stained with anti-Aß (black) and anti-TfR (brown). In some cases, beaded neuritic processes are seen in Aß plaques (circle). Scale bar = 20 μm (b) Paraffin sections of human prefrontal cortex stained with anti-TfR in red, AT8 in green, anti-Aβ in light blue and cell nuclei with DAPI in blue showing a neuritic plaque. Scale bar = 20 μm.
We investigated the spatial relationship between TfR and ferritin signals using IHC double staining with anti-TfR and anti-ferritin (rb). We found that these two antibodies stain different structures and a spatial proximity was not observed. Only rarely processes of ferritin-positive microglia contacted TfR-positive structures (Figure 11(a)-(c)). Furthermore, we investigated whether the expression of TfR and ferritin correlate in their levels and found only a modest correlation (r = 0.44, p = 0.005, Figure 11(d)).

Spatial and quantitative relationship between ferritin and TfR. (a-c) Paraffin sections of human prefrontal cortex stained with anti-TfR (brown) and anti-ferritin (black) showing the same image section in three different focal planes. Ferritin-positive microglia are in contact with TfR-positive structures. Scale bar = 20 μm (d) Correlation analysis of the amount of ferritin expression (Ferritin area ratio in %) and TfR expression (TfR area ratio in %) shows a modest correlation (r = 0.44, p = 0.005).
TfR and ferritin expression increases significantly with NFT stages
During our microscopic examinations we observed an increased TfR and ferritin staining pattern in high NFT stages. Consequently, we compared TfR and ferritin expression quantitatively in one group with NFT stage ≤ I (n = 20) and another with NFT stage ≥ IV (n = 20). To compare TfR expression levels, signals stained by anti-TfR were detected as a total TfR-positive area in relation to the total area evaluated (TfR area ratio in %). Because anti-TfR labels endothelium and neuronal structures, double staining was performed with anti-TfR and anti-FVIII antibody, an endothelial marker. Finally, signals of the endothelium labeled by anti-TfR and anti-FVIII were subtracted from the total anti-TfR signals in order to evaluate only TfR expression on neuronal structures.
A significantly (p = 0.007) higher TfR area ratio was found in the NFT stage ≥ IV-group compared to the NFT stage ≤ I-group (mean = 0.071 versus mean = 0.030; Figure 12(a), (b)). Since the anti-TfR antibody labels various structures such as beaded processes, as well as entire neurons (Figure 2(e), (f)), we counted these neurons in all cases (cell density). No clear difference in the cell density was found between the two groups (p = 0.797, Figure 12c, d). TfR-positive structures resembling DD (Figure 2(c), (d)) were also counted in all cases (accumulation density). They were significantly more frequently detected in high NFT stages (p < 0.001, Figure 12(e), (f)), which had a higher mean age than the low NFT stages (Figure 12(g)). To rule out an age dependency of the TfR area ratio, we performed a correlation study, resulting only in a modest (according to Akoglu, 2018) 47 correlation of r = 0.35 (p = 0.026, Figure 12(h)).
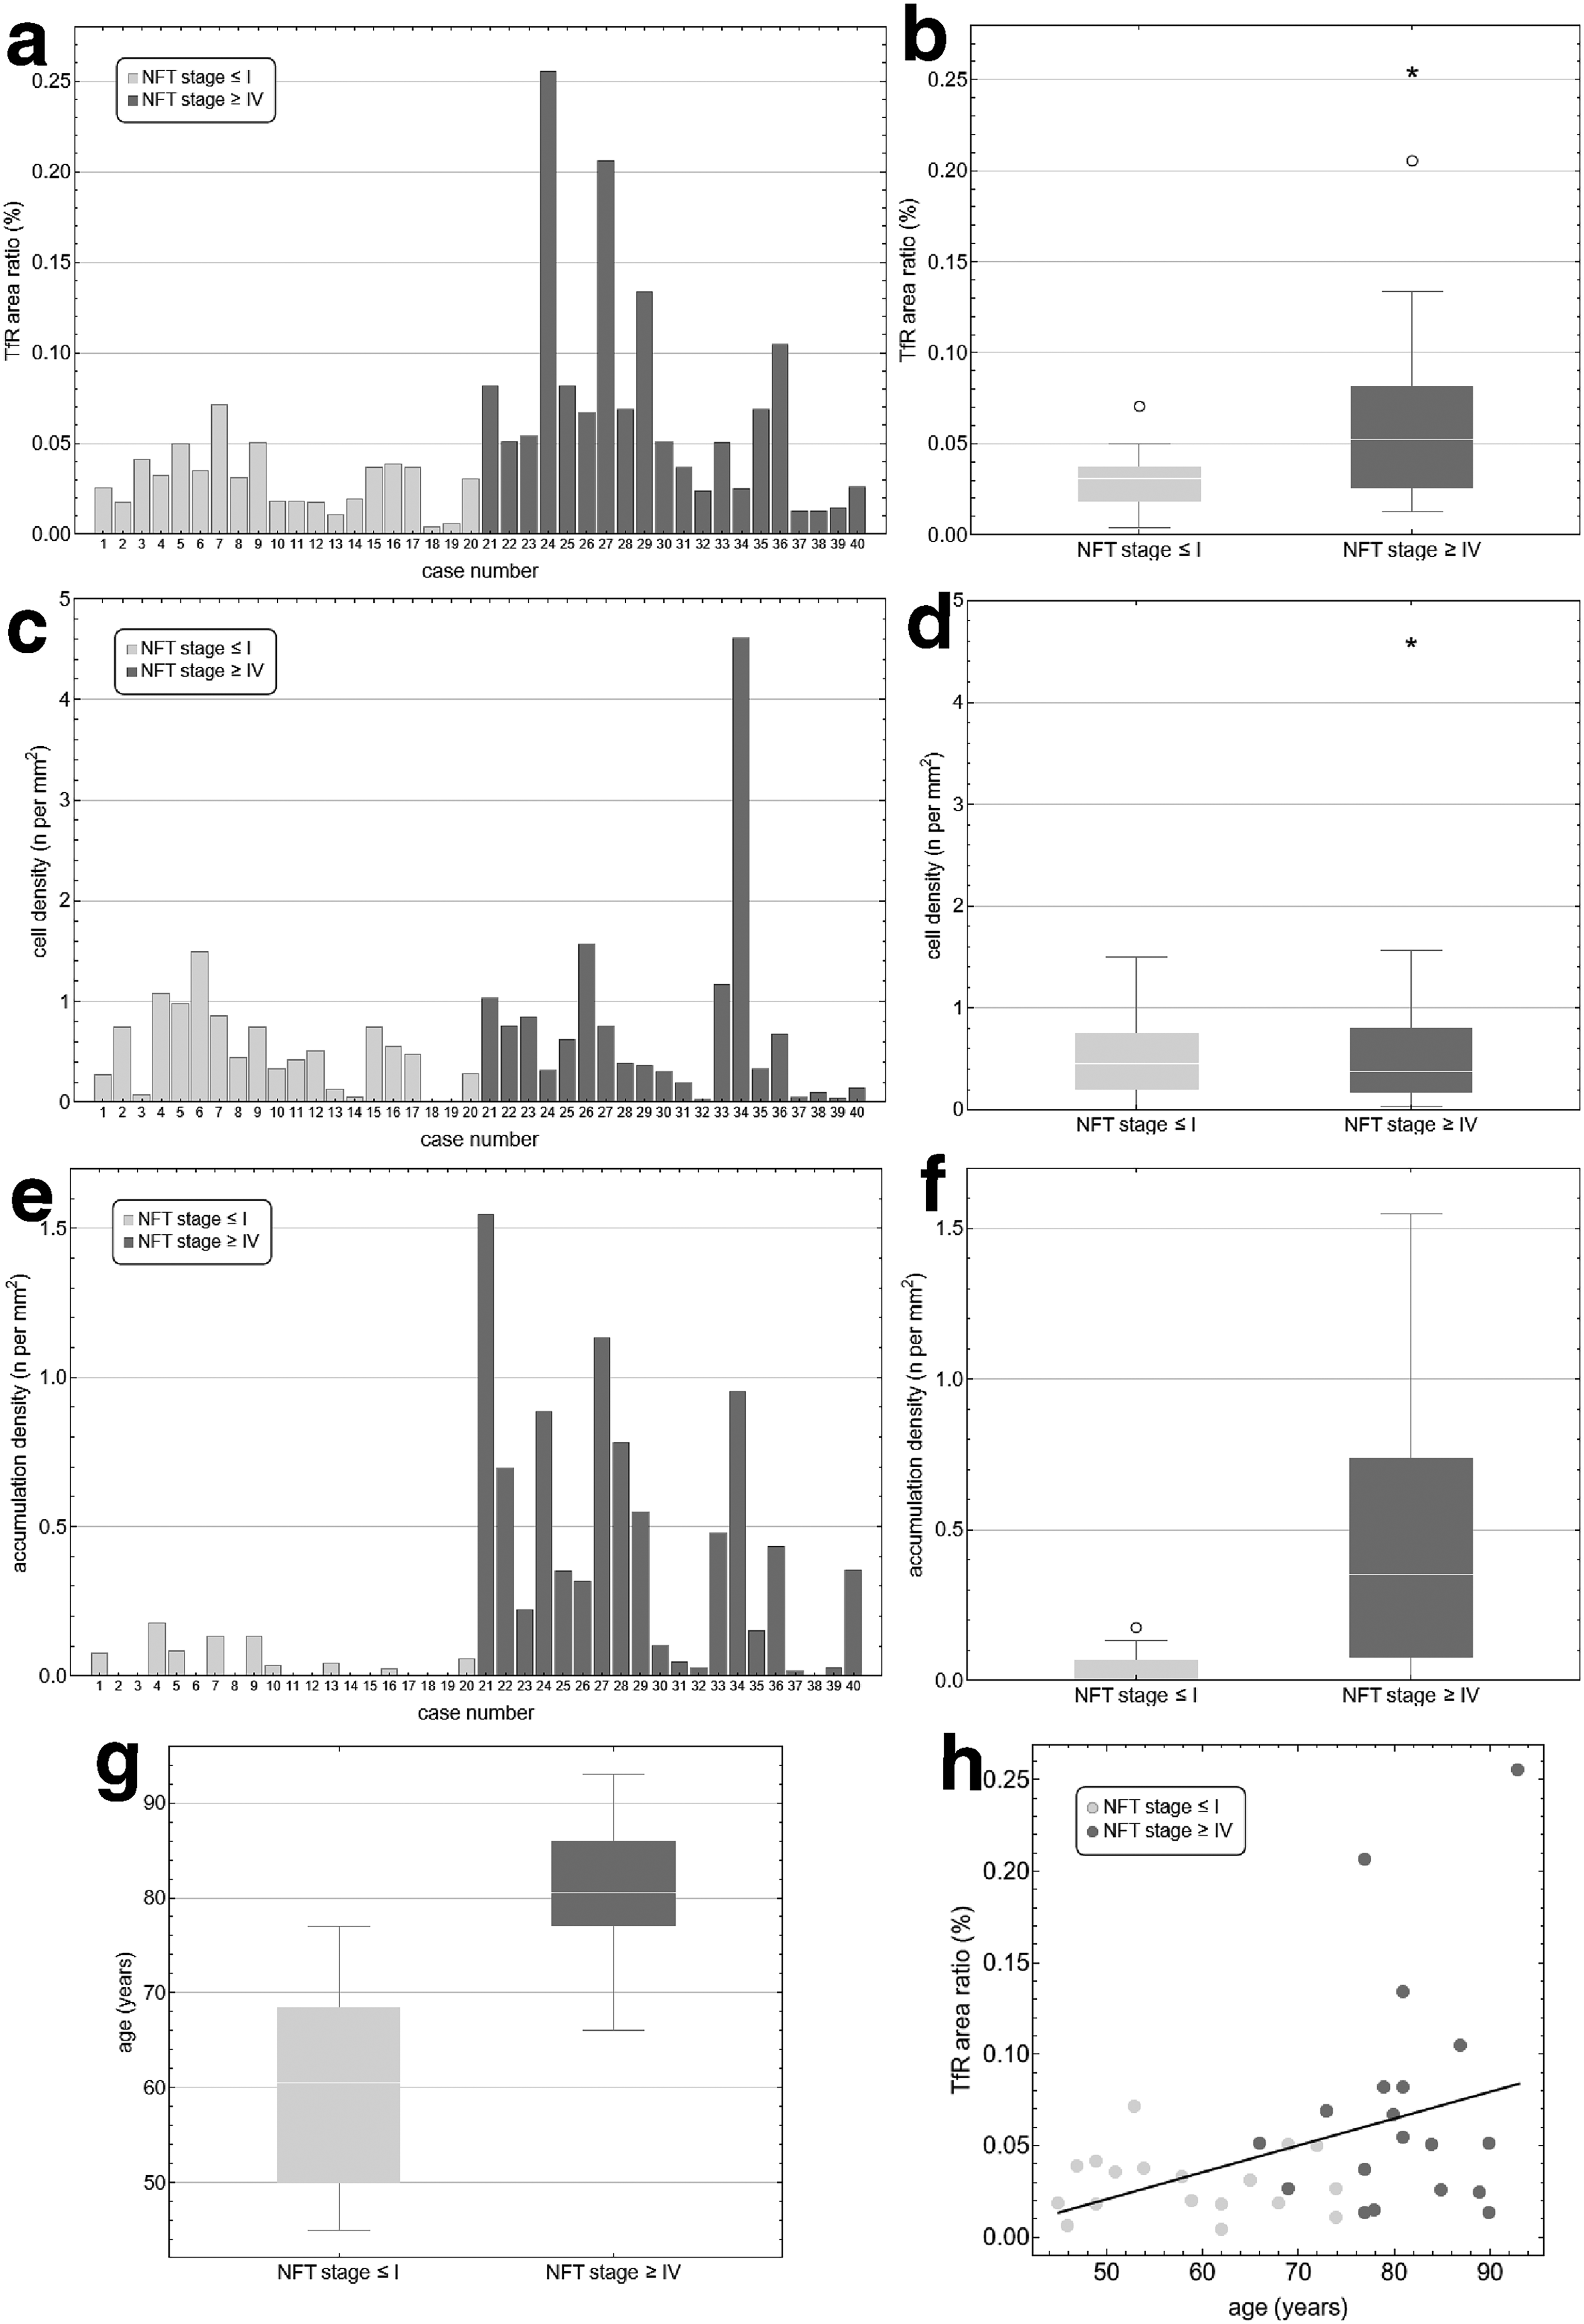
Measurements of TfR expression. The area of TfR-positive signals stained by the anti-TfR antibody is set in relation to the total area evaluated (TfR area ratio in %). In (a), TfR area ratios of all selected cases are shown in the histogram. In (b), comparison of TfR area ratio between one group with NFT stage ≤ I (light grey) and one with NFT stage ≥ IV (dark grey) is shown. There is a significant (p = 0.007) higher TfR area ratio in NFT stage ≥ IV, shown in a boxplot. In (c), a histogram of all cases with the total number of TfR-positive neurons (cell density) is shown. The boxplot in (d) shows no significant (p = 0797) difference of cell density in both groups. In (e), a histogram of all cases with the total number of TfR-positive accumulations (accumulation density) is shown. In (f), a significantly (p < 0.001) higher accumulation density in NFT stage ≥ IV is shown in a boxplot. In (g), the age difference between the two groups is shown in a boxplot. In (h), the correlation analysis between the age of the cases and the TfR area ratio is shown, with a modest correlation (r = 0.35, p = 0.026).
For comparison of ferritin expression in the two groups, we performed IHC single staining with a polyclonal anti-ferritin antibody which we have used in previous studies on microglia in AD.4,48,49 We detected the area of all ferritin-positive microglia relative to the total area of the evaluated section (ferritin area ratio in %). A significant higher (p = 0.001) ferritin expression was detected in the NFT stage ≥ IV-group compared to the NFT stage ≤ I-group (mean = 0.1033 versus mean = 0.22365, Figure 13(a), (b)). Again, the difference in age between the two groups had to be considered; therefore, we investigated whether there was an age dependency of ferritin expression with a correlation study. Here we could also find a modest correlation (r = 0.50, p = 0.001, Figure 13(c), (d)).
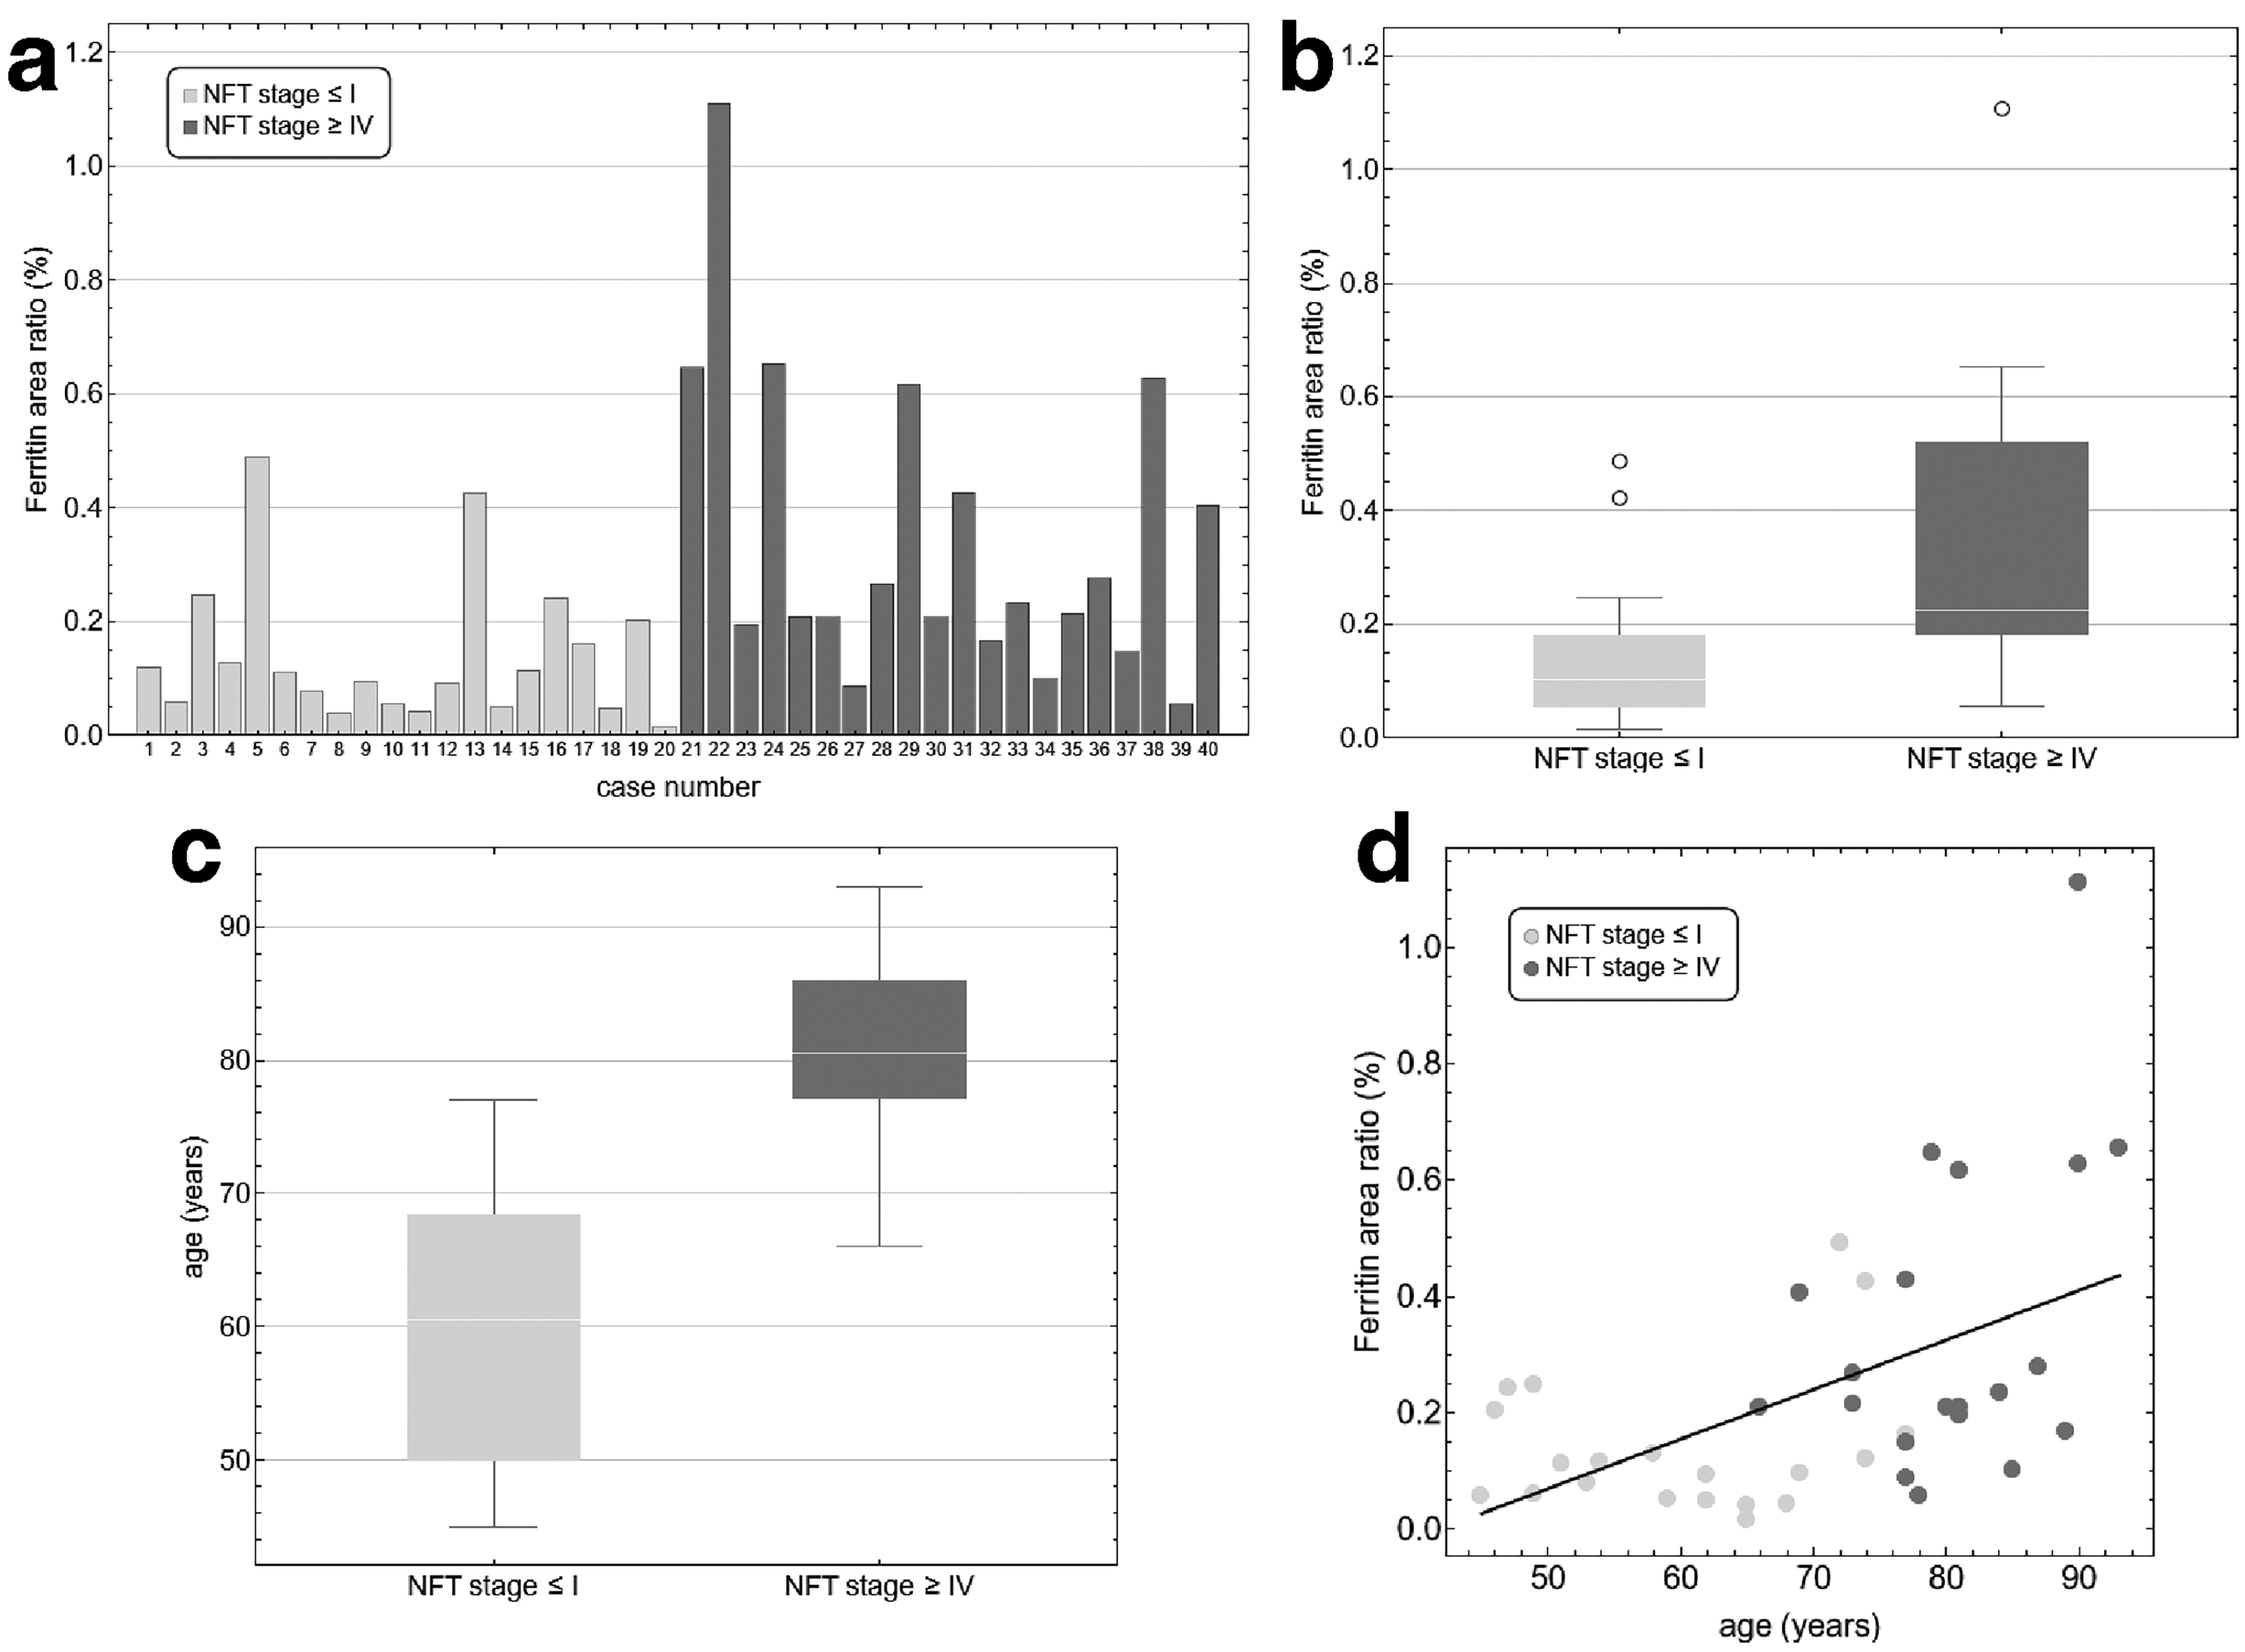
Measurements of ferritin expression. The area of microglia stained by the anti-ferritin antibody is set in relation to the total area evaluated (ferritin area ratio in %). In (a), ferritin area ratios of all selected cases are shown in the histogram. There is a significant (p = 0.001) higher ferritin expression in NFT stage ≥ IV than in NFT stage ≤ I, which can be seen in the boxplot in (b). In (c), the age difference between the two groups is shown in a boxplot. In (d), the correlation analysis between the age of the cases and the ferritin area ratio is shown, with a modest correlation (r = 0.50, p = 0.001).
We also investigated the presence of TfR and ferritin signals in the hippocampal and prefrontal brain slices of newborns. Similar to elderly brains, stained structures were detected by both the anti-ferritin and anti-TfR antibodies. The beaded processes and the completely TfR-positive neurons (Figure 2(e), (f)) appeared to be more numerous than in adult brains. TfR-accumulations resembling DD (Figure 2(c), (d)) occurred only rarely. Altogether, TfR area ratio was higher than in adult brains. Ferritin-positive microglia were detected in reduced numbers (Supplemental Tables 3 and 5). Interestingly, by visualizing TFRC expression in a snRNAseq dataset, that included age-depended tissue samples of the prefrontal cortex ranging from age 0 to 40, we were able to depict a comparable picture of TFRC expression. TFRC expression was highest at a young age and remained relatively stable after the age of two. We found a positive correlation of TFRC expression for both inhibitory (r = 0.69, p = 0.000) and excitatory (r = 0.65, p = 0.001) neurons over the aging process (Supplemental Figure 3).
Discussion
The goal of this work was to examine if neurons undergoing DD in AD express markers of ferroptosis. To this end, we established immunohistochemical staining against TfR and in situ hybridization protocols for the ferroptosis marker genes PTGS2 and TFRC. We could visualize TfR in human brain and reveal changes in iron metabolism in AD brain. Our major finding is that TfR-positive structures are related to p-tau + hallmarks and some TfR-positive structures are exhibiting morphological features similar to those of AT8-positive DD. These structures revealed globules of different sizes that appeared like DD spheres (Figure 2) and were also morphologically similar to membrane blebbing reported during ferroptosis. 24 However, spatial co-localization of TfR-positive structures and DD was rarely present.
Numerous groups support the hypothesis that ferroptosis plays a major role in AD pathogenesis,50–59 but direct molecular or pathological evidence of ferroptosis in AD brain is still lacking. Furthermore, typical ferroptotic markers such as the anti-TfR antibodies or antibodies against lipid peroxides have been investigated only in cell cultures under conditions of induced ferroptosis and were not directly used for in situ tissue localization. Only the anti-TfR (Sigma Cat#HPA028598) was used, in addition to its use in cell cultures during other studies,60,61 for examination of paraffin-embedded Head and Neck Squamous-Cell Carcinoma (HNSCC) biopsies. 62 Our current work reports TfR immunoreactivity in human brain tissue.
TfR is necessary for iron uptake into cells; it is physiologically expressed in neurons and endothelial cells of the human brain. Consistent with single nucleus RNA sequencing and immunohistochemical data from the human protein atlas, 46 we visualized immunohistochemically TfR on the endothelium and on neuronal structures and as anticipated ferritin on microglia. 14 These expression patterns of TfR and ferritin reflect the different functions of both cell types in the brain. Neurons generally have a lower iron content, 63 take up iron only when needed and process it directly for vital functions, whereas microglia store excess iron within ferritin. 29 While TfR is described to be expressed physiologically at the neuronal plasma membrane, upregulated expression has been shown to be a marker of ferroptosis. Feng et al. 27 found an accumulation of TfR at cell membranes already 4 h after induction of ferroptosis in Ht-1080 cells. These authors concluded that the internalization of TfR is impaired within ferroptotic processes. At the same time, they showed that internalization of EGFR, which occurs via the same pathway as TfR, is still working normally. They concluded that the amount of TfR on the cell membrane is related to changes in iron metabolism and suggest a positive feedback mechanism between iron uptake and ferroptotic death. 27 Furthermore, Jin et al. 64 used this increased TfR expression to distinguish between ferroptotic and apoptotic cell death using a machine learning program with TfR immunostaining.
During our observations we surprisingly found TfR-positive structures with a striking similarity to AT8-positive DD spheres, which also occurred more frequently in high NFT stages. As most of these accumulations did not stain positive for p-tau and as TfR accumulations also occur in a smaller extent in non-AD brains, TfR-positive accumulations could represent a ferroptotic process that occurs independently of the AD pathology. On the other hand, as the hyperphosphorylation of tau protein detected by AT8 is not likely to be reversible, TfR could be interpreted as an early ferroptosis marker, which is expressed only in an early phase of AD-related neurodegeneration (Figure 14), which would make it difficult to detect TfR on AT8-positive structures.
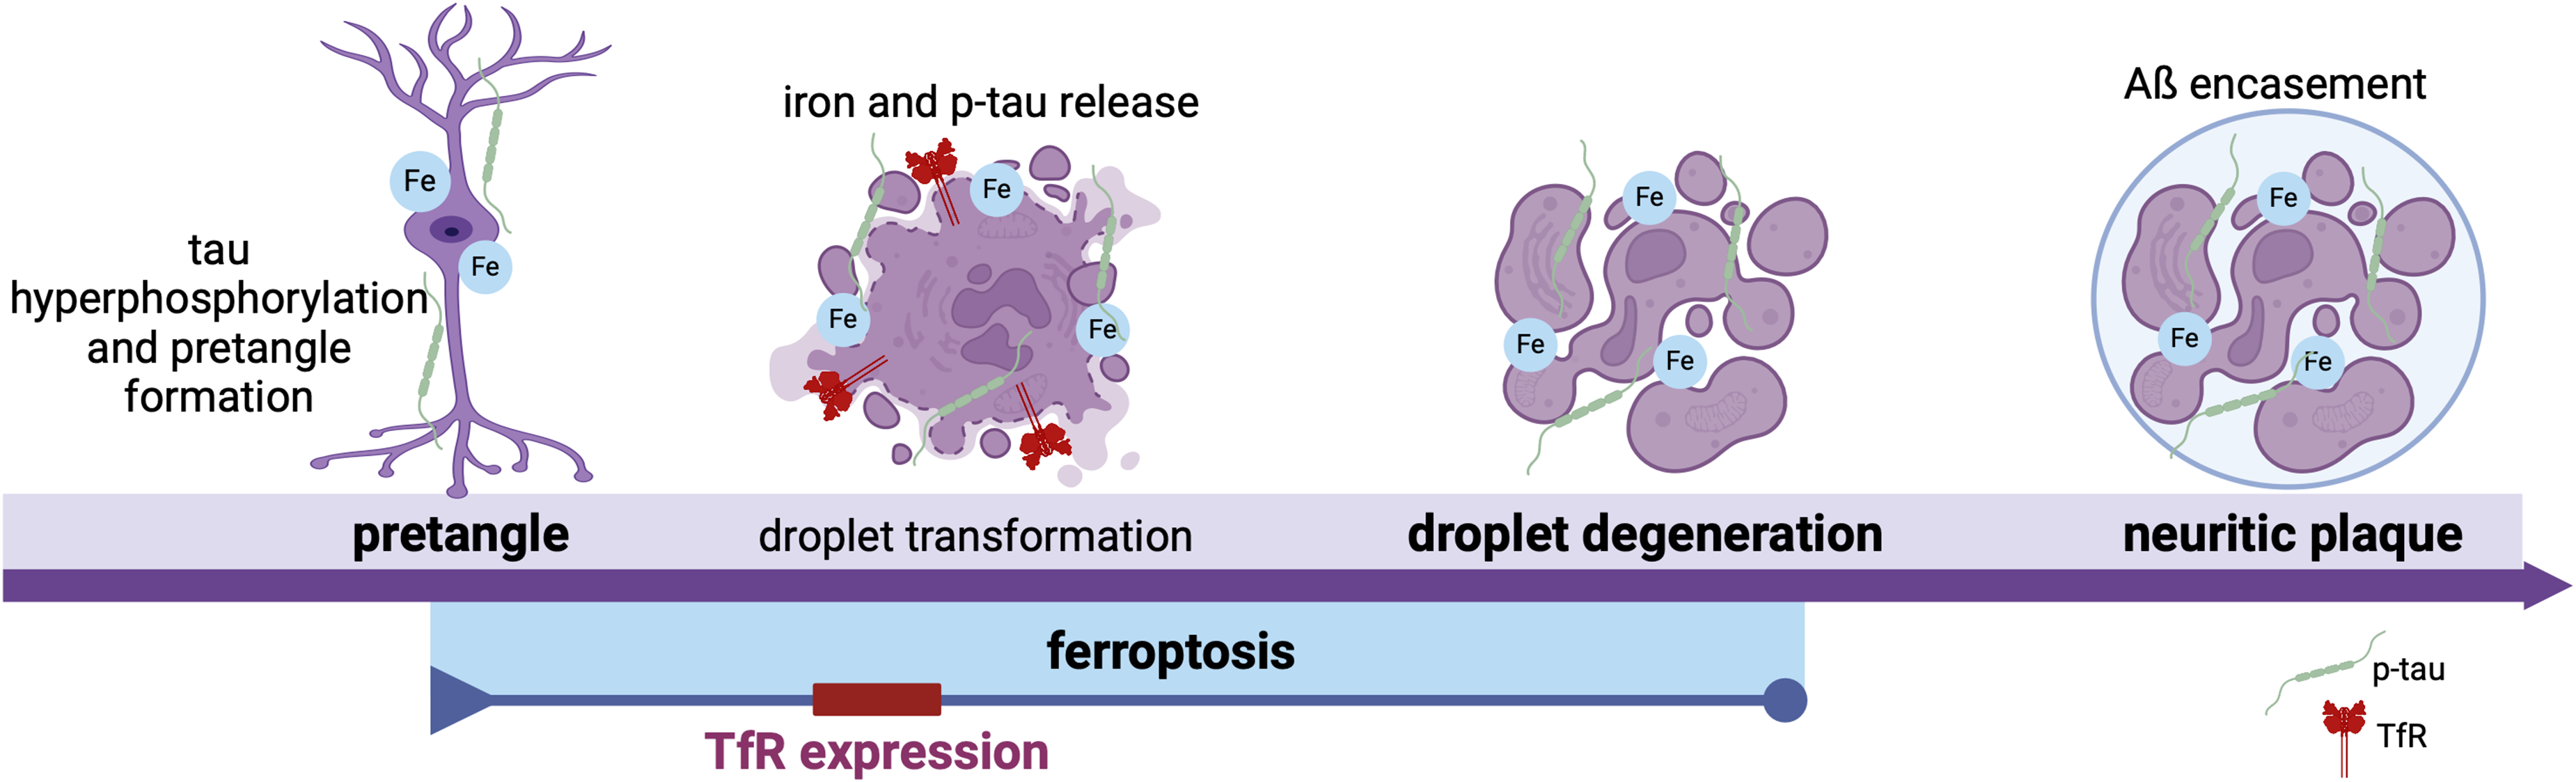
Illustration of the role of ferroptosis during AD pathogenesis. The degeneration of a pretangle with accumulated intracellular p-tau to a neuritic plaque through droplet degeneration is shown. The possible time span during this process in which ferroptosis and consequently also TfR expression could occur is indicated. Ferroptotic processes may contribute to the degeneration of pretangles into DD, which appear to be the morphological manifestation of ferroptosis. TfR may be an early and transient marker of ferroptosis. This short-term and early expression of the TfR makes it difficult to observe a direct co-localization between the TfR and p-tau-positive structures.
The theory of TfR as an early marker of ferroptosis with only transient expression in ferroptotic processes and therefore during AD pathogenesis can be corroborated by other studies. Yang et al. 65 proved transient expression of transferrin and TfR on perivascular NG2 + cells in rat brains during early postnatal weeks. A transient TfR expression during ferroptotic processes also emerges from the studies of Yu et al. 66 They induced ferroptosis using RSL3 in cell culture. A shift of TfR expression from the Golgi complex to the cell membrane was observed within the first 4 h after ferroptosis induction. In additional cell culture experiments, they accelerated the ferroptosis process using OSMI-1, which as an inhibitor of O-GlcNAcylation leads to a higher cell death rate within the same time accompanied by an increased TfR expression at cell membranes already after 1 h, which decreased again until the fourth hour after induction. 66 No other study has observed TfR expression on cell membranes longer than 4 h after ferroptosis induction. Since TfR expression was increasing and decreasing during ferroptosis accelerated with OSMI-1 already in 4 h, it can be assumed that it might also decrease during non-accelerated ferroptotic processes after 4 h. This suggests TfR as a transient ferroptosis marker, which occurs and can be detected only at certain stages of the ferroptotic process.
Our snRNAseq results strongly support the concept obtained in the microscopical part of this study, i.e., TfR being an early ferroptosis marker. Indeed, we found ferroptosis drivers to be significantly enriched just in the TFRC high expressing group; moreover, in TFRC expressing cells certain pathways involved in ferroptosis regulation are specifically up- or downregulated. The three major pathways are terpenoid backbone synthesis (1), O-glycan biosynthesis (2) and butyrate metabolism (3):
Terpenoids are described to promote ferroptosis by two different pathways, that is inhibiting GPX4 expression
67
and promoting ROS production.
68
GPX4 is a suppressor of ferroptosis as it is the major mediator of glutathione production and is therefore indirectly protecting cells against oxidative damage by reducing ROS and consequently lipid peroxidation. ROS production is a driver of ferroptosis, as it accelerates lipid peroxidation.
69
O-glycan biosynthesis is a process that involves GlcNAcylation to generate glycans on serine or threonine residues. GlcNAcylation itself has been described to be an important suppressor of ferroptosis, as de-GlcNAcylation of ferritin heavy chain promotes its interaction with NCOA4, a ferritinophagy receptor, which causes iron accumulation and consequently ferroptosis.
70
Further positive effects of GlcNAcylation are described elsewhere.
71
Butyrate is a short-chain fatty acid that is thought to promote ferritinophagy and ferroptosis by glutathione depletion, promoting iron accumulation and ROS generation.
72
Another study also showed that butyrate increased ferroptosis sensitivity through the FFAR2-mTor signaling pathway.
73
Our data showed a downregulation of terpenoid backbone synthesis and butyrate metabolism as ferroptosis promoting pathways and the upregulation of O-glycan biosynthesis as a ferroptosis suppressing pathway, indicating a transcriptomic regulation of ferroptosis-anticipatory cells that resembles an active suppression of ongoing ferroptosis.
Altogether, our transcriptomic analyses revealed that TFRC expressing cells co-express genes that are related to fatty acid metabolism and ferroptosis drive. On the other hand, we showed evidence that cells already affected by tau phosphorylation (AT8 positivity) express significantly higher levels of certain ferroptosis marker genes. We see this as a further hint of ferroptosis being an integral part of AD pathogenesis in the context of tauopathy, which is also confirmed by Spotorno et al. 74
The transcriptomic evaluation of TFRC as a ferroptotic marker has limitations. For the three datasets we explored, the data quality was quite distinct. The dataset of Grubman et al. 39 only provided 6 samples of each group that were multiplexed in batches of two, making it only a total of 12 pseudobulk clusters. While this also goes for the data of Morabito et al. 40 (here a total of 8 samples of each group was available, making it a total of 24 pseudobulk clusters), this limitation might be the reason why some of our comparisons did not reach significance. Additionally, we only focused on comparisons between the high/low TFRC expression groups for each condition (AD, control), but did not compare AD high TFRC expression versus control low TFRC expression.
Furthermore, the results of FISH showed that the ferroptosis marker genes PTGS2 and TFRC can be detected within hallmarks of AD pathology. The mRNA of the PTGS2 gene and of the TFRC gene could be detected in pretangles, less in DD, but also in neurons surrounding p-tau + structures. These marker genes could reveal neurons that are next to perish via ferroptosis. The decreased expression of these genes in DD can be explained by the fact that droplet spheres are formed by degenerated neurons whose cell machinery with DNA and mRNA is already impaired.
While Moos et al. 75 described an age dependency of neuronal TfR expression in rats, we observed an age-independent increase of TfR and ferritin expression that we related to progression of neurofibrillary degeneration. We found significantly higher levels in TfR and ferritin expression in samples that showed more AT8-immunoreactivity, suggesting alterations in iron metabolism during the progression of AD.
The appearance of ferritin-positive microglia precedes tau-pathology and was observed especially in the vicinity of DD in AD brains. For this reason, ferritin-expressing microglia can be considered a first line of defense against elevated iron levels, which increase with age and are also elevated in the AD brains.4,76–80 However, iron is probably not only toxic to neurons but also to microglia where it may drive their transformation to dystrophy. 14 Furthermore, quantification showed a significant higher number of TfR-immunoreactive neuronal structures in the high NFT stages, which would indicate either a higher baseline expression of TfR due to iron metabolism alterations or acute ongoing processes like ferroptosis, in which cellular TfR expression would be increased as well. Previously it was assumed that TfR expression is reduced in response to increased iron levels to prevent iron overload of cells. 81 However, it remains unknown why ferroptotic cells and neurons in AD brains express more TfR. Conceivably, neurons in AD brains are not able to downregulate TfR, which is why they take up excessive amounts of iron and consequently undergo ferroptosis.
In contrast to the elevated TfR and ferritin expression in high NFT stages, brains of newborns showed elevated TfR expression not accompanied by ferritin upregulation. Moos & Morgan 82 also found a biphasic expression of TfR in rat brains with increased expression in the embryo and adult brain. High TfR expression and low ferritin expression as in the brains of newborns suggests a high iron requirement for metabolic processes in neurons. 29 This is because iron plays a major role in embryonic and dividing neurons. 83 In contrast, in AD brains, both TfR and ferritin expression are elevated, indicating a derailment of iron metabolism rather than an increased iron requirement by neurons during metabolic processes.
We could not confirm an increased occurrence of TfR transcriptomically. FISH cases with high NFT stages showed no increase in mRNA levels of neither TFRC nor the PTGS2 gene as the most upregulated gene during ferroptosis. But intracellular iron homeostasis is regulated by the iron regulatory protein (IRP) and iron-responsive element (IRE), which post-transcriptionally regulate the translation of proteins of iron metabolism by binding of IRP on IRE depending on the iron level.84,85 This explains that although the amount of TFRC mRNA seemed to be the same in different NFT stages, the amount of the TfR still predominates at high NFT stages. This post-transcriptional regulation could also be impaired during ferroptotic processes and explain the elevated TfR levels during ferroptosis.
In summary, our data strengthen the hypothesis that DD is a form of ferroptosis as we demonstrated three of four hallmarks of ferroptosis described by Chen, Comish et al., 86 (1) membrane blebbing, (2) alterations in gene expression and (3) proteins related to iron metabolism, but we could not test successfully for lipid peroxides. Furthermore, the ferroptosis database FerrDb 30 describes other ferroptotic marker genes whose occurrence in the DD neurons should be investigated. However, our data are in line with the view that DD is a form of ferroptosis and that TfR is an early and transient marker of this form of neurodegeneration in AD.
Supplemental Material
sj-docx-1-alz-10.1177_13872877241296563 - Supplemental material for Detection of molecular markers of ferroptosis in human Alzheimer's disease brains
Supplemental material, sj-docx-1-alz-10.1177_13872877241296563 for Detection of molecular markers of ferroptosis in human Alzheimer's disease brains by Emily Mayr, Jonas Rotter, Heidrun Kuhrt, Karsten Winter, Ruth Martha Stassart, Wolfgang J Streit and Ingo Bechmann in Journal of Alzheimer's Disease
Footnotes
Acknowledgments
The authors would like to thank the staff of the Institute of Anatomy Leipzig. Special thanks go to Angela Ehrlich and Jana Brendler for their expert technical assistance and to PD Dr Martin Krüger for his support with microscopy. We gratefully acknowledge our body donors and their explicit will to serve medical education and science.

Author contributions
Emily Mayr (Formal analysis; Investigation; Validation; Writing – original draft); Jonas Rotter (Formal analysis; Investigation; Writing – review & editing); Heidrun Kuhrt (Investigation; Resources; Writing – review & editing); Karsten Winter (Data curation; Formal analysis; Software; Writing – review & editing); Ruth Martha Stassart (Resources; Supervision; Writing – review & editing); Wolfgang J Streit (Conceptualization; Funding acquisition; Methodology; Supervision; Writing – review & editing); Ingo Bechmann (Conceptualization; Funding acquisition; Methodology; Supervision; Writing – review & editing).
Funding
The authors disclosed receipt of the following financial support for the research, authorship, and/or publication of this article: This study was supported by the Deutsche Forschungsgemeinschaft (DFG) Collaborative Research Center 1052-A9, by NIH grants R01NS071122 and R21 NS103108, and by a Florida Department of Health Grant 8AZ19.
Declaration of conflicting interests
The authors declared no potential conflicts of interest with respect to the research, authorship, and/or publication of this article.
Data availability
The publicly available datasets analyzed in the current study can be downloaded via the National Center for Biotechnology with accession numbers GSE138852, GSE174367, GSE129308 and GSE168408.
Supplemental material
Supplemental material for this article is available online.
References
Supplementary Material
Please find the following supplemental material available below.
For Open Access articles published under a Creative Commons License, all supplemental material carries the same license as the article it is associated with.
For non-Open Access articles published, all supplemental material carries a non-exclusive license, and permission requests for re-use of supplemental material or any part of supplemental material shall be sent directly to the copyright owner as specified in the copyright notice associated with the article.
