
Abstract
Background
In Alzheimer's disease (AD), tau and white matter lesion pathology are associated with clinical severity and subsequent decline, but their relative relationships with clinical assessments remain uncertain.
Objective
To examine cross-sectional and prognostic associations between baseline [18F]GTP1 tau positron emission tomography (PET) standardized uptake value ratio (SUVRs) and T1 white matter hypointensity (WMHypo) volumes with clinical indices.
Methods
We analyzed participants with biomarker-confirmed prodromal (n = 127) or mild (n = 233) AD with baseline [18F]GTP1 tau PET and MRI and longitudinal Clinical Dementia Rating-Sum of Boxes (CDR-SB), 13-item version of the Alzheimer's Disease Assessment Scale-Cognitive Subscale (ADAS-Cog13), Repeatable Battery for the Assessment of Neuropsychological Status (RBANS), Mini-Mental Status Examination (MMSE), and Alzheimer's Disease Cooperative Study-Activities of Daily Living (ADCS-ADL) data.
Results
Higher baseline [18F]GTP1 SUVRs were independently associated with poorer baseline performance and faster rates of subsequent decline on all five clinical outcome measures. Higher baseline WMHypo volumes were independently associated with poorer baseline performance on the CDR-SB, ADAS-Cog13, RBANS, and MMSE and faster rates of subsequent decline on the CDR-SB and ADCS-ADL.
Conclusions
The independent associations of tau and white matter lesion pathology with clinical decline in AD suggest future prognostic models should include both imaging modalities.
Introduction
Alzheimer's disease (AD) is defined neuropathologically by the deposition of amyloid-β (Aβ) plaques and tau neurofibrillary tangles, 1 which can be detected antemortem via neuroimaging using specific Aβ and tau positron emission tomography (PET) tracers. 2 Neuroimaging via magnetic resonance imaging (MRI) in participants with AD also frequently demonstrates white matter lesions, 3 which can reflect demyelination and axonal loss resulting from small vessel disease and/or neurodegeneration. 4 Such neuroimaging findings are consistent with postmortem findings indicating that many individuals with AD neuropathology also have concomitant vascular neuropathology, 5 though not all white matter lesions are of vascular origin. 4
There remains considerable uncertainty in the literature regarding the relationship between AD neuropathology and white matter lesions. One hypothesis is that white matter lesions, representing small vessel disease, may precede and contribute to subsequent AD neuropathology, due to decreased perivascular clearance of Aβ. Support for this idea comes from work suggesting that higher baseline white matter lesion loads are associated with faster subsequent accumulation of Aβ PET signal. 6 Alternatively, AD neuropathology may contribute to white matter lesions via Wallerian degeneration driven by neurodegenerative changes, though the specific neuropathological features that have been implicated differ across studies. Post-mortem neuropathological studies in AD patients indicate that tau (but not Aβ) pathology is associated with white matter lesions,7,8 while some PET studies (in cohorts of primarily cognitively normal participants) suggest that Aβ (but not tau) pathology is associated with white matter lesions.9,10 Another possibility is that AD neuropathology and white matter lesions are independent phenomena, as evidenced by PET studies suggesting no association of white matter lesions with Aβ 11 or tau9,10 pathology.
Another approach to unraveling these relationships is to examine the associations between AD neuropathology and white matter lesions on disease progression in AD. On a univariate basis, baseline neuroimaging measures of Aβ, tau, and white matter lesions have each been shown to be associated with subsequent rates of clinical decline across different participant populations.12–15 However, in multivariate analyses that have included both baseline Aβ and tau PET assessments, Aβ PET does not provide additional prognostic information beyond that of tau PET alone,12,13 confirming earlier studies indicating that tau is more closely associated with cognitive performance than Aβ 16 and may mediate the effects of Aβ on cognition. 17 Analyses focused on the relative contributions of Aβ and white matter lesion pathology on subsequent cognitive decline have produced mixed results, with some reports suggesting no additive/synergistic effects 18 and others suggesting that the presence of both pathologies results in faster decline. 19 The relative contributions of tau versus white matter lesion pathology on longitudinal cognitive decline have not been explored, though analyses of cross-sectional cognitive data suggest that these two pathologies do not interact. 20
We explored cross-sectional and prognostic associations for tau PET and white matter lesions on MRI with a range of clinical indices in a large cohort of participants with biomarker-confirmed prodromal-to-mild AD. We were specifically interested in whether tau PET standardized uptake value ratios (SUVRs) and white matter lesion volumes are independently associated with measures of cognitive and functional decline and, if so, whether different patterns of cross-sectional and prognostic associations are seen with these imaging modalities.
Methods
Study design
We performed secondary analyses of baseline and longitudinal data from the Tauriel study (NCT03289143), an 18-month phase 2 clinical trial of the anti-tau antibody semorinemab in prodromal-to-mild AD that was conducted between October 18, 2017 and July 16, 2020 at 97 sites in North America, Europe, and Australia. 21 As no differences were seen in this study on any clinical outcome measure between the placebo arm and any of the three semorinemab dose arms (1500 mg, 4500 mg, or 8100 mg every 4 weeks), data were pooled across all arms for the analyses presented here. This analytic approach was supported by subsequent sensitivity analyses that revealed similar patterns of cross-sectional and prognostic associations in each individual treatment arm relative to the pooled cohort.
Participants
At the time of study enrollment, participants were between 50–80 years of age (inclusive), met diagnostic criteria for mild cognitive impairment (MCI; i.e., prodromal AD) 22 or dementia (i.e., mild AD) 23 due to AD, and had Mini-Mental Status Examination (MMSE) 24 scores between 20 and 30 (inclusive), global scores on the Clinical Dementia Rating (CDR) 25 of 0.5 or 1, Repeatable Battery for the Assessment of Neuropsychological Status (RBANS) 26 Delayed Memory Index scores of ≤85, and evidence of significant cerebral amyloid pathology confirmed by Aβ PET scan ([18F]florbetaben, [18F]florbetapir, [18F]flutemetamol, or [18F]NAV4694 via centralized independent qualitative visual review) and/or cerebrospinal fluid (CSF) Aβ1–42 levels [≤1000 pg/mL, Elecsys β-amyloid (1–42) CSF immunoassay; Roche Diagnostics, Penzberg, Germany]. Potential participants with significant non-AD pathology that could contribute to cognitive impairment were excluded, including those with MRI evidence of >2 lacunar infarcts, any territorial infarct >1 cm3, or severe deep white matter lesions corresponding to a Fazekas score of 3 (Supplemental Figure 1). Of the 780 individuals who failed to fulfill inclusion/exclusion criteria, 21 141 were negative for Aβ by PET/CSF and/or had exclusionary MRI findings. Participants were classified as prodromal AD (pAD) versus mild AD (mAD) based on each site investigator's interpretation of the diagnostic criteria of MCI 22 versus dementia 23 and subsequent central review of submitted diagnostic verification forms (which included clinical history and screening cognitive assessment scores) to ensure consistency across sites. Analyses included participants who underwent MRI imaging at screening, [18F]GTP1 at baseline, and clinical assessments at baseline and at least two post-baseline time points.
Neuroimaging
Baseline [18F]GTP1 PET scans were performed as previously described.21,27 [18F]GTP1 SUVRs were calculated across a whole cortical gray region of interest (ROI) using the cerebellar gray matter as reference. Screening MRI scans included T1, T2*, and T2 fluid-attenuated inversion recovery (FLAIR) sequences. Total cortical volumes were calculated by a central service provider (NeuroRx, Montreal, QC) using T1 images. White matter lesions were measured from T1 images per the white matter hypointensity (WMHypo) algorithm included in Freesurfer (http://surfer.nmr.mgh.harvard.edu), 28 as this data was readily available through the existing imaging analysis pipeline and because the T1 images had thinner slice thickness (1.2 mm) than the T2 FLAIR images (4 mm). Prior work has suggested that while T1 WMHypo metrics yield systematically lower volumetric estimates than T2 FLAIR white matter hyperintensity metrics, the results from these two approaches are highly correlated.29–31 Aβ PET SUVRs were calculated using the whole cerebellum as reference and converted to centiloids. All [18F]GTP1 and Aβ PET analysis were performed by a central PET service provider (Invicro, New Haven, CT). Additional details regarding neuroimaging procedures may be found in the Supplemental Methods.
Clinical assessments
Participants were assessed at the baseline visit and at the 6-, 12-, and 18-month post-baseline visits on the CDR-Sum of Boxes (CDR-SB), 32 13-item version of the Alzheimer's Disease Assessment Scale-Cognitive Subscale (ADAS-Cog13), 33 MMSE, Alzheimer's Disease Cooperative Study-Activities of Daily Living Scale (ADCS-ADL), 34 and RBANS total score. Longitudinal changes on these clinical outcome measures were analyzed via estimated annualized slopes derived from simple linear models that included all available data points. Raw scores were used for all indices.
Statistical methods
Statistical analyses were performed with R software version 4.3.1 (R Foundation). Baseline comparisons between the pAD and mAD groups were analyzed using two-tailed Welch's t-tests (for continuous variables) or chi-square tests (for categorical variables). We first explored associations between baseline [18F]GTP1 SUVRs and WMHypo volumes using Spearman correlations to determine the relationship between tau and white matter lesion pathology in our cohort. Baseline [18F]GTP1 SUVRs or WMHypo volumes were then used to explore potentially different patterns of univariate Spearman's correlations with different clinical assessments, with separate cross-sectional (using baseline scores) and prognostic (using annualized rates of change) analyses. These correlational analyses were examined both without adjustment and Bonferroni-corrected for multiple comparisons across the five clinical assessments (critical p = 0.01). We subsequently used cross-sectional and prognostic multivariate linear regression models to determine whether [18F]GTP1 SUVRs and WMHypo volumes were independent predictors of performance on clinical assessments. For the cross-sectional models, baseline covariates included: age, sex, education (≥ high school completion versus < high school completion), APOE4 genotype (positive versus negative), Aβ PET (in centiloids), and total cortical volume. For the prognostic analyses, we used linear mixed-effects models to investigate rates of longitudinal change from baseline on clinical assessments, with time (in years) included as a continuous variable. These prognostic models incorporated the same baseline covariates as the cross-sectional models, with the addition of baseline performance on each individual clinical assessment. Within-participant dependencies were captured via participant-level random effects.
Results
Baseline participant characteristics
Baseline demographic, imaging, and clinical characteristics for the 360 Tauriel participants (pAD: n = 127; mAD: n = 233) with baseline neuroimaging and longitudinal cognitive data available for analysis are shown in Table 1. Of these participants, Aβ positivity was confirmed by PET (n = 293), CSF (n = 49), or both modalities (n = 18). The pAD and mAD groups were similar in demographics and Aβ burden. The mAD group had significantly smaller total brain volumes and poorer performance on all clinical and cognitive measures.
Baseline demographic, imaging, and clinical characteristics.
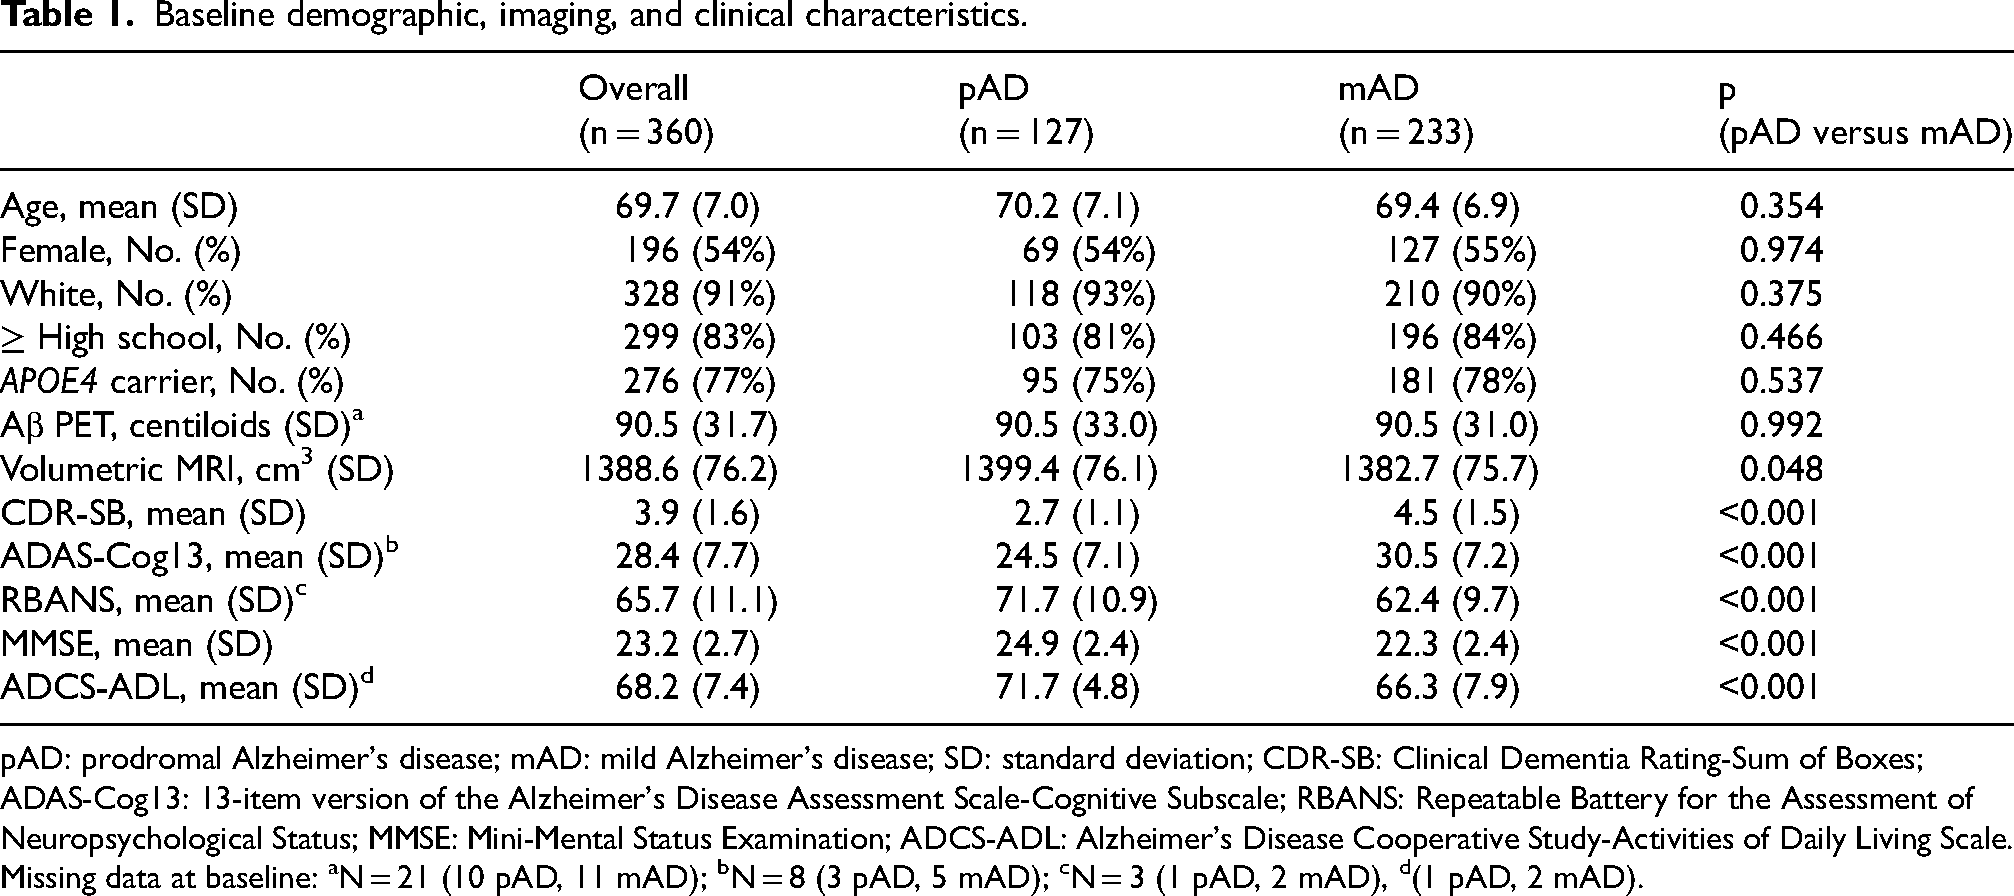
pAD: prodromal Alzheimer's disease; mAD: mild Alzheimer's disease; SD: standard deviation; CDR-SB: Clinical Dementia Rating-Sum of Boxes; ADAS-Cog13: 13-item version of the Alzheimer's Disease Assessment Scale-Cognitive Subscale; RBANS: Repeatable Battery for the Assessment of Neuropsychological Status; MMSE: Mini-Mental Status Examination; ADCS-ADL: Alzheimer's Disease Cooperative Study-Activities of Daily Living Scale. Missing data at baseline: aN = 21 (10 pAD, 11 mAD); bN = 8 (3 pAD, 5 mAD); cN = 3 (1 pAD, 2 mAD), d(1 pAD, 2 mAD).
Baseline [18F]GTP1 SUVRs and whole brain WMhypo volumes are shown in Figure 1. Higher [18F]GTP1 SUVRs were seen in mAD relative to pAD [t(314.8) = −3.07, p = 0.002; Cohen's d = −0.32]. WMhypo volumes were not available for 29 participants (5 pAD, 24 mAD), but were similar between the two groups [t(245.5) = −0.54, p = 0.593; Cohen's d = −0.06]. The overall distribution of WMhypo volumes was skewed towards higher values (Supplemental Figure 2). [18F]GTP1 SUVRs and WMhypo volumes were inversely correlated across the entire study cohort [rs(329) = −0.16, p = 0.004] and within the mAD group [rs(207) = −0.19, p = 0.007]. However, within the pAD group, this correlation fell short of significance [rs(120) = −0.15, p = 0.099].
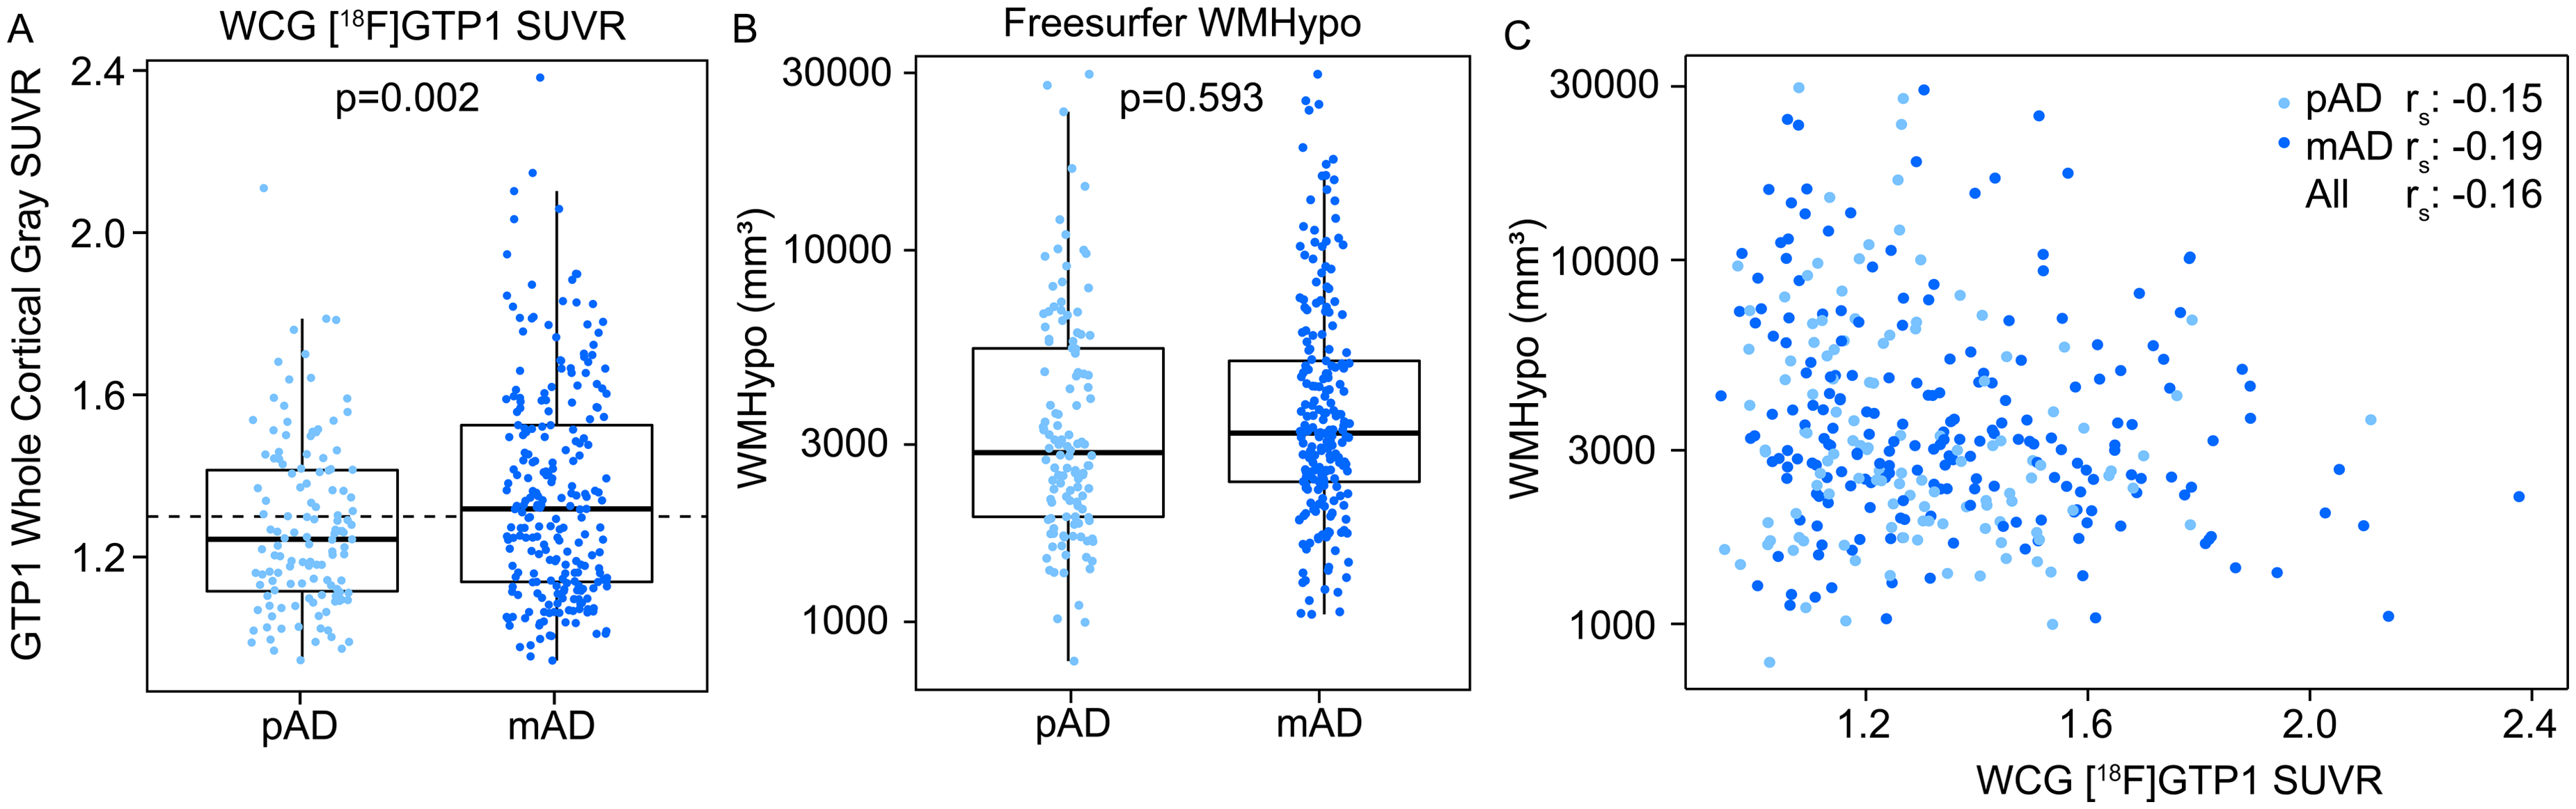
Baseline (A) Whole cortical gray (WCG) [18F]GTP1 SUVRs and (B) white matter hypointensity (WMHypo) volumes in prodromal AD (pAD) and mild AD (mAD) participants. (C) [18F]GTP1 standardized uptake value ratio (SUVR) and white matter lesion burden indices were inversely correlated.
Cross-sectional correlations between imaging and clinical assessments
Cross-sectional univariate correlations between baseline [18F]GTP1 SUVRs and WMHypo volumes and baseline CDR-SB, ADAS-Cog13, ADCS-ADL, MMSE, and RBANS scores are shown in Figure 2(A)–(E). In the overall cohort, [18F]GTP1 SUVRs were significantly correlated with all 5 clinical measures (ps < 0.001), including after Bonferroni correction (critical p = 0.01). For the predominantly cognitive assessments (i.e., ADAS-Cog13, MMSE, RBANS), these correlations remained statistically significant (ps < 0.005) in subgroup analyses limited to only pAD or mAD participants, both before and after correction for multiple comparisons. However, for assessments that incorporate measures of functional impairment (i.e., CDR-SB, ADCS-ADL), such subgroup analyses largely yielded only marginally significant correlations with [18F]GTP1 SUVRs, none of which survived correction for multiple comparisons. Correlations between baseline WMHypo volumes and baseline clinical outcome measure scores across the entire cohort were significant or marginally significant for a subset of assessments [ADAS-Cog13: p = 0.047; ADCS-ADL: p = 0.069; CDR-SB: p = 0.059, MMSE: p = 0.037], but also did not survive correction for multiple analyses. However, none of these univariate correlational analyses reached even marginal significance within the pAD or mAD subgroups in unadjusted analyses.
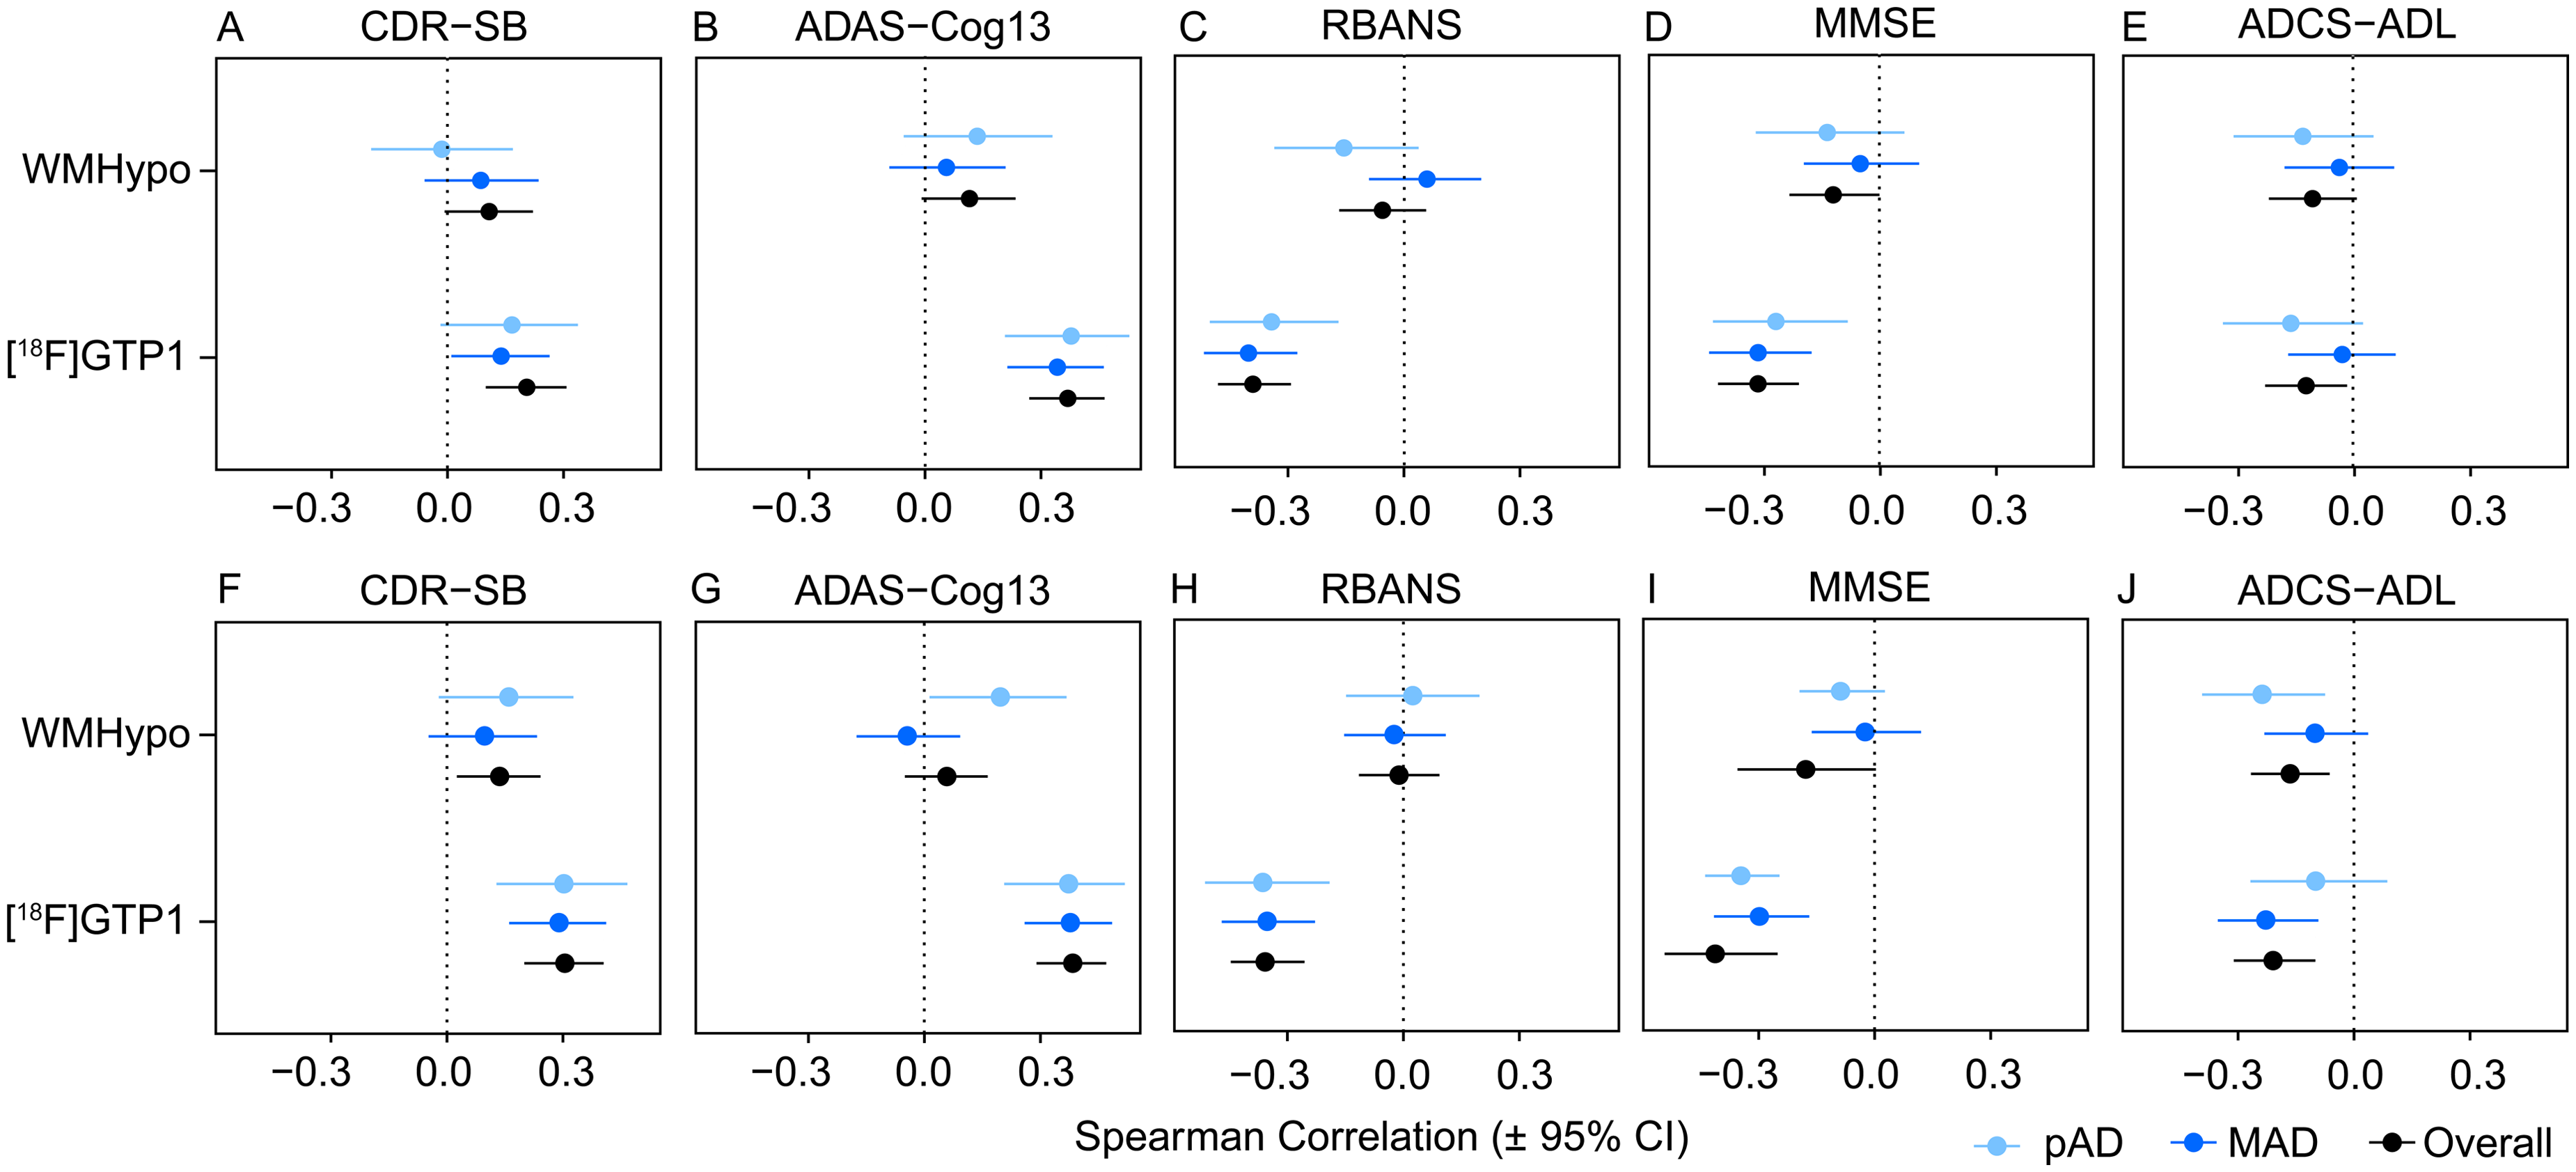
Forest plots of Spearman correlations between baseline whole cortical gray [18F]GTP1 SUVRs and whole brain white matter hypointensity (WMHypo) volumes and baseline performance (A-E) or subsequent annualized rates of decline (F-J) on the Clinical Dementia Rating-Sum of Boxes (CDR-SB; A and F), 13-item version of the Alzheimer’s Disease Assessment Scale-Cognitive Subscale (ADAS-Cog13; B and G), Repeatable Battery for the Assessment of Neuropsychological Status (RBANS; C and H), Mini-Mental Status Examination (MMSE; D and I), and Alzheimer’s Disease Cooperative Study-Activities of Daily Living Scale (ADCS-ADL; E and J) in prodromal AD (pAD) and mild AD (mAD) participants. Error bars represent 95% confidence intervals (CI).
Separate cross-sectional multivariate linear regression analyses incorporating the overall study cohort that examined baseline associations between [18F]GTP1 SUVRs and WMHypo volumes and performance on each clinical outcome measure and included key covariates (age, sex, education, APOE status, Aβ PET, and total cortical volume) are shown in Table 2. These analyses indicated that [18F]GTP1 SUVRs were independently associated with baseline performance on each clinical outcome measure, while WMHypo volumes were independently associated with baseline performance on the CDR-SB, ADAS-Cog13, RBANS, and MMSE. Sensitivity analyses did not demonstrate any significant cross-sectional interactions between [18F]GTP1 SUVRs and WMHypo volumes on any of these clinical outcome measures.
Multivariate regression analyses of baseline clinical indices versus baseline demographic and imaging variables.
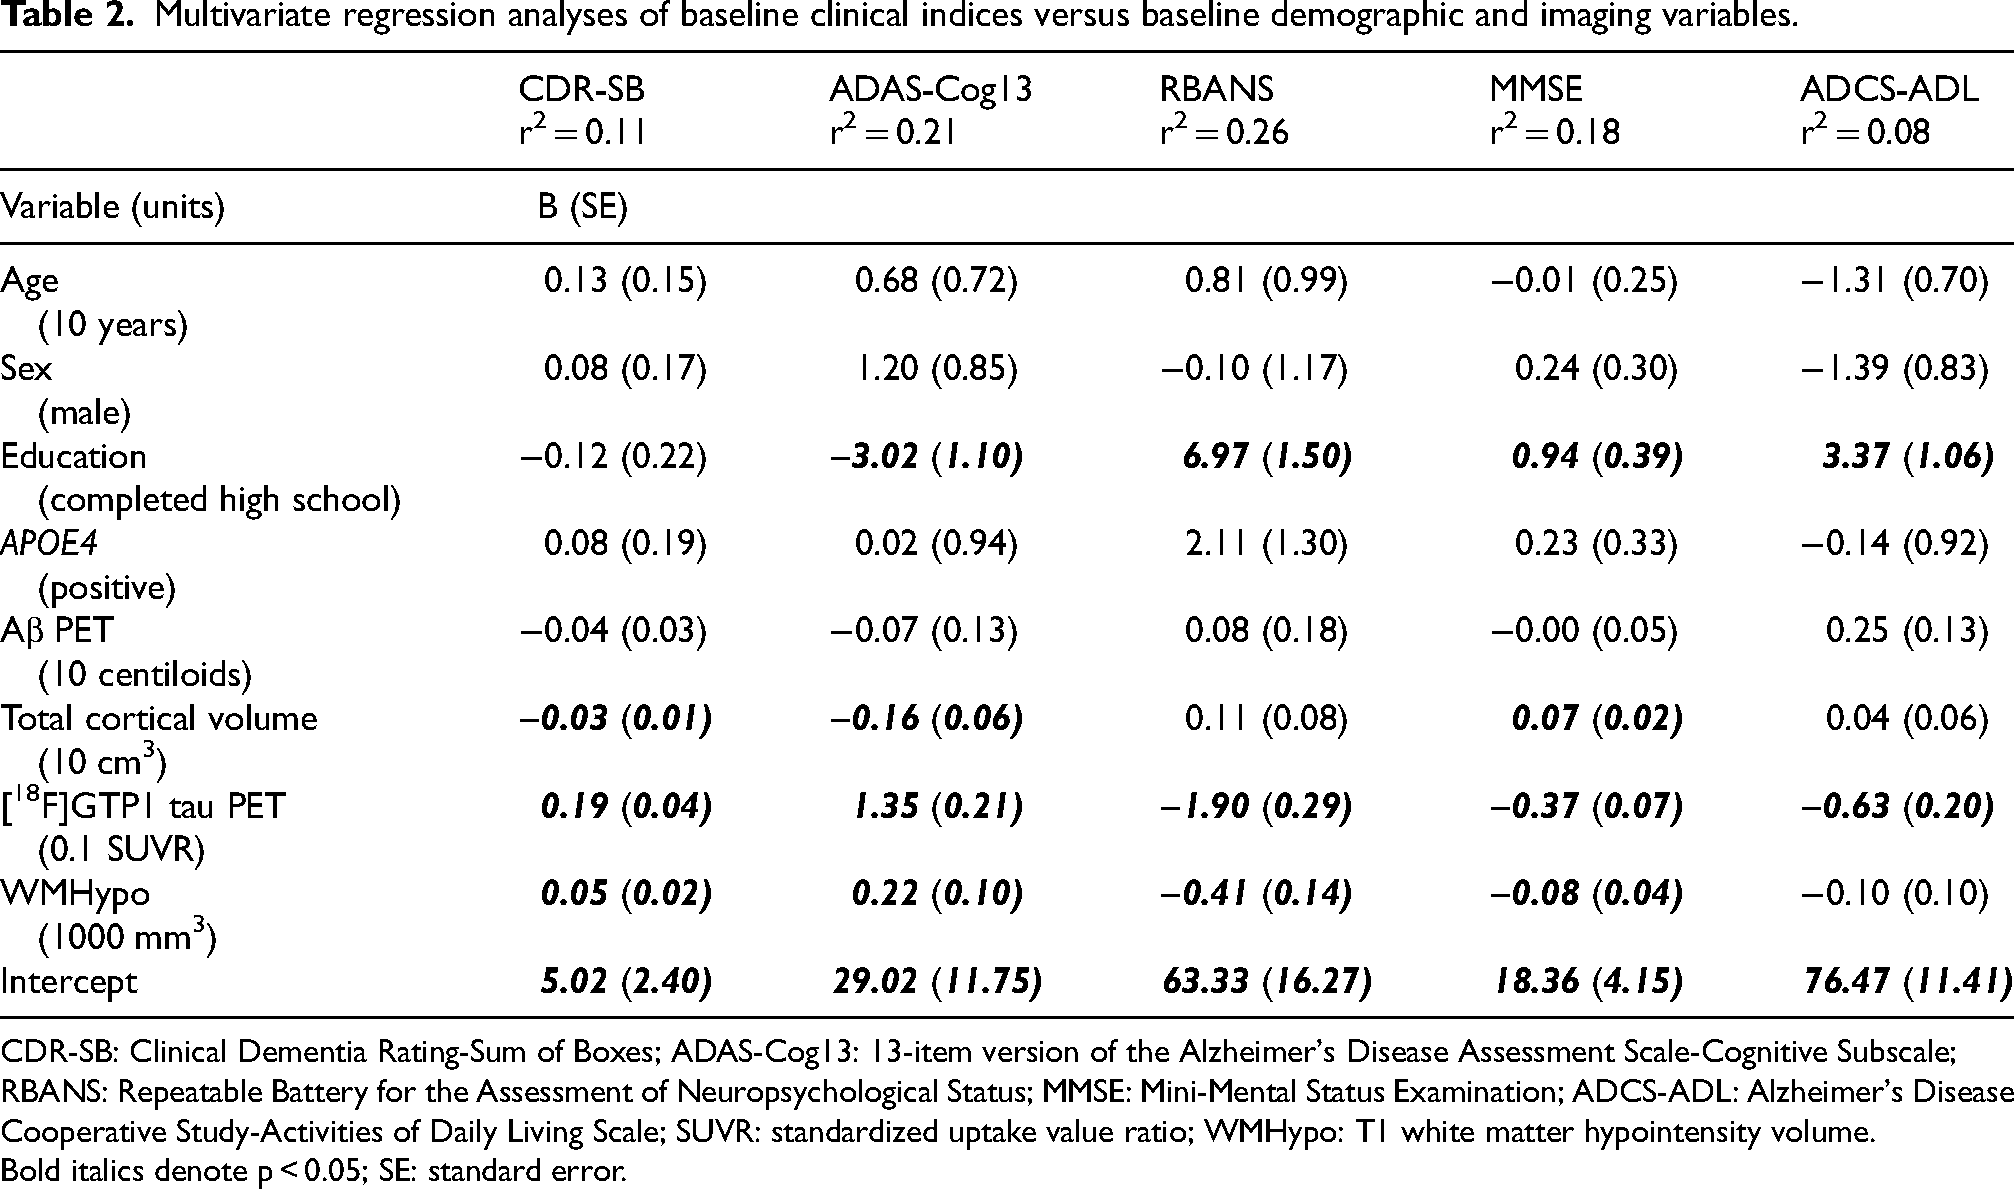
CDR-SB: Clinical Dementia Rating-Sum of Boxes; ADAS-Cog13: 13-item version of the Alzheimer's Disease Assessment Scale-Cognitive Subscale; RBANS: Repeatable Battery for the Assessment of Neuropsychological Status; MMSE: Mini-Mental Status Examination; ADCS-ADL: Alzheimer's Disease Cooperative Study-Activities of Daily Living Scale; SUVR: standardized uptake value ratio; WMHypo: T1 white matter hypointensity volume. Bold italics denote p < 0.05; SE: standard error.
Prognostic correlations between imaging and clinical assessments
Annualized change scores calculated for the CDR-SB, ADAS-Cog13, RBANS, MMSE, and ADCS-ADL are shown as boxplots in Figure 3. Significantly faster rates of longitudinal decline were seen in mAD relative to pAD on the CDR-SB [t(296.1) = −5.03, p < 0.001; Cohen's d = −0.54], ADAS-Cog13 [t(275) = −3.09, p = 0.002; Cohen's d = −0.34], MMSE [t(356) = 5.64, p < 0.001; Cohen's d = 0.54], and ADCS-ADL [t(313.9) = 4.20, p < 0.001; Cohen's d = 0.44]. Similar rates of decline in both groups were seen on the RBANS [t(233.7) = 0.85, p = 0.40; Cohen's d = 0.10].
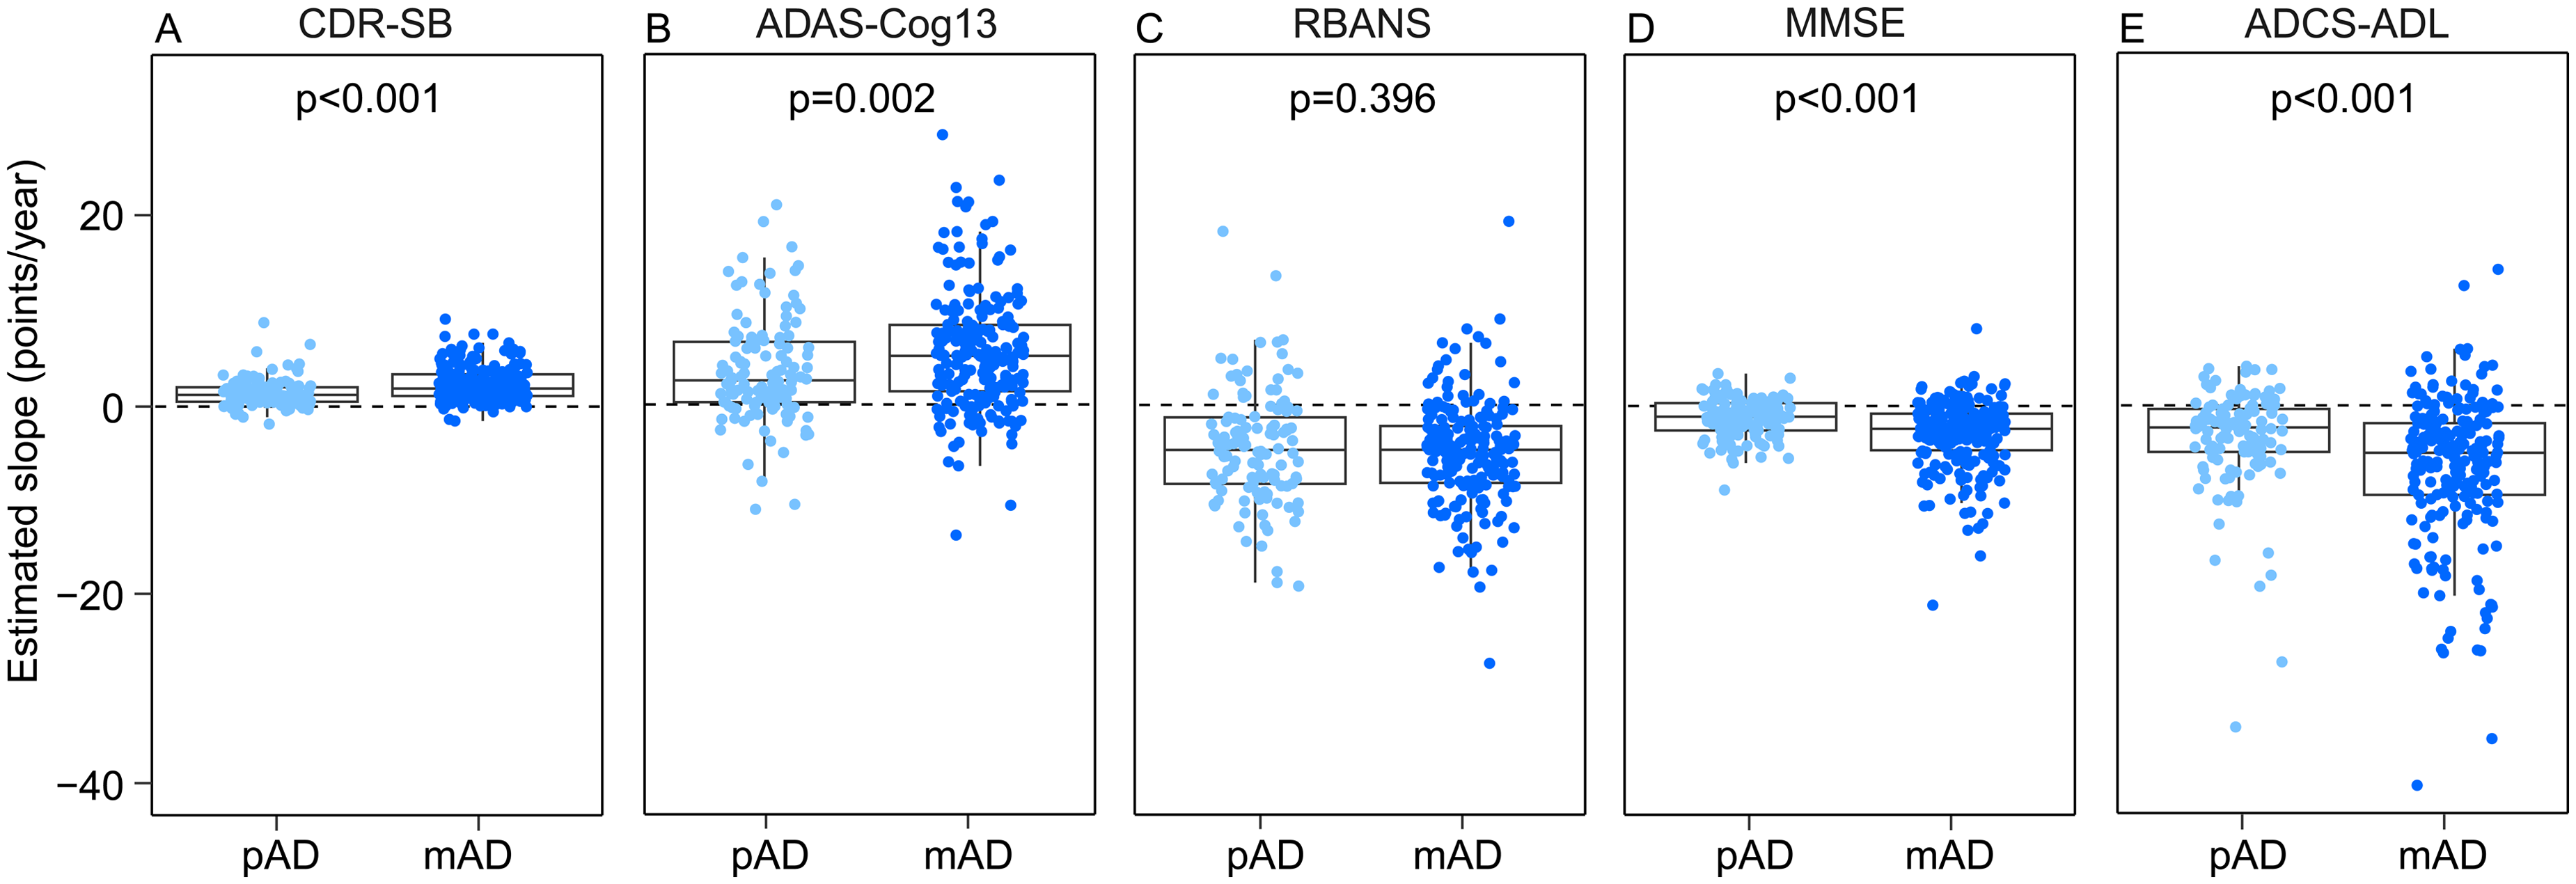
Annualized rates of decline on the (A) Clinical Dementia Rating-Sum of Boxes (CDR-SB), (B) 13-item version of the Alzheimer’s Disease Assessment Scale-Cognitive Subscale (ADAS-Cog 13), (C) Repeatable Battery for the Assessment of Neuropsychological Status (RBANS), (D) Mini-Mental Status Examination (MMSE), and (E) Alzheimer’s Disease Cooperative Study-Activities of Daily Living Scale (ADCS-ADL) in prodromal AD (pAD) and mild AD (mAD) participants.
Univariate prognostic correlations between baseline [18F]GTP1 SUVRs and WMHypo volumes and subsequent annualized rates of change for clinical measures for the overall study cohort and separately for the pAD and mAD groups are shown as forest plots in Figure 2(F)–(J). Baseline [18F]GTP1 SUVRs correlated significantly [both before and after Bonferroni correction (critical p = 0.01)] with subsequent decline on all indices for the overall study cohort (ps < 0.001) and the mAD group (ps < 0.001), and for all indices for the pAD group (ps < 0.005) with the exception of the ADCS-ADL (p = 0.18). Baseline WMHypo volumes only correlated significantly with subsequent decline on the CDR-SB (p = 0.028) and ADCS-ADL (p = 0.005) for the overall study cohort and the ADAS-Cog13 (p = 0.023) and ADCS-ADL (p = 0.017) for the pAD group. Only the prognostic correlation between WMHypo volumes and ADCS-ADL in the overall study cohort survived correction for multiple comparisons (critical p = 0.01). No significant prognostic correlations were observed for WMHypo volumes in the mAD group.
Separate multivariate regression analyses incorporating the overall study cohort that examined prognostic associations between baseline [18F]GTP1 SUVRs and WMHypo volumes and subsequent annualized rates of change on each clinical outcome measure and included key covariates (age, sex, education, APOE status, baseline performance, Aβ PET, and total cortical volume) are shown in Table 3. In these analyses, baseline [18F]GTP1 SUVRs were significantly associated with subsequent annualized rates of change on all measures, while baseline WMHypo volumes were only significantly associated with subsequent annualized rates of change on the CDR-SB and ADCS-ADL. Sensitivity analyses did not demonstrate any significant prognostic interactions between [18F]GTP1 SUVRs and WMHypo volumes on any of these clinical outcome measures.
Multivariate regression analyses of annualized rates of change on clinical indices versus baseline performance, demographic, and imaging variables.
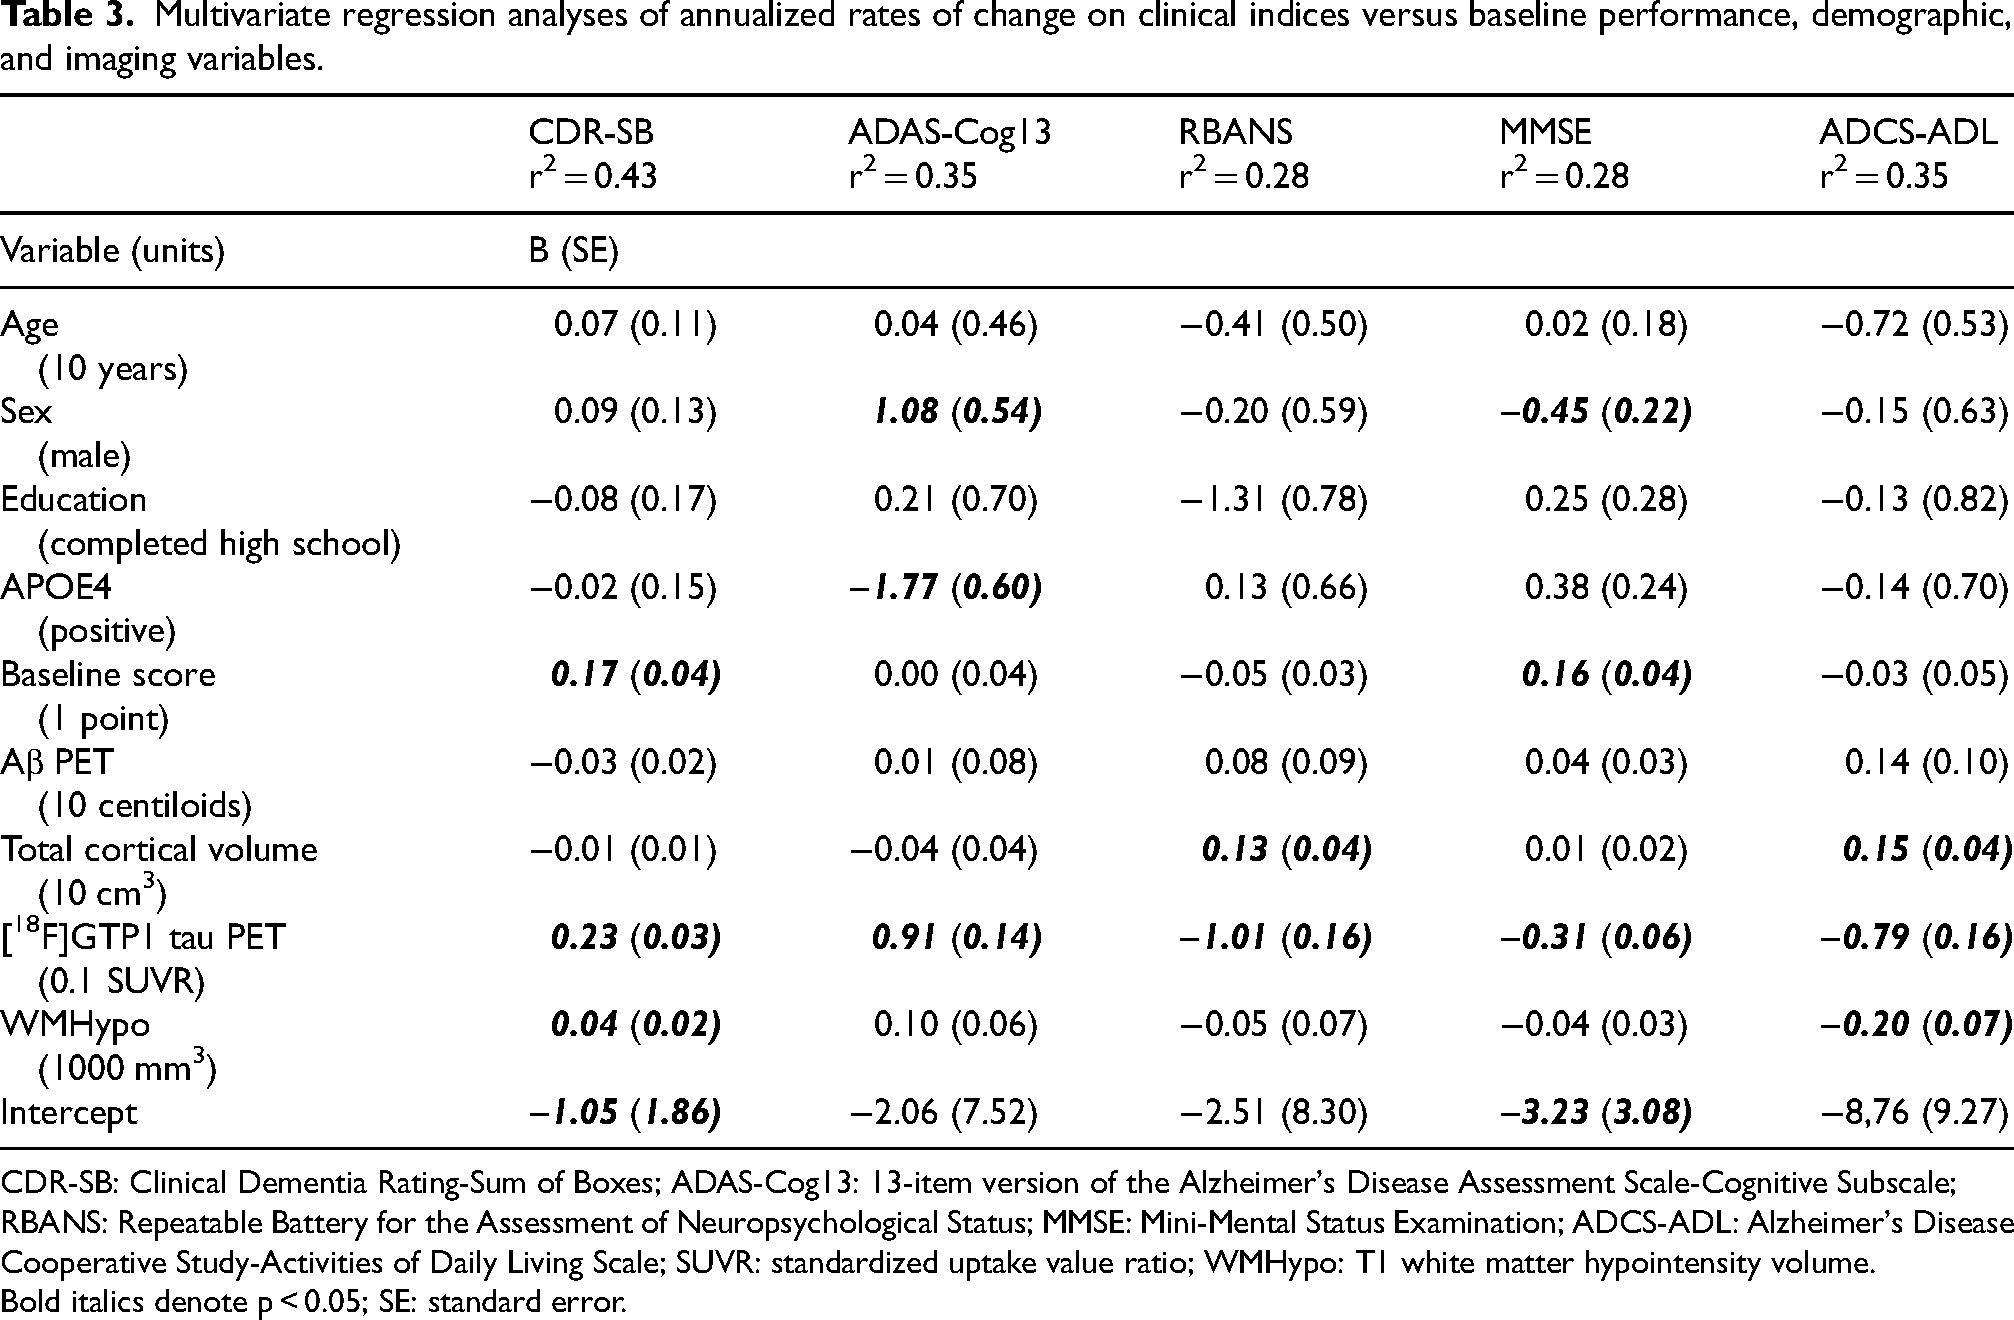
CDR-SB: Clinical Dementia Rating-Sum of Boxes; ADAS-Cog13: 13-item version of the Alzheimer's Disease Assessment Scale-Cognitive Subscale; RBANS: Repeatable Battery for the Assessment of Neuropsychological Status; MMSE: Mini-Mental Status Examination; ADCS-ADL: Alzheimer's Disease Cooperative Study-Activities of Daily Living Scale; SUVR: standardized uptake value ratio; WMHypo: T1 white matter hypointensity volume. Bold italics denote p < 0.05; SE: standard error.
Discussion
In this cohort of participants with biomarker-confirmed prodromal-to-mild AD, higher baseline cortical [18F]GTP1 SUVRs and baseline whole brain WMHypo volumes were both independently associated with both greater initial clinical disease severity and faster rates of subsequent longitudinal clinical decline over an 18-month observation period. These findings are consistent with prior cross-sectional analyses suggesting that these two pathologies independently contribute to poorer cognition in Alzheimer's Disease Neuroimaging Initiative participants. 20
While some prior MRI/PET imaging studies in other cohorts have suggested no association between white matter lesion volume and tau PET ([18F]flortaucipir) SUVR,9,10 our data suggest a weak negative correlation between these two imaging indices. Given the relatively narrow range of cognitive impairment in our cohort (as defined by the inclusion criteria for the Tauriel study) this likely reflects the independent and additive nature of white matter lesion and tau pathology on performance on screening assessments. It remains uncertain why other tau PET/MRI 20 and neuropathological studies7,8 yielded a different result (i.e., positive correlation between white matter lesion and tau pathology). The overall discrepancies across prior studies and the results reported here could potentially arise from the use of different methodologies for measuring tau pathology (e.g., PET versus immunostaining), but are more likely attributable to the examination of different neuroanatomical regions. The tau PET studies have used SUVR data from an AD temporal meta-ROI,9,10 Braak III/IV ROI, 20 and a whole cortical gray ROI (current study), while the neuropathology studies have used global Braak staging 7 or neurofibrillary tangle counts across sections from the pre-frontal, mid-frontal, entorhinal, temporal, parietal, and occipital cortex. 8 Alternatively, the relationships between tau and white matter lesion pathology may also evolve across different stages of AD progression as tau pathology accumulates. Prior tau PET/MRI cohorts9,10,20 have consisted of exclusively/predominantly non-demented participants with a large percentage of cognitively normal controls, while our study cohort consists of approximately 35% prodromal AD and 65% mild AD participants and the neuropathological studies have included autopsy samples from participants with AD and/or other dementias with modestly 7 or markedly 8 poorer MMSE scores than seen in our study cohort. Tau and white matter lesion pathology may be relatively independent at earlier stages of clinical AD (characterized by relatively less tau-related neurodegeneration), but in cohorts of greater clinical severity (characterized by correspondingly greater tau-related neurodegeneration), a positive correlation could emerge if increasing proportions of white matter lesions arise from Wallerian degeneration.
Our results from this rigorously defined clinical trial population are consistent with prior cross-sectional 35 and prognostic 13 analyses of baseline [18F]GTP1 SUVR from a broader observational sample of participants ranging from cognitively normal to moderate AD dementia and with prior analyses in other cohorts using other tau PET tracers indicating that higher baseline tau PET SUVR correlate with faster cognitive 12 and functional decline. 36 Univariate analyses suggested that the cross-sectional and prognostic correlations seen with primarily cognitive endpoints (ADAS-Cog13, RBANS, MMSE) were numerically stronger than those seen with endpoints that explicitly incorporate a functional component (CDR-SB, ADCS-ADL). One potential explanation for this pattern is that functional decline in AD is most closely associated with frontal lobe dysfunction 37 and tau PET SUVRs increase in the frontal lobe at relatively later stages of disease. 27 However, prior tau PET studies in AD have not consistently identified correlations between frontal lobe SUVRs and functional impairment.38,39
The univariate correlations between WMHypo volumes and clinical endpoints were numerically lower in magnitude and less consistent than those observed with tau PET SUVRs. Nevertheless, our use of WMHypo volumes to estimate white matter lesion burden yielded generally comparable results to other methodologies in demonstrating cross-sectional and prognostic associations with cognitive and functional decline.40–44 Virtually all of these prior analyses used clinical diagnoses of MCI and AD dementia, without biomarker confirmation, raising the possibility that a proportion of those participants may have had cognitive impairment driven by vascular or other non-AD pathologies. While our cohort has greater specificity, given the inclusion criterion requiring Aβ positivity by CSF and/or PET, it also may have less sensitivity to detect correlations with white matter lesion burden, given the exclusion of participants with more severe cerebrovascular disease and white matter lesions on MRI as well as the use of T1 WMHypo volumes, which have less dynamic range than T2 FLAIR white matter hyperintensity volumes.
Closer examination of the univariate WMHypo volume correlations raises the possibility of numerically stronger associations, particularly prognostically, in the pAD subgroup. Previous reports have also suggested stronger prognostic associations for clinical decline with white matter lesions in MCI relative to AD. 43 In our cohort, the pAD and mAD subgroups exhibited similar WMHypo volumes, but the mAD subgroup had significantly higher [18F]GTP1 SUVRs. The relatively greater burden of white matter lesion pathology (as a proportion of combined white matter lesion and tau pathology) in pAD could explain the suggestion of stronger associations in this subgroup.
The univariate prognostic correlation data also suggest that relatively stronger associations were seen between WMHypo volumes and endpoints that incorporate functional decline (CDR-SB, ADCS-ADL) relative to those that focus on cognitive decline (ADAS-Cog13, RBANS, MMSE). Likewise, the multivariate prognostic models confirm that baseline WMHypo volumes only independently predicted subsequent rates of decline on the CDR-SB and ADCS-ADL. These results contrast with the opposite pattern of associations seen with tau PET SUVR but may have the same underlying explanation: the role of frontal lobe dysfunction in functional decline. 37 Whereas relatively lower frontal tau PET SUVR are seen in prodromal-to-mild AD, 27 regional analyses of white matter lesions in a cohort of biomarker-positive AD participants with comparable MMSE scores indicate that the largest white matter lesion volumes are observed in the frontal lobe. 45 Other work has also identified an association between frontal white matter lesions and functional impairment. 41
There are limitations to this study beyond those described above that may impact the interpretation of our data. Participants in the Tauriel study were predominantly White. Since both white matter lesion volumes and their relationship with subsequent cognitive decline appear to differ by race,46,47 our results may be less generalizable to non-White study populations. Our analyses incorporated global measurements of tau PET SUVRs and white matter lesion volumes to determine cross-sectional and prognostic associations with clinical assessments. Focused regional analyses could yield further insights, particularly for individual cognitive and functional domains, and should be explored in future work. However, in prior studies with [18F]GTP1, cross-sectional and prognostic correlations with clinical outcomes using whole cortical gray SUVRs were comparable to or stronger than those observed in smaller, more AD-specific ROIs.13,35 Finally, our prognostic associations were derived from a relatively short 18-month follow-up period. Longer follow-up intervals may be needed to see more robust prognostic associations, particularly for white matter lesions versus cognition in participants with AD dementia. 43
Our results indicate that both greater baseline tau PET SUVRs and white matter lesion volumes are independently associated with faster rates of subsequent decline across a range of clinical measurements in prodromal-to-mild AD. The relative magnitudes of these prognostic associations may differ across clinical domains and across participant populations. Future prognostic modeling work in AD should consider including these imaging indices, when available, along with other clinical variables to help increase predictive accuracy.
Supplemental Material
sj-docx-1-alz-10.1177_13872877241302497 - Supplemental material for Cross-sectional and prognostic associations of baseline [18F]GTP1 tau PET signal and white matter lesion volumes for cognitive and functional decline in prodromal-to-mild Alzheimer's disease
Supplemental material, sj-docx-1-alz-10.1177_13872877241302497 for Cross-sectional and prognostic associations of baseline [18F]GTP1 tau PET signal and white matter lesion volumes for cognitive and functional decline in prodromal-to-mild Alzheimer's disease by Nancy E Ruiz-Uribe, Paul Manser, Brandon Butcher, Yihao Li, Mira Blendstrup, Suzanne Baker, Sandra Sanabria Bohorquez and Edmond Teng in Journal of Alzheimer's Disease
Footnotes
Acknowledgments
We thank the patients and their families who took part in the study, as well as the staff, research coordinators, and investigators at each participating institution. Writing assistance provided by Genentech, Inc.
Author contributions
Nancy E Ruiz-Uribe (Data curation; Formal analysis; Writing – original draft; Writing – review & editing); Paul Manser (Data curation; Formal analysis; Writing – review & editing); Brandon Butcher (Data curation; Formal analysis; Writing – review & editing); Yihao Li (Data curation; Formal analysis; Writing – review & editing); Mira Blendstrup (Conceptualization; Project administration; Supervision; Writing – review & editing); Suzanne Baker (Conceptualization; Data curation; Formal analysis; Visualization; Writing – review & editing); Sandra Sanabria Bohorquez (Conceptualization; Data curation; Formal analysis; Visualization; Writing – original draft; Writing – review & editing); Edmond Teng (Conceptualization; Data curation; Formal analysis; Investigation; Methodology; Project administration; Supervision; Writing – original draft; Writing – review & editing).
Funding
The authors disclosed receipt of the following financial support for the research, authorship, and/or publication of this article: This work was funded by Genentech, Inc.
Declaration of conflicting interests
The authors declared the following potential conflicts of interest with respect to the research, authorship, and/or publication of this article: Nancy E Ruiz-Uribe is a former employee of Genentech, Inc.
Paul Manser and Brandon Butcher are former employees of Genentech, Inc. and former shareholders of F. Hoffmann La Roche, Ltd.
Mira Blendstrup, Yihao Li, Sandra Sanabria Bohorquez, and Edmond Teng are employees of Genentech, Inc. and shareholders of F. Hoffmann La Roche, Ltd.
Suzanne Baker is an employee of Genentech, Inc.
Data availability
Qualified researchers may request access to individual patient level clinical data through a data request platform. At the time of writing this request platform is Vivli: https://vivli.org/ourmember/roche/. For up-to-date details on Roche's Global Policy on the Sharing of Clinical Information and how to request access to related clinical study documents, see here: ![]() . Anonymized records for individual patients across more than one data source external to Roche cannot, and should not, be linked due to a potential increase in risk of patient re-identification.
. Anonymized records for individual patients across more than one data source external to Roche cannot, and should not, be linked due to a potential increase in risk of patient re-identification.
Supplemental material
Supplemental material for this article is available online.
References
Supplementary Material
Please find the following supplemental material available below.
For Open Access articles published under a Creative Commons License, all supplemental material carries the same license as the article it is associated with.
For non-Open Access articles published, all supplemental material carries a non-exclusive license, and permission requests for re-use of supplemental material or any part of supplemental material shall be sent directly to the copyright owner as specified in the copyright notice associated with the article.