
Abstract
Background
Alzheimer's disease (AD) is a complex neurodegenerative disorder with intricate pathophysiological mechanisms. Transcriptome analysis has been used to investigate the pathogenesis of AD from the perspectives of mRNA expression, alternative splicing, and alternative polyadenylation. However, these 3 transcriptomic regulatory layers have not been comprehensively explored, limiting our understanding of the transcriptomic landscapes of AD pathogenesis.
Objective
We aimed to describe the transcriptomic landscapes of AD pathogenesis, detect the contributions of different regulatory layers to the total transcriptional variance, and identify diagnostic candidates for AD prediction.
Methods
We collected RNA sequencing data derived from the temporal lobes of 257 patients with AD and 97 controls, performed joint transcriptional analysis with multi-omics factor analysis (MOFA2) and weighted gene co-expression network analysis (WGCNA), and evaluated the signals with regression models.
Results
We found that increasing Braak stage is associated with progressive downregulation of SYT1, CHN1, SNAP25, VSNL1, and ENC1 as well as upregulation of TNS1, SGK1, CPM, PPFIBP, and CLMN. Subsequent MOFA2 revealed that alternative splicing contributes most (R2 = 0.558) to the transcriptional variance between patients with AD and controls followed by alternative polyadenylation (R2 = 0.449) and mRNA expression (R2 = 0.438). In addition, the regression model constructed with SNAP25, VSNL1, and ENC1 expression could distinguish between patients with AD and controls (AUC = 0.752).
Conclusions
We systematically detailed the transcriptional landscapes in patients with AD and report mRNA signals associated with AD, offering novel insights into AD pathogenesis and therapeutic development.
Keywords
Introduction
Alzheimer's disease (AD) is a complex neurodegenerative disorder that involves multiple interconnected factors. It is difficult to diagnose AD before symptoms appear because of its gradual onset. 1 It is also challenging to ameliorate or reverse disease progression. 2 Extracellular amyloid-β (Aβ) plaque deposition and intracellular neurofibrillary tangles—the 2 pathological hallmarks of AD—are associated with global disruption of RNA processing, including mRNA expression, alternative splicing (AS), alternative polyadenylation (APA), and other factors. Genome-wide association studies have identified more than 30 AD risk genes; gene variants of 27 of these are associated with altered mRNA expression in the blood and brain. 3 Moreover, several abnormal AS processes of specific genes can contribute to the incidence of AD by affecting neuronal functions, such as synaptic transmission and ion channel gene expression. 4 In addition, APA dysregulation can contribute to the occurrence of AD by generating mRNA 3′-UTR isoforms with potentially altered stability, subcellular localization, and translation efficiency. 5 Thus, these transcriptomic regulatory layers complicate pathological research on AD.
Advances in high-throughput transcriptomic technology have yielded unbiased and comprehensive RNA profiles on a genome-wide scale, including mRNA expression, AS, and APA. Accordingly, such technology is widely used to investigate the pathogenesis of AD. 6 Meanwhile, the application of RNA sequencing (RNA-seq) to analyze mRNA expression has enhanced our understanding of diseases and provided insights into the expression patterns of numerous genes. 7 Analysis of mRNA expression profiles in the amygdala and cingulate cortex in the AD brain has revealed several pathogenic mechanisms related to the development of AD, such as chronic inflammation, oxidative stress, mitochondrial dysfunction, impaired proteasomal activity, abnormal phosphorylation, and dysregulated cell cycle signaling. 8 Moreover, advancements in transcriptome analysis have provided insights into the roles of aberrant AS in the pathogenesis of AD. 4 For example, pathological splicing of MAPT results in an aberrant 3R-tau/4R-tau isoform ratio, 9 and abnormal splicing of APP leads to increased production of Aβ42 10 —both of which contribute to the development of AD. In addition, APA dysregulation might cause inefficient mRNA expression of genes, such as COX-2, 11 MAPT, 12 and APP, 13 which might ultimately lead to AD. At present, RNA-seq analysis using mature analytical workflows can provide relatively comprehensive insights into mRNA expression and AS. However, analysis of APA remains limited primarily because of inadequate software, low accuracy, and inadequate sequencing depth, which hinder the detection of APA. Given that mRNA expression, AS, APA, and other mechanisms collectively contribute to gene expression, it is imperative to integrate these transcriptomic regulatory layers when investigating disease mechanisms. Nevertheless, such integrated analysis of these aspects in AD is lacking.
Therefore, in the present study, we conducted differential analysis of 3 transcriptomic regulatory layers—mRNA expression, AS, and APA—between patients with AD and controls using RNA-seq data from the temporal lobe. We identified 10 key genes associated with AD progression using weighted gene co-expression network analysis (WGCNA). Furthermore, joint analysis of the 3 layers using multi-omics factor analysis (MOFA2) revealed the different contributions of each layer to the transcriptional variance between patients with AD and controls. Finally, both MOFA2 and WGCNA showed that signals of SNAP25, VSNL1, and ENC1 can accurately distinguish patients with AD from controls. Taken together, these findings deepen our understanding of the impacts of different transcriptomic regulatory layers on the pathogenesis of AD.
Methods
Data collection and curation
To collect the RNA-seq data of patients with AD and controls, we searched the GEO database using the following keywords: “(Homo sapiens [Organism]) AND (Expression profiling by high throughput sequencing [DataSet Type]) AND (Alzheimer).” Then, we collected RNA-seq data derived from the brain tissues or blood of patients with AD, patients with mild cognitive impairment, or controls. Finally, we obtained 16 publicly accessible datasets (Supplemental Table 1).14–29
We subsequently curated the following phenotypes of samples from each dataset: health state, brain bank location, age, brain region, and Braak stage. We also used an in-house program to infer and categorize the apolipoprotein E (APOE) genotype of samples as having 0, 1, or 2 APOE ε4 alleles based on read information. We evaluated the predictive accuracy of the program using 206 samples with known APOE ε4 allele numbers, achieving an accuracy of 0.87. To standardize the sample sources and obtain comparable sample numbers, we consolidated the dorsolateral prefrontal cortex and prefrontal cortex into “prefrontal cortex”; consolidated blood and extracellular vesicles from plasma into “blood”; consolidated the middle temporal gyrus, lateral temporal lobe, and fusiform gyrus into “temporal lobe”; and incorporated the inferior parietal lobule into “parietal lobe.” We imputed the missing values of all phenotypes using the kNN() function with k = 15 30 in the VIM package.
Raw data preprocessing
To obtain high-quality data for downstream analysis, we performed data filtration as follows: quality assessment using FastQC (version 0.11.9); low-quality read filtering using PRINSEQ++ (version 1.2) 31 with the parameter, lc_dust = 0.5; read alignment to the GRCh38 reference genome using STAR (version 2.7.4a) 32 with the parameters, –readFilesCommand zcat, –twopassMode Basic, –outSAMstrandField intronMotif, –outSAMtype BAM, and –SortedByCoordinate; and index construction using Samtools (version 1.6) 33 with the default parameters.
Analysis of mRNA expression
After RNA-seq data filtration, we counted the aligned reads for each gene using FeatureCounts (version 2.0.1) 34 with the parameters, -p, -B, and -C. We then converted the read numbers into fragments per kilobase of transcript per million mapped reads (FPKM). We assessed the impacts of environmental factors on gene expression by multivariate analysis of variance (MANOVA) with the vegan package in R and visualized the sample distributions by principal component analysis (PCA) with the DESeq2 package in R. 35 Before performing group comparisons across datasets, we removed the batch effect using the sva package in R. We also used DESeq2 35 to filter out genes with less than 0.5 counts per million in at least 20 samples. We detected mRNA based on differential gene expression (i.e., p adj < 0.05 and |log2(fold-change)| > 0.585) followed by Gene Ontology (GO) and Kyoto Encyclopedia of Genes and Genomes (KEGG) enrichment analysis. Finally, we visualized the top 15 enriched GO terms and KEGG pathways (i.e., p adj < 0.1) using the clusterProfiler package in R. 36
The ɛ4 allele of APOE is the most robust and prevalent genetic risk factor for late-onset AD. 37 Carrying the APOE ε4 allele can increase AD risk by destabilizing the APOE ε4-Aβ complex, thereby impairing Aβ clearance and promoting amyloid deposition and tau phosphorylation. 38 To identify the effects of the APOE ε4 allele on gene expression, we divided all temporal lobe samples into 3 groups according to whether they had 0, 1, or 2 APOE ε4 alleles. We subsequently used DESeq2 35 to conduct differential gene expression analysis and compare the groups with 1 or 2 APOE ε4 alleles with the group with 0 APOE ε4 alleles. We selected differentially expressed genes according to statistical significance (i.e., p adj < 0.01). We performed KEGG enrichment analysis using these differentially expressed genes and visualized the top 7 enriched KEGG pathways (i.e., p adj < 0.1) using the clusterProfiler package in R. 36
Alternative splicing analysis
We used LeafCutter (version 0.2.9) 39 for AS analysis, including intron clustering and intron count acquisition. After obtaining the intron counts, we performed voom-based normalization and removed the batch effect using the limma package in R. 40 We then examined and visualized the data by MANOVA and PCA, respectively. Similar to the strategy for mRNA analysis above, we selected genes with differential AS (i.e., p adj < 0.05 and |log2(fold-change)| > 0.1), performed GO and KEGG enrichment analysis on the selected genes, and visualized the top 15 GO terms and KEGG pathways (i.e., p adj < 0.1).
To annotate the AS type of the differential AS genes, we developed a Python script based on the annotation principle of LeafCutter. 39 First, we sorted all introns within a cluster according to their starting positions. Second, we checked for exons between the minimum and maximum positions in the cluster. Finally, we generated plots of all exons and intron positions in the cluster and assessed the types of alternative splicing events.
Alternative polyadenylation analysis
Utilizing bedtools (version 2.30.0), 41 we converted the BAM files into WIG format and performed APA analysis using Dapars 0.9. 42 We determined distal poly(A) sites using extracted 3′-UTR information from the GRCh38 reference genome with DaPars_Extract_Anno.py and calculated the percentage of the distal poly(A) site usage index (PDUI) using DaPars_main.py. After obtaining the PDUI profile, we removed the batch effect using the limma package in R, examined the impacts of environmental factors by MANOVA, and visualized the results by PCA. We identified genes with differential APA (i.e., p adj < 0.05 and |PDUICTL − PDUIAD| > 0.1) by performing the Wilcoxon test with Benjamini–Hochberg adjustment, selected them for GO and KEGG enrichment analysis, and visualized the top 15 GO terms and KEGG pathways (i.e., p adj < 0.1).
Weighted gene co-expression network analysis
We constructed a gene co-expression network with the differentially expressed genes (i.e., p adj < 0.05 and |log2(fold-change)| > 0.585) using WGCNA. 43 We performed unsupervised clustering, which clustered the genes into 3 modules each representing a group with interconnected genes. To understand the physiological significance of the modules, we determined the correlations of the 3 module eigengenes with 4 phenotypic traits—Braak stage, age, brain bank location, and APOE genotype—and extracted the strongest correlations (i.e., r > 0.3). We subsequently selected key genes for each module based on the following criteria: (a) correlation coefficients between genes and modules >0.8 and (b) correlation coefficients between genes and phenotypes >0.3. Among these genes, we selected the top 5 genes with the highest FPKM and examined their distributions across different phenotypes.
Multi-omics factor analysis
To explore the transcriptomic characteristics of AD, we employed MOFA2: a statistical method for integrating multiple modalities of omics data using an unsupervised strategy. We prepared the top 5000 features of mRNA expression, AS, and APA based on ascending p-values for model training. We carried out model training using the following parameters: drop_factor_threshold = −1, maxiter = 1000. We configured the model with the parameter, num_factors = 15. These factors represent major sources of variation across data modalities, thereby facilitating the identification of groups of samples. We then performed Spearman's correlation analysis between the first 5 latent factors and Braak stage, age, brain bank location, and APOE genotype. To quantify the contributions of features to each latent factor, MOFA2 assigns features with latent factor loadings that indicate their correlation with the aforementioned latent factor. The loadings are then transformed into Z-scores and visualized in 3 layers. We further selected highly representative features (i.e., absolute transformed loading >0.3), performed KEGG enrichment analysis to explore their functions, and visualized the top 5 enriched pathways (i.e., p adj < 0.1). In addition, we screened the top 10 features of latent factor 1 in each layer for KEGG enrichment analysis to explore their functions and visualized the top 5 enriched pathways (i.e., p adj < 0.1).
Construction of classification models
Using the genes shared between MOFA2 and WGCNA, we constructed a logistic regression model to classify patients with AD and controls. We also constructed respective classification models with the key genes identified by WGCNA, differential AS analysis, and differential APA analysis. We used a 6-fold, cross-validation strategy for model validation: 5 folds for the training datasets and 1-fold for the validation dataset. By adopting the glm function in R, we established logistic regression models using the training datasets, (Y∼glm(X)), followed by model validation using the validation dataset. During model construction, X represents FPKM, normalized reads, or PDUI, while Y represents the category. We constructed receiver operating characteristic (ROC) curves and calculated areas under the curve (AUCs) to assess the models’ classification performance.
Transcriptional regulation analysis
We used the RcisTarget R package 44 to explore the transcriptional regulation of genes. Initially, RcisTarget identified motifs that exhibited significant overrepresentation within the 500-bp upstream and 100-bp downstream regions of the transcription start sites for SNAP25, ENC1, and VSNL1. We subsequently retained the transcription factors directly annotated to the motifs according to the following criteria: normalized enrichment score >0.3 and area under the curve >0.5. We obtained the transcription factor annotation database from Stein Aerts’ lab. Finally, we visualized motifs bound by more than one transcription factor.
Results
Characteristics of patients with Alzheimer's disease
We collected 781 samples from 16 RNA-seq datasets (Figure 1) and retained the following 8 traits for the samples: age, brain bank location, brain region, health state, APOE genotype, Braak stage, read length, and library layout. We then examined the phenotypic distributions of the samples, which revealed several epidemiological patterns (Supplemental Figure 1). Braak stage was a pathological indicator of AD, with higher values indicating more severe AD progression. Patients with AD were predominantly in the neocortical Braak stage, whereas the controls were mostly Braak stage 0 (Supplemental Figure 1A). APOE genotype was differentially distributed between patients with AD and controls. Among the 283 controls, 197, 51, and 1 had 0, 1, and 2 APOE ε4 alleles, respectively; among the 493 patients with AD, 214, 191, and 47 had 0, 1, and 2 APOE ε4 alleles, respectively (Supplemental Figure 1E).
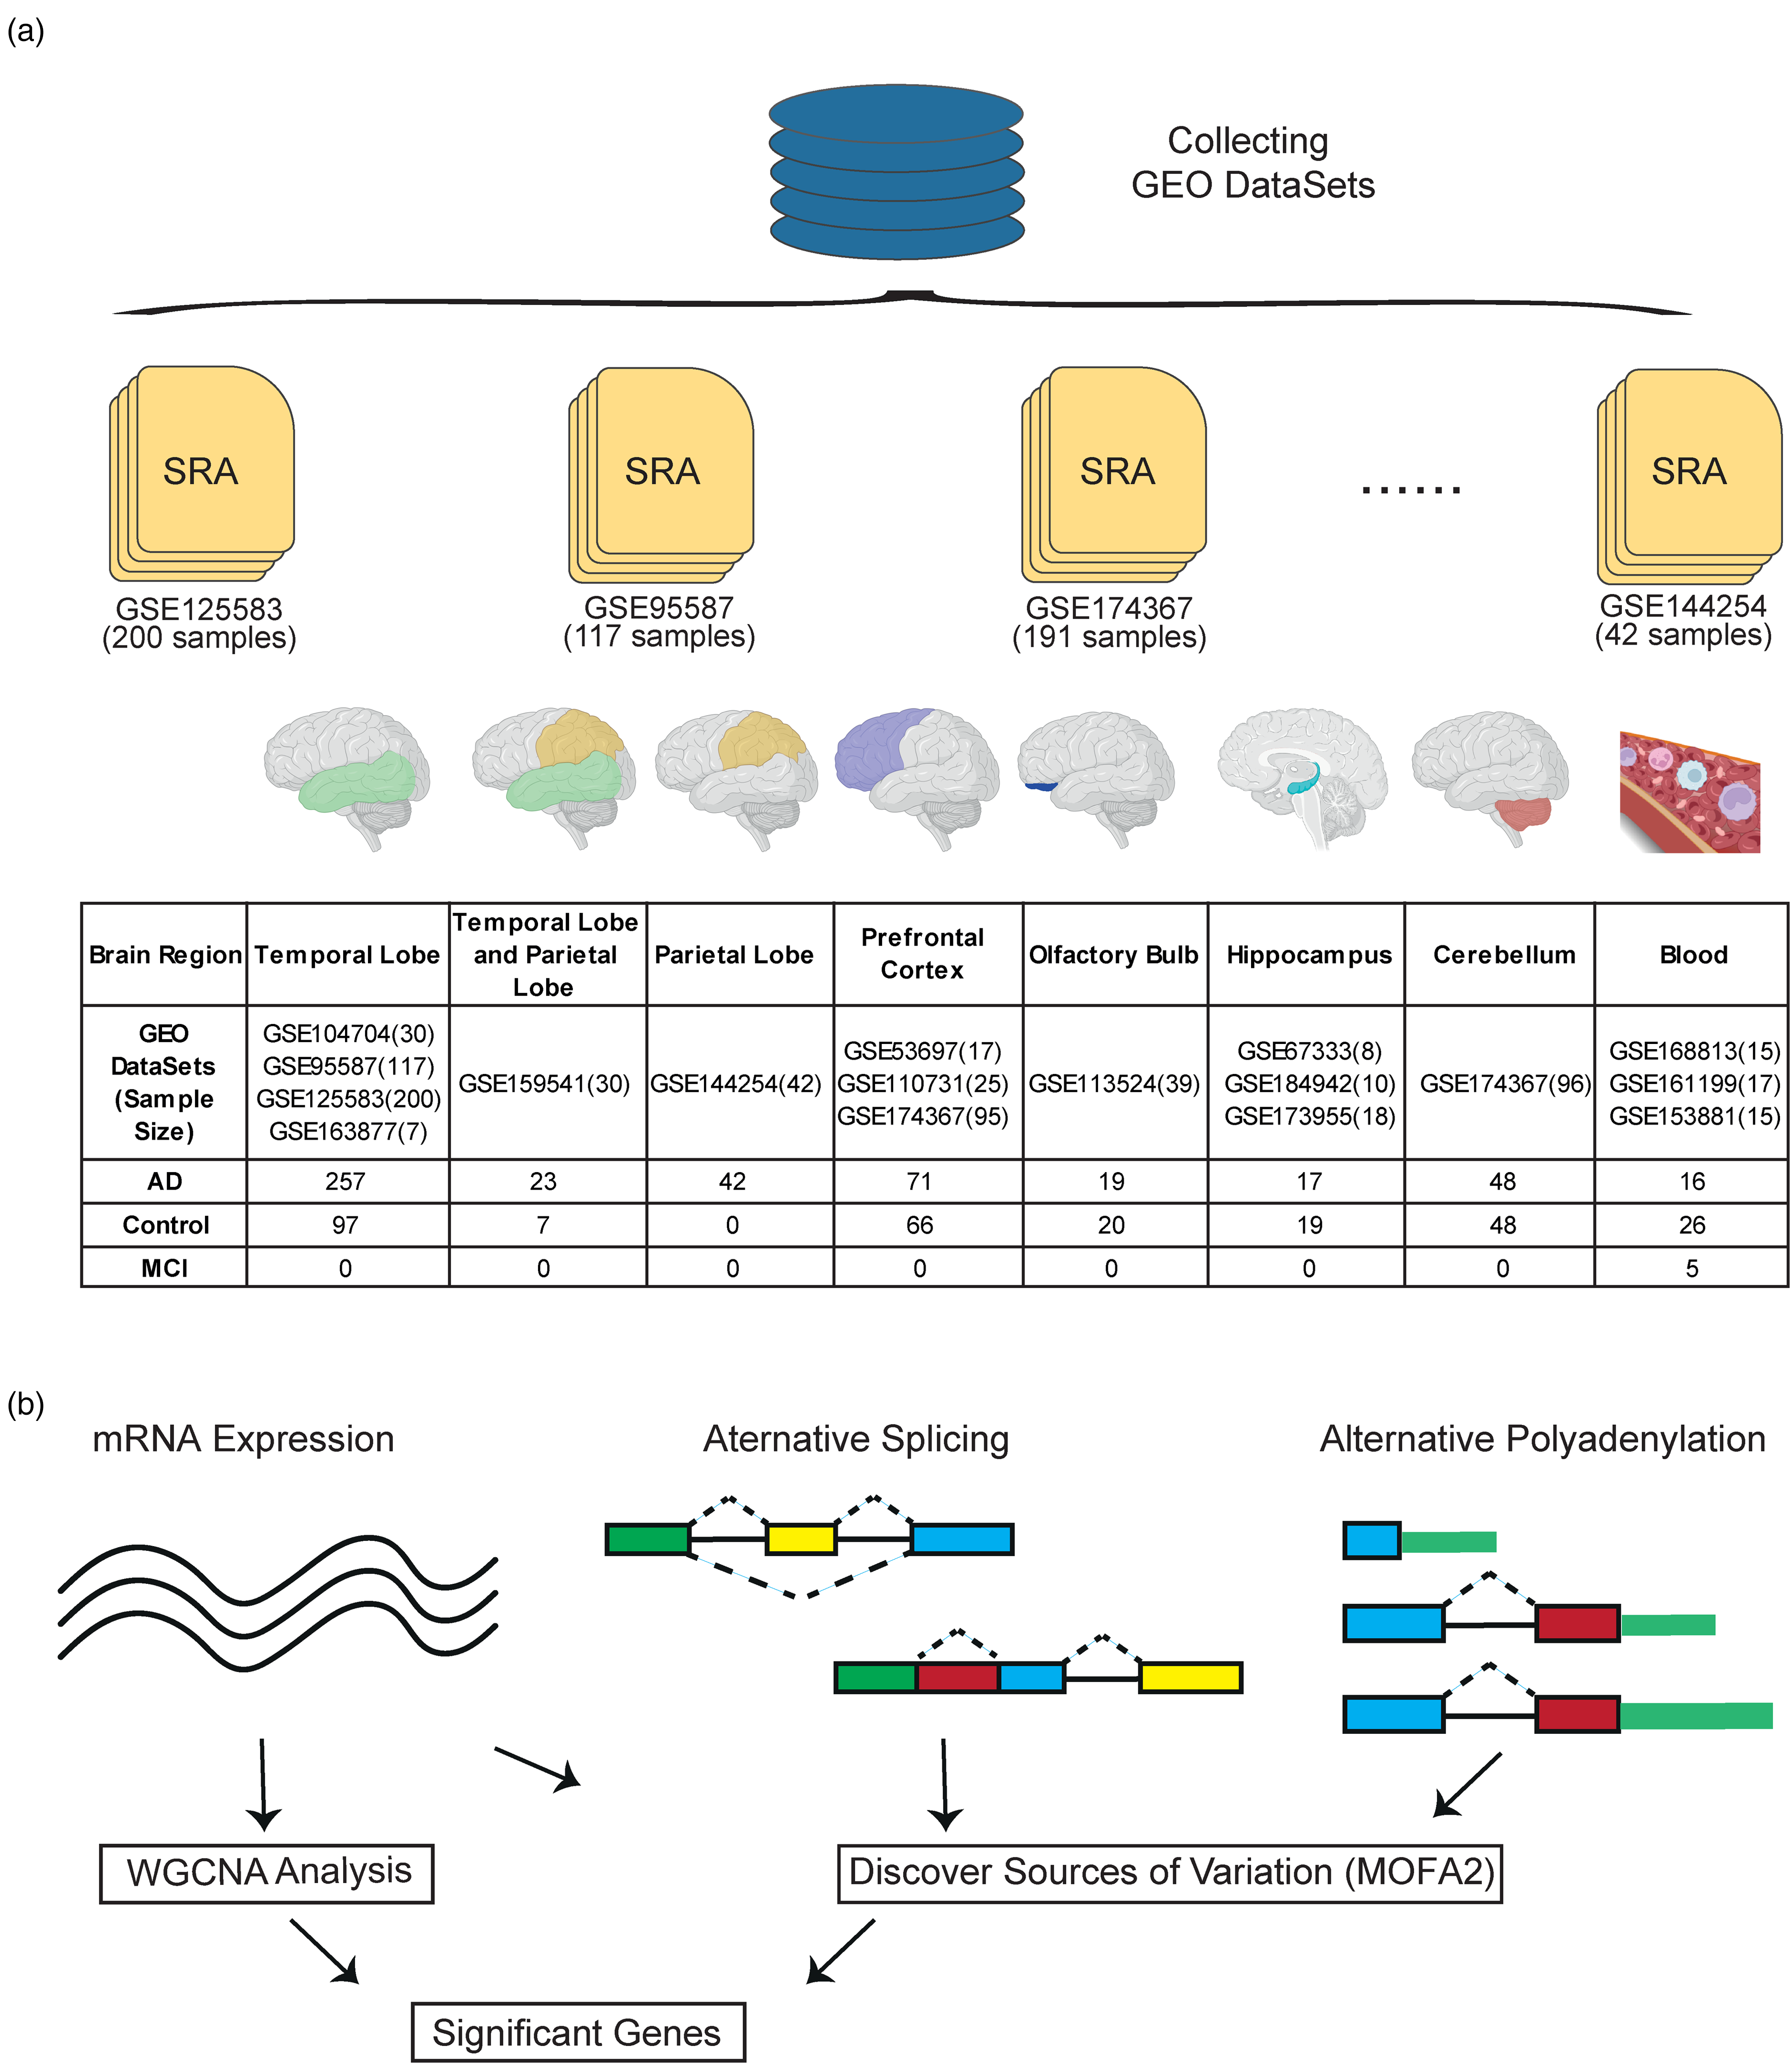
Experimental workflow. (a) Data retrieved from the GEO database. We collected and normalized all relevant RNA sequencing datasets containing patients with Alzheimer's disease (AD) and controls from different brain regions, including the temporal lobe, parietal lobe, temporal and parietal lobes, prefrontal cortex, olfactory bulb, hippocampus, cerebellum, and blood. (b) Analytical schemata applied in this study. We explored the transcriptomic regulatory layers in AD by separately analyzing mRNA expression, alternative splicing (AS), and alternative polyadenylation (APA). We then identified key differentially expressed genes using weighted gene co-expression correlation network analysis (WGCNA) to reveal the contributions of the regulatory layers to transcriptional variance using multi-omics factor analysis 2 (MOFA2).
Patients with Alzheimer's disease exhibit differential gene expression in the temporal lobe
PCA and MANOVA of all samples revealed that brain region was the factor most responsible for the differential mRNA expression between patients with AD and controls (R2 = 0.049, p < 0.001; Figure 2(a) and Supplemental Figure 1F). As we had the most samples from the temporal lobe (n = 354; Supplemental Figure 1G), which is also the earliest brain region to exhibit atrophy in AD, we focused on this brain region for subsequent analysis of mRNA expression, AS, and APA. After removing the batch effect across datasets (Figure 2(b) and Supplemental Figure 2A), differential mRNA expression analysis identified 998 differentially expressed genes. Accordingly, we marked the top 5 up- and downregulated genes according to ascending p adj -value (Figure 2(c) and (d)). We performed KEGG enrichment analysis to examine the functional distributions of these differentially expressed genes. The top 15 enriched pathways included “Calcium signaling pathway,” “Ras signaling pathway,” and “cAMAP signaling pathway” (Figure 2(e)). In addition, we performed GO enrichment analysis and screened the top 15 enriched GO terms for the categories of “biological processes,” “cellular components,” and “molecular functions” (Figure 2(f)). Intriguingly, some GO terms enriched in the category of “biological processes” were associated with signal transduction in hosts, including the terms “signal release,” “modulation of chemical synaptic transmission,” and “regulation of trans-synaptic signaling.” Meanwhile, some GO terms in the category of “cellular components” were related to the structures of synapses and neurons, including “synaptic membrane,” “axon terminus,” and “transport vesicle membrane.” The GO terms in the category of “molecular functions” were related to cellular transport, including “monoatomic ion channel activity,” “monoatomic ion gated channel activity,” and “gated channel activity.” Taken together, our findings reveal the transcriptomic alterations in the temporal lobe in patients with AD.
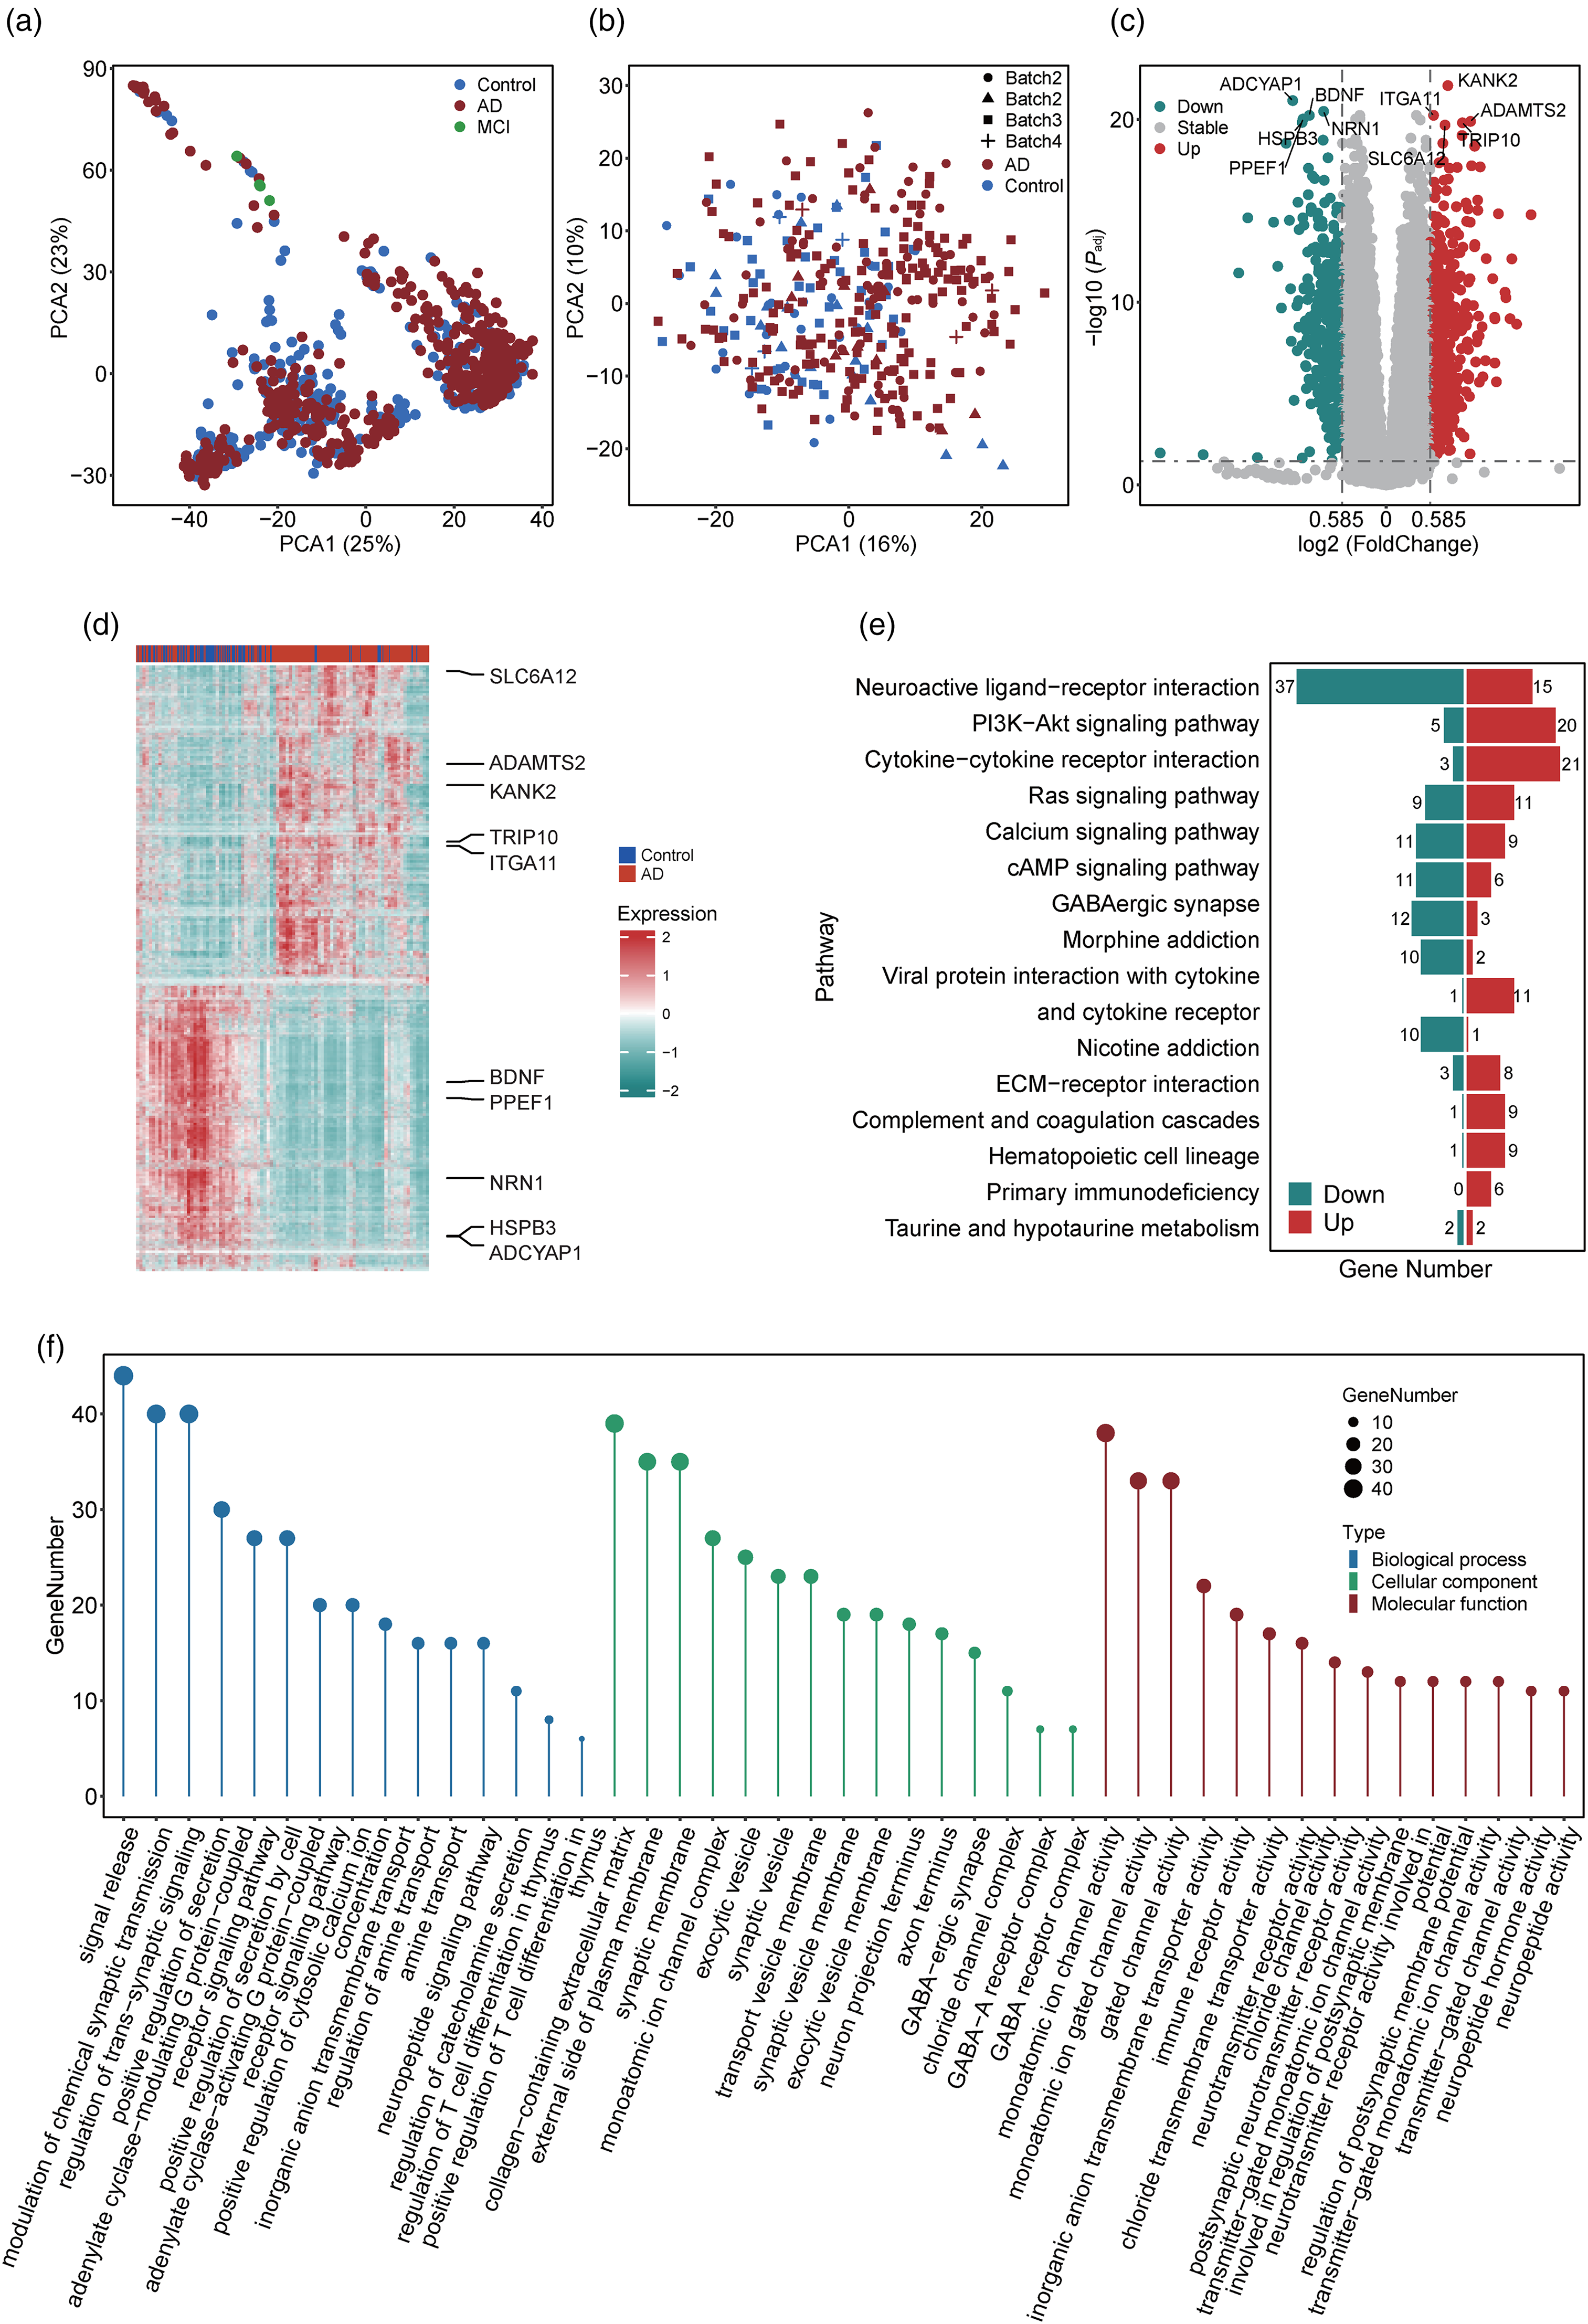
Differential mRNA expression analysis. (a) Principal component analysis (PCA) of all RNA sequencing data. Patients with Alzheimer's disease (AD), mild cognitive impairment (MCI), and controls are indicated by red, green, and blue dots, respectively. (b) PCA of mRNA expression data from the temporal lobe (TL). We removed the batch effect of mRNA expression data. Patients with AD and controls are indicated by red and blue, respectively. (c) Volcano plot of all genes. The top 5 upregulated and downregulated genes with the lowest adjusted p-values are marked. Upregulated, downregulated, and stable genes are indicated by red, green, and grey, respectively (d) Heatmap of differentially expressed genes. The top 5 upregulated and downregulated genes with the lowest adjusted p-values are marked. (e) Kyoto Encyclopedia of Genes and Genomes (KEGG) enrichment analysis of differentially expressed genes. The numbers of upregulated and downregulated genes for each pathway are labeled in red and green, respectively. (f) Gene Ontology (GO) enrichment analysis of differentially expressed genes. “biological process,” “cellular component,” and “molecular function” are indicated in blue, green, and red, respectively (Color figures available online).
Comparing gene expression among carriers with 1 or 2 APOE ε4 alleles to those with 0 alleles (Supplemental Figure 4A), we identified 3492 and 2361 differentially expressed genes, respectively (Supplemental Tables 5 and 6). Notably, the expression levels of SNAP25, ENC1, and VSNL1 decreased as the number of APOE ε4 alleles increased (Supplemental Figure 4B), suggesting that APOE ε4 is associated with the expression of these 3 genes. Furthermore, KEGG enrichment analysis revealed that these differentially expressed genes were involved in AD-related pathways, including “pathways of neurodegeneration-multiple diseases,” and “Alzheimer disease” (Supplemental Figure 4C).
The expression levels of key genes in the temporal lobe are associated with Braak stage
To further identify key genes associated with AD, we performed WGCNA to cluster genes with similar expression patterns into modules and identified key regulatory genes within each module. Accordingly, we clustered 998 differentially expressed genes into 3 modules containing 155, 570, and 273 genes (Figure 3(a)). Correlation analysis revealed that modules 2 and 3 were significantly associated with Braak stage and APOE genotype (module 2: r = 0.355 and 0.275, respectively; module 3: r = 0.363 and 0.249, respectively; Figure 3(b)). Therefore, we focused on the relationships of the genes in modules 2 and 3 with Braak stage and APOE genotype.
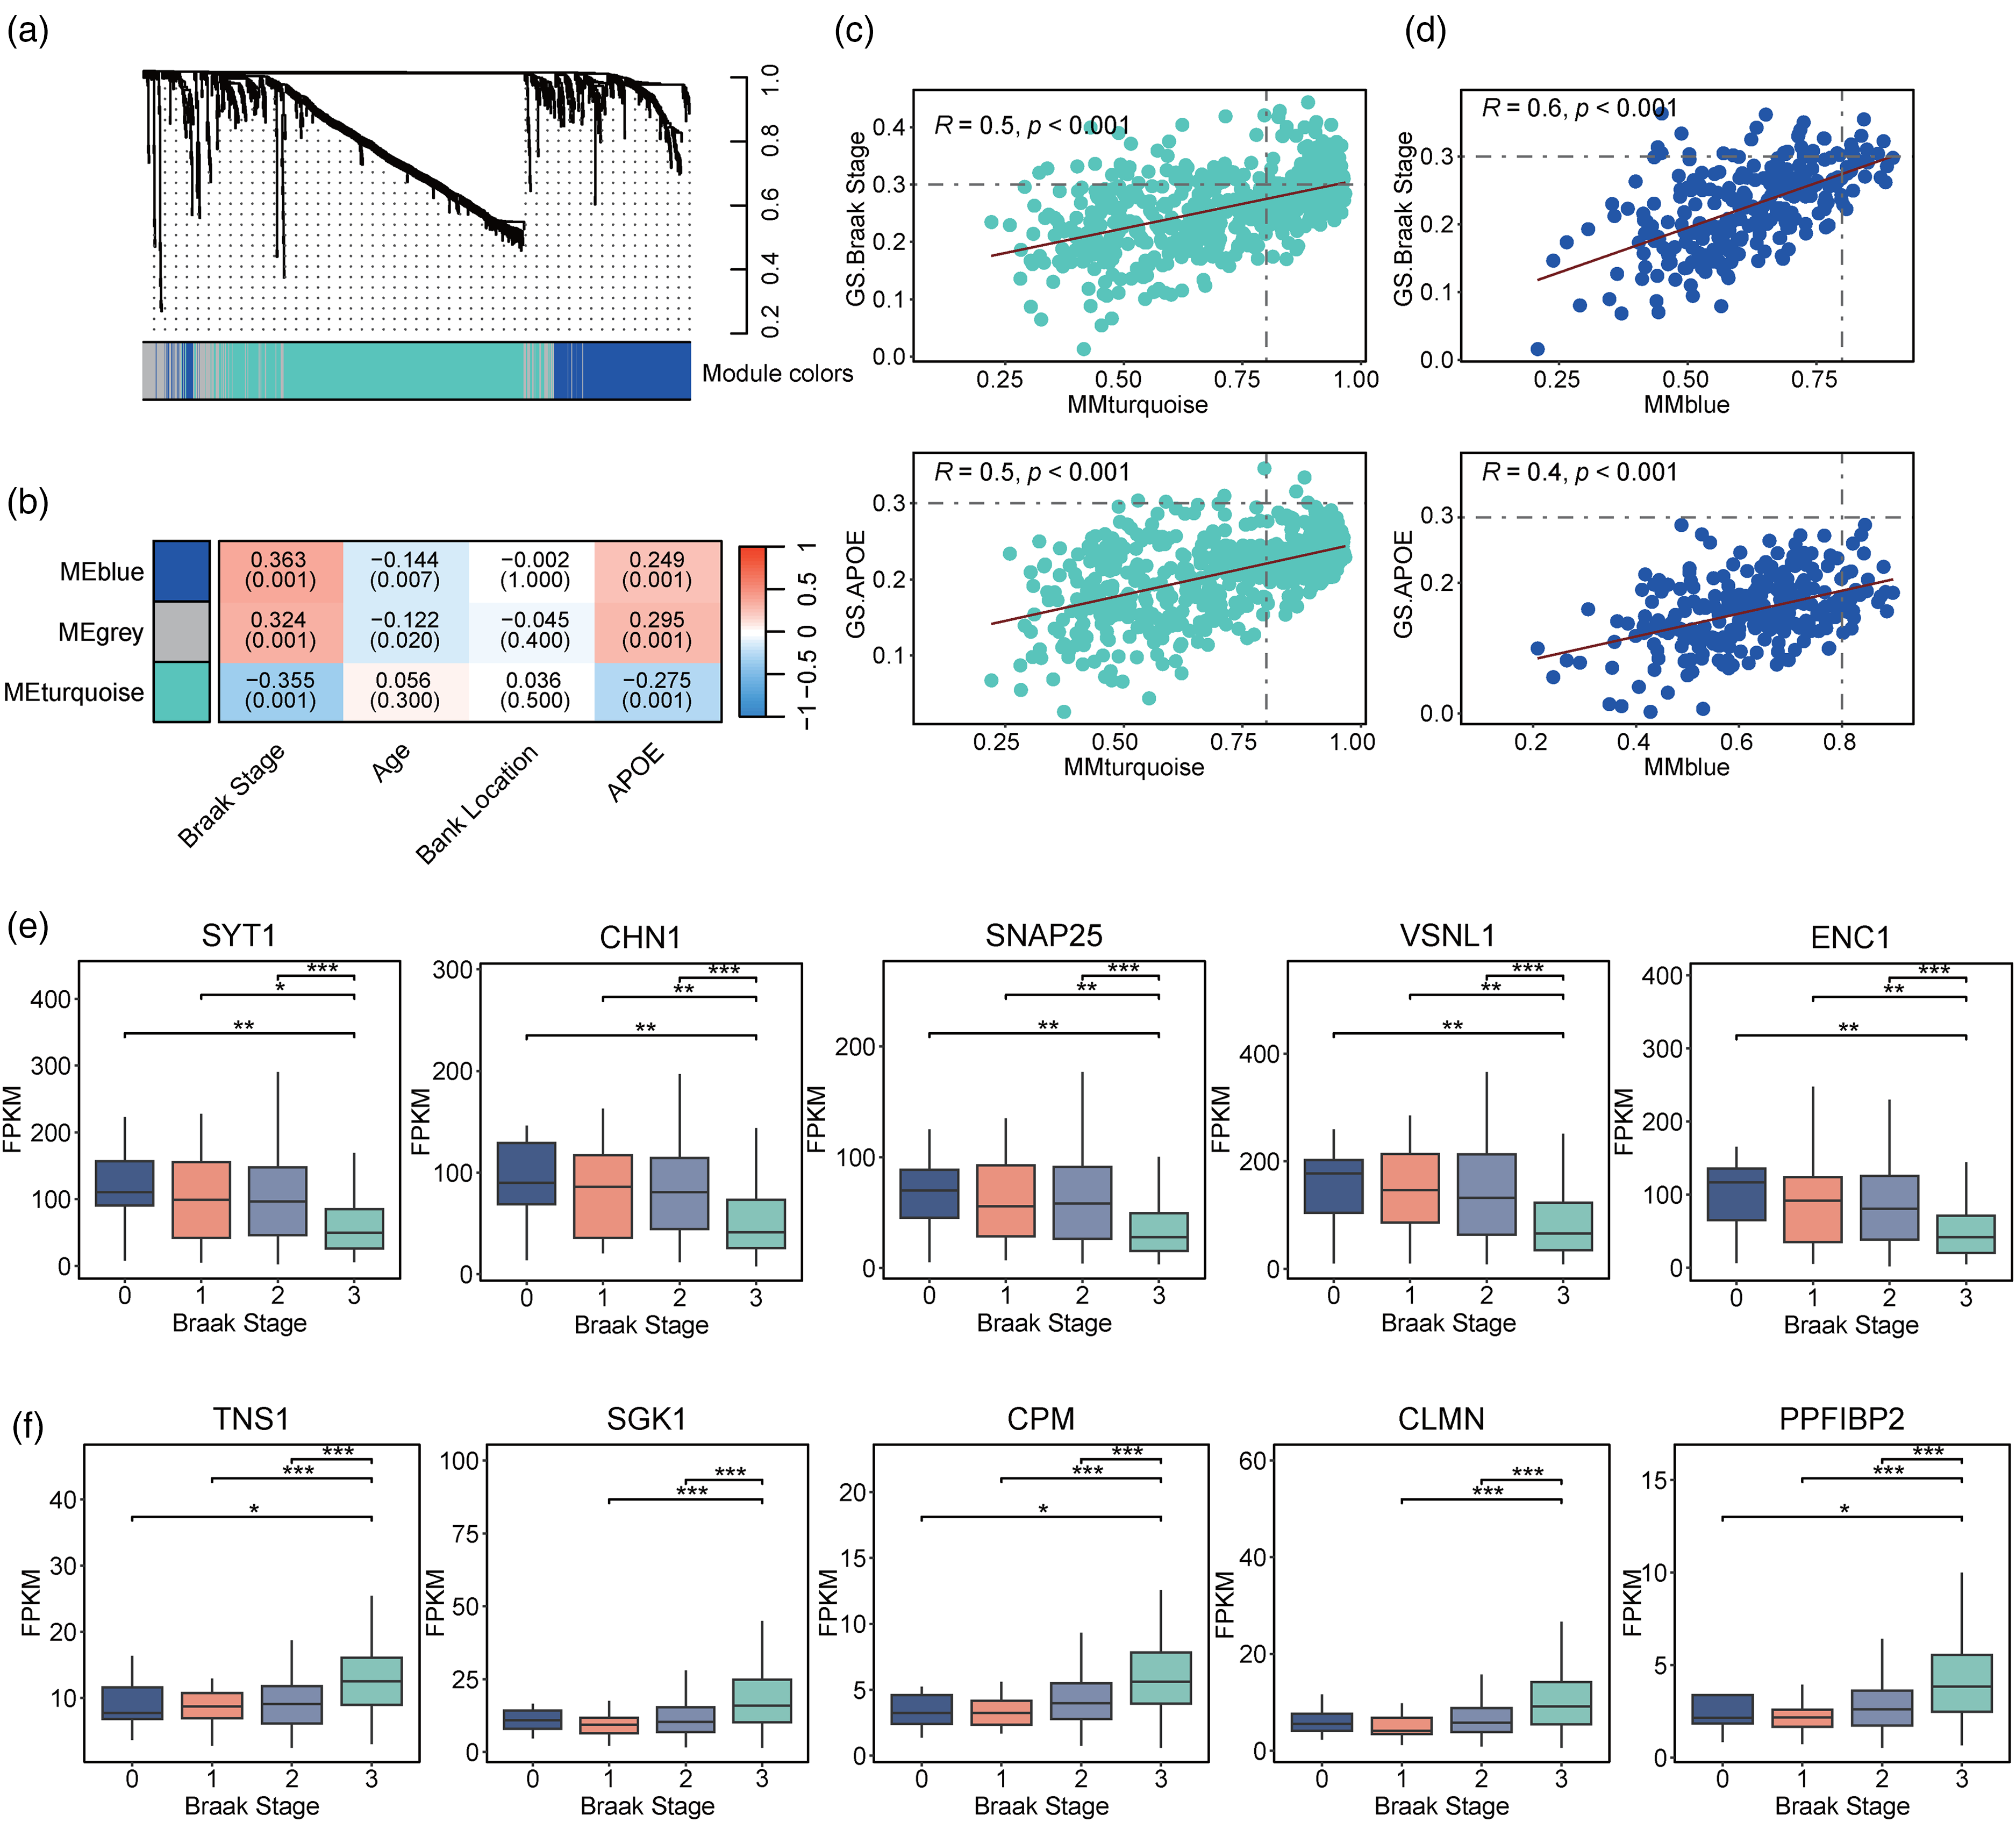
Weighted gene co-expression correlation network analysis of differentially expressed genes. (a) Weighted gene co-expression correlation network analysis (WGCNA) cluster dendrogram of differentially expressed genes in the temporal lobe (TL). (b) Correlations between the identified modules and phenotypes (i.e., Braak stage, age, brain bank location, and APOE genotype). Modules 1, 2, and 3 are labeled in grey, turquoise, and blue, respectively. Red and blue indicate positive and negative correlation coefficients, respectively. (c) Correlation plots of genes from module 2. X- and Y-coordinates represent the correlation coefficients between the genes and module 2, and between the genes and phenotypes (from top to bottom: Braak stage and APOE genotype), respectively. (d) Correlations of genes from module 3. X- and Y-coordinates represent the correlation coefficients between the genes and module 3, and between the genes and phenotypes (from top to bottom: Braak stage and APOE genotype), respectively. (d) Expression levels of the top 5 genes from module 2 in individuals with different Braak stages. We selected the top 5 genes with the highest fragments per kilobase of transcript per million mapped reads (FPKM) from module 2 and compared their expression levels among individuals with different Braak stages. (f) Expression levels of the top 5 genes from module 3 in individuals with different Braak stages. (Wilcoxon test: *p < 0.05, **p < 0.01, ***p < 0.001) (Color figures available online).
In module 2, we identified 101 genes strongly correlated with Braak stage, and 3 genes, ADCYAP1, LINC01182, and RPH3A, strongly correlated with the APOE genotype (Figure 3(c)). Among the above 104 genes in this module, the top 5 with the highest expression levels—SYT1, CHN1, SNAP25, VSNL1, and ENC1—were selected as the key genes. Notably, these key genes were found to be downregulated in patients with AD (Supplemental Figure 3A). Furthermore, decreased expression levels of these 5 genes were associated with increasing Braak stage, suggesting more severe neurofibrillary tangles in AD (Figure 3(e)). 45 In module 3, there were 9 and 0 genes that were significantly correlated with Braak stage and APOE genotype, respectively (Figure 3(d)). The top 5 genes with the highest expression levels in module 3—TNS1, SGK1, CPM, CLMN, and PPFIBP2—were designated the key genes in that module and were upregulated in patients with AD (Supplemental Figure 3B). Notably, these 5 genes exhibited higher expression levels with increasing Braak stage (Figure 3(f)). Thus, we identified 10 key genes in the temporal lobe whose mRNA expression levels are associated with indicators of AD progression.
Patients with Alzheimer's disease exhibit differential alternative splicing and polyadenylation in the temporal lobe
After data normalization and batch effect removal (Figure 4(a) and Supplemental Figure 2B), we identified 369 genes with differential AS (Figure 4(b) and (d)) and conducted GO enrichment analysis to explore their functional distributions (Figure 4(e)). In the “biological processes” category, 66 genes were enriched in the functions of “modulation of chemical synaptic transmission,” “regulation of trans-synaptic signaling,” and “signal release,” suggesting their potential roles in signal transduction. In the “cellular components” category, 50 genes were enriched in the functions of “neuronal cell body,” “synaptic membrane,” and “transport vesicle,” suggesting their connections to neuronal structure. In addition, 41 genes were classified into the “molecular functions” category and were enriched in the functions of “phospholipid binding,” “protein serine/threonine kinase activity,” and “protein serine kinase activity.” In addition, KEGG enrichment analysis identified the 15 most enriched pathways (Figure 4(c)), which included “calcium signaling pathway,” “pathways of neurodegeneration-multiple diseases,” and “oxytocin signaling pathway.”
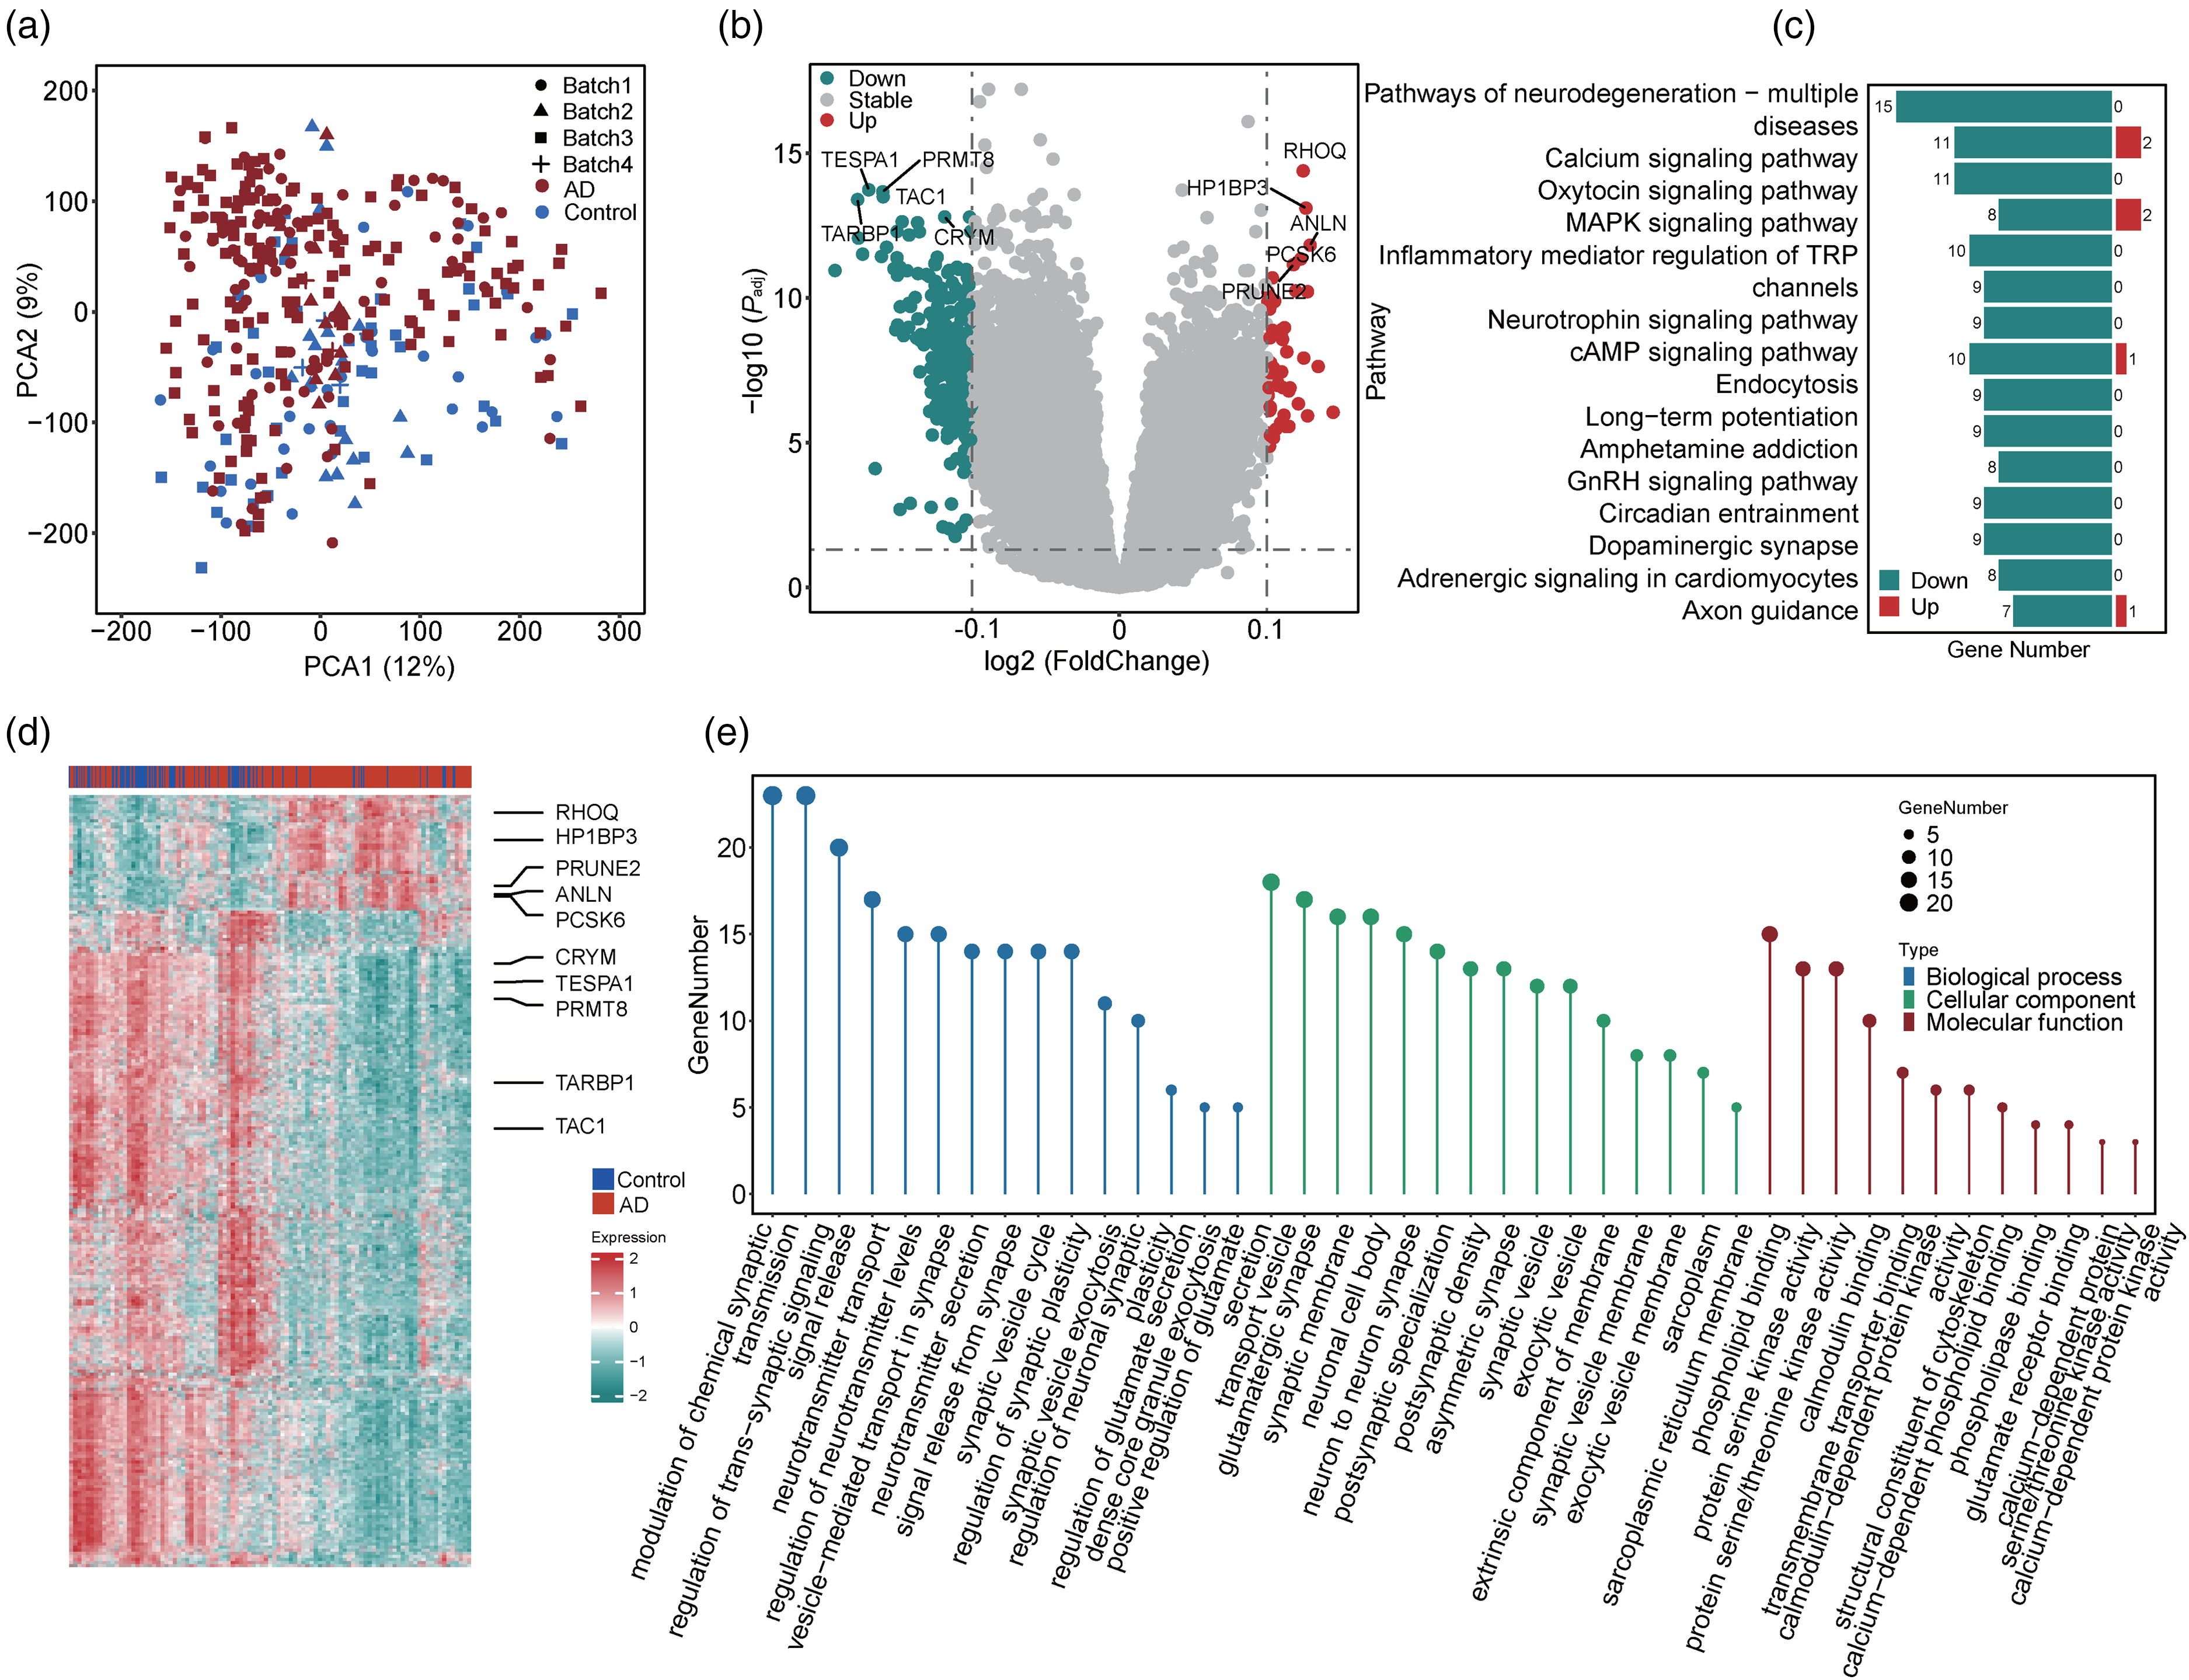
Analysis of differential alternative splicing. (a) Principal component analysis (PCA) of alternative splicing (AS) data from the temporal lobe (TL). We removed the batch effects of the data. Patients with Alzheimer's disease (AD) and controls are indicated in red and blue, respectively. (b) Volcano plot of all genes in the AS data (with the batch effect removed). The top 5 up- and downregulated genes with the lowest adjusted lowest p-values are marked. Upregulated, downregulated, and stable genes are represented by red, green, and grey, respectively. (c) Kyoto Encyclopedia of Genes and Genomes (KEGG) enrichment analysis of differential AS genes. The numbers of up- and downregulated genes within each pathway are labeled in red and green, respectively. (d) Heatmap of differential AS genes. The top 5 up- and downregulated genes with the lowest adjusted p-values are marked. (e) Gene Ontology (GO) enrichment analysis of differential AS genes. The categories of “biological process,” “cellular component,” and “molecular function” are indicated in blue, green, and red, respectively (Color figures available online).
After removing the batch effect (Figure 5(a) and (b) and Supplemental Figure 2C, D), we performed differential APA analysis to examine 11 transcripts with differential APA changes between patients with AD and controls. Accordingly, we marked the top 5 up- and downregulated these genes according to ascending adjusted p-value (Figure 5(c) and (d)). We then conducted GO enrichment analysis to explore their functional distributions (Figure 5(f)). Specifically, in the “biological processes” category, these genes were enriched in the functions of “regulation of protein catabolic process,” “Golgi vesicle transport,” and “regulation of proteolysis involved in protein catabolic process,” suggesting their associations with metabolism. In the “cellular components” category, they were mainly enriched in the functions of “cytosolic ribosome,” “large ribosomal subunit,” and “cytosolic large ribosomal subunit,” indicating their connections to ribosome composition. In addition, in the “molecular functions” category, many genes were enriched in functions related to protein regulation, including “phospholipid binding,” “ubiquitin-like protein ligase binding,” and “ubiquitin protein ligase binding.” Furthermore, KEGG enrichment analysis identified the 8 most enriched pathways, most of which are involved in energy acquisition, utilization, and regulation (Figure 5(e)), including “propanoate metabolism,” “glycolysis/gluconeogenesis,” and “pyruvate metabolism.” Taken together, our findings reveal the APA alterations in the temporal lobe in patients with AD.

Analysis of differential alternative polyadenylation. (a, b) Principal component analysis (PCA) of (a) long transcripts and (b) short transcripts data from alternative polyadenylation (APA) data of the temporal lobe (TL). We removed the batch effects of the data. Patients with Alzheimer's disease (AD) and controls are indicated in red and blue, respectively. (c) Volcano plot of all genes in the APA data (with the batch effect removed). The top 5 up- and downregulated transcripts with the lowest adjusted lowest p-values are marked. Upregulated, downregulated, and stable genes are indicated in red, green, and grey, respectively. (d) Heatmap of differential APA genes. The top 5 up- and downregulated genes with the lowest adjusted P-values are marked. (e) Kyoto Encyclopedia of Genes and Genomes (KEGG) enrichment analysis of differential APA genes. The numbers of up- and downregulated genes within each pathway are labeled in red and green, respectively. (f) Gene Ontology (GO) enrichment analysis of differential AS genes. The categories of “biological process,” “cellular component,” and “molecular function” are indicated in blue, green, and red, respectively (Color figures available online).
Relative contributions of the 3 transcriptomic regulatory layers to transcriptional variance between patients with Alzheimer's disease and controls
To analyze the contributions of mRNA expression, AS, and APA to the total transcriptional variance between patients with AD and controls, we integrated the data of the 3 regulatory layers using MOFA2. The 15 factors inferred from MOFA2 represent the major sources of variation across the 3 transcriptomic regulatory layers, which facilitates discrimination between patients with AD and controls. AS accounted for most of the total variance (R2 = 0.558) followed by APA (R2 = 0.449) and mRNA expression (R2 = 0.438) (Figure 6(a)). Among the 15 factors, factor 1 contributed the most to explaining the variance of mRNA expression (R2 = 0.287), AS (R2 = 0.274), and APA (R2 = 0.096) (Figure 6(a)) and differed significantly between patients with AD and controls (p < 0.001, Figure 6(b)). Examination of the correlations between the factors and phenotypes revealed significant correlations between factor 1 and Braak stage (r = 0.341, p < 0.001) and APOE genotype (r = 0.284, p < 0.001) (Figure 6(c)).
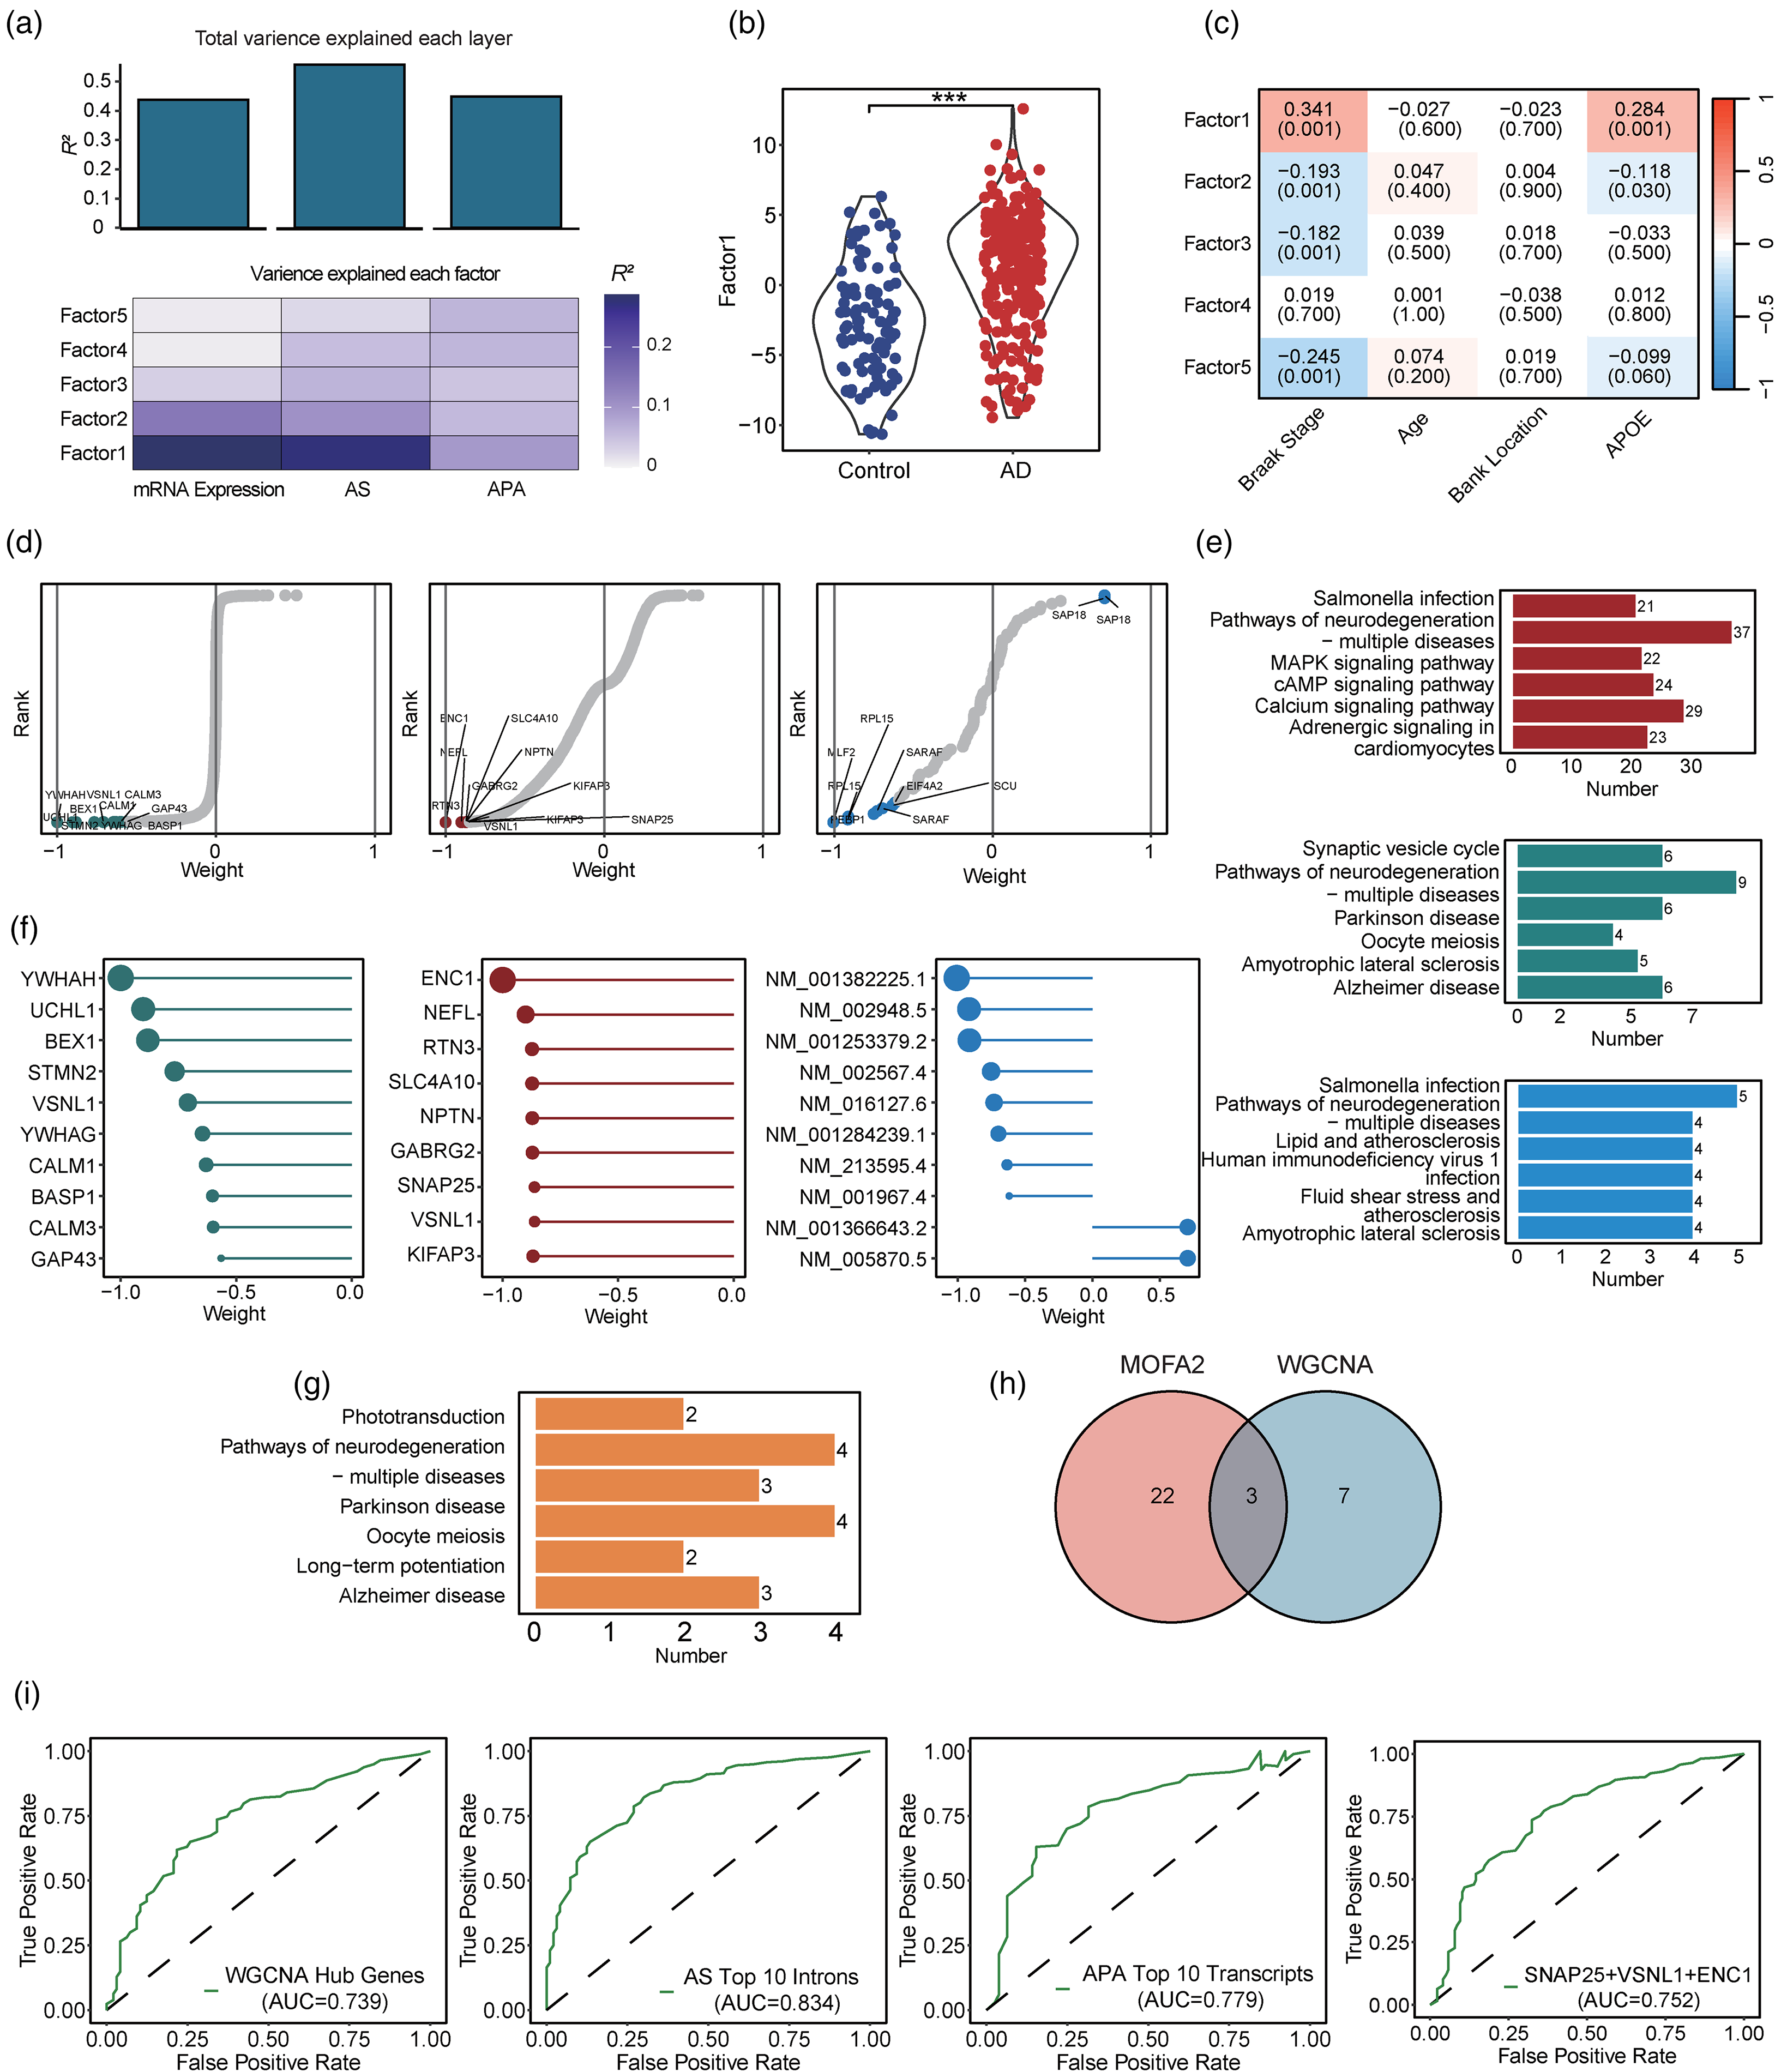
Multi-omics factor analysis. (a) Contributions of transcriptomic regulatory layers to the variance between patients with Alzheimer's disease (AD) and controls. The total contributions of each transcriptomic regulatory layer are measured as the total variance explained (i.e., R2) and are summarized in the bar plot (top panel). The contributions of the first 5 latent factors to the variance of each transcriptomic layer are summarized in the heatmap (bottom panel). (b) Comparison of factor 1 between patients with AD and controls. Factor 1 explained the most variance of the 3 transcriptomic regulatory layers. Each sample was assigned a value of factor 1. Patients with AD and controls are indicated in red and blue, respectively. (c) Correlations between the first 4 factors and phenotypes (i.e., Braak stage, age, brain bank location, and APOE genotype). Red and blue indicate positive and negative correlation coefficients, respectively. (d) Distribution of all features across factor 1 in the 3 transcriptomic regulatory layers. Each feature was assigned a feature loading (shown on the X-axis), indicating its contribution to explaining factor 1. We identified the top 10 features based on their absolute loading values. (e) Kyoto Encyclopedia of Genes and Genomes (KEGG) enrichment analysis of the representative features in factor 1 across the 3 regulatory layers. The pathways enriched by the representative features from mRNA expression, alternative splicing (AS), and alternative polyadenylation (APA) are marked in green, red, and blue, respectively. (f) The top 10 features in factor 1 across the 3 regulatory layers. (g) KEGG enrichment analysis of the top 10 features in factor 1 across the 3 regulatory layers. The pathways were enriched in all 30 features. (h) Numbers of common and specific genes identified by weighted gene co-expression correlation network analysis (WGCNA) and multi-omics factor analysis (MOFA2). (i) Receiver operating characteristic (ROC) curves of the regression models. We constructed the regression models with key genes from separate analyses of the 3 transcriptomic regulatory layers and key genes identified by both MOFA2 and WGCNA (Wilcoxon test: ***p < 0.001) (Color figures available online).
To quantify the contributions of the features in the 3 transcriptomic regulatory layers (i.e., mRNA expression, AS, and APA events) to factor 1, we calculated a score for each feature using MOFA2 (Figure 6(d)). We then selected 46, 1,501, and 29 representative features from the mRNA expression, AS, and APA layers, respectively. After KEGG enrichment analysis of the features, features from the mRNA expression, AS, and APA layers were primarily associated with “Alzheimer disease” and “pathways of neurodegeneration – multiple diseases” (Figure 6(e)). Next, we investigated the functional distributions of top 10 representative features (Figure 6(f)) from the 3 regulatory layers and found they were enriched in “Alzheimer disease” and “pathways of neurodegeneration – multiple diseases” (Figure 6(g)). Notably, we also identified 3 of the top 10 features across the 3 regulatory layers as key genes by WGCNA (i.e., SNAP25, VSNL1, and ENC1) (Figure 6(h)). Hence, the results suggest that SNAP25, VSNL1, and ENC1 are essential signals for the occurrence of AD and are probably associated with AD pathogenesis.
Finally, we constructed regression models to evaluate the ability of these genes to distinguish between patients with AD and controls. The regression models constructed with the key genes from WGCNA, top 10 AS introns and APA transcripts, and the 3 genes identified by both MOFA2 and WGCNA achieved AUCs of 0.739, 0.834, 0.779, and 0.752, respectively (Figure 6(i)). Taken together, our mRNA analysis strategy yielded robust mRNA signals from multiple transcriptomic regulatory layers that could distinguish between patients with AD and controls.
Expression levels of SNAP25, ENC1, and VSNL1 in central and peripheral tissues
To investigate the characteristics of SNAP25, VSNL1, and ENC1 from peripheral to central tissues in AD, we further detected their expressions in the blood, hippocampus, prefrontal cortex, temporal lobe, parietal lobe, olfactory bulb, and cerebellum. The blood of patients with AD exhibited decreased expression of SNAP25 and VSNL1, and increased expression of ENC1. Meanwhile, in the blood of patients with mild cognitive impairment, the expression levels of SNAP25, VSNL1, and ENC1 were decreased. In the hippocampus, the expression levels of these 3 genes were decreased in patients with AD. In the prefrontal cortex, temporal lobe, and parietal lobe, the expression levels of SNAP25, VSNL1, and ENC1 were decreased in patients with AD. In the olfactory bulb, the expression levels of VSNL1 and ENC1 were increased while that of SNAP25 was decreased in patients with AD. The cerebellum in patients with AD also exhibited decreased expression of SNAP25, VSNL1, and ENC1. Overall, SNAP25, VSNL1, and ENC1 were downregulated in most brain regions in patients with AD, except the olfactory bulb. In the blood, all 3 genes were downregulated in patients with mild cognitive impairment; meanwhile, SNAP25 and VSNL1 were downregulated and ENC1 was upregulated in patients with AD (Supplemental Figure 5).
To validate the decreased expression levels of SNAP25, VSNL1, and ENC1 in patients with AD, we detected their expression levels in the RNA-seq data of central and peripheral tissues from 3 additional studies. The first of these 46 included samples from the temporal cortex of controls (n = 8) and patients with AD (n = 10). Notably, the expression levels of SNAP25, VSNL1, and ENC1 were significantly downregulated in patients with AD (Supplemental Figure 6A). The second study 47 included samples from the entorhinal cortex, hippocampus, temporal cortex, and frontal cortex of patients with AD (n = 237) and controls (n = 363). Consistent with our findings, the expression levels of these genes were downregulated across different brain regions in patients with AD (Supplemental Figure 7). Finally, the third study, 21 which included samples from the peripheral blood mononuclear cells of patients with AD (n = 6) and controls (n = 14), revealed downregulated expression of these genes in patients with AD (Supplemental Figure 6B). These results are consistent with our findings that SNAP25, VSNL1, and ENC1 can sufficiently distinguish patients with AD from controls.
Transcriptional regulation networks of SNAP25, ENC1, and VSNL1
We further explored the transcriptional regulation of SNAP25, ENC1, and VSNL1. Accordingly, we uncovered a regulatory network encompassing these genes that includes candidate transcription factors and their corresponding binding motifs (Figure 7(a)). Specifically, we identified 13 transcription factors, among which, MAX, PSMC2, RREB1, LEF1, TCF7, TCF7L1, TFAP2C, and CTNNB1 were differentially expressed between patients with AD and controls (p adj < 0.05). Except for PSMC2 and CTNNB1, the other transcription factors were upregulated in patients with AD. In addition, we found 2 key motifs: “TCAAAG,” which is associated with LEF1, TCF7, and TCF7L1, and “ATCAAAG,” which is associated with CTNNB1 and TCF7L2 (Figure 7(b)). Thus, these 2 motifs are potentially associated with the expression of SNAP25 and ENC1.
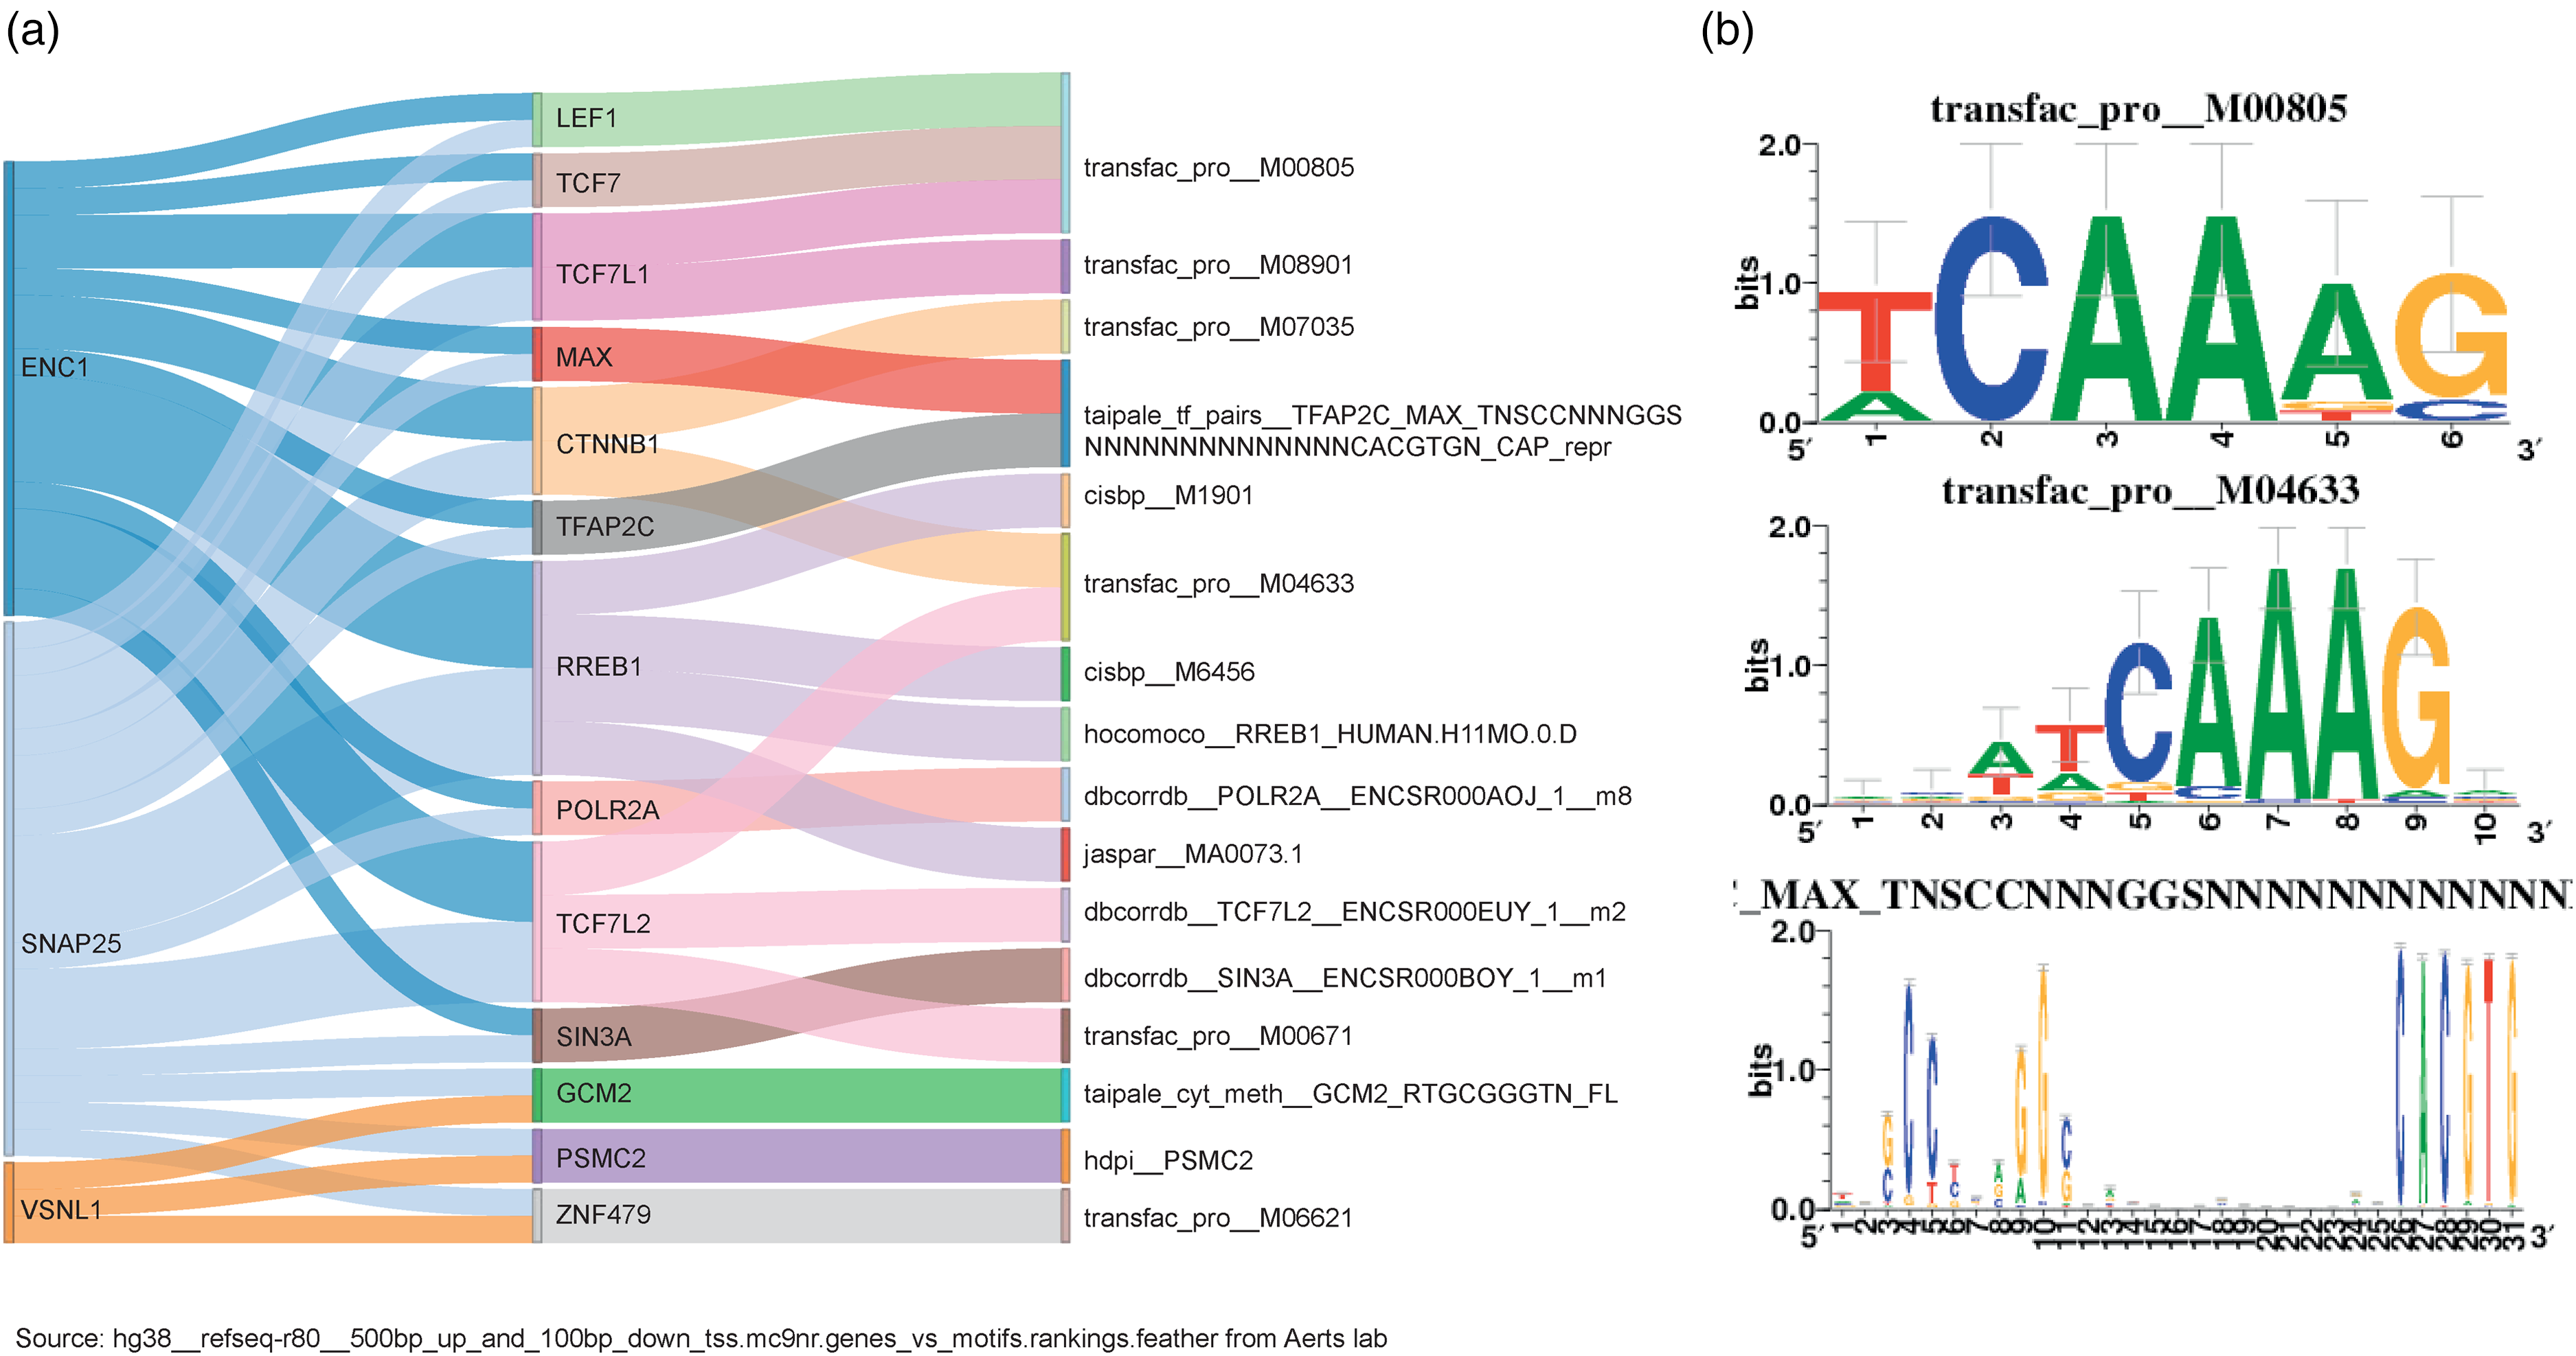
Transcriptional regulation of SNAP25, VSNL1, and ENC1. (a) Network of the 3 genes, transcription factors, and transcription factor binding motifs. From left to right, the Sankey plot shows the 3 genes, transcription factors, and corresponding binding motifs. (b) Visualization of transcription factor binding motifs bound by more than 1 transcription factor.
Discussion
The prevalence of AD is increasing owing to population aging and the lack of effective treatments, underscoring the urgency of exploring its pathogenesis and developing methods for early diagnosis. In the present study, we identified several genes that are implicated in AD by integrating data from the mRNA expression, AS, and APA transcriptomic regulatory layers. Notably, SNAP25, VSNL1, and ENC1, which were identified by both MOFA2 and WGCNA, could sufficiently distinguish patients with AD from controls. Thus, our results suggest that these genes can be used to identify AD, making them candidates for further investigation of AD pathogenesis.
Advantages of integrative analysis
We employed two advanced methods—WGCNA and MOFA2—to integrate mRNA expression, AS, and APA transcriptomic regulatory profiles. The results provide insights into the transcriptional patterns in the temporal lobe of patients with AD. Meanwhile, previous studies on AD have mainly focused on only 1 or 2 of these transcriptomic regulatory layers. For example, one study quantified the splicing variants in the AD brain and revealed that the expression levels of splicing variants in brain tissue potentially reflect AD progression. 48 Another study focused on the splicing variants in the parietal cortex in the AD brain and identified the upregulation of DBI induced by its splicing variants. 49 Meanwhile, other studies combined two transcriptomic regulatory layers to investigate AD pathogenesis. For example, one study focusing on mRNA expression and APA in the temporal lobe of patients with AD identified polyadenylation changes, enabling better differentiation between the brains of patients with AD and healthy controls than that based on mRNA expression level alone. 50 Nonetheless, those studies explored the pathogenesis of AD based on separate transcriptomic regulatory profiles. In contrast, we used MOFA2 to integrate diverse transcriptomic regulatory profiles and comprehensively analyze the transcriptomic regulatory characteristics of AD.
The results of MOFA2 indicate that AS accounts for the most transcriptional variance between patients with AD and controls (R2 = 0.558) followed by APA (R2 = 0.449) and mRNA expression (R2 = 0.438). However, the regression model constructed using the APA data was not the most accurate. This may be because of inadequate sample size. The sensitivity and accuracy of the APA prediction software we used are affected by sequencing depth. Accordingly, we only identified 11 differential transcripts between patients with AD and controls. In contrast, the mRNA expression layer and AS layer can detect more genes and introns for analysis. Therefore, the number of features utilized in model construction would affect model accuracy. Accordingly, utilizing larger datasets would yield additional signals from APA analysis and more accurate models.
Three genes that distinguish patients with Alzheimer's disease from controls
Previous studies provide comprehensive information about the involvement of different mechanisms in the pathogenesis of AD, including the amyloid signaling cascade; tau and neurofibrillary tangles; genetic mutations; neurotransmitter, ubiquitin-dependent proteasomal, and endosomal–lysosomal systems; mitochondrial dysfunction; endoplasmic reticulum and oxidative stress; neuroinflammatory, insulin, calcium, neurotrophic factor, Wnt/β-catenin, and leptin signaling; autophagy; protein misfolding by molecular chaperones; lipid/cholesterol metabolism; excitotoxicity; blood–brain barrier leakage; gut microbiota; and nutrients.2 While previous studies have delineated the biological roles of SNAP25, VSNL1, and ENC1 in AD pathogenesis, their relationships with Braak stage have remained unclear. This knowledge gap is an important direction for future research—one that we aim to explore in order to understand the potential mechanisms of these genes in AD.
Although previous studies have delineated the biological roles of SNAP25, VSNL1, and ENC1 in AD pathogenesis, their combined significance has remained unclear. Aberrant levels of Aβ may induce numerous pathologies in patients with AD, such as abnormalities in synapses and the neuronal network, perturbed hippocampal synaptic plasticity, and neuronal network dysfunction. 2 SNAP25, a synaptic protein involved in neural development, synaptic plasticity, and neurotransmitter release, is a potential marker of synaptic dysfunction in AD. 51 Specifically, in patients with AD, we observed that SNAP25 level is reduced in brain tissue, 52 elevated in the cerebrospinal fluid, 53 and decreased in blood exosomes. 54 Moreover, we found that in the temporal lobe of patients with AD, as the disease progresses—specifically with increasing Braak stage—SNAP25 expression gradually decreases. Furthermore, as SNAP25 is a synapse-associated protein and synaptic loss intensifies with the progression of AD, these findings suggest that SNAP25 level may reflect synaptic changes in the brain and could therefore serve as an effective discriminator for AD prediction.
Perturbed cellular calcium regulation is a critical and early event associated with AD pathogenesis. Mitochondrial dysfunction, the disturbance of endoplasmic reticulum homeostasis, and PSEN1 mutation can all generate calcium imbalance. 2 Multiple studies highlight the significance of VSNL1, a highly expressed neuronal calcium sensor, as a marker of neuronal injury in AD 55 owing to its involvement in excitotoxicity due to disrupted calcium homeostasis. 56 VSNL1 expression is high in the cerebrospinal fluid and plasma,57,58 and a higher cerebrospinal fluid level of VSNL1 is associated with faster cognitive decline. 59 Moreover, VSNL1 expression is lower in the brain tissues of patients with AD than controls. 60 In particular, as Braak stage increases, VSNL1 expression in the temporal lobe gradually decreases. As VSNL1 is associated with synaptic plasticity and neuronal loss caused by Ca2+ dysregulation, these findings suggest that the progressive impairment of synaptic plasticity and Ca2+ homeostasis during AD may damage VSNL1-containing cells in the brain, leading to decreased VSNL1 expression. Overall, these findings suggest that VSNL1 could serve as an indicator of AD.
Aβ toxicity, tau hyperphosphorylation, downregulation of BDNF, aberrant Wnt signaling, and the disturbance of calcium signaling can all lead to cognitive impairment. 2 ENC1, an early and highly specific marker of neural induction in vertebrates that is related to cognition and neuropathology in the elderly, is downregulated in AD brain tissue. 61 Meanwhile, higher ENC1 levels are associated with improved residual cognition and reduced depressive symptoms, thereby supporting its role in the pathogenesis of AD. Accordingly, we observed that in the temporal lobe of patients with AD, ENC1 expression progressively decreased with increasing Braak stage. This suggests that ENC1 could serve as an indicator for tracking AD progression.
Our study demonstrated that the expression levels of SNAP25, VSNL1, and ENC1 were significantly downregulated in the temporal lobe of patients with AD compared to controls. Notably, their expression levels were inversely correlated with increasing Braak stage. Similarly, analysis of blood data revealed that all 3 genes were downregulated in patients with mild cognitive impairment. The downregulation of the 3 genes was also observed for the patients with AD in most validation datasets. These findings suggested that these genes may serve as potential indicators for AD progression. However, due to the low expression of these 3 genes in blood, further studies on improving the detection methodology and validation with multi-center data are needed.
APOE4-associated genes and their potential mechanisms in Alzheimer's disease
We observed that as the number of APOE4 carriers in a population increases, the expression levels of SNAP25, ENC1, and VSNL1 gradually decrease. We showed that synaptic protein SNAP25 was negatively correlated with Braak stage, concordant with the hypothesis that AD progression is associated with synapse loss driven by hyperphosphorylated tau and Aβ.52,53 VSNL1, a neuronal calcium sensor that is implicated in AD-related neurodegeneration by disrupting Ca²+ homeostasis, thereby contributing to neuronal injury and loss, was also negatively correlated with Braak stage. 62 In addition, VSNL1 was correlated with cerebrospinal fluid t-tau and p-tau levels, indicating its involvement in AD. 54 ENC1, an early neural induction marker, was negatively correlated with Braak stage in our results, suggesting its association with AD pathogenesis.55,56 Together, these 3 genes distinguished patients with AD from controls, and their expression levels were inversely associated with the allelic dosage of APOE ε4, suggesting a regulatory effect of APOE ε4-dependent pathway on the expression of these 3 genes during AD progression.
Study limitations
AD is a progressive disease characterized by the accumulation of extracellular amyloid plaques and intracellular neurofibrillary tangles across different brain regions. However, our analysis was limited to RNA-seq data from the temporal lobe. Therefore, future studies should incorporate data from other brain regions and the blood to investigate their transcriptome profiles and interactions. In addition, postmortem analysis of brain tissue can only partly explain the pathogenesis of AD. Therefore, it is essential to establish a strong link between the transcriptional regulation patterns in brain tissue and blood to enhance their utility for AD prediction. Furthermore, the multifactorial nature of AD pathology necessitates integration with other omics data, such as proteomics, metabolomics, epigenetics, single-cell transcriptomics, and spatial transcriptomics, to comprehensively investigate their distinct and integral roles in AD.
Conclusion
In this study, we identified genes and pathways associated with AD by performing integrated analysis of 3 transcriptomic regulatory layers—mRNA expression, AS, and APA—using RNA-seq data from patients with AD and controls. Moreover, we demonstrated the potential of using the combination of SNAP25, VSNL1, and ENC1 expression to distinguish patients with AD from controls, providing insights into the identification of patients with AD as well as alternative pathological mechanisms of the disease. Thus, these can complement existing AD indicators, offer novel insights into the pathological mechanisms of AD, and serve as potential therapeutic targets.
Supplemental Material
sj-docx-2-alz-10.1177_13872877251322536 - Supplemental material for Changes in transcriptional regulation in the temporal lobe in patients with Alzheimer's disease
Supplemental material, sj-docx-2-alz-10.1177_13872877251322536 for Changes in transcriptional regulation in the temporal lobe in patients with Alzheimer's disease by Yujie Yang, Yinhu Li and Yu Chen in Journal of Alzheimer's Disease
Supplemental Material
sj-xlsx-3-alz-10.1177_13872877251322536 - Supplemental material for Changes in transcriptional regulation in the temporal lobe in patients with Alzheimer's disease
Supplemental material, sj-xlsx-3-alz-10.1177_13872877251322536 for Changes in transcriptional regulation in the temporal lobe in patients with Alzheimer's disease by Yujie Yang, Yinhu Li and Yu Chen in Journal of Alzheimer's Disease
Supplemental Material
sj-xlsx-4-alz-10.1177_13872877251322536 - Supplemental material for Changes in transcriptional regulation in the temporal lobe in patients with Alzheimer's disease
Supplemental material, sj-xlsx-4-alz-10.1177_13872877251322536 for Changes in transcriptional regulation in the temporal lobe in patients with Alzheimer's disease by Yujie Yang, Yinhu Li and Yu Chen in Journal of Alzheimer's Disease
Footnotes
Acknowledgments
We would like to thank the members of the Chen Laboratory for their helpful discussions and insights. This study was financially supported in part by the National Natural Science Foundation of China (NSFC)/RGC Joint Research Scheme (32061160472), the National Key R&D Program of China (2021YFE0203000), the Guangdong Provincial Fund for Basic and Applied Basic Research (2019B1515130004), the Guangdong Provincial Key S&T Program (2018B030336001), and the Technology Innovation Commission of Shenzhen (JCYJ20200109115631248, JCYJ20220818100800001, and ZDSYS20200828154800001).
Ethical considerations
Not applicable.
Consent to participate
Not applicable.
Consent for publication
Not applicable
Author contributions
Yujie Yang (Data curation; Formal analysis; Visualization); Yinhu Li (Conceptualization; Formal analysis; Investigation; Methodology; Project administration; Supervision); Yu Chen (Conceptualization; Funding acquisition; Investigation; Project administration; Supervision).
Funding
The author(s) received no financial support for the research, authorship, and/or publication of this article.
Declaration of conflicting interests
The author(s) declared no potential conflicts of interest with respect to the research, authorship, and/or publication of this article.
Data availability
All datasets used in our analysis are publicly available, and their accession numbers are detailed in Supplemental Table 1. The code for predicting APOE genotype and applying multi-omics factor analysis is publicly available on GitHub (![]() ). Other data are available from the authors upon reasonable request.
). Other data are available from the authors upon reasonable request.
Supplemental material
Supplemental material for this article is available online.
References
Supplementary Material
Please find the following supplemental material available below.
For Open Access articles published under a Creative Commons License, all supplemental material carries the same license as the article it is associated with.
For non-Open Access articles published, all supplemental material carries a non-exclusive license, and permission requests for re-use of supplemental material or any part of supplemental material shall be sent directly to the copyright owner as specified in the copyright notice associated with the article.