
Abstract
Background
Mild cognitive impairment (MCI), a prodromal stage of Alzheimer's disease (AD) for many individuals, is accompanied by widespread connected speech (CS) changes (e.g., shorter CS samples, mention of fewer semantic content units, lower syntactic complexity). Nevertheless, findings on CS in MCI are heterogeneous. This heterogeneity, combined with the heterogeneity in cognition in MCI suggests that there could exist more than one CS profile in this population.
Objective
We aimed to determine if there are multiple CS profiles in MCI and whether these potential CS profiles are characterized by distinct cognitive presentations.
Methods
CS characteristics were extracted from the samples of 109 controls and 210 individuals with MCI from the COMPASS-ND study database. A Two-Step Cluster Analysis was then carried out to identify potential CS profiles in MCI. These profiles were compared to one another and to controls in terms of their linguistic and cognitive characteristics.
Results
We identified two CS profiles in MCI, characterized by reduced syntactic complexity and semantic content and by dysfluencies, longer CS samples, and reduced semantic idea density and efficiency, respectively. The reduced semantic content/syntactic complexity profile was also characterized by various cognitive difficulties (e.g., visuospatial, episodic memory, executive functioning domains) in comparison with controls, whereas the increased production and reduced idea transmission effectiveness profile had relatively isolated episodic memory difficulties.
Conclusions
CS analysis could be a helpful screening tool to identify individuals with MCI who show greater cognitive difficulties and who would most benefit from more extensive cognitive and/or medical testing as well as from cognitive and/or psychological interventions.
Keywords
Introduction
While memory deficits are generally considered the earliest and most frequent clinical presentation of Alzheimer's disease (AD), subtle linguistic changes could appear several years before patients or their family first notice the signs of a cognitive decline associated with AD.1,2 Mild cognitive impairment (MCI) represents a prodromal stage of AD for approximately eight to fifteen percent of affected individuals.3,4 Individuals with MCI present with heterogenous cognitive deficits, which may affect a single or multiple domains. 5 Memory impairments are slightly more common than deficits affecting other domains and are usually associated with a higher risk of progression to AD.6,7 Nevertheless, individuals with MCI can also present with visuospatial, executive and/or linguistic deficits.
Connected speech (CS) tasks represent promising tools to assess the subtle linguistic changes that can be present in very early AD, as they have greater ecological validity than other language tasks (e.g., confrontation naming, verbal fluency), can be administered within a couple of minutes, and are inexpensive. Widespread changes in CS have been documented in individuals with MCI (in comparison with controls). The most commonly reported changes affect the general speech production (e.g., slower speech rate, reduced length of CS samples),8–10 fluency (e.g., more word and idea repetitions, more filled and empty pauses, more hesitations),9–11 lexical (e.g., use of more frequent words, lower lexical richness, greater proportion of pronouns and verbs and lower proportions of nouns),1,8,10 semantic (e.g., mention of fewer Information Content Units (ICUs), lower idea density, lower efficiency),1,10,12 syntactic (e.g., shorter sentences, more syntactic errors, shorter syntactic dependencies),9,13 and pragmatic (e.g., lower local and global coherence) domains of CS.11,12 These previous studies have used a mixture of manual and automatic (Natural Language Processing) methods for feature extraction, 14 as well as traditionally used univariate statistics (e.g., ANOVAs, Kruskal-Wallis Tests) and machine learning classification methods for their main analyses. 14
There is some variability within and across studies in the documented linguistic characteristics of CS in MCI. For instance, some studies have found that individuals with MCI produce fewer words than controls, 15 while others have found the opposite, 16 or no differences between these two groups.12,17 In addition, a systematic review 8 documented a lower proportion of open-class words in the CS samples of individuals with MCI, whereas other studies have found a similar proportion of these words in the samples of controls and individuals with MCI.12,13 Even though declines in syntactic abilities have been widely documented in MCI,11,12 a study found differences in this domain only after obtaining a composite score for all the syntactic measures they extracted (e.g., Mean Length of Utterance, syntactic errors), 1 while another found no difference in length of T-units between individuals with MCI and controls. 15 Moreover, a 2013 study by Ahmed and colleagues 1 that aimed to identify the CS characteristics that were indicative of future progression to AD in individuals with MCI by comparing their CS characteristics to those of individuals with mild and moderate AD using Wilcoxon signed-rank tests and Bonferroni corrections documented heterogeneity in the linguistic characteristics of their own MCI participants’ CS samples. More specifically, in comparison to controls, 11 out of 15 MCI participants presented with difficulties in the syntactic (e.g., reduced Mean Length of Utterance, fewer inflected verbs) and semantic domains of CS (e.g., mention of fewer ICUs, reduced efficiency) similar to those found in early AD, six presented with difficulties in the general speech production domain (reduced speech rate), four presented with difficulties in the fluency domain (e.g., more false starts and filled pauses), and two presented with difficulties in the lexical domain (e.g., increased proportion of pronouns and verbs). While most studies have used CS samples obtained from picture description tasks in English, others have focused on CS samples produced in languages such as French, Hungarian, and Mandarin Chinese. Within a study, a single language is usually targeted. Nevertheless, many studies do not report the language that was investigated.
Although CS production is first and foremost a linguistic task, it involves continuous interactions between language and other cognitive functions such as semantic memory, working memory, attention, and executive functions. 18 When CS is produced through the description of a visual stimulus (as in a picture description task), visuospatial functioning is also involved. Considering the heterogeneity in the linguistic characteristics of CS and in the cognitive profiles of individuals with MCI, there could exist more than one CS profile in this population and these profiles could be accompanied by different cognitive presentations.
Different CS profiles have been documented in AD,19,20 but no study has investigated potential CS profiles in MCI. Furthermore, no study has attempted to map the CS profiles of individuals with MCI to their cognitive profiles using an extensive neuropsychological battery covering a wide range of cognitive domains. Comparing controls and individuals with MCI in terms of their CS features using univariate statistics (as many previous studies have done) might lead to missing the heterogeneity of CS in MCI and the presence of multiple CS profiles in this population. Data-driven approaches such as cluster analysis applied solely to data from MCI participants can help uncover such patterns. Given that in-depth neuropsychological testing and medical evaluations, and cognitive or pharmacological interventions are not always accessible for cost, distance or professional availability reasons, it is crucial to have screening tools that help identifying individuals who would benefit from these resources the most.
In this study, we aimed to determine whether there are multiple CS profiles in MCI and whether individuals with different CS profiles also have different cognitive profiles. To do so, we used the COMPASS-ND study database of the Canadian Consortium on Neurodegeneration in Aging (CCNA; www.ccna-ccnv.ca), which contains, among others, data from cognitively healthy older adults and a large number of individuals with MCI, CS samples and extensive neuropsychological data for each participant.
Methods
Participants
The COMPASS-ND study and the use of its data for the present study were approved by all participating centers’ Research Ethics Committee or Institutional Review Board. All participants and their study partners provided written informed consent at the start of the COMPASS-ND study. For the present study, we selected all participants from the COMPASS-ND study database who: 1) completed the COMPASS-ND study in English, 2) completed the Cookie Theft Picture Description Task, 21 and 3) were classified as controls or as having MCI (with any predominant cognitive deficits) as per the COMPASS-ND study criteria. 22 A total of 28 individuals with vascular MCI (classified as such in the COMPASS-ND study based on the following criteria: two or more silent brain infract in brain regions other than the cerebellum and the brainstem or show extensive and diffuse white matter disease (Age-Related White Matter Scale change score ≥ 2))) were excluded, as this group seems to present with different CS profiles than individuals on the AD continuum 23 and we wanted to minimize the likelihood of obtaining results that simply reflect different etiology.
On top of fulfilling the general inclusion and exclusion criteria described in Chertkow and colleagues, 22 MCI participants and/or their study partner needed to report concerns regarding a change in cognition. These participants also needed to have a global Clinical Dementia Rating between 0 and 0.5 and to obtain scores within certain ranges on one or more of the following tests: Logical Memory II Delayed Recall (lower score than the ADNI education-adjusted expected scores for controls: < 3 for 0–7 years of education, < 5 for 8–15 years of education, < 9 for 16 + years of education), CERAD Delayed Word List Recall (< 6), MoCA (between 13–24, inclusive). Moreover, MCI participants needed to obtain a score ≥ 15 on the Lawton-Brody Instrumental Activities of Daily Living Scale and demonstrate cognitive impairment in one or more cognitive domains. To be classified as controls in the COMPASS-ND study, participants needed to fulfill all the general inclusion and exclusion criteria described in Chertkow and colleagues, 22 to have obtained a score ≥ 26 on the MoCA and to not report any perceived decline in cognition. A total of 109 controls and 210 individuals with MCI from the COMPASS-ND study database met our inclusion criteria and were included in the present study. Both groups were comparable in terms of age and years of education. However, the control group contained a higher proportion of females than the MCI group, a lower proportion of individuals with a first language other than English and obtained higher scores on the MoCA and lower scores on the Geriatric Depression Scale and GAD-7 questionnaires than individuals with MCI (for full sample demographic, psychological, and cognitive characteristics, see Tables 1 and 2). Participants’ gender identity is not available in the COMPASS-ND study database and therefore cannot be reported.
Demographic and psychological characteristics of sample (n = 319).
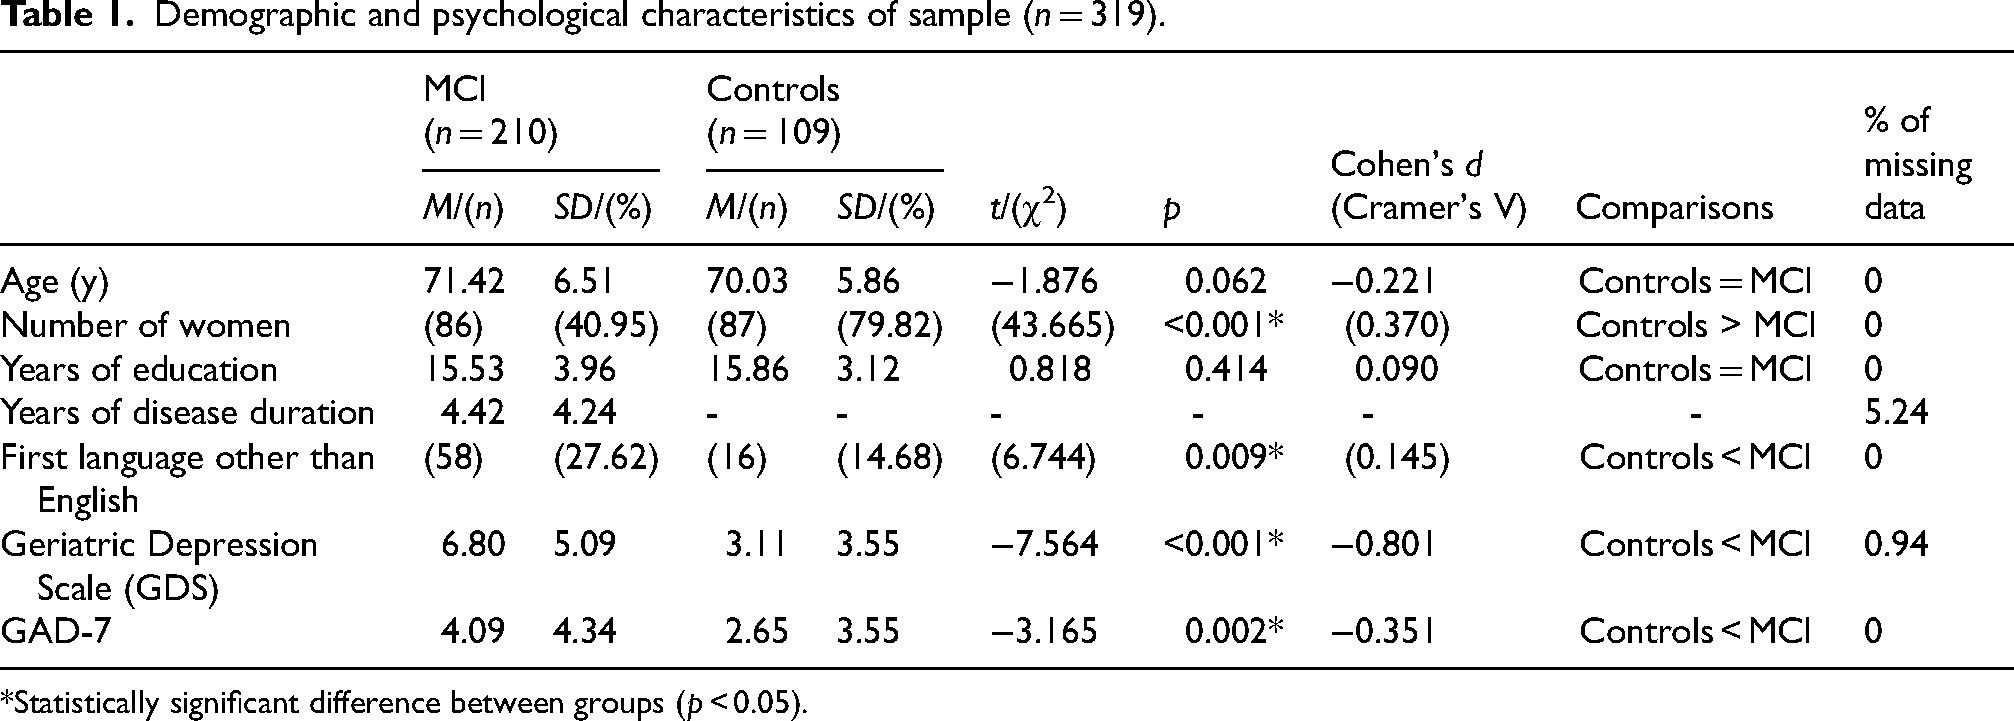
*Statistically significant difference between groups (p < 0.05).
Cognitive characteristics of sample (n = 319).
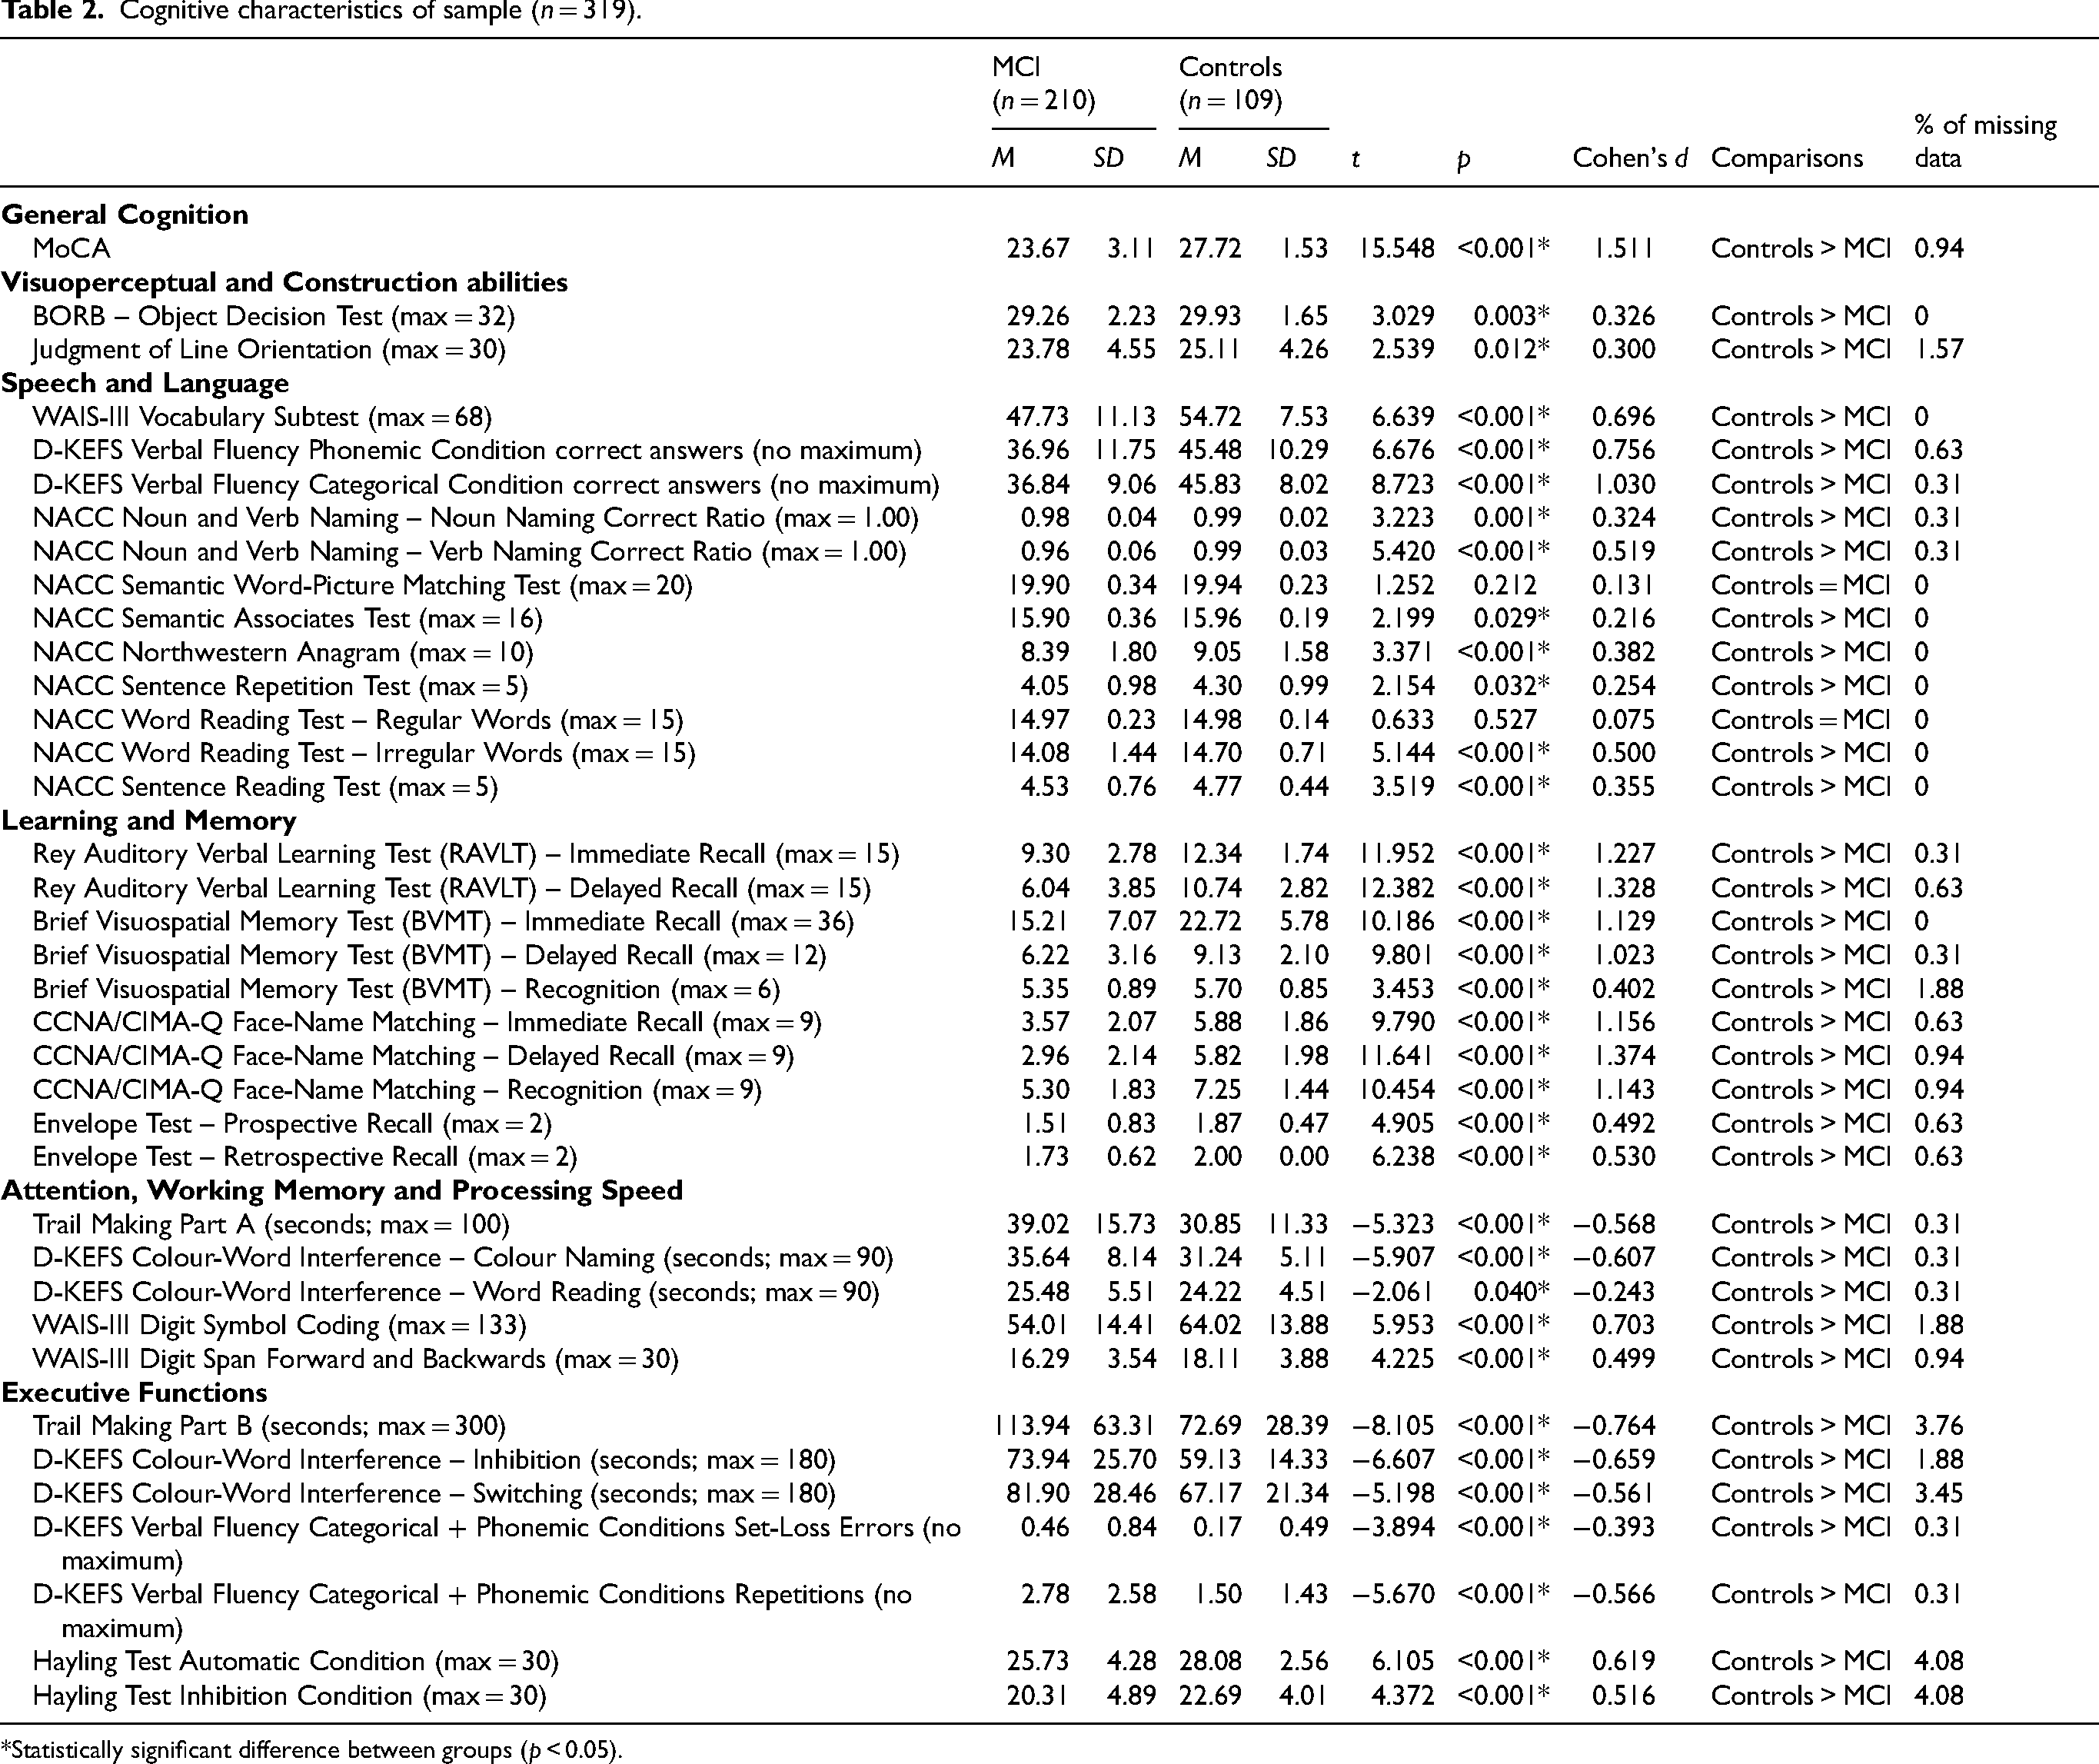
*Statistically significant difference between groups (p < 0.05).
Connected speech samples
The Cookie Theft Picture Description Task 21 was used to obtain CS samples in the COMPASS-ND study. In this task, participants were asked to describe everything they saw happening in the picture. When they appeared to have completed their description, participants were prompted to add anything else they saw happening in the picture. Audio-recordings of the participants’ CS samples were obtained while they completed the task.
A verbatim transcription of the CS samples was done professionally, by a company specializing in this type of work (http://www.waywithwords.net). All CS samples were transcribed by the same individual, who was blind to participants’ diagnosis and to the objective of the present study. CS samples sent for transcriptions were anonymized and the transcriber did not have access to any confidential information about the participants. To evaluate transcription reliability, twenty percent of the CS samples from both MCI participants and controls, randomly selected with a random number generator (http://www.randomizer.org) were sent to the same company under a different file name for a second transcription by the same transcriber. This new set of transcriptions was then compared to the original transcriptions from the corresponding participants using the SequenceMatcher.Ratio() function included in Python 3.9, and the jaccard_distance function from the nltk Python library, version 3.7 (https://www.nltk.org/_modules/nltk/metrics/distance.html). A mean similarity of 93.15% and a mean Jaccard Distance (a measure of similarity between two texts) of 0.097 were obtained between both transcriptions from the same participant. Both values are consistent with one another and indicate a high transcription reliability.
The CS transcriptions were preprocessed using spaCy (https://spacy.io/) version 3.4.1 and the ‟en_core_web_lg” model, with the following standard preprocessing steps: tokenization, Part-of-Speech tagging, and dependency parsing. After a review of the literature24,25 on CS in the AD continuum and the identification of characteristics that would provide the greatest variety of information possible, 164 linguistic characteristics were extracted from the CS samples and grouped in the following categories, using a classification inspired by Ahmed and colleagues, and Wilson and colleagues1,26: general speech production (e.g., number of words, number of word fragments), fluency characteristics (e.g., number of filled and empty pauses, number of word and idea repetitions), lexical characteristics (e.g., proportions of nouns, pronouns, and verbs, Moving Average Type Token Ratio, word frequency and imageability), semantic characteristics (e.g., number of mentioned Information Content Units (ICUs), idea density), syntactic characteristics (e.g., number of the different universal syntactic dependencies, number of subordinate clauses and incomplete sentences), and pragmatic characteristics (e.g., local coherence, words denoting uncertainty, formulaic expressions). Prior to the extraction of linguistic characteristics, each transcription was reviewed manually by the first author (S.P.) to identify the word fragments to be counted in the extraction step. No manual annotations were used in the extraction of any other feature. Many of the lexical and syntactic characteristics were obtained with spaCy, and the remaining linguistic characteristics were obtained with other Python libraries (nltk - version 3.7, lexicalrichness - version 0.1.4, scikit-learn - version 0.22.1, sentence_transformers – version 2.2.2) and Python functions created specifically for this study. Analysis code (partial reproduction of the one previously published in Slegers and colleagues 27 ) and an exhaustive list of extracted linguistic characteristics, their definition, and their operationalisation is available here: https://osf.io/u5bvg/.
Cognitive tasks
Relevant cognitive measures were drawn from the COMPASS-ND study database and grouped according to the classification described in Chertkow and colleagues, 22 with some changes made for the purpose of this study. First, the MoCA score was used as measure of general cognitive status. In the Visuoperceptual and Construction abilities category, we included the total scores on the BORB Object Decision Test and on the Judgment of Line Orientation Test. In the Speech and Language category, we included the following measures: total score on the WAIS-III Vocabulary subtest, total number of correct answers on the D-KEFS Verbal Fluency Test (Phonemic and Categorical Fluency conditions) and on the NACC (National Alzheimer's Coordinating Center) Semantic Word-Picture Matching Test, Semantic Associates Test, Northwestern Anagram, Sentence Repetition Test, Word Reading Test (Regular and Irregular Words conditions), Sentence Reading Test, and ratios of correctly named nouns and verbs on the NACC Noun and Verb Naming Test out of all valid trials. Moreover, we included the Rey Auditory Verbal Learning Test (RAVLT; Immediate Recall, Recall after Interference, and Delayed Recall scores), the Brief Visuospatial Memory Test-Revised (BVMT-R) and CCNA/CIMA-Q Face Name Matching Test (Immediate Recall, Delayed Recall and Recognition scores for both tests) and the Envelope Test (Prospective and Retrospective Recall scores) in the Learning and Memory category. The following measures were included in the Attention, Working Memory, and Processing Speed category: total time (in seconds) taken to complete the Trail Making Test (Part A), and the D-KEFS Colour-Word Interference Test (Colour Naming and Word Reading conditions), as well as total scores on the WAIS-III Digit Symbol Coding subtest, and on the WAIS-III Digit Span subtest (Forward and Backward Conditions). Finally, we included the following measures in the Executive Function domain: total number of set-loss and repetitions errors on the D-KEFS Verbal Fluency Test (in the Phonemic and Categorical Fluency conditions), and total time taken (in seconds) to complete the Inhibition and Switching conditions from the D-KEFS Colour-Word Interference Test and the Trail Making Test (Part B). For a description of controls’ and individuals with MCI's cognitive characteristics, see Table 2.
Statistical analysis
Dimensionality reduction with cluster analyses
When the number of variables in a dataset is large (as in this study), dimensionality reduction is known to improve clustering quality and reliability. For this reason, dimensionality reduction was performed prior to the main cluster analysis to select the most relevant linguistic characteristics for clustering. For each linguistic characteristic category, K-Means (for the general speech production, fluency, lexical, syntactic, and pragmatic characteristics) or Two-Step Cluster Analyses (for the semantic characteristics, as this category contains both continuous and categorical variables) were carried out with IBM SPSS Statistics for Windows, version 28, using only the data from the MCI participants. Any missing values were replaced by the mean value from all others MCI participants for the variable at play. This was only the case for the following psycholinguistic variables: imageability and familiarity of verbs (0.63% of CS samples), frequency and concreteness of adjectives (6.58%), valence of adjectives (10.97%), and imageability and familiarity of adjectives (13.48%). This missing data is the result of the psycholinguistic databases used to extract these CS characteristics not containing all words in a category of interest in a CS sample (in this case, verbs and adjectives), which prevented the obtention of a rating. K-Means Cluster Analysis minimizes the distance between data points in a cluster and maximizes the distance between the different clusters, while Two-Step Cluster Analysis starts by pre-clustering the data points using a distance measure and then merges the pre-clusters to form the final clusters using hierarchical clustering. Two, three, and four cluster solutions were obtained with the K-Means Cluster Analyses for each linguistic domain. The obtained clusters were then compared to one another in terms of linguistic characteristics using independent samples t-tests or ANOVAs, depending on the number of obtained clusters. For the Two-Step Cluster Analysis (semantic characteristics), the desired number of clusters was not predetermined. The log-likelihood distance measure was used, and the Schwarz's Bayesian Criterion (BIC) was selected to identify the best clustering solution. A two-cluster solution was obtained, and the obtained clusters were compared to one another using independent samples t-tests for the continuous semantic characteristics and using chi-square tests for the categorical characteristics. The 72 obtained characteristics with p < 0.05 in at least one of the K-Means cluster solutions for a given category or for the Two-Step Cluster Analysis were included in the main analysis (for the complete list of characteristics included in the final analysis, their definition, and their operationalization, see Supplemental Table 1). Imageability of verbs is the only variable with missing data (0.63%) that was retained for the final analysis. Cluster analyses were chosen for dimensionality reduction over other methods (e.g., principal component analysis) as they allow for the selection of the most relevant characteristics without losing information that each specific characteristic brings to the table (which can be the case with other dimensionality reduction methods).
Two-step cluster analysis
To identify potential CS profiles in individuals with MCI, a Two-Step Cluster Analysis (a data-driven and exploratory approach) was carried out in SPSS on the data from the MCI participants, using the linguistic characteristics identified in the dimensionality reduction step. This clustering technique was chosen because it can automatically select the ideal number of clusters for the data and handles both continuous and categorical variables. The log-likelihood distance measure was used, and the Schwarz's Bayesian Criterion (BIC) was used to identify to best clustering solution for the data. The most important linguistic characteristics for clustering were extracted automatically by SPSS as part of the analysis. After the clusters were obtained, controls were manually assigned to a cluster of their own to allow for comparisons with the MCI clusters.
Cluster characterization based on demographic, psychological, linguistic, and cognitive variables
Following cluster formation, the MCI clusters were compared to one another and to controls in terms of their demographic (age, sex, years of education, number of individuals with a first language other than English), and psychological characteristics (scores on the Geriatric Depression Scale and GAD-7 Questionnaires), using separate one-way ANOVA models and Bonferroni post-hoc tests for each variable, or chi-square tests (χ2), as appropriate. Furthermore, clusters were compared to one another using independent samples t-tests in terms of years of disease duration. The demographic and psychological characteristics of participants could impact their CS and cognitive profiles. Therefore, we decided that if significant differences in demographic and psychological characteristics were found, we would conduct separate one-way ANCOVA models (controlling for the demographic and psychological variables on which the groups differ) and Bonferroni post-hoc tests to compare MCI clusters and controls in terms of the ten most important CS characteristics for clustering (previously used to establish the CS profiles) and in terms of their scores on the cognitive tests listed in the Cognitive tasks section. We also established that if no significant differences were found in demographic and psychological variables between MCI clusters and/or controls, we would compare the groups in terms of the ten most important CS characteristics for clustering and cognitive characteristics using separate one-way ANOVA models and Bonferroni post-hoc tests. As was the case for CS characteristics, missing data was replaced by the mean of all participants of the same diagnostic group on the cognitive test of interest. Percentage of missing data for each cognitive test ranged from 0 to 4.8% and can be found in Table 2. Comparing MCI clusters and controls in terms of their demographic, psychological, and cognitive characteristics allowed us to position individuals with MCI and different CS profiles both in relation to one another and to cognitively healthy older adults on these domains. The level of statistical significance was set at p < 0.05. For ANOVAs and ANCOVAs, eta-squared was used as a measure of effect size and values of 0.01, 0.06, and 0.14 indicated small, medium, and large effect sizes, respectively. For chi-square tests, Cramer's V was used as an effect size and values ≤ 0.2, between 0.2 and 0.6 and > 0.6 were considered small, medium, and large effects, respectively.
Results
MCI cluster creation based on CS features
The Two-Step Cluster Analysis conducted with the data from the MCI participants resulted in a two-cluster solution. This solution gave the highest value for the ratio of distance measure (3.116) and the lowest BIC value (11766.309). The silhouette coefficient was 0.3. Out of all MCI participants, 82.4% ended up in the first cluster and the remaining 17.6% ended up in the second cluster. The importance of the ten main predictors (with a weight of 0.70 or higher, in decreasing order) for clustering was as follows: total number of prepositional phrases (1.00), total number of syntactic dependencies (0.96), number of inflected verbs (0.96), total number of words (0.94), number of word repetitions (0.92), number of verb phrases (0.87), number of coordinate phrases (0.86), number of idea repetitions (0.84), number of words denoting uncertainty (0.79), and number of sentence roots (0.74). For a visual representation of group medians, interquartile ranges, and distribution on each of these CS characteristics, as well as significance levels of between-group comparisons, see Figure 1.
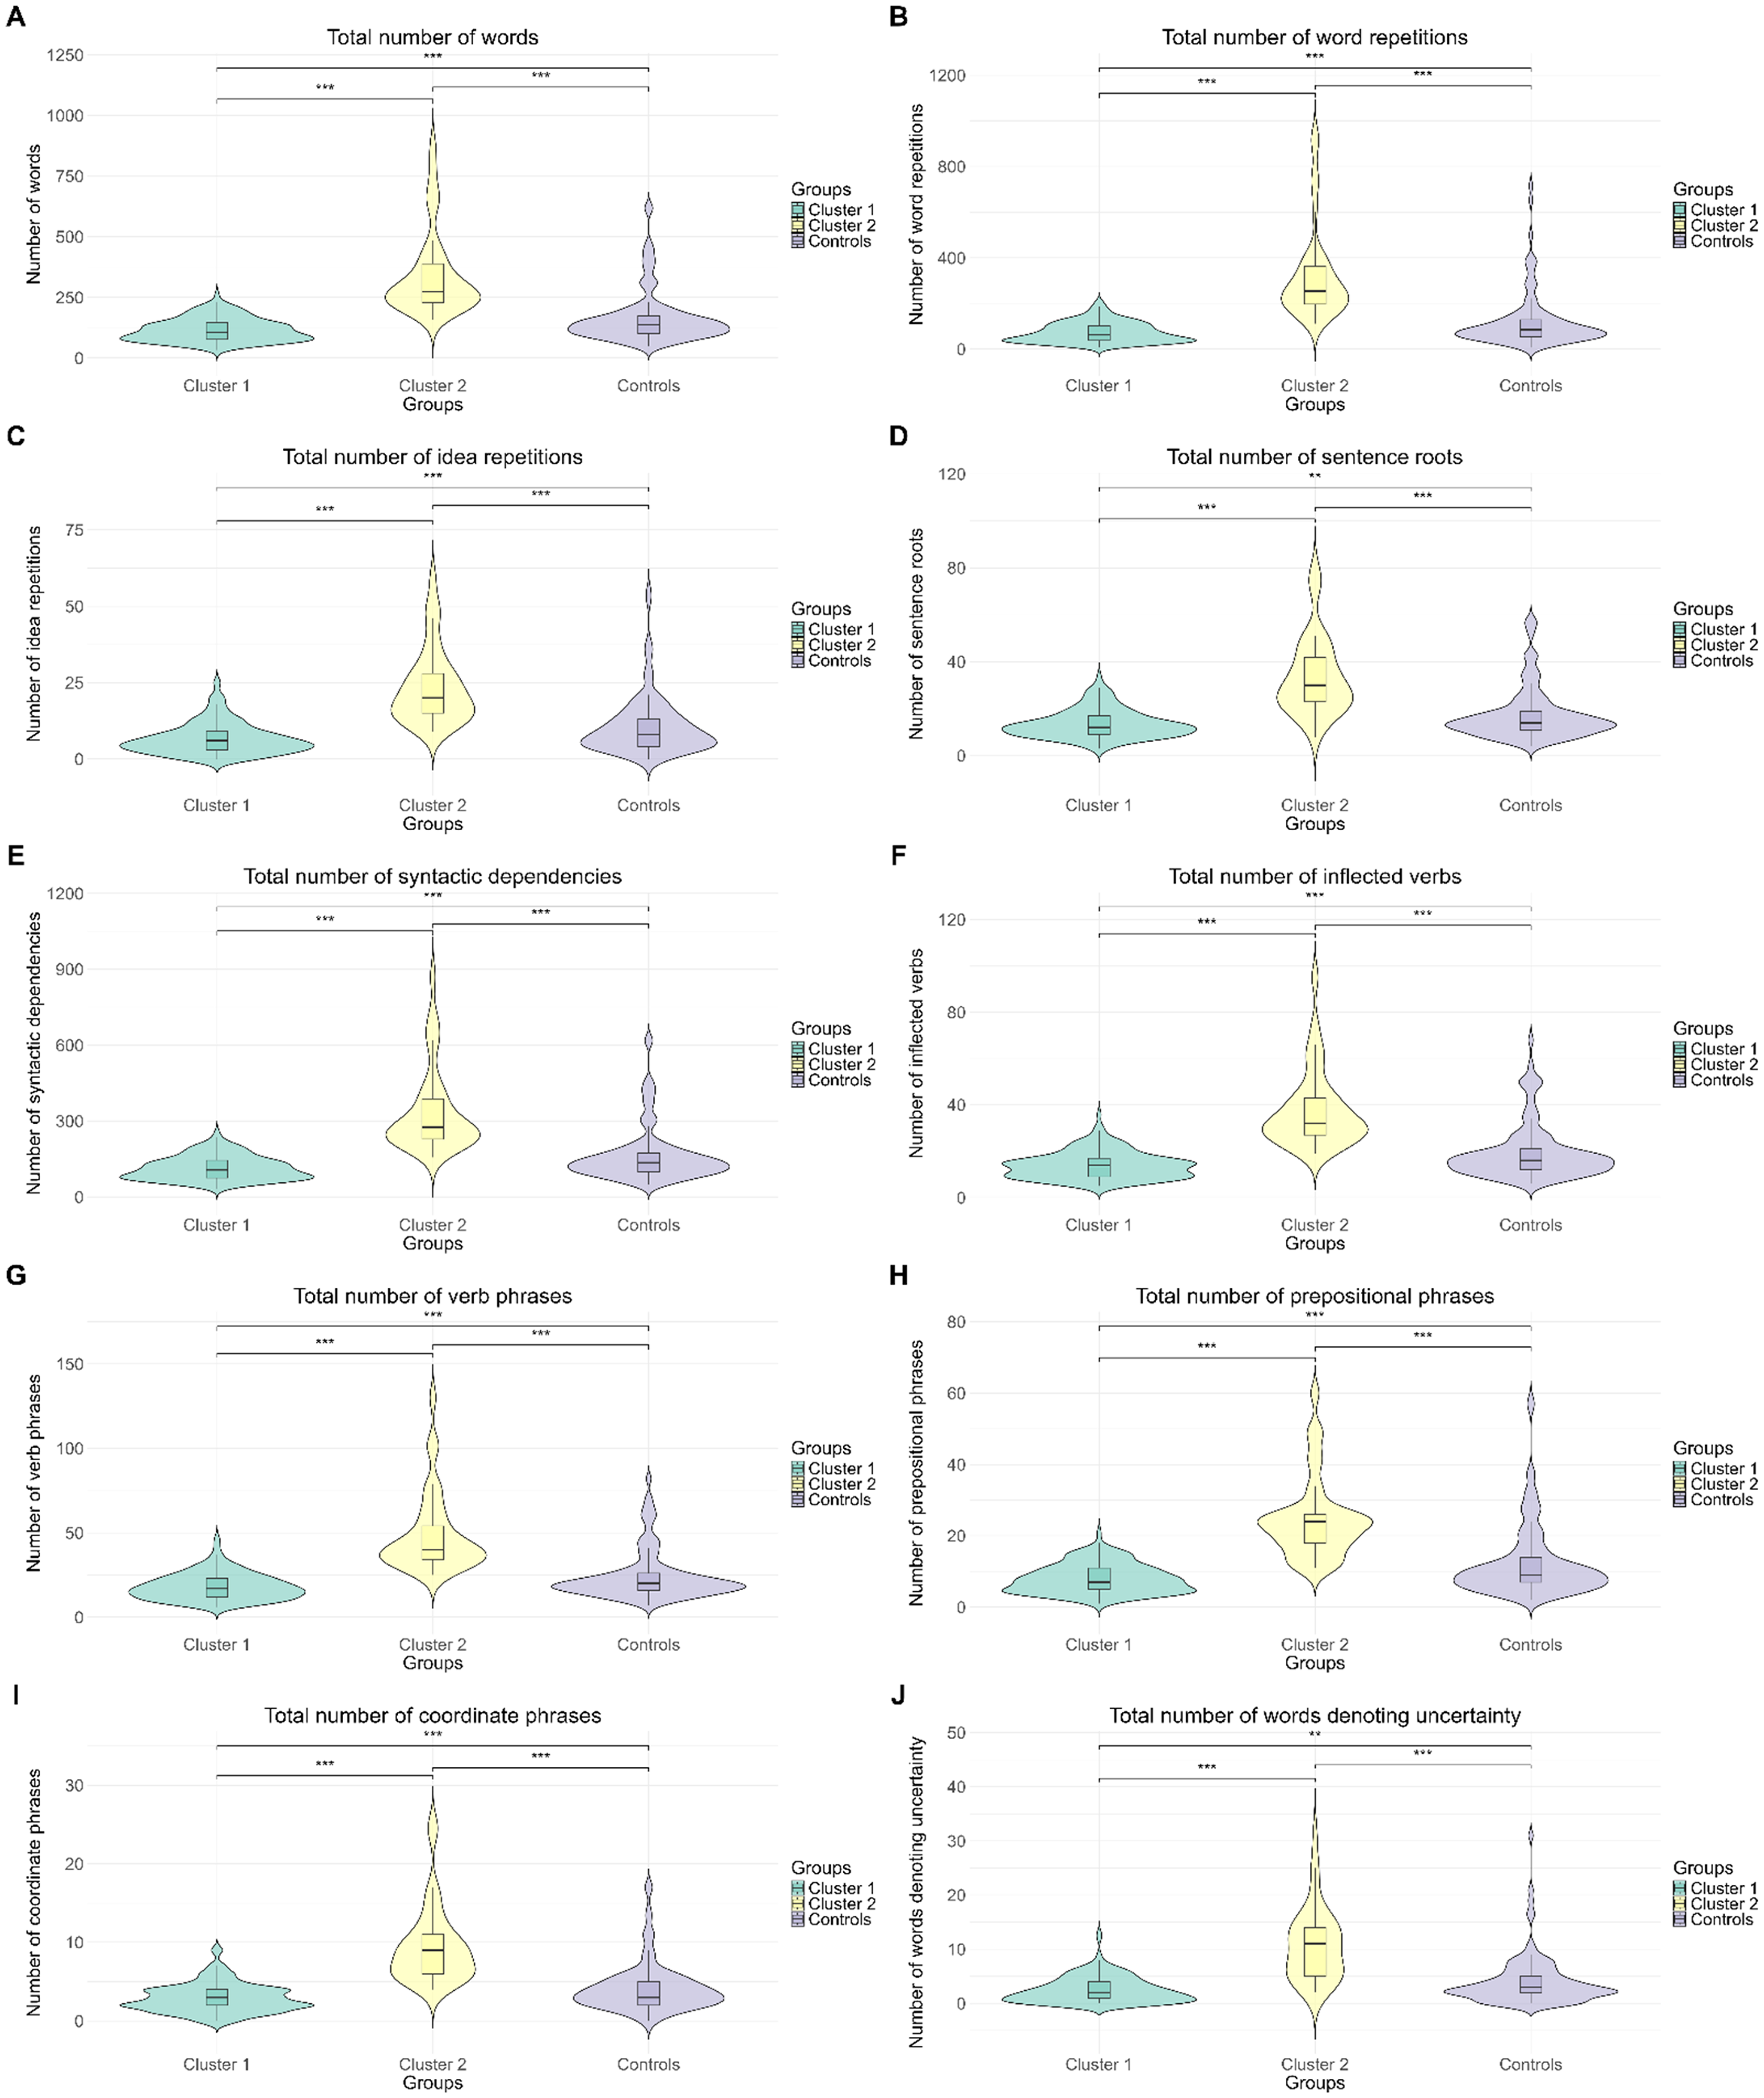
Group values on the ten most important CS characteristics for clustering (A: Total number of words, B: Total number of word repetitions, C: Total number of idea repetitions, D: Total number of sentence roots, E: Total number of syntactic dependencies, F: Total number of inflected verbs, G: Total number of verb phrases, H: Total number of prepositional phrases, I: Total number of coordinate phrases, J: Total number of words denoting uncertainty). The solid horizontal lines represent the median for each group. The vertical rectangular boxes and whiskers represent interquartile range, and the violin represents the density of the data points at any given value of the y-axis. NS: non-significant difference between groups. *p < 0.05, **p < 0.01, p < 0.001.
Group comparisons on demographic and psychological characteristics
Given that demographic and psychological characteristics could influence CS and cognitive characteristics, we ran one-way ANOVAs to determine the effect of group (Cluster 1, Cluster 2, or controls) on age, years of education, and scores on the Geriatric Depression Scale and GAD-7 Questionnaires, and chi square (χ2) analyses to determine if there were significant differences between groups in terms of sex and number of individuals with a first language other than English.
Significant effects of group on years of education (F(2316) = 5.489, p = 0.005, η2 = 0.034), sex (χ2(2316) = 44.116, p < 0.001, Cramer's V = .372), scores on the Geriatric Depression Scale (F(2316) = 23.211, p < 0.001, η2 = 0.128) and GAD-7 (F(2316) = 4.453, p = 0.012, η2 = 0.027) Questionnaires, and number of individuals with a first language other than English (χ2(2316) = 7.018, p = 0.030, Cramer's V = 0.148) were found. Post-hoc analyses revealed that Cluster 2 had more years of education (M = 17.28, SD = 5.03) than Cluster 1 (M = 15.15, SD = 3.61). Moreover, both MCI clusters contained a lower percentage of females than the control group (but a comparable percentage of females to one another) and obtained higher scores on the Geriatric Depression scale than controls (% of females: Cluster 1 = 39.88, Cluster 2 = 45.95, controls = 79.82; Geriatric Depression Scale: Cluster 1: M = 6.90, SD = 5.16, Cluster 2: M = 6.31, SD = 4.64, controls: M = 2.65, SD = 3.55). Cluster 1 also contained a higher percentage of individuals with a first language other than English (28.32%) than controls (14.68%). On the GAD-7 Questionnaire, Cluster 2 (M = 4.27, SD = 4.57) obtained higher scores than controls (M = 2.65, SD = 3.55). There was no significant effect of group on age (F(2316) = 2.602, p = 0.076). Furthermore, MCI clusters did not differ in terms of years of disease duration (t(208) = 0.629, p = 0.265). Complete demographic characteristics for each group can be found in Table 3.
Demographic characteristics for each MCI cluster and controls.
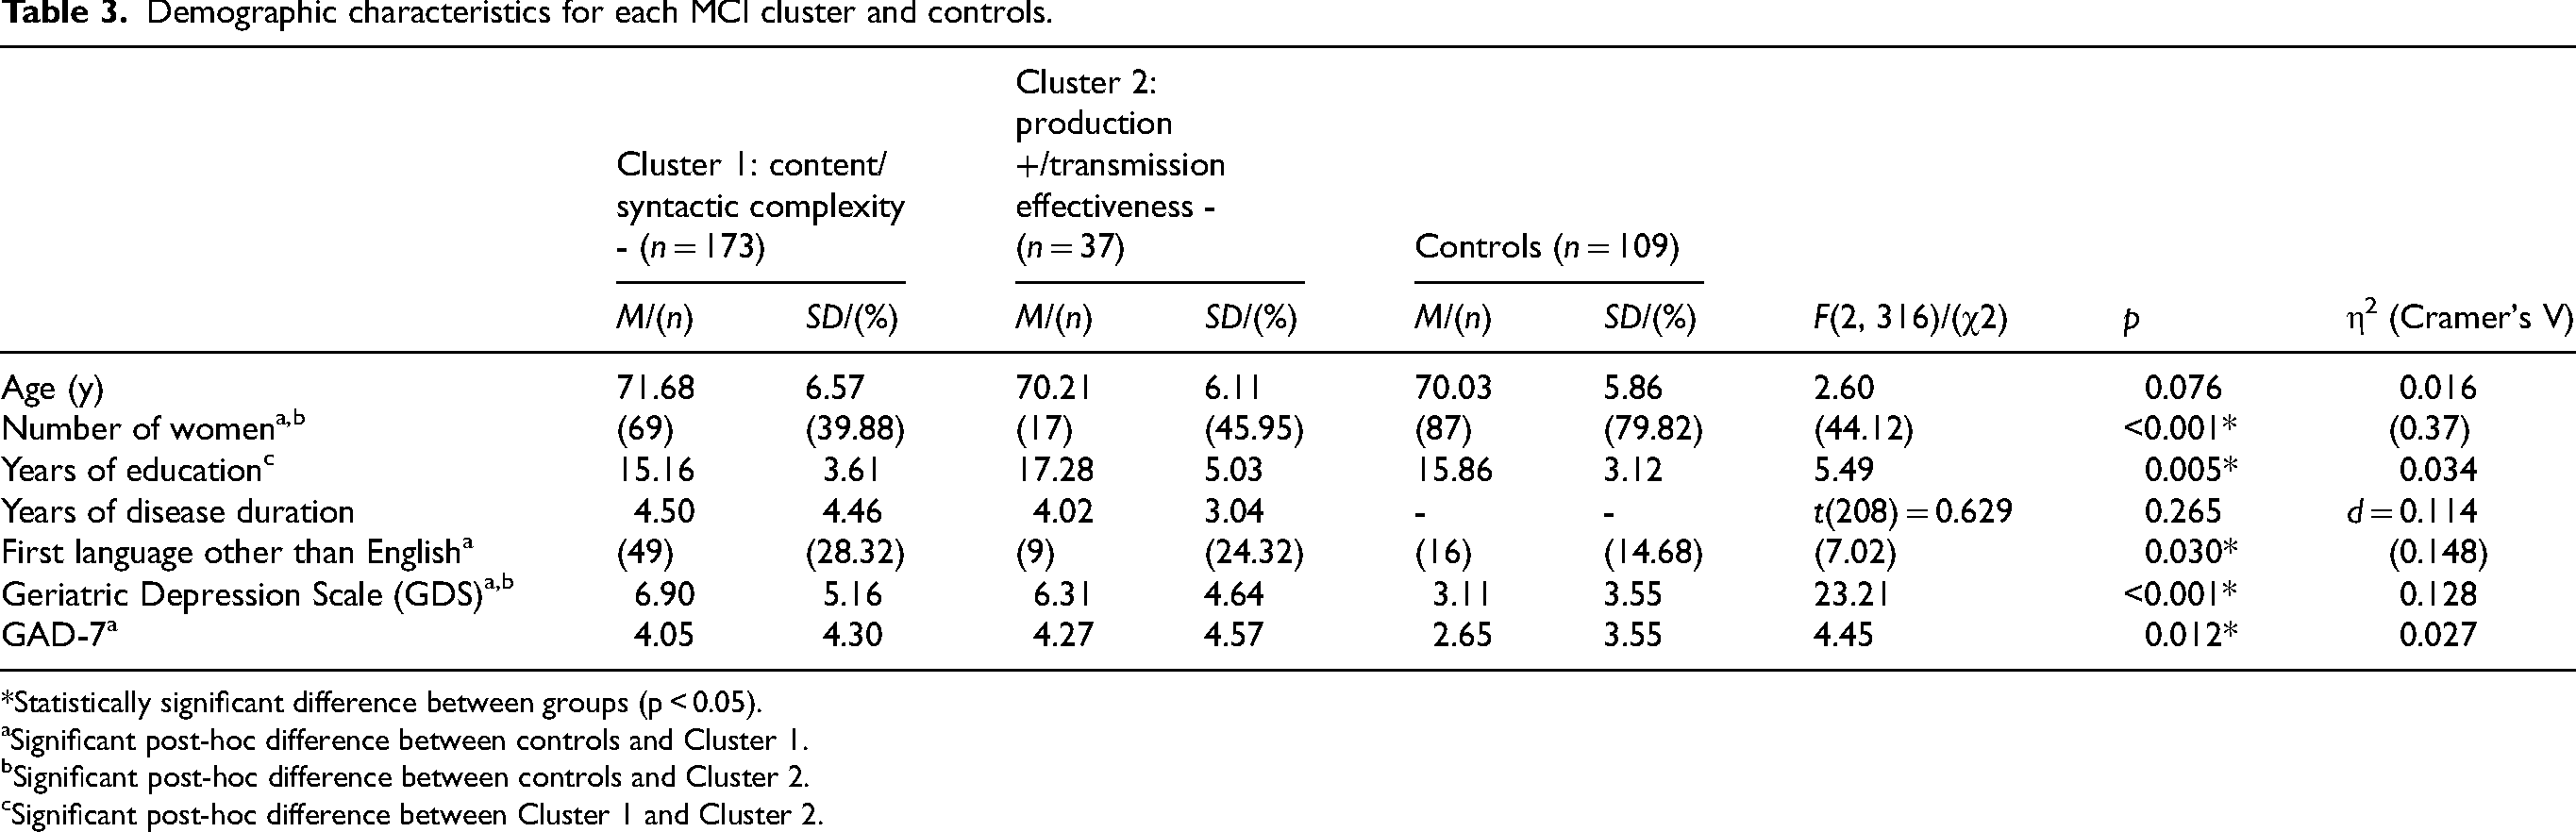
*Statistically significant difference between groups (p < 0.05).
Significant post-hoc difference between controls and Cluster 1.
Significant post-hoc difference between controls and Cluster 2.
Significant post-hoc difference between Cluster 1 and Cluster 2.
Cluster characterization based on linguistic and cognitive characteristics
Linguistic characteristics
The demographic and psychological variables for which there were significant differences between groups to be compared were entered as covariates (sex, number of years of education, number of individuals with a first language other than English, and scores on the Geriatric Depression Scale and GAD-7 Questionnaires) in the ANCOVA models performed to compare MCI clusters and controls in terms of the linguistic characteristics for their CS samples. The mean values of linguistic features for each group, standard deviations and results of the statistical tests are reported in Table 4. The results show that individuals with the first CS profile (Cluster 1) had a lower performance than individuals with the second CS profile (Cluster 2) and controls on variables that are part of the syntactic domain of CS, and mentioned fewer ICUs than these two groups (reduced semantic content and syntactic complexity, from now on, referred to as the content/syntactic complexity - subgroup) after controlling for the demographic and psychological variables on which the groups differed significantly. Individuals with the second CS profile produced longer CS samples and showed more difficulties in the fluency domain of CS than controls and the content/syntactic complexity - subgroup (more filled and empty pauses, more word and idea repetitions). In addition, they had lower efficiencies and had reduced semantic idea densities in 10- and 20-word windows compared to these two groups (increased production/reduced idea transmission effectiveness subgroup, hereafter referred to as the production +/transmission effectiveness - subgroup).
Ten most important linguistic characteristics for clustering by group.
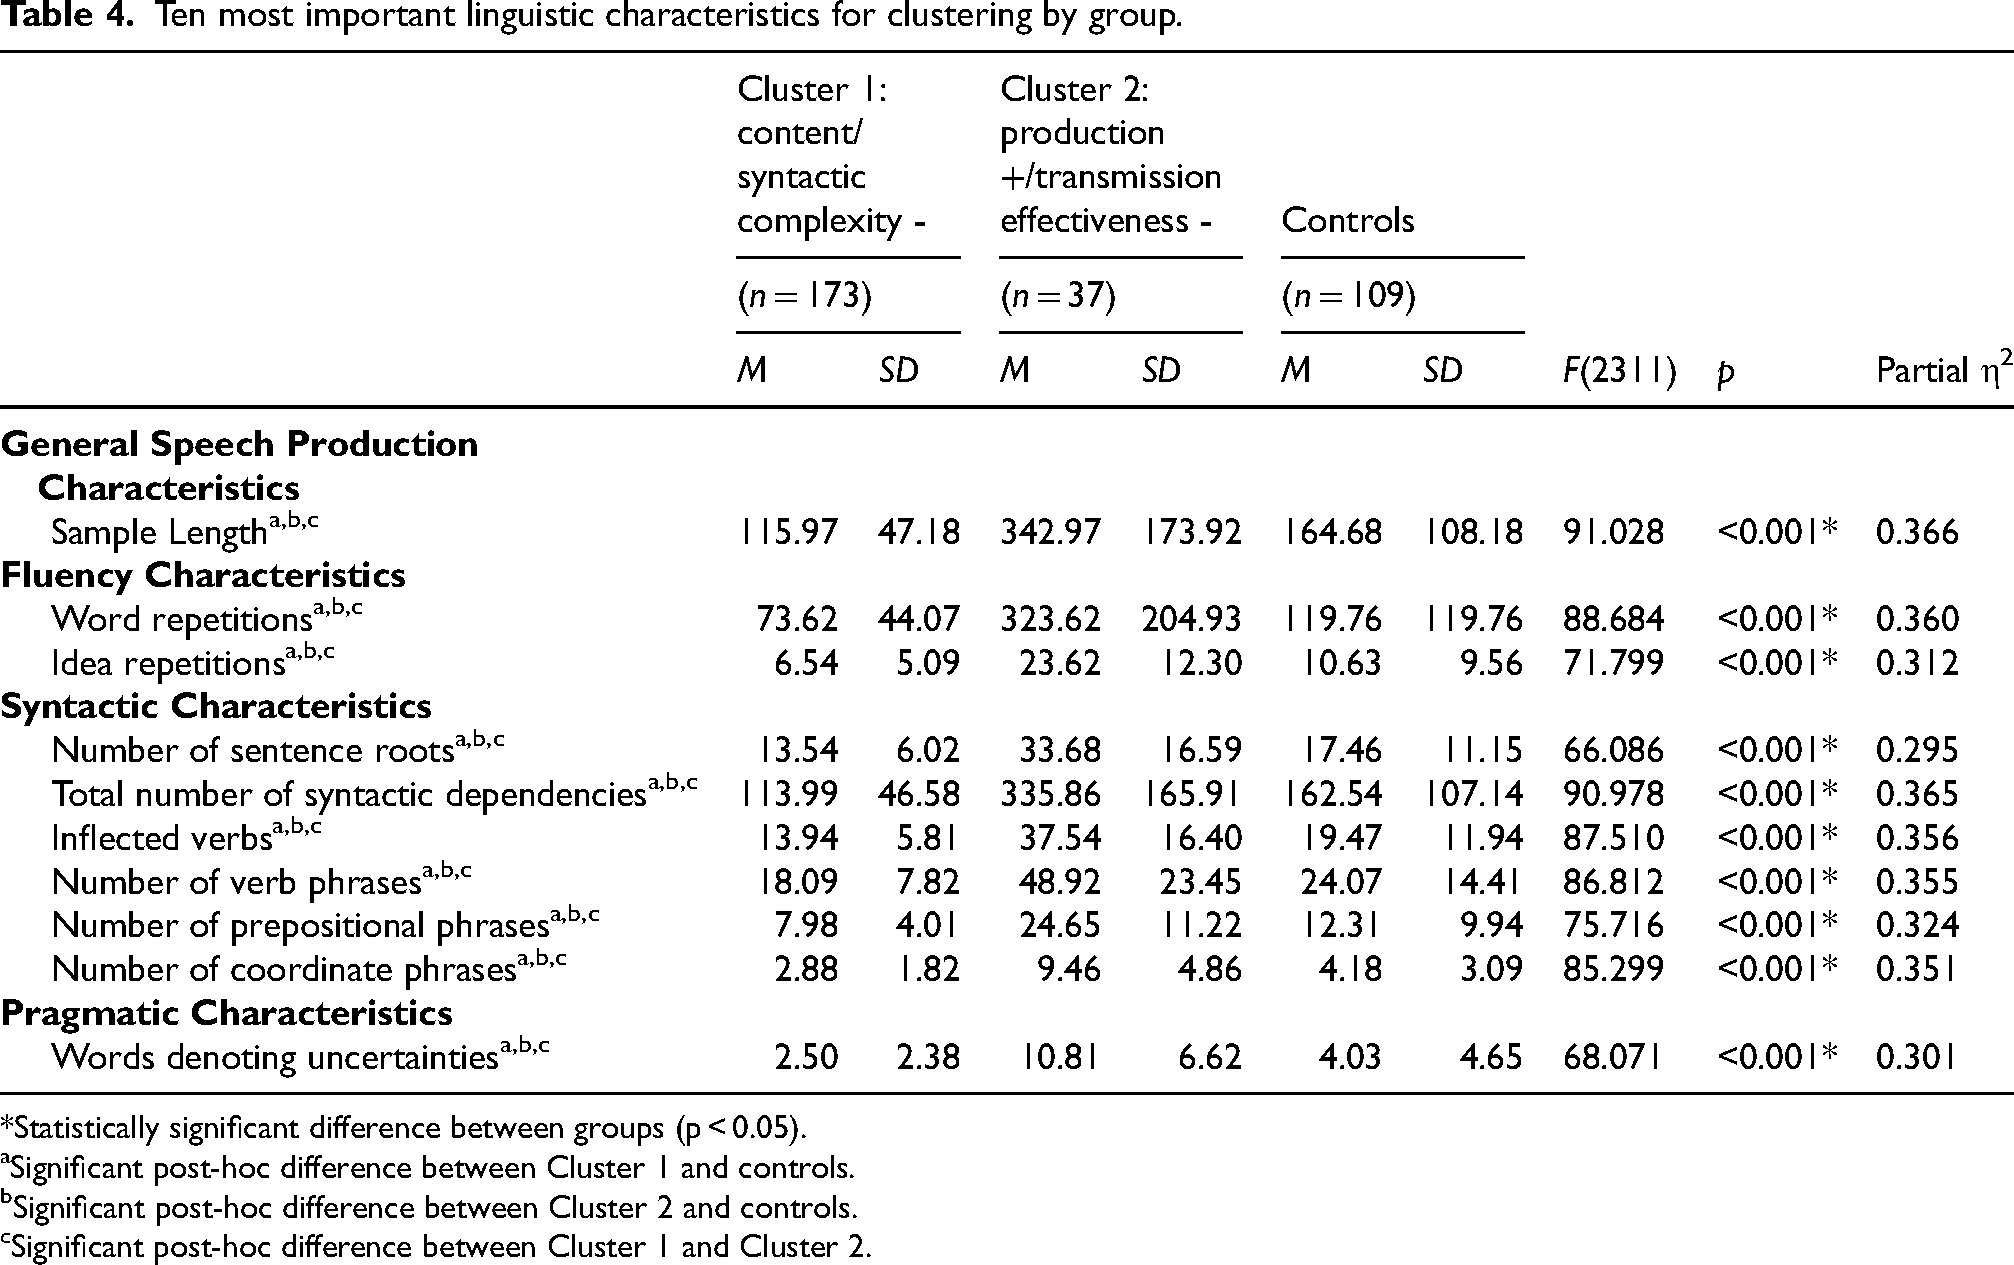
*Statistically significant difference between groups (p < 0.05).
Significant post-hoc difference between Cluster 1 and controls.
Significant post-hoc difference between Cluster 2 and controls.
Significant post-hoc difference between Cluster 1 and Cluster 2.
For completeness, we ran supplementary ANCOVA models and Bonferroni post-hoc tests (for continuous variables), and binary logistic regressions (for categorical variables; with controls and the content/complexity - subgroup set as references) for each CS variable included in the cluster analysis. These results are reported in Supplemental Table 2. Figures representing group medians, interquartile ranges, and distributions of each CS characteristic included in the cluster analysis, as well as significance levels of between-group comparisons on these characteristics can be found here: https://osf.io/u5bvg/.
Cognitive profiles
As for the CS characteristics, ANCOVA models were run to test for cognitive differences between groups (content/syntactic complexity - and production +/transmission effectiveness - subgroups, controls). The same demographic and psychological variables (sex, years of education, number of individuals with a first language other than English and scores on the Geriatric Depression Scale and the GAD-7 Questionnaire) were entered as covariates. Mean scores on cognitive tests, and results of comparisons of these scores between groups are reported in Table 5.
Cognitive characteristics for each MCI cluster and controls controlled by demographics and psychological variables.
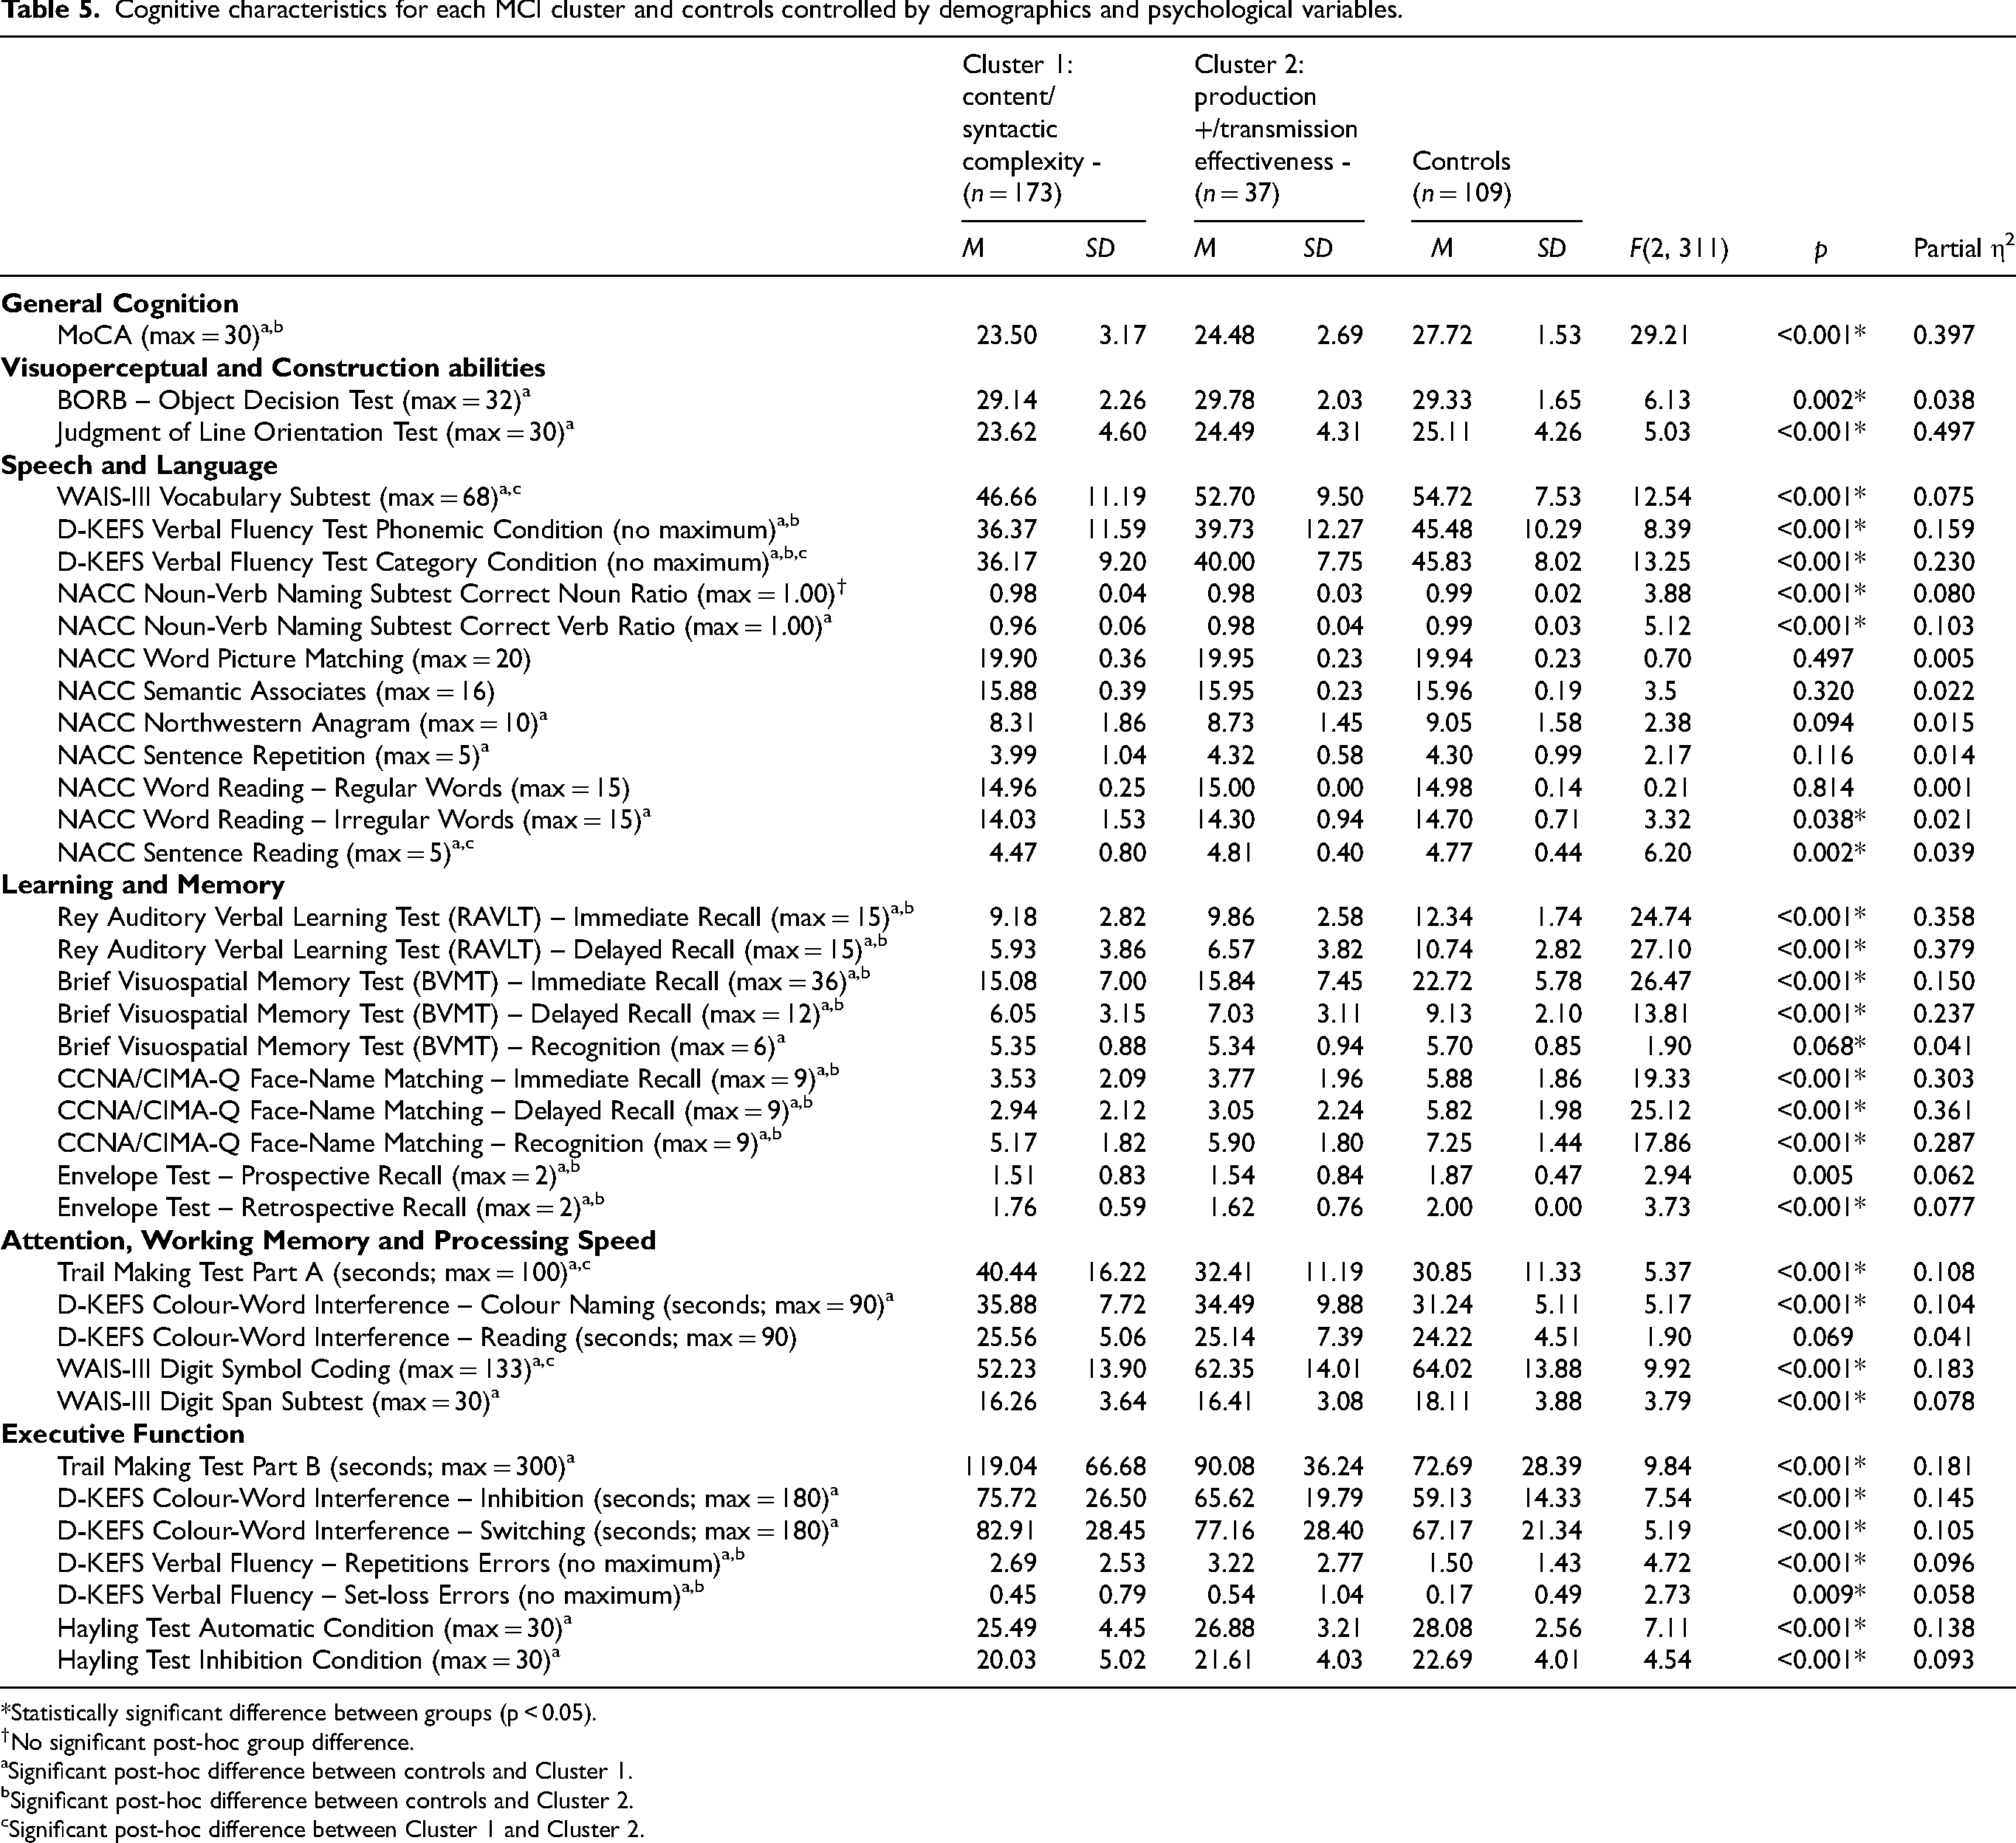
*Statistically significant difference between groups (p < 0.05).
No significant post-hoc group difference.
Significant post-hoc difference between controls and Cluster 1.
Significant post-hoc difference between controls and Cluster 2.
Significant post-hoc difference between Cluster 1 and Cluster 2.
To summarize our results, individuals with both CS profiles showed a lower performance than controls on the MoCA test, assessing general cognitive status, and on Learning and Memory tasks, as assessed by the BVMT, RAVLT, CIMA-Q Face Name Matching Test and the Envelope Test – Retrospective Recall condition. The content/syntactic complexity - subgroup performed more poorly than controls on almost all cognitive tasks. This includes tasks assessing Visuoperceptual and Construction abilities (BORB and Judgement of Line Orientation Test), Speech and Language (WAIS-III Vocabulary subtest, D-KEFS Phonemic and Category Fluency, NACC Noun-Verb Naming, Northwestern Anagram, Sentence Repetition subtest, Word Reading, Irregular Words condition and Sentence Reading subtests), Attention, Working Memory and Processing Speed (Trail Making Test Part A, D-KEFS Colour Word Interference subtest, Colour Naming condition, WAIS-III Digit Symbol Coding subtest, WAIS-III Digit Span subtest), and Executive Function (Trail Making Test Part B, D-KEFS Colour-Word Interference subtest, Inhibition and Switching conditions, D-KEFS Verbal Fluency subtest, set-loss and repetition errors, and Hayling Test, Automatic and Inhibition conditions). Moreover, the content/syntactic complexity - subgroup had a lower performance than the production +/transmission effectiveness - subgroup, mainly on tests relying on semantic abilities (e.g., D-KEFS Verbal Fluency Category condition, WAIS-III Vocabulary subtest) and assessing Executive Function (Trail Making Test Part B, D-KEFS Colour-Word Interference, Inhibition condition), and Processing Speed (Trail Making Test Part A, WAIS-III Digit Symbol Coding subtest). For all these tasks (except for the WAIS-III Digit Span subtest and D-KEFS Verbal Fluency subtest, Phonemic condition), the production +/transmission effectiveness - subgroup performed similarly to controls.
Discussion
The aim of this study was two-fold. Our first aim was to identify potential CS profiles in MCI and to determine their main linguistic characteristics. Furthermore, we aimed to determine whether individuals with MCI who have different CS profiles also differ from one another and from controls in terms of their cognitive characteristics. Our analyses revealed the presence of two CS profiles in our sample of individuals with MCI. The first CS profile was characterized by difficulties in the syntactic domain of CS and the mention of fewer semantic content units (content/syntactic complexity - subgroup), while the second profile was characterized by longer CS samples, reduced semantic idea density and efficiency, the production of more words denoting uncertainty, and difficulties in the fluency domain of CS (production +/transmission effectiveness - subgroup). In terms of cognition, the content/syntactic complexity - subgroup had a lower performance than controls and the production +/transmission effectiveness - subgroup on Visuospatial and Construction, Speech and Language, Learning and Memory, Attention, Working Memory and Processing Speed, and Executive Function tasks. On the other hand, individuals in the production +/transmission effectiveness - subgroup only showed impairment in the Learning and Memory domain. In fact, individuals with MCI who present with syntactic difficulties, and produce less semantic content also tend to have widespread difficulties in various cognitive domains. This evidence suggests that the analysis of CS could help rapidly screen individuals with MCI who would benefit the most from a complete neuropsychological assessment, medical examination and/or cognitive and pharmacological interventions. In-depth cognitive testing and interventions is not always accessible (whether it be because of cost, distance from testing centers, or long waiting times). Therefore, having accessible screening tools that can be used remotely to identify individuals with MCI who should be prioritized when resources are less accessible is important.
Firstly, we demonstrated the presence of multiple CS profiles in our MCI sample. The presence of multiple CS profiles in our sample of individuals with MCI is consistent with the heterogeneity of CS characteristics documented in the literature. More specifically, the high importance of fluency and syntactic characteristics, and of one speech production characteristic (total length of CS sample) for distinguishing the different CS profiles in our sample of individuals with MCI is not surprising, as findings on the state of these characteristics in MCI are particularly heterogenous in the literature.1,2,24 Nevertheless, the absence of semantic characteristics (especially, of semantic idea density), among the most important characteristics for clustering is somewhat surprising, given that there are discrepancies in the literature on the state of these characteristics in MCI.1,28 In the present study, it is probable that the information semantic idea density could have provided for distinguishing the different CS profiles was already accounted for by some of the most important predictors for clustering, such as total number of words in the CS sample, word repetitions, and idea repetitions. Even though semantic idea density was not one of the most important characteristics for clustering, we found a statistically significant difference between clusters, with a large effect size on this characteristic. This makes us think that it could represent an important characteristic of the content/syntactic complexity - profile. The presence of different CS profiles in MCI could explain the heterogenous literature on CS characteristics in this population. Our study is the first to explain this heterogeneity by demonstrating the presence of multiple CS profiles in MCI and to investigate the presence of multiple CS profiles in individuals on the AD continuum using a data-driven approach.
Secondly, the richness of the COMPASS-ND database, allowed us to identify differences in cognitive performance between individuals with MCI presenting with different CS profiles. These cognitive profiles very likely offer some insight into the origins of the CS difficulties exhibited by individuals with the different profiles. Overall, individuals in the content/syntactic complexity - subgroup presented with greater cognitive impairment than those in the production +/transmission effectiveness - subgroup. The syntactic difficulties of individuals in the content/syntactic complexity - subgroup could be the result of their in the Speech and Language, Attention, Working Memory, and Processing Speed, and Executive Function cognitive domains. In fact, previous studies have linked working memory (used to keep the words to be said in mind and order them according to a chosen structure) and syntactic difficulties.29,30 Attentional difficulties have also been linked with lowered syntactic complexity on a picture description task, 31 but the mechanisms behind this link remain unclear. It is possible, however, that not paying attention to the details on a picture to be described leads to fewer information to be conveyed and less complex sentences. Furthermore, the reduced number of semantic content units (ICUs) in the CS samples of difficulties of individuals with the content/syntactic complexity - CS profile could be explained by their difficulties on cognitive tasks soliciting semantic knowledge (e.g., D-KEFS Verbal Fluency Test, Categorical Condition, WAIS-III Vocabulary Subtest; this knowledge might be reduced in these individuals and/or it might be harder for them to access it). On another note, the fluency difficulties of individuals in the production +/transmission effectiveness - subgroup could be the result of their word-finding and executive functioning difficulties (in inhibition and potentially, in planning, although this not investigated in the present study).13,24,32,33 In this case, their word-finding difficulties would most likely represent lexical access difficulties, as opposed to being the result of a degradation of semantic representations, given their results on Speech and Language tasks (more difficulties in tasks soliciting lexical access as opposed to semantic knowledge when compared to controls) and the fact that the semantic characteristics of their CS samples were comparable to controls’. The cognitive differences between our CS profiles remain significant after controlling for number of years of education, which means that they cannot solely be attributed to potential differences in cognitive reserve between the CS profiles. To this day, very few large dementia research initiatives have included both CS samples and an extensive neuropsychological battery. For this reason, very few studies have investigated the links between CS characteristics and cognition in individuals with MCI. Our study therefore contributes to filling an important gap in the literature.
Our results suggest that studying the CS profiles of individuals with MCI could help identifying individuals who present more widespread and multidomain cognitive difficulties, and who are at different risks of progressing to AD and/or different stages of AD. In fact, the content/syntactic complexity - CS profile presents with similar cognitive impairments to those found in multi-domain amnestic MCI 5 and/or in the ‟Mixed” profile (episodic memory, executive function, language and visuospatial deficits) described in Jester and colleagues and Clark and colleagues.34,35 The production +/transmission effectiveness - profile could correspond to single domain amnestic MCI or multi-domain amnestic MCI, 5 depending on the criteria used for considering a cognitive function impaired (e.g., two standard deviations below the mean), and closely resembles the ‟Amnestic/Language” profile (episodic memory and mild verbal fluency impairments) previously described in the literature.34,36 Individuals with the content/syntactic complexity - CS profile could be at an increased risk of progressing to AD. In fact, individuals with multi-domain amnestic MCI, a greater number of cognitive difficulties and/or more severe difficulties in the episodic memory, executive function, attention, processing speed, language and visuospatial domains have been documented to progress to AD at higher rates than individuals who present with single domain amnestic MCI, fewer cognitive difficulties overall and/or less severe difficulties in the previously listed domains.37–39 Moreover, individuals with the content/syntactic complexity - CS profile could be at a more advanced stage of MCI, as they have a greater number of cognitive deficits.40–42 Similarly, the production +/transmission effectiveness - CS profile is consistent with an earlier stage of AD. In fact, Pistono and colleagues 43 suggested that pauses in CS might be a compensatory mechanism for semantic and/or lexical access difficulties (the most likely possibility for our production +/transmission effectiveness - subgroup given their results on Speech and Language tasks) in the early stages of the disease. If individuals with the production +/transmission effectiveness - profile are indeed at an earlier stage of the disease, it would mean that fluency and idea transmission effectiveness changes are among the first changes in CS related to AD to occur. As the disease progresses, impairments would spread to other domains of CS. Finally, although individuals with both CS profiles have similar years of disease duration, they could have different disease trajectories or progression rates, with the content/syntactic complexity - subgroup progressing faster and being at a later stage of AD than the production +/transmission effectiveness - subgroup. It is also possible that these subgroups will progress to different variants of AD.
The main strengths of the present study are as follows: 1) we used the COMPASS-ND study database, containing participants from different areas of Canada, making our sample as representative of the Canadian population as possible, 2) the database we used contains CS samples as well as an extensive neuropsychological battery that covers a variety of cognitive domains, allowing us to study participants’ cognitive profiles and to gain a greater understanding of how cognition and the linguistic characteristics of CS in MCI can interact with one another in MCI, 3) our sample of MCI participants is of far greater size than those of other CS studies in MCI. 24 Despite these strengths, this study is not without limitations. First, we did not have access to any longitudinal, biomarker (amyloid-β and tau protein) and neuroanatomical data for our participants, which prevented us from mapping with certainty the CS profiles to different stages of AD or to different risks of developing the disease. This information should be collected systematically in future large dementia initiatives to identify the CS profile(s) that could be indicative of early AD and to allow for a better understanding of how CS evolves over the course of the disease. A good proportion of our sample was also highly educated (mean education level: undergraduate degree or higher), which means that it was potentially more homogenous than the general population of individuals with MCI, and that our results might not perfectly apply to individuals with MCI who have a lower level of education. Similarly, both MCI clusters contained a lower percentage of females than males. Therefore, the CS profiles found in our study might reflect only partially the CS profiles of females with MCI. Moreover, both MCI clusters contained a lower percentage of females than controls, which could raise questions about the potential impact of sex on some of the results. However, given the fact that significant differences in CS and cognitive characteristics were found between clusters and controls after controlling for sex, it is unlikely that our results are entirely explained by sex differences between groups. Nevertheless, this approach did not allow us to study the effect of sex itself on CS and cognitive characteristics. Furthermore, while we opted for an inclusive approach while deciding which CS characteristics to extract for this study to ensure that we would get as exhaustive a portrait of CS in our sample as possible and that we would not miss any important information for clustering (and while we reduced the number of characteristics by more than 50% before the final analysis), we recognize that the inclusion of 72 CS characteristics in the final analysis might have made the main strengths and weaknesses of each CS profile more difficult to define. Finally, when looking at our results, it is important to keep in mind that most participants with MCI in the COMPASS-ND study were recruited in memory or behavioral neurology clinics. Individuals with MCI from memory clinics tend to be diagnosed with amnestic MCI more often than non-amnestic MCI 41 and tend to progress to AD more often than those in the community. 42 This means that a greater proportion of our sample could have amnestic MCI and be at an increased risk of progressing to AD compared to the general population of individuals with MCI. Further longitudinal studies of CS profiles in MCI with extensive cognitive data and longitudinal data on patients’ diagnosis evolution, biomarkers (amyloid-β and tau protein), and neuroanatomical data are needed to validate the potential of CS as a screening tool in MCI.
In conclusion, this study used a data-driven approach to provide novel and complementary evidence for the potential of CS as a screening tool to help with the detection of individuals with MCI who present with more extensive cognitive difficulties and who would benefit from more extensive cognitive and/or medical testing and from cognitive and/or pharmacological interventions. Availability of these resources is limited, so it is crucial that they are allocated in priority to individuals who need them most.
Supplemental Material
sj-docx-1-alz-10.1177_13872877251329615 - Supplemental material for Connected speech profiles in mild cognitive impairment reflect global cognition
Supplemental material, sj-docx-1-alz-10.1177_13872877251329615 for Connected speech profiles in mild cognitive impairment reflect global cognition by Sophie Pellerin, Bérengère Houzé, Christophe Bedetti, Natalie Phillips and Simona Maria Brambati in Journal of Alzheimer's Disease
Footnotes
Acknowledgements
The authors have no acknowledgements to report.
Ethical considerations
The COMPASS-ND study and the use of its data for the present study were approved by all participating centers’ Research Ethics Committee or Institutional Review Board.
Consent to participate
All participants and their study partners provided written informed consent at the start of the COMPASS-ND study.
Consent for publication
Not applicable
Author contributions
Simona Brambati (Conceptualization; Funding acquisition; Supervision; Writing – review & editing); Sophie Pellerin (Conceptualization; Formal analysis; Investigation; Methodology; Writing – original draft); Bérengère Houzé (Formal analysis; Writing – review & editing); Christophe Bedetti (Data curation; Resources; Software; Writing – review & editing); Natalie Phillips (Conceptualization; Data curation; Funding acquisition).
Funding
The author(s) disclosed receipt of the following financial support for the research, authorship, and/or publication of this article: The Canadian Consortium on Neurodegeneration in Aging (CCNA) is supported by a grant from the Canadian Institutes of Health Research [grant number CNA-163902] with funding from several partners. S.P is supported by an Fonds de recherche du Québec – Santé (FRQS) Doctoral Training Award. This study is also funded by the Natural Sciences and Engineering Research Council of Canada (NSERC; grant number RGPIN-2022-04409) and the Chaire Courtois en recherche fondamentale III (neuroscience) of l’Université de Montréal (awarded to S.M.B). Funding sources were not involved in the preparation of the article or in any part of the conception or the conduction of this study.
Conflicting interests
The author(s) declared no potential conflicts of interest with respect to the research, authorship, and/or publication of this article.
Data availability
Supplemental material
Supplemental material for this article is available online.
References
Supplementary Material
Please find the following supplemental material available below.
For Open Access articles published under a Creative Commons License, all supplemental material carries the same license as the article it is associated with.
For non-Open Access articles published, all supplemental material carries a non-exclusive license, and permission requests for re-use of supplemental material or any part of supplemental material shall be sent directly to the copyright owner as specified in the copyright notice associated with the article.