
Abstract
Background
Previous studies have suggested that early-phase imaging of amyloid positron emission tomography (PET) may offer information for predicting amyloid positivity.
Objective
This study aimed to evaluate whether early-phase fluorine-18 flutemetamol (eFMM) PET images provide valuable information for predicting amyloid positivity using machine learning (ML) models and whether incorporating clinical and neuropsychological features improves predictive performance.
Methods
In total, 454 patients with mild cognitive impairment (MCI) and Alzheimer's disease (AD) were enrolled and randomly divided into training (n = 354) and test (n = 100) groups. We developed ML models using logistic regression (LR) and linear discriminant analyses (LDA) for predicting amyloid positivity: eFMM features alone (eFMM model), eFMM features combined with clinical features (eFMM + C model), eFMM features combined with neuropsychological features (eFMM + N model), eFMM features combined with both clinical and neuropsychological features (eFMM + C + N model), clinical and neuropsychological features combined (C + N model), and dFMM features alone (dFMM model).
Results
In the test group, the eFMM models achieved areas under the receiver operating characteristic curves (AUROCs) of 0.791 (LR) and 0.779 (LDA). The eFMM + C + N models significantly improved predictive performance, with AUROCs of 0.902 for both LR and LDA, outperforming the eFMM models.
Conclusions
ML predictive models using eFMM PET data demonstrated fair performance in predicting amyloid positivity in patients with MCI and AD. The addition of relevant clinical and neuropsychological features further enhanced the predictive performance of the eFMM models, achieving excellent performance.
Keywords
Introduction
Fluorine-18 flutemetamol (FMM), approved in 2013 by the Food and Drug Administration, is a positron emission tomography (PET) radiotracer that non-invasively detects amyloid-β (Aβ) deposition in the brain, aiding in the diagnosis and management of patients with cognitive decline.1,2 Alzheimer's disease (AD) is pathologically characterized by the accumulation of Aβ and tau proteins in the brain, with Aβ plaques serving as a key feature of the disease. 3 Delayed-phase fluorine-18 flutemetamol (dFMM) images acquired 90–110 min after FMM injection are utilized for visual assessment of amyloid positivity.4,5 In contrast, early-phase fluorine-18 flutemetamol (eFMM) images, acquired shortly after radiotracer injection, provide information not only on cerebral blood flow (CBF) and neuronal injury but also on glucose metabolism.5–11 Furthermore, they may contain information regarding amyloid positivity.8,12 Komori et al. used a U-net convolutional neural network and a conditional generative adversarial network to transform early-phase carbon-11 Pittsburgh Compound-B (PiB) PET images into artificial intelligence (AI)-predicted delayed-phase images, achieving a 79% concordance rate for amyloid positivity between actual and predicted images. 12 Mathies et al. reported that incorporating eFMM improves the visual assessment of amyloid positivity in dFMM PET compared to evaluating dFMM images alone. 8 These findings suggest that amyloid positivity might be inferred from eFMM PET data. Compared to dFMM PET, which requires delayed imaging 90–110 min after radiotracer injection, eFMM PET offers a more time-efficient approach by enabling image acquisition shortly after radiotracer injection. Recent advancements in nuclear medicine imaging technologies and workflow optimization have enabled reductions in scan time, improvements in patient convenience and throughput, and enhancements in cost-effectiveness and operational efficiency for healthcare institutions.13–15 If amyloid positivity can be reliably inferred from eFMM PET images instead of dFMM images, this approach may offer several practical advantages, including shorter waiting times, improved patient comfort, increased scanner availability, and reduced imaging-related costs. Furthermore, eFMM PET may serve as a feasible option for repeated imaging in the context of anti-amyloid therapies, while also offering the additional advantage of simultaneously providing information on CBF, neuronal injury, and glucose metabolism,5–11 thereby extending its clinical utility beyond the evaluation of amyloid burden alone.
Machine learning (ML) algorithms are increasingly utilized as crucial tools for analyzing PET data, offering an effective approach to uncovering meaningful insights from large complex PET datasets. 16 ML-based predictive models have demonstrated effectiveness in predicting amyloid positivity on amyloid PET.17–19 For instance, Kang et al. conducted a study involving 529 patients with amnestic mild cognitive impairment (MCI) and reported that an ML-based predictive model incorporating age, sex, hypertension, diabetes, apolipoprotein E (APOE) genotype, education, neuropsychological test scores, and magnetic resonance (MR) features achieved a robust area under the receiver operating characteristic curve (AUROC) of 0.892 in predicting amyloid PET positivity based on results from internal validation. 17 Youn et al. demonstrated that in a study involving 312 individuals, a random forest predictive model utilizing ethylenediaminetetraacetic acid-based multimer detection system-oligomeric Aβ, age, mini-mental state examination (MMSE), and APOE achieved the best predictive performance for amyloid PET positivity, with an accuracy of 77.14% and an F1-score of 85.44%. 18 Park et al. reported that in 139 patients with MCI and AD, a logistic regression (LR) classifier incorporating MMSE scores and regional MR brain volumes with features selected through recursive feature elimination achieved an accuracy of 81.1% and an AUROC of 0.79 for amyloid positivity. 19 Although various ML models have been explored for predicting amyloid PET positivity, no studies have specifically focused on models utilizing eFMM PET images.
In this study, we hypothesized that ML predictive models based solely on eFMM PET images may contain information on amyloid positivity in patients with MCI and AD. Additionally, we aimed to evaluate whether ML predictive models incorporating both eFMM and clinically relevant data associated with amyloid positivity would demonstrate improved predictive performance for amyloid positivity. The predictive performance of the generated eFMM models was compared with that of the dFMM models to evaluate the differences between them.
Methods
Study population
Patients were enrolled in this study according to the following inclusion and exclusion criteria. The inclusion criteria were as follows: 1) patients who visited Ajou University Medical Center between April 2017 and September 2023, 2) patients who presented to the neurology or psychiatry departments due to cognitive decline, including those clinically diagnosed with MCI based on the criteria proposed by Petersen and colleagues 20 and AD based on the 2011 diagnostic guidelines from the National Institute on Aging and the Alzheimer's Association 21 by board-certified neurologists or psychiatrists, and 3) patients who underwent both eFMM and dFMM PET/computed tomography (CT) scans. A total of 579 patients met all inclusion criteria and were included. The exclusion criteria were as follows: 1) patients not clinically diagnosed with MCI or AD (n = 109), 2) patients who did not undergo neuropsychological tests or those whose neuropsychological tests were conducted more than 3 months before the FMM PET/CT scan (n = 7), 3) patients who did not undergo three-dimensional (3D) T1-weighted brain MR imaging or whose brain MR was not conducted within 2 months of the FMM PET/CT scan (n = 6), 4) patients who underwent two or more FMM PET/CT scans during the study period (n = 2), and 5) patients diagnosed with stroke (n = 1). A total of 454 patients with MCI and AD were enrolled and randomly assigned to the training (n = 354) and test (n = 100) groups. Randomization was performed by assigning a random number between 0 and 1 to each patient using the RAND function in Microsoft Excel 2019, followed by sorting based on these values.
This study was conducted as a retrospective analysis using imaging and clinical data registered in the Biobank of Ajou University Medical Center, a member of the Korea Biobank Network (AJHB-ABD-2024-08). Imaging and clinical data were collected from patients who visited neurology or psychiatric memory outpatient clinics and provided written informed consent for enrollment in the Biobank. All patients had consented to the use of their data for future research at the time of Biobank enrollment. This retrospective study was approved by the Institutional Review Board of Ajou University Medical Center (AJOUIRB-EX-2024-493).
Clinical and neuropsychological features
In this study, four clinical and nine neuropsychological features were analyzed. The clinical features included age, sex, APOE genotype, and years of education. Among these, the APOE genotype was treated as a binary feature, indicating the presence or absence of the APOE ε4 allele. The nine neuropsychological features included the MMSE, clinical dementia rating (CDR), clinical dementia rating-sum of boxes (CDR-SB), global deterioration scale (GDS), and percentile scores for the attention, language, visuospatial, memory, and frontal/executive domains from the second edition of the seoul neuropsychological screening battery (SNSB-II).
Acquisition protocol for brain MR
Brain MR scans were acquired using a 3.0 T Discovery MR750w scanner (GE Healthcare, Chicago, IL, USA). 3D T1-weighted images were obtained using a fast-spoiled gradient-recalled echo sequence with the following parameters: repetition time, 8.404 ms; echo time, 3.184 ms; flip angle, 12°; matrix size, 200 × 200. The slice thickness was set to 1.0 mm, yielding an isotropic voxel size of 0.7813 mm × 0.7813 mm × 1.0 mm. The field of view was 156 mm × 156 mm.
Acquisition protocol for FMM PET/CT and interpretation of amyloid positivity
eFMM and dFMM PET/CT images (Vizamyl; GE Healthcare) were acquired using a Discovery STE scanner (GE Healthcare, Milwaukee, WI, USA). Early-phase imaging began with the acquisition of a brain CT scan performed at 100 kV and 95 mA, with a section thickness of 3.75 mm. Following the intravenous administration of 185 MBq (5 mCi) FMM, dynamic PET data were acquired in 3D mode for 10 min, with each frame lasting 60 s. Delayed imaging commenced 90 min post-injection, during which PET data were obtained over a 20-min period, using four frames of 5 min each, also in a 3D mode. A brain CT scan, identical to that used in the early-phase imaging, was performed before acquiring the dFMM PET data. All PET images were reconstructed iteratively using an ordered-subset expectation maximization, applying two iterations, 21 subsets, and a gaussian filter with a full width at half maximum of 2.14 mm. The final reconstructed PET images had a resolution of 128 × 128 matrix, with CT data used for attenuation correction.
Two board-certified nuclear medicine physicians (Y.J.P. and Y.S.A.) visually interpreted the dFMM PET images using axial, sagittal, and coronal views, following the standard criteria for amyloid imaging. The scans were classified as either amyloid-negative or amyloid-positive based on the presence and intensity of cortical uptake in five key regions: the frontal pole/lobe, posterior cingulate/precuneus, lateral temporal lobe, parietal lobe, and striatum (Figure 1). 2 When the two nuclear medicine physicians classified amyloid positivity differently, they reviewed the images again and reached a consensus for the final classification of amyloid positivity.
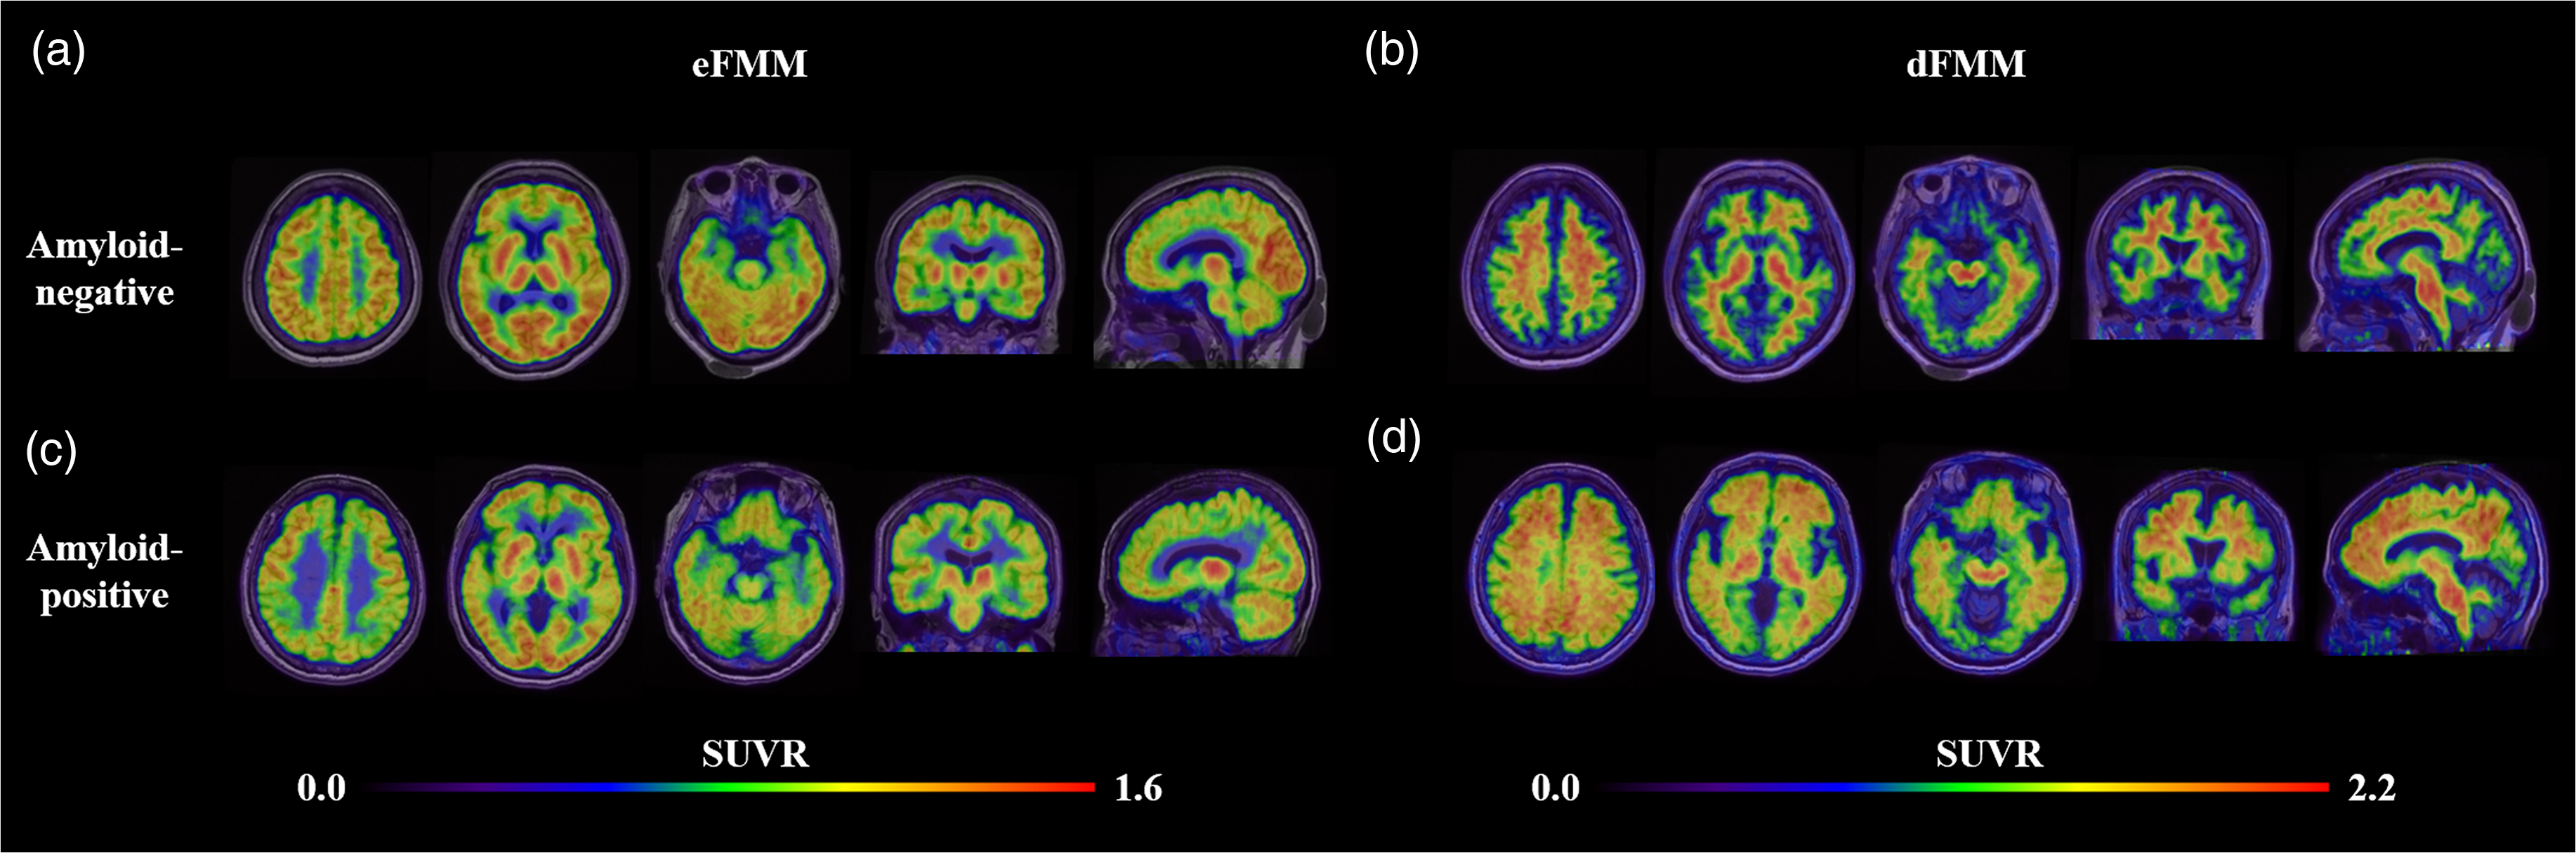
Representative eFMM and dFMM PET/MR fusion images in amyloid-negative and amyloid-positive patients. In the amyloid-negative patient (a, b), no abnormal findings are observed in both phase images. In the amyloid-positive patient, eFMM PET (c) reveals globally reduced eFMM uptake in the bilateral parietal regions, and dFMM PET (d) reveals severe amyloid deposition in most of the target key regions. The color bars of eFMM and dFMM PET indicate SUVRs using the whole cerebellum and brainstem as the reference regions, respectively.
Calculation of SUVRs in eFMM and dFMM PET
Heuron Brain PET version 1.0.1.4 (Heuron Co., Ltd, Republic of Korea, iheuron.com) was used to calculate standardized uptake value ratios (SUVRs) from the eFMM and dFMM PET images. 22 It utilizes eFMM or dFMM images along with 3D T1-weighted MR images to generate SUVRs by analyzing the voxel intensities within segmented brain regions. The segmentation engine employs a deep learning architecture to segment the entire brain into 170 volumes of interest (VOIs), also capturing regions outside the brain, such as the surrounding non-brain tissues (Figure 2, Supplemental Table 1). This architecture was adapted from QuickNAT, a convolutional neural network trained on MR images with manual annotations. 23 It uses three fully convolutional neural networks to process axial, coronal, and sagittal slices independently, which are then combined to achieve the final segmentation. The whole cerebellum and brainstem were designated as reference regions, and the SUVRs for the 170 VOIs from the eFMM and dFMM PET images were calculated by dividing the mean standardized uptake value of each target region by the mean standardized uptake value of the whole cerebellum and brainstem.24–26
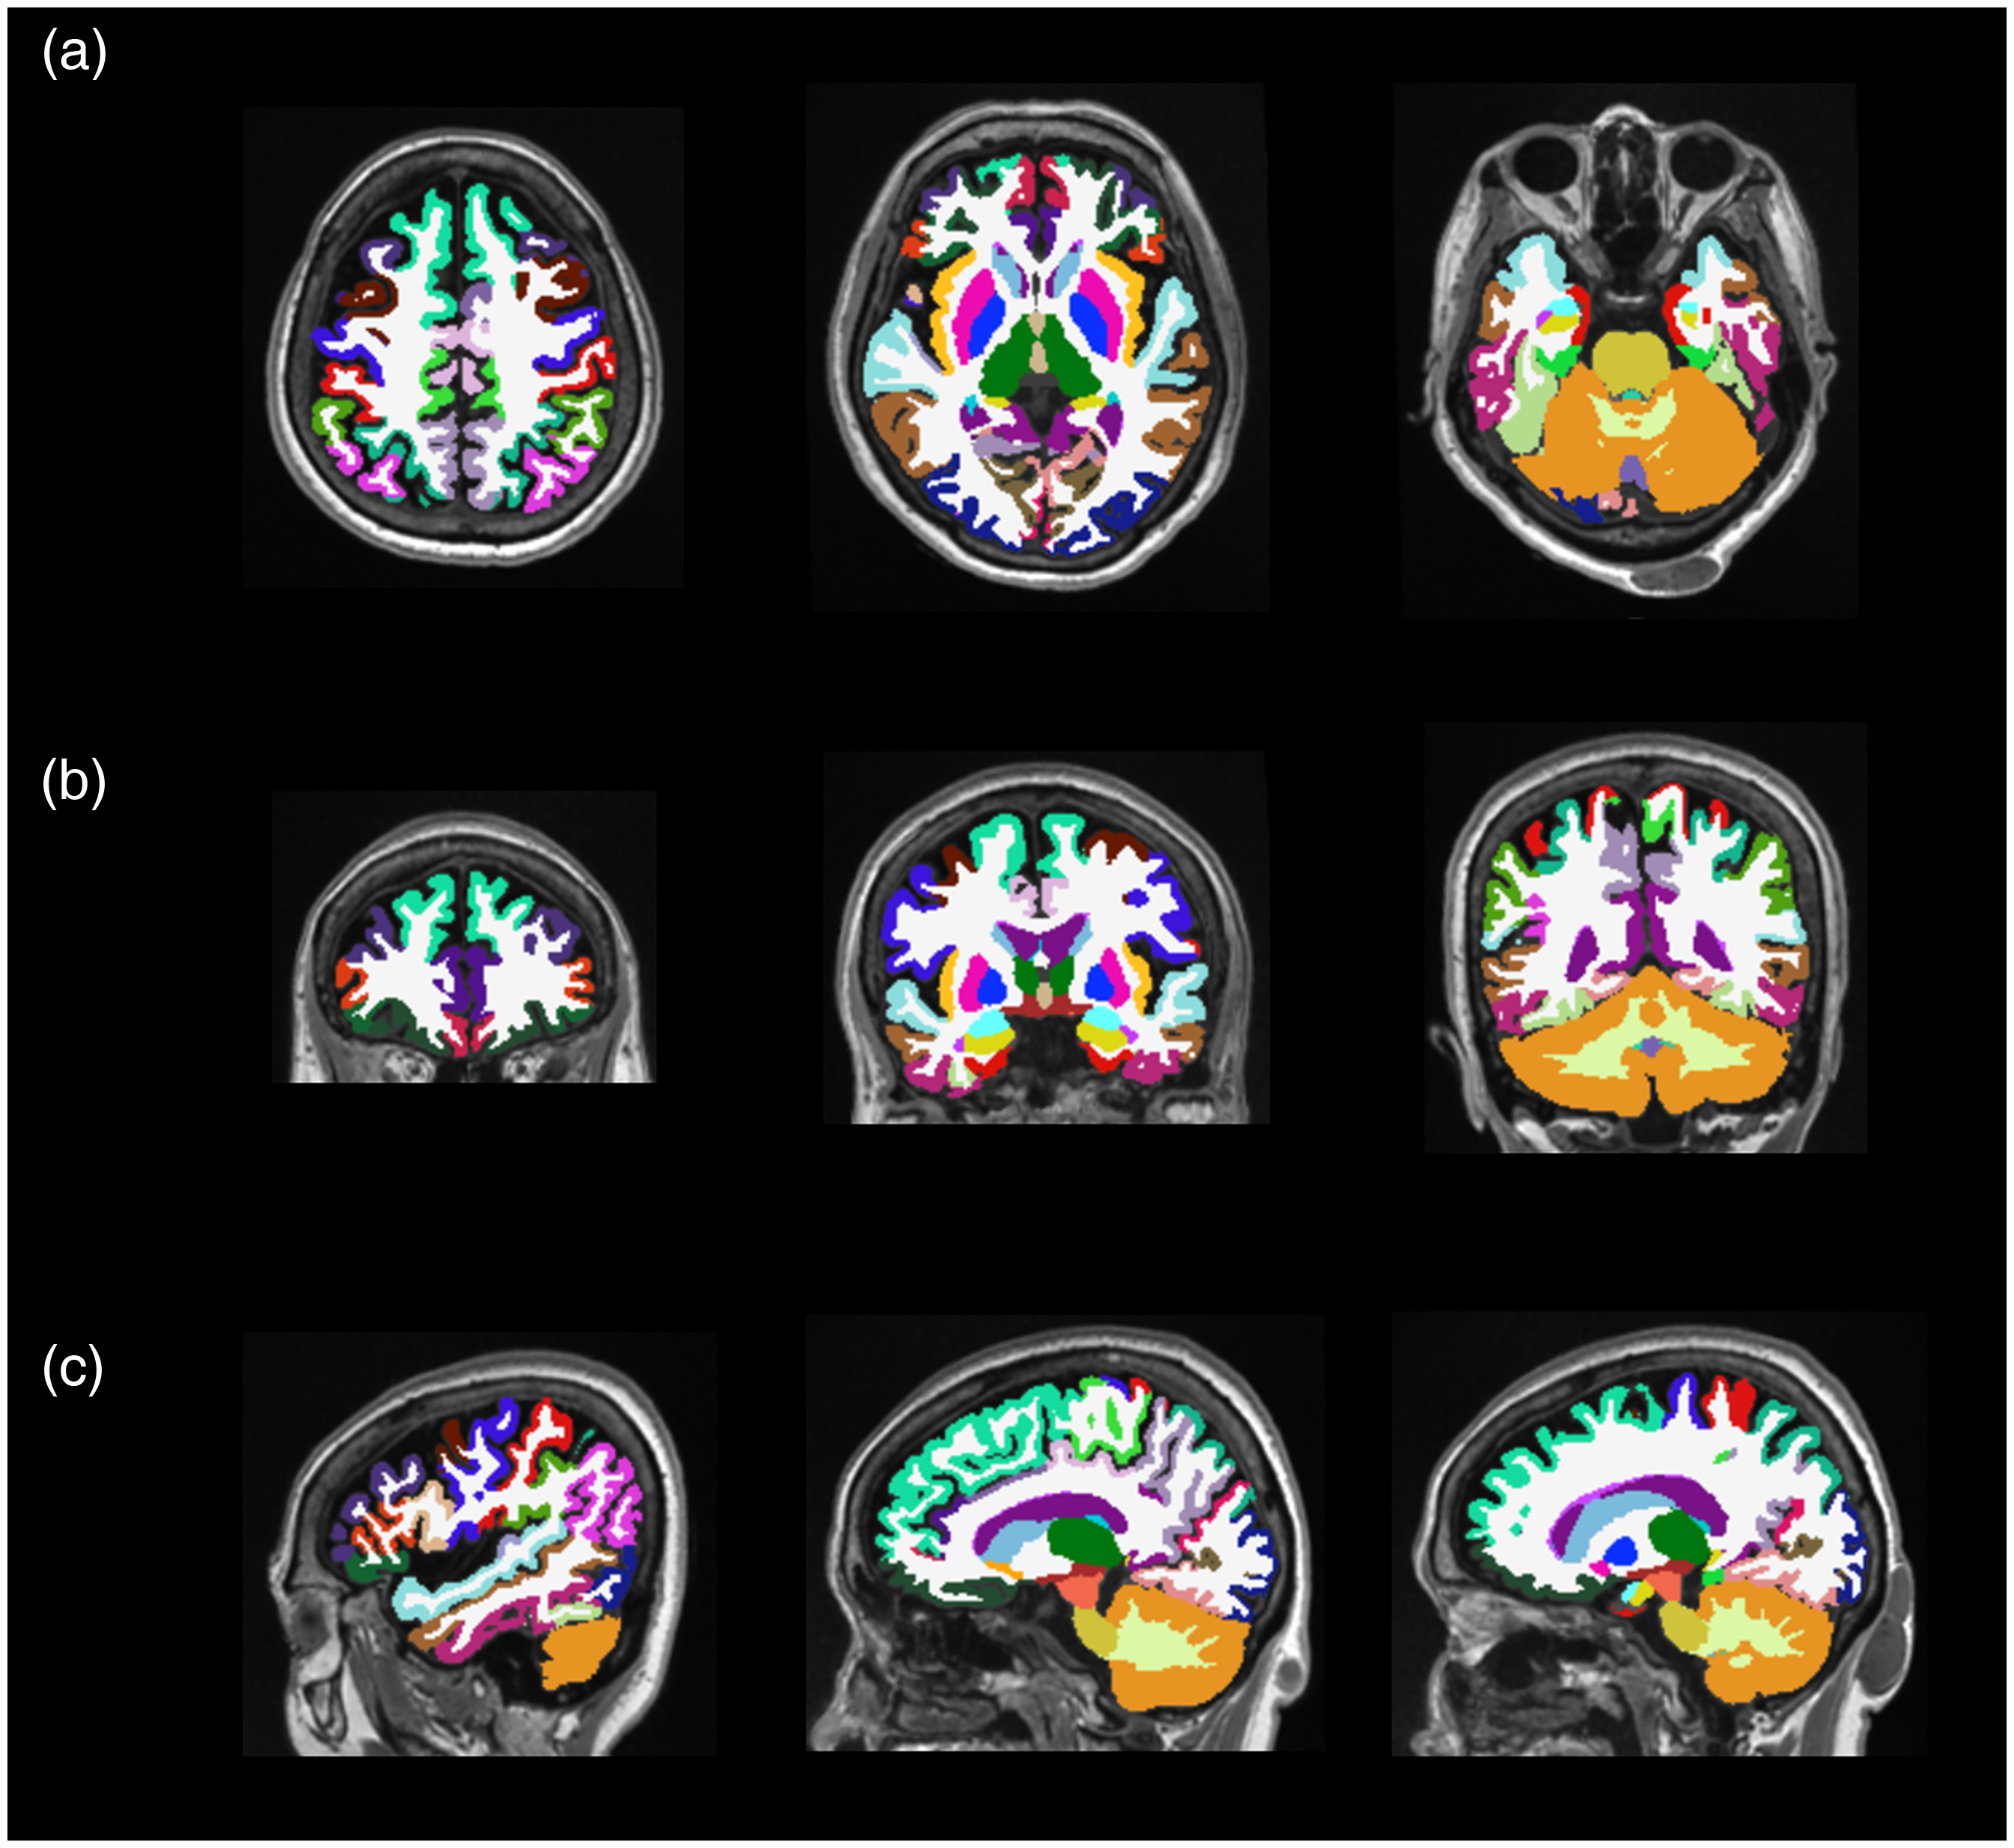
Representative MR images segmented into VOIs. Heuron Brain PET software provides 170 VOIs, shown in axial (a), coronal (b), and sagittal (c) views of T1-weighted MR images. The colored regions represent the segmented VOIs, with detailed descriptions of the VOIs provided in Supplemental Table 1.
Feature selection
The least absolute shrinkage and selection operator (LASSO)-based feature selection was applied in the training group to identify relevant features for amyloid positivity. Feature selection was performed separately on datasets containing 4 clinical, 9 neuropsychological, 170 eFMM features, and 170 dFMM features. The LASSO-based feature selection utilized LR for binary classification with 10-fold cross-validation and a maximum of 1,000,000 iterations. The minimum criteria applied to prevent overfitting and optimize the model performance involved adjusting the alpha value to iteratively shrink the coefficients toward zero until the optimal feature set was identified. The analysis was conducted using the R programming language version 4.4.1 (R Foundation for Statistical Computing, Vienna, Austria) and the glmnet package version 4.1-8.
ML predictive models for amyloid positivity
ML-based predictive models were developed to predict amyloid positivity. The models included: 1) eFMM features only (eFMM model), 2) a combination of eFMM and clinical features (eFMM + C model), 3) a combination of eFMM and neuropsychological features (eFMM + N model), 4) a combination of eFMM, clinical, and neuropsychological features (eFMM + C + N model), and 5) a combination of clinical and neuropsychological features (C + N model), 6) dFMM features only (dFMM model). For each predictive model, a five-fold cross-validation was performed on the training group using GridSearchCV with hyperparameter tuning based on AUROC scoring. Two ML algorithms, LR and linear discriminant analysis (LDA), were employed for each predictive model. The variable importance of relevant features was obtained during the training process of each predictive model. After completing the cross-validation and hyperparameter tuning on the training group, the trained models were tested on the independent test group.
The cross-validation results from the training group and the test results from the test group for each predictive model were evaluated using performance metrics such as AUROC, F1-score, recall, precision, and accuracy. 27 Each performance metric was calculated with a 95% confidence interval using 1000 bootstrap sampling iterations. In terms of AUROC, values between 0.7 and 0.8 were interpreted as fair, those between 0.8 and 0.9 as good, and values from 0.9 to 1 as excellent performance. 28 Additionally, the actual and predicted classes of amyloid positivity in each predictive model were summarized using a confusion matrix. All model development and performance metric calculations were conducted using python version 3.6.13, with scikit-learn version 0.24.2, numpy version 1.19.5, pandas version 1.1.5, and joblib version 1.1.1.
Statistical analysis
Statistical analysis was performed using the MedCalc software version 22.030 (MedCalc Software Ltd, Ostend, Belgium). The mean values between two continuous variables were compared using a two-sample t-test. The frequency differences between the binary features in the training and test groups were compared using the chi-square test. The AUROCs of the two predictive models were compared using DeLong's test. Inter-reader agreement on amyloid positivity was evaluated by calculating the kappa coefficient between the two nuclear medicine physicians’ interpretations. Statistical significance was set at p value < 0.05.
Results
Patient characteristics
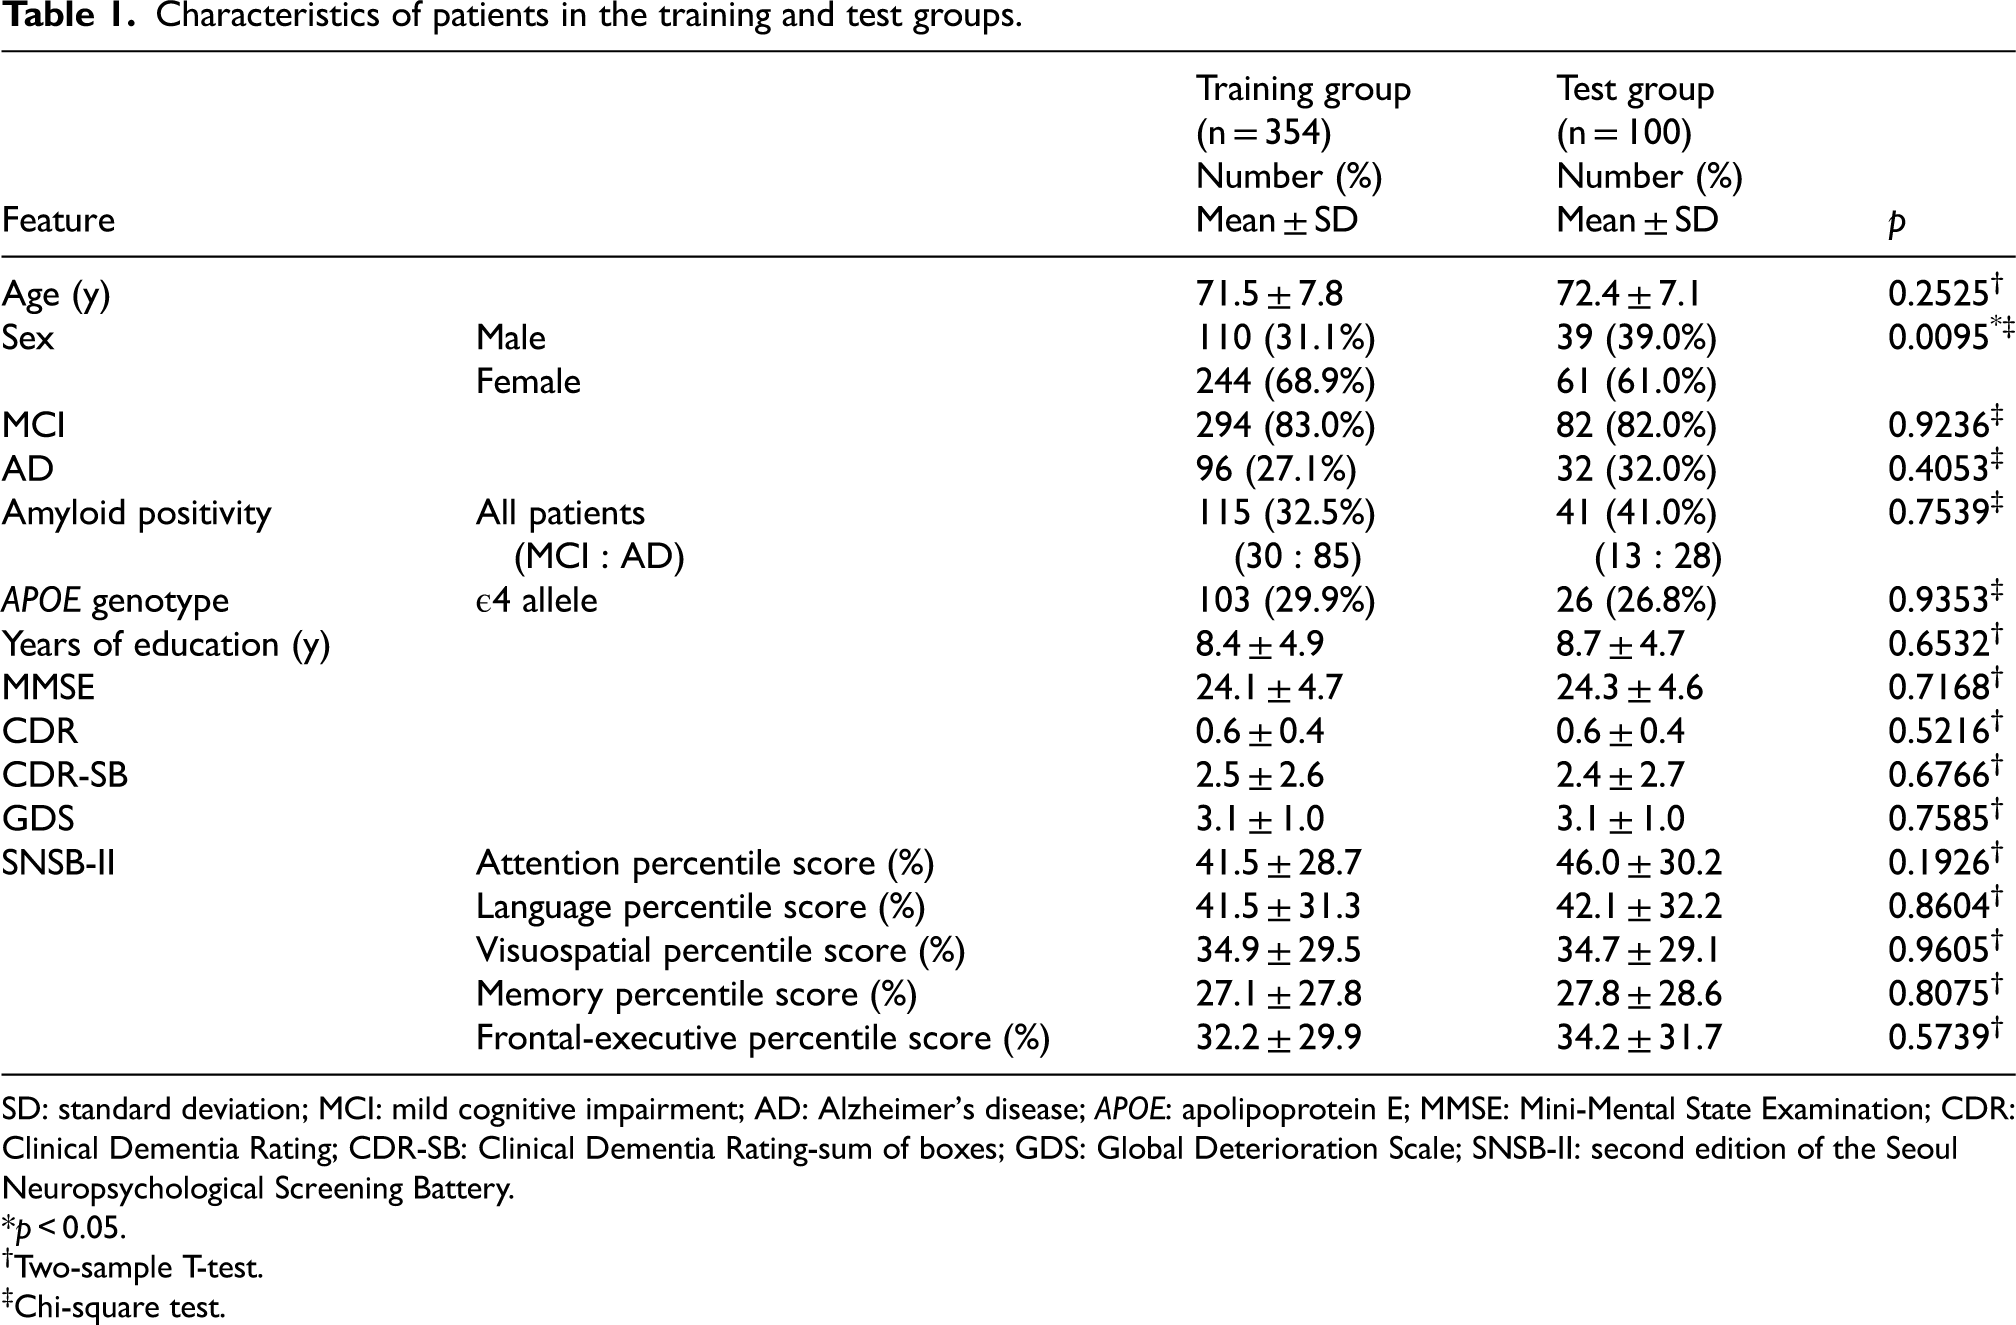
A total of 454 patients with MCI and AD were randomly divided into training (n = 354) and test (n = 100; Table 1) groups. The proportion of males in the test group (39.0%) was significantly higher than that in the training group (31.1%; p = 0.0095). In contrast, no significant differences were observed between the training and test groups in the proportions of APOE ε4 allele, MCI, AD, or amyloid positivity. Additionally, no significant differences were observed between the training and test groups in the mean age, years of education, MMSE, CDR, CDR-SB, GDS, or the five-domain percentile scores of the SNSB-II. The kappa coefficient for amyloid positivity between the two nuclear medicine physicians was 0.9755, indicating a near-perfect agreement. The training group included 36 patients (10.2%), and the test group included 14 patients (14.0%) who had initially been diagnosed with MCI and subsequently converted to AD over time. Brain MR was performed 11.2 ± 11.9 days (mean ± standard deviation [SD]) from the FMM PET/CT scan, and neuropsychological tests were conducted 10.5 ± 20.2 days (mean ± SD) from the FMM PET/CT scan.
Characteristics of patients in the training and test groups.
SD: standard deviation; MCI: mild cognitive impairment; AD: Alzheimer's disease; APOE: apolipoprotein E; MMSE: Mini-Mental State Examination; CDR: Clinical Dementia Rating; CDR-SB: Clinical Dementia Rating-sum of boxes; GDS: Global Deterioration Scale; SNSB-II: second edition of the Seoul Neuropsychological Screening Battery.
*p < 0.05.
Two-sample T-test.
Chi-square test.
Relevant features selected through feature selection
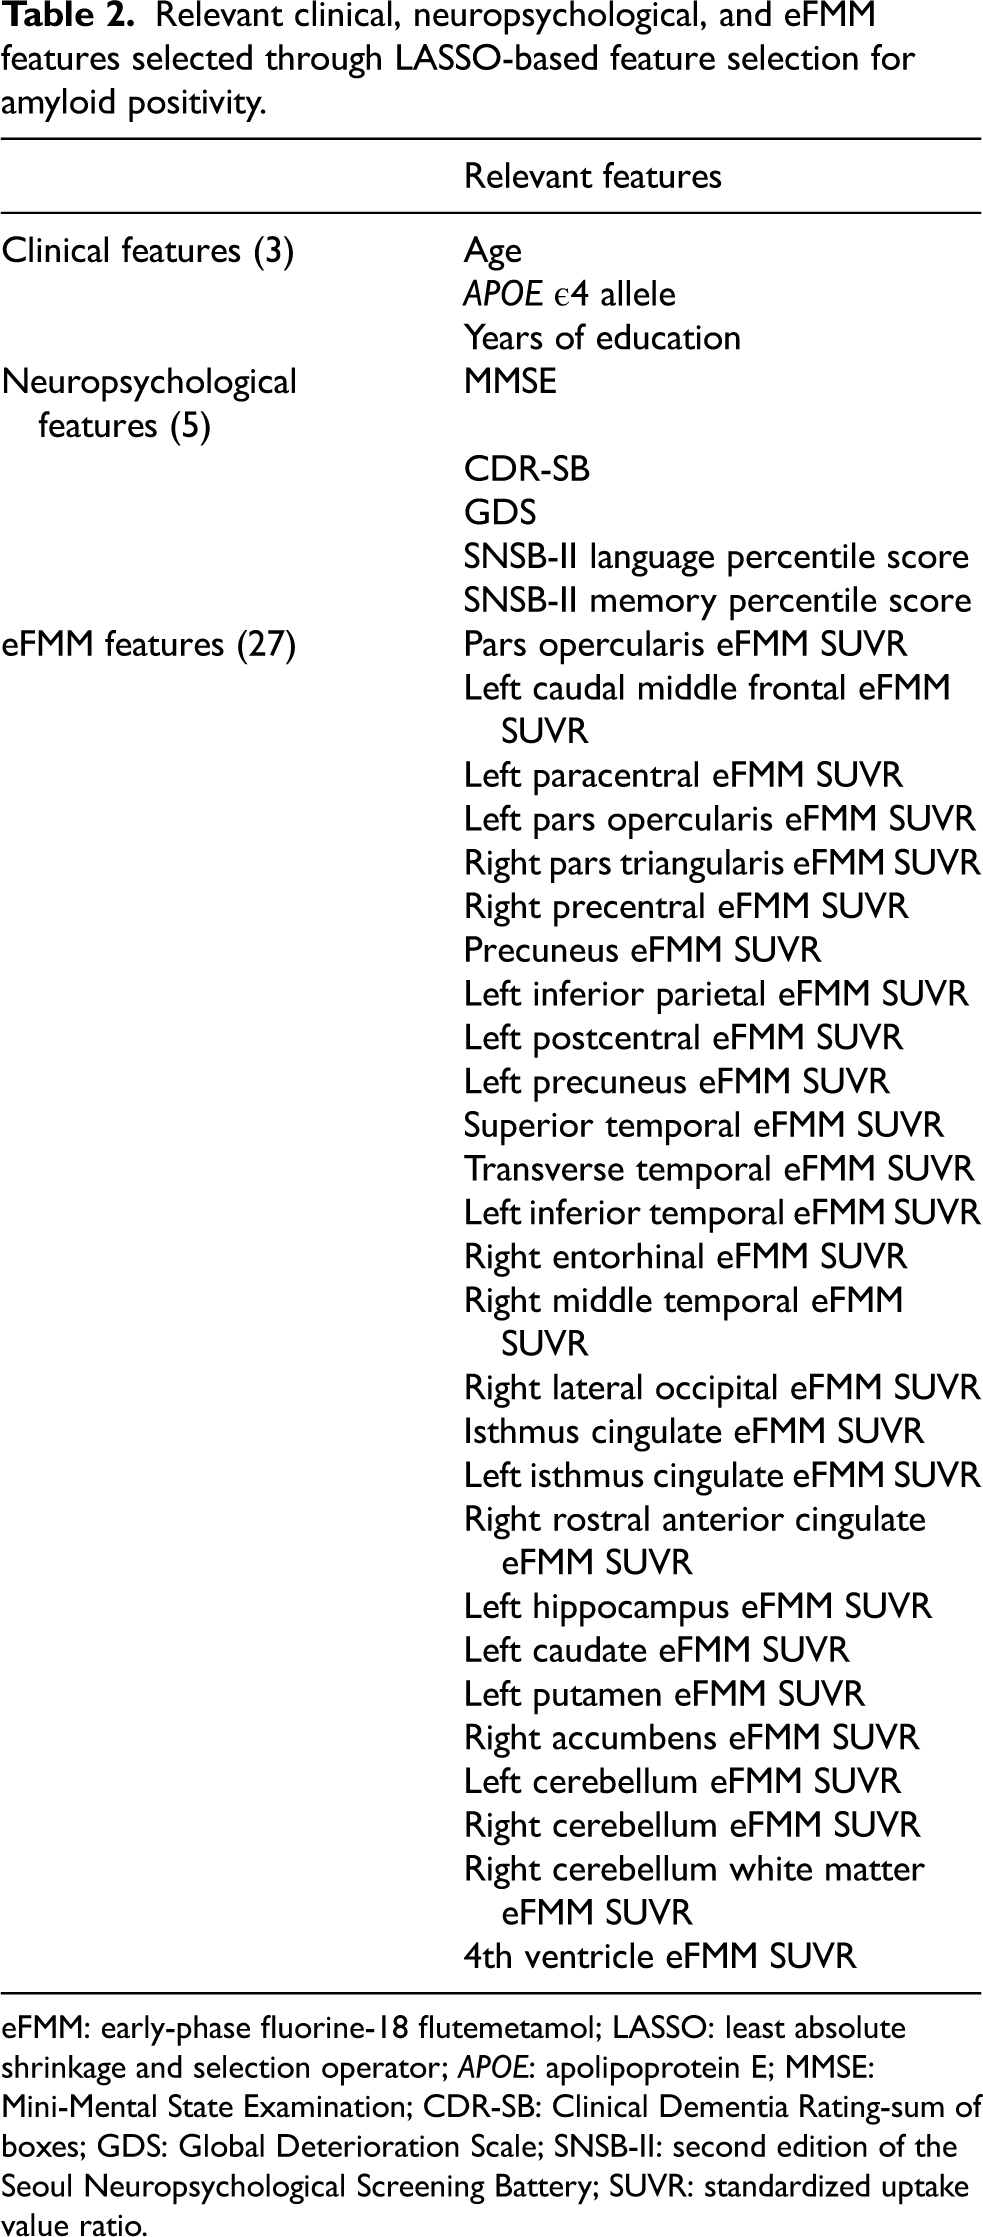
LASSO-based feature selection in the training group identified 3 clinical, 5 neuropsychological, 27 eFMM, and 17 dFMM features as relevant for amyloid positivity (Table 2, Supplemental Table 2). The three relevant clinical features included age, APOE ε4 allele, and years of education, while the five neuropsychological features included MMSE, CDR-SB, GDS, SNSB-II language percentile score, and SNSB-II memory percentile score. The mean age of amyloid-positive patients was marginally higher than that of amyloid-negative patients (p = 0.0589). However, no significant difference was observed in the mean years of education between the two groups (p = 0.2609). The proportion of amyloid-positive patients was significantly higher in APOE ε4 allele-positive patients than in APOE ε4 allele-negative patients (p < 0.0001). Significant differences in the mean values of the MMSE (p < 0.0001), CDR-SB (p < 0.0001), GDS (p < 0.0001), SNSB-II language percentile score (p < 0.0001), and SNSB-II memory percentile score (p < 0.0001) were observed between amyloid-positive and amyloid-negative patients, indicating greater cognitive impairment in the amyloid-positive group than in the amyloid-negative group. Of the 170 eFMM and dFMM features, 27 relevant eFMM features were identified, which is more than the 17 relevant dFMM features.
Relevant clinical, neuropsychological, and eFMM features selected through LASSO-based feature selection for amyloid positivity.
eFMM: early-phase fluorine-18 flutemetamol; LASSO: least absolute shrinkage and selection operator; APOE: apolipoprotein E; MMSE: Mini-Mental State Examination; CDR-SB: Clinical Dementia Rating-sum of boxes; GDS: Global Deterioration Scale; SNSB-II: second edition of the Seoul Neuropsychological Screening Battery; SUVR: standardized uptake value ratio.
Predictive performance of eFMM predictive models
In cross-validation results of the training group, the AUROCs of the eFMM + C + N models (LR, AUROC = 0.918; LDA, AUROC = 0.917) were the highest, whereas those of the eFMM models (LR, AUROC = 0.849; LDA, AUROC = 0.846) were the lowest among the eFMM predictive models (Table 3). The AUROCs of the eFMM + C and eFMM + N models were higher than those of the eFMM models but lower than those of the eFMM + C + N models. Additionally, among eFMM + C and eFMM + N models, the AUROCs of the eFMM + C models were higher than those of the eFMM + N models. Other performance metrics, including the F1-score, recall, precision, and accuracy, exhibited trends consistent with those observed for AUROCs. In the training group, the superior temporal eFMM SUVR emerged as the most important feature in the eFMM models using both LR and LDA (Supplemental Figure 1). A marginal trend toward a lower mean superior temporal eFMM SUVR was observed in the amyloid-positive patients compared to the amyloid-negative patients (p = 0.0591). In the eFMM + C, eFMM + N, and eFMM + C + N models using LR and LDA, superior temporal eFMM SUVR, APOE ε4 allele, left caudal middle frontal eFMM SUVR, and left pars opercularis eFMM SUVR were identified as the most important features (Supplemental Figure 2–4). Additionally, the amyloid-positive patients exhibited significantly lower mean eFMM SUVRs in the left caudal middle frontal (p < 0.0001) and left pars opercularis regions (p = 0.0069) than the amyloid-negative patients. Among the eight eFMM predictive models in the training group, superior temporal eFMM SUVR was identified as the most important feature in five models.
Cross-validation results in the training group and the test results in the test group using LR and LDA in the eFMM predictive models for amyloid positivity.
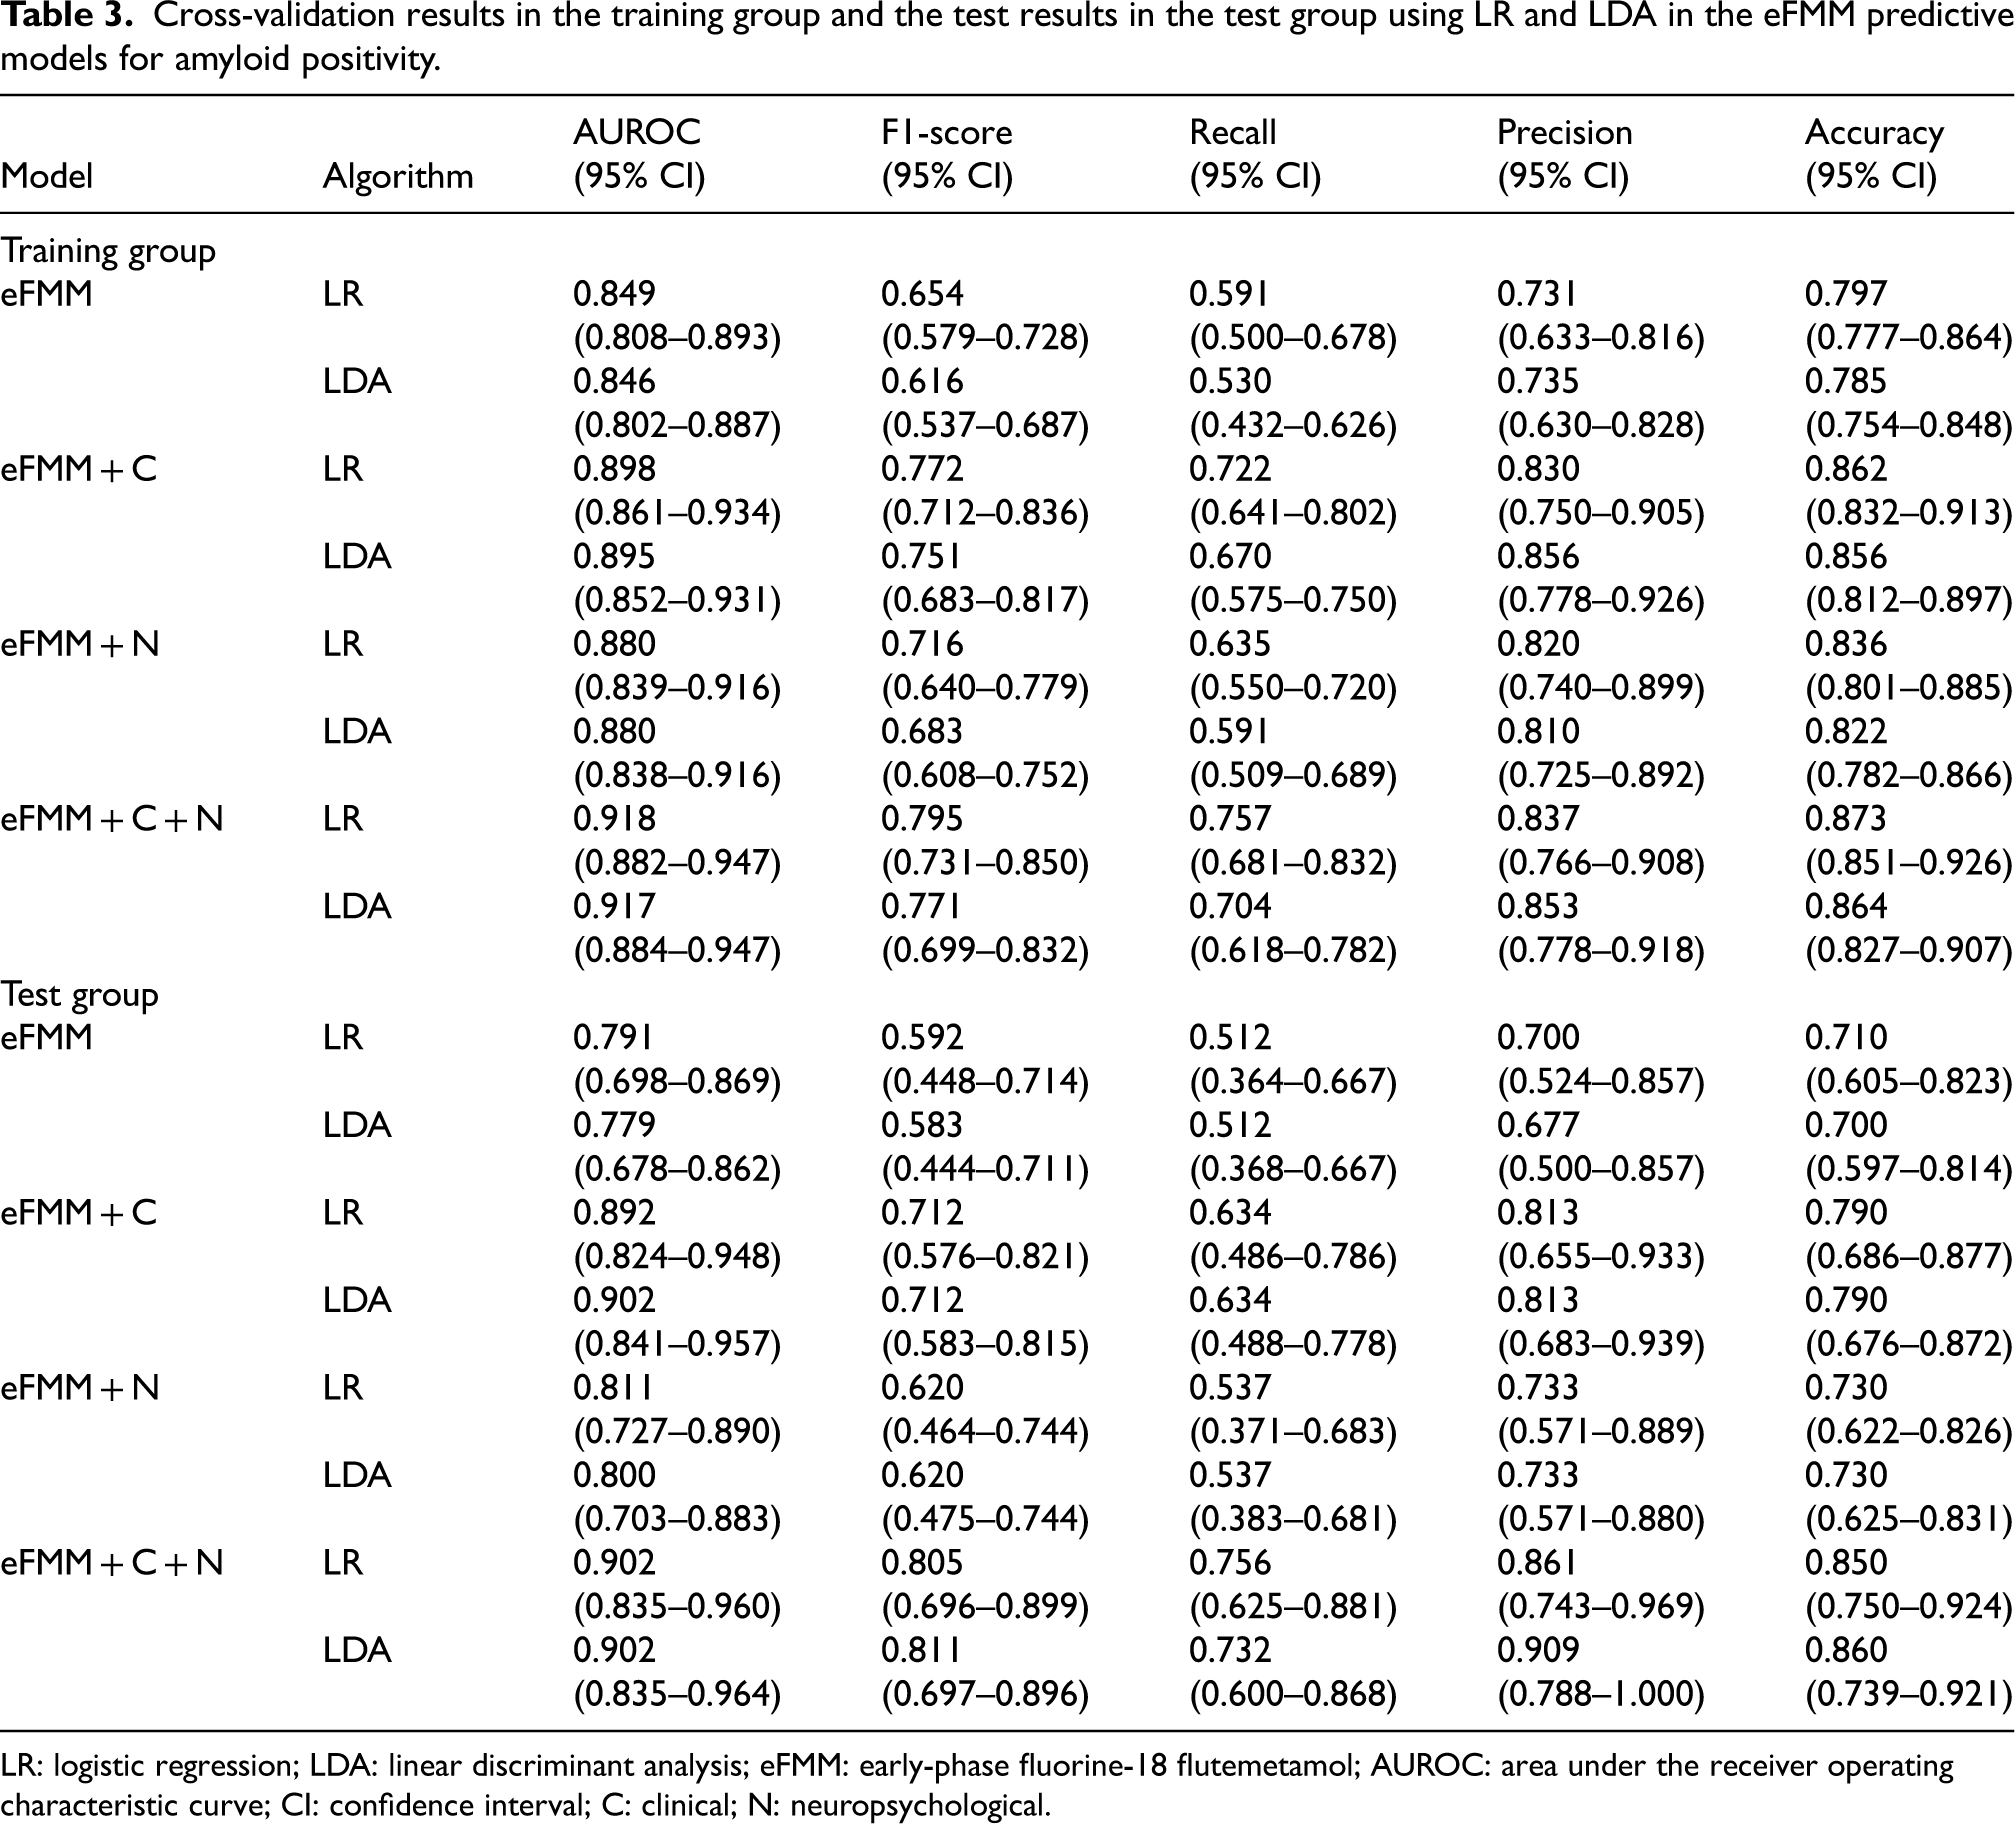
LR: logistic regression; LDA: linear discriminant analysis; eFMM: early-phase fluorine-18 flutemetamol; AUROC: area under the receiver operating characteristic curve; CI: confidence interval; C: clinical; N: neuropsychological.
Similar to the training group, in the test group, the eFMM + C + N models (LR, AUROC = 0.902; LDA, AUROC = 0.902) had the highest AUROCs, whereas the eFMM models (LR, AUROC = 0.791; LDA, AUROC = 0.779) had the lowest AUROCs (Table 3 and Figure 3). The AUROCs of the eFMM + C + N models were significantly higher than those of the eFMM models (LR, p = 0.0044; LDA, p = 0.0038; Table 4). Among the eFMM + C and eFMM + N models, the AUROCs of the eFMM + C models were higher than those of the eFMM + N models. Other performance metrics, including the F1-score, recall, precision, and accuracy, followed a similar pattern to the AUROC. Similarly, the confusion matrices of the eFMM predictive models indicated that the eFMM + C + N models had the highest number of correct classifications, followed by the eFMM + C, eFMM + N, and eFMM models, with a gradual decrease in the correct classifications (Figure 4, Supplemental Figure 5). In the test group, the AUROCs of the C + N models (LR, AUROC = 0.813; LDA, AUROC = 0.823, Supplemental Table 3) were slightly higher than those of the eFMM models (LR, AUROC = 0.791; LDA, AUROC = 0.779); however, this difference was not statistically significant (LR, p = 0.7234; LDA, p = 0.4831). In contrast, the AUROCs of the C + N models were significantly lower than those of the eFMM + C + N models (LR and LDA, AUROC = 0.902; LR, p = 0.0109; LDA, p = 0.0217).
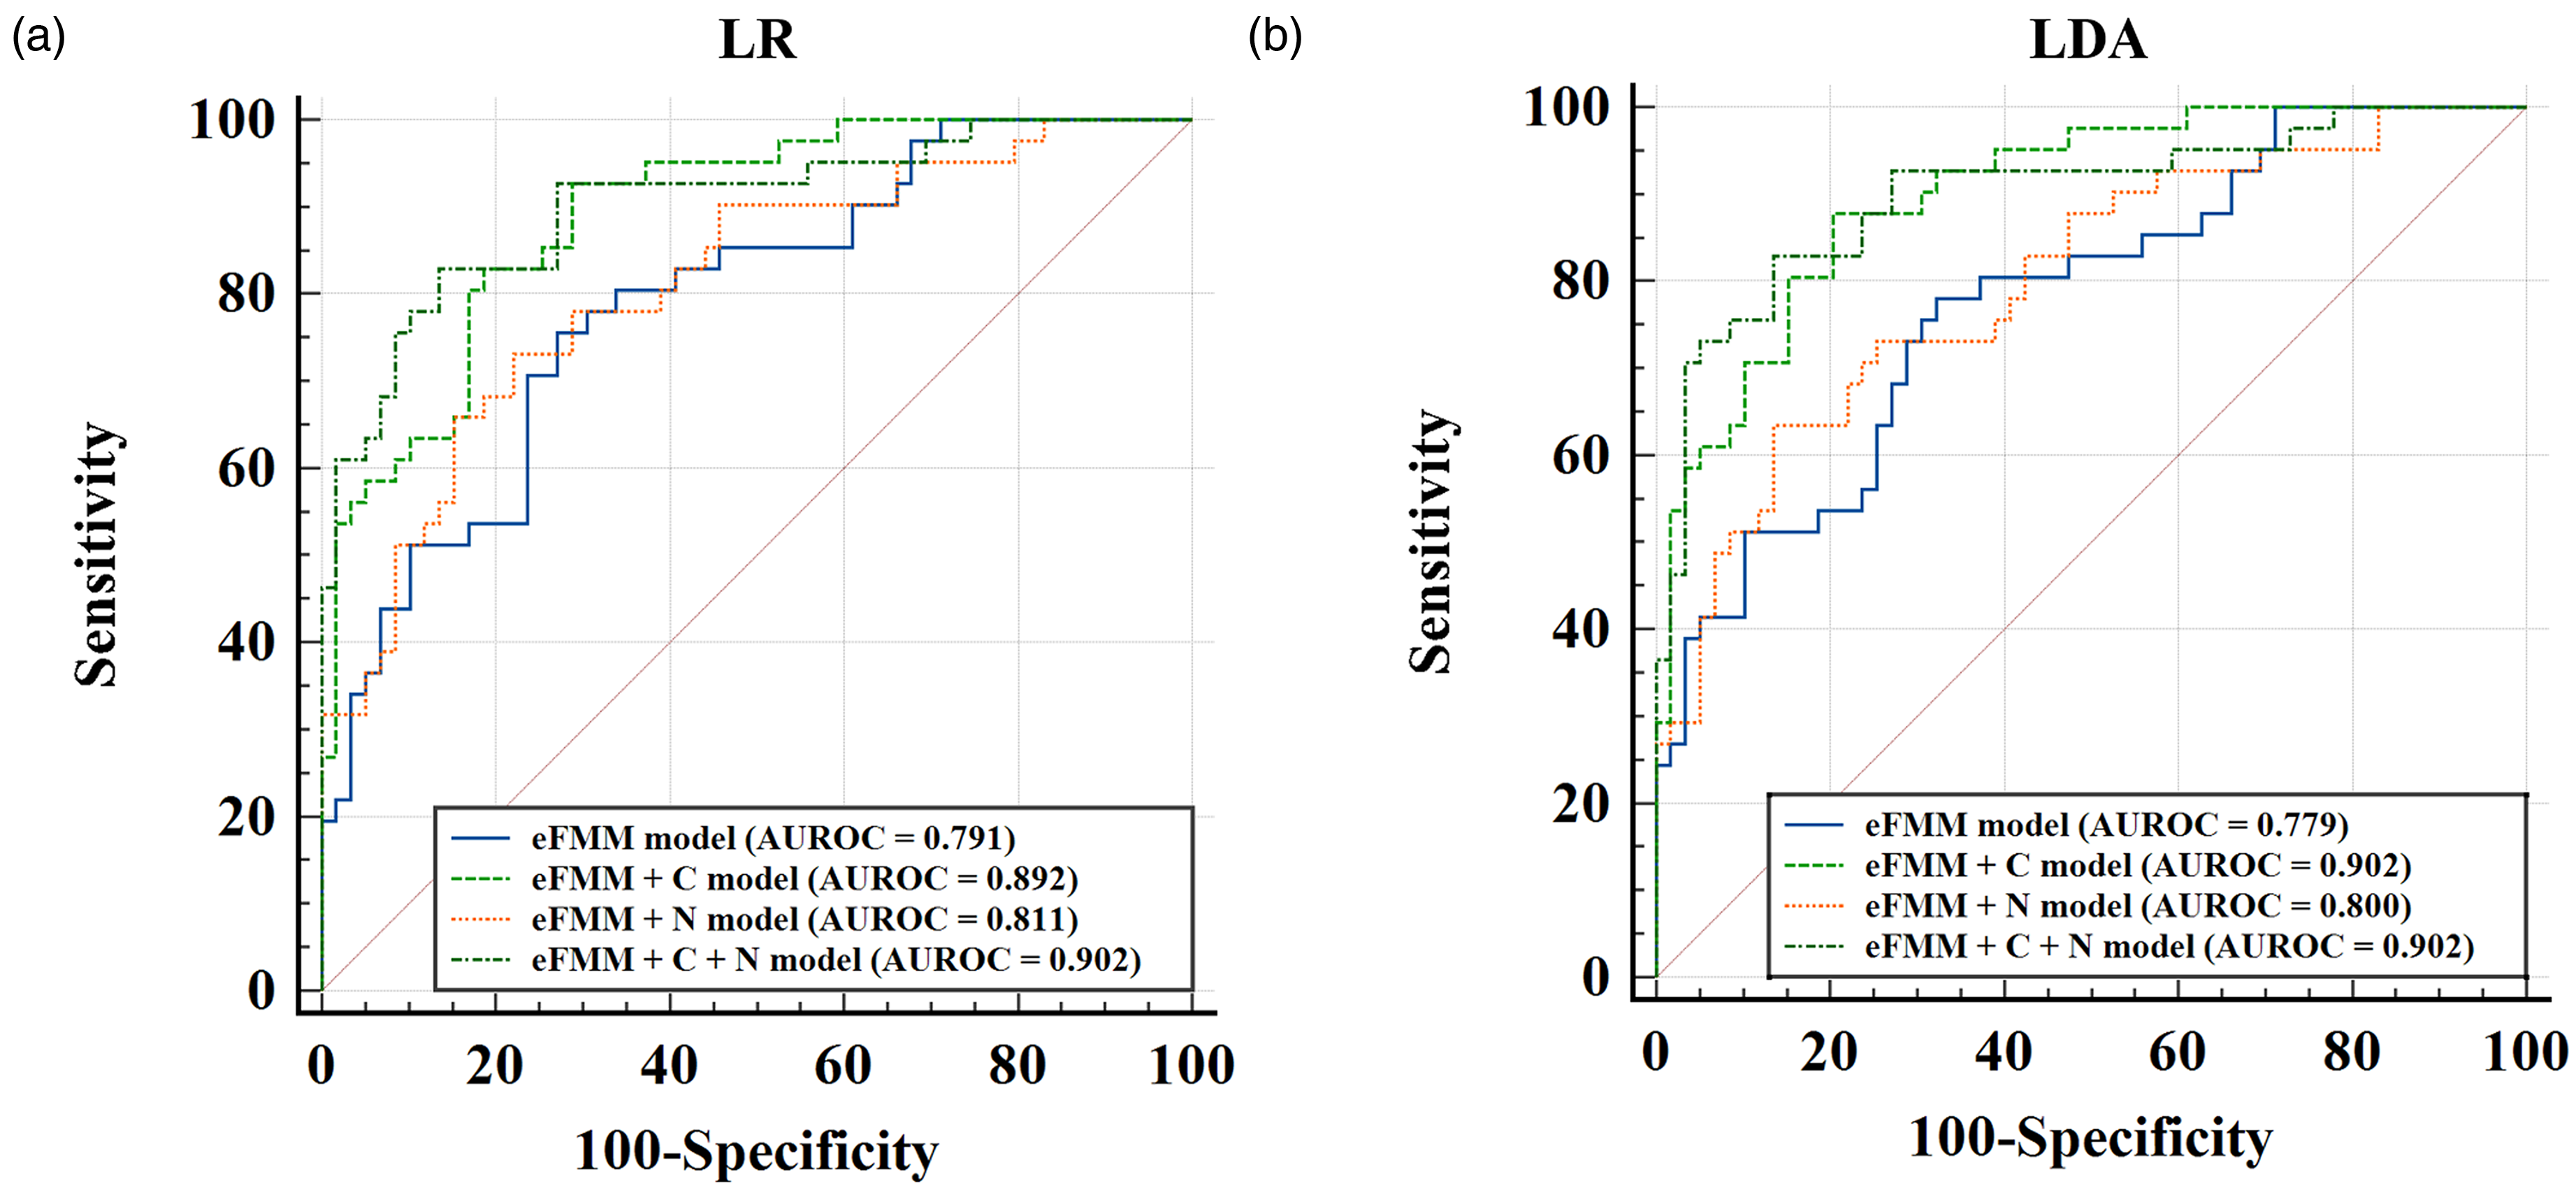
ROC curves of eFMM predictive models in the test group. ROC curves of the eFMM predictive models are shown for LR (a) and LDA (b). In the test group, the eFMM + C + N models (LR, AUROC = 0.902; LDA, AUROC = 0.902) exhibited the highest AUROCs, whereas the eFMM-only models (LR, AUROC = 0.791; LDA, AUROC = 0.779) showed the lowest performance.
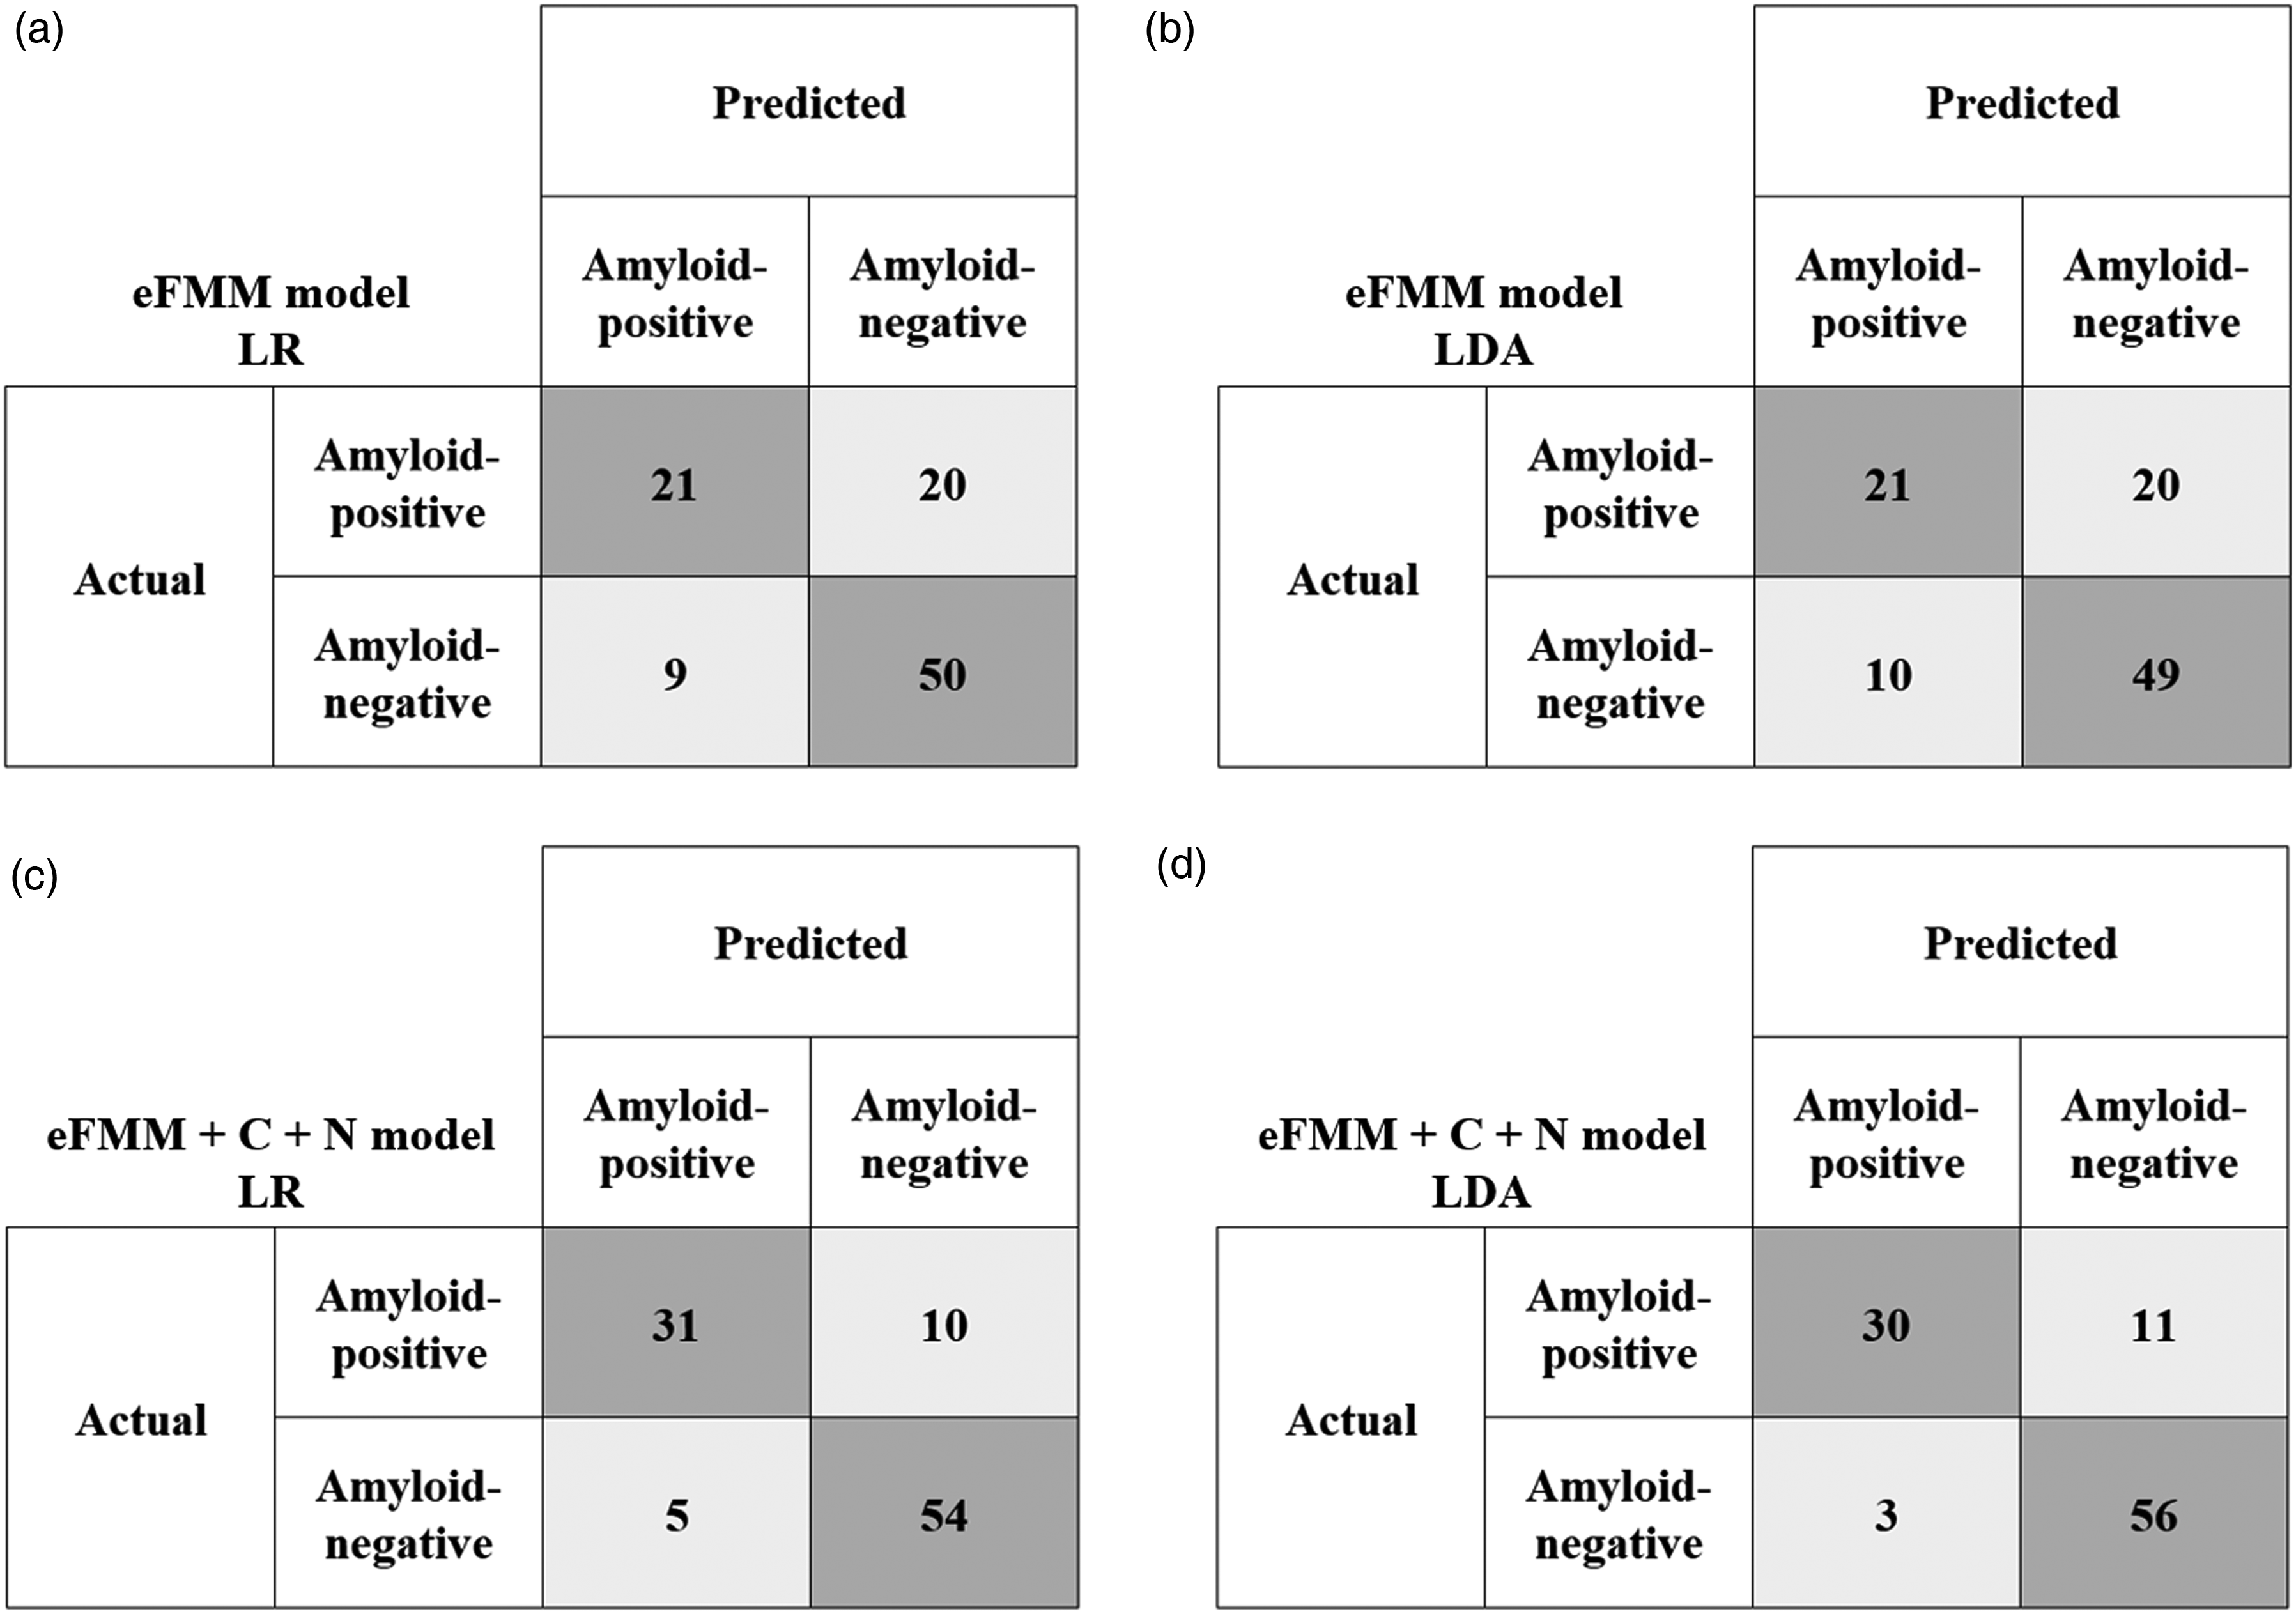
Confusion matrices of eFMM and eFMM + C + N models in the test group. The confusion matrices illustrate the classification performance of eFMM models (a, b) and eFMM + C + N models (c, d) using LR and LDA, respectively, in the test group. The eFMM + C + N models exhibited the highest number of correct classifications, followed by the eFMM + C, eFMM + N, and eFMM models.
Comparison of AUROCs between eFMM and eFMM + C + N models using LR and LDA in the test group.
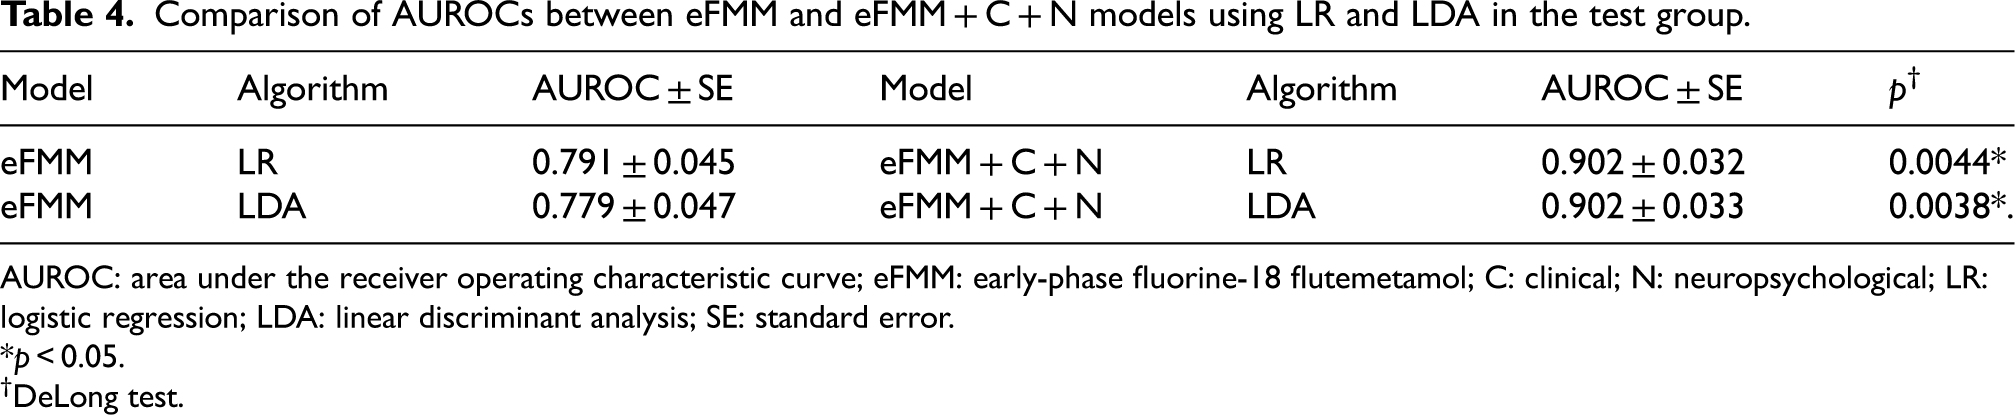
AUROC: area under the receiver operating characteristic curve; eFMM: early-phase fluorine-18 flutemetamol; C: clinical; N: neuropsychological; LR: logistic regression; LDA: linear discriminant analysis; SE: standard error.
*p < 0.05.
DeLong test.
Predictive performance of dFMM models
The dFMM models demonstrated superior predictive performance for amyloid positivity in both the training and test groups compared to the eFMM predictive models. In the training group, the dFMM models achieved an AUROC of 0.999, and the recall of the dFMM model using LDA was 0.887, while other performance metrics exceeded 0.930 (Supplemental Table 4). The left fusiform dFMM SUVR was identified as the most important feature in the dFMM model using LR, while the left inferior parietal dFMM SUVR was identified as the most important feature in the dFMM model using LDA (Supplemental Figure 6). The mean values of the left fusiform dFMM SUVR (p < 0.0001) and left inferior parietal dFMM SUVR (p < 0.0001) were significantly higher in amyloid-positive patients than in amyloid-negative patients. In the test group, the dFMM models achieved an AUROC of 0.993, and the F1-score and recall of the dFMM model using LDA were 0.895 and 0.829, respectively, while other performance metrics exceeded 0.920 (Supplemental Table 3, Supplemental Figure 7). In the dFMM model with LR, 98% of the classifications were correct, while in the LDA-based dFMM model, 92% were correct, both exceeding the correct classifications in the eFMM predictive models (Supplemental Figure 8). Furthermore, the AUROCs of the dFMM models with LR (p = 0.0047) and LDA (p = 0.0063) were significantly higher than those of the eFMM + C + N models with LR and LDA.
Discussion
To our knowledge, this is the first study to develop and analyze ML predictive models for amyloid positivity using eFMM PET images from patients with MCI and AD. This study included patients with MCI and AD as they represent pivotal stages in the AD continuum, where precise detection of amyloid pathology is critical for both diagnosis and prognosis.29,30 Prior investigations have shown that FMM PET not only detects amyloid burden in AD but also reveals substantial heterogeneity in amyloid deposition among those with MCI. 29 Notably, MCI subjects who are amyloid-positive face a significantly higher risk of progressing to AD dementia, underscoring the prognostic importance of amyloid PET in these populations.30,31 By focusing on MCI and AD, our study enables a thorough evaluation of predictive models across a wide spectrum of amyloid burden and clinical severity. A total of 454 patients with MCI or AD were randomly assigned to the training (n = 354, 78.0%) and test (n = 100, 22.0%) groups. The mean ages of the training and test groups were 71.5 and 72.4 years, respectively, indicating that both groups consisted of older adults aged over 70 years. Cognitive decline is generally known to be associated with aging, 32 and older age is a well-established risk factor for both MCI and AD.33,34 In addition, the proportions of amyloid-positive patients were not significantly different between the training (32.5%) and test (41.0%) groups, suggesting that random assignment was appropriately performed and that the distribution of amyloid positivity was sufficiently balanced across datasets. In the training and test groups of the present study, the proportions of amyloid-positive patients clinically diagnosed with MCI and AD were 32.5% and 41.0%, respectively, which are lower than the previously reported proportions of approximately 53–60% for MCI and 68–96% for AD, as demonstrated in prior studies using FMM and fluorine-18 florbetaben PET.35,36 In the present study, the relatively high proportion of amyloid-negative cases among clinically diagnosed MCI and AD patients may be attributed to early-stage disease, in which Aβ deposition has not yet reached detectable levels, or to the presence of non-AD pathologies such as hippocampal sclerosis, TAR DNA-binding protein 43, or vascular disease. 37 These patterns may be associated with a higher likelihood of APOE ε4 non-carrier status and have been linked to milder cognitive impairment, less pronounced neurodegeneration, and lower tau levels.37,38 The proportion of patients carrying the APOE ε4 allele, a well-established genetic risk factor for AD, 39 did not differ significantly between the training (29.9%) and test (26.8%) groups. Although the proportion of female patients was higher in the training group (68.9%) than in the test group (61.0%), sex was not selected as a relevant clinical feature during feature selection, suggesting a limited impact on model performance. Given the clinical importance of accurately identifying amyloid positivity in the context of emerging therapeutic approaches, recently approved by the Food and Drug Administration, anti-amyloid therapies, including lecanemab, aducanumab, and donanemab, are being used in the treatment of AD,40–42 with amyloid positivity and burden on amyloid PET playing crucial roles in patient selection and assessing treatment response. 43 The delayed-phase scan of FMM PET is used as the standard scan for visual analysis of amyloid positivity, while previous studies have reported that the additional early-phase scan provides information on CBF, neuronal injury, and glucose metabolism.5–11 Additionally, early-phase amyloid PET images may contain information indicative of amyloid positivity.8,12 The results of this study provide more direct evidence that eFMM PET images contain information indicative of amyloid positivity. These findings suggest the potential utility of eFMM PET not only as a surrogate marker for CBF, neuronal injury, and glucose metabolism, as previously reported, but also as a surrogate marker for amyloid positivity. Beyond demonstrating its value as a surrogate marker for amyloid positivity, eFMM PET also offers several practical clinical advantages. It may help reduce waiting time, improve patient compliance and throughput, and serve as a more cost-effective imaging option. eFMM-based ML models may serve as a screening tool to identify patients likely to be amyloid-positive, and eFMM PET could potentially be explored as a more practical option for repeated imaging in future studies assessing treatment response to anti-amyloid therapies.
In this study, the eFMM models demonstrated their ability to capture information on amyloid positivity while also exhibiting fair predictive performance. Consistent with our findings, previous studies have suggested that early-phase images of amyloid PET may provide relevant information for determining amyloid positivity. Komori et al. conducted a study using a U-net convolutional neural network and a conditional generative adversarial network to convert early-phase images of PiB PET into corresponding AI-predicted delayed-phase images. 12 The concordance rate for amyloid positivity between the actual and AI-predicted delayed-phase images was 79% for both radiologists. These results demonstrate that the amyloid positivity in AI-predicted delayed-phase images, derived from early-phase images, closely matched that of the actual delayed-phase images, suggesting that early-phase images contain information relevant to amyloid positivity. Mathies et al. reported that incorporating eFMM images enhances the visual assessment of amyloid positivity in dFMM PET compared to evaluating the dFMM images alone. 8 Decreased CBF is one of the earliest events in AD, with an observed annual decline of 2–5% in affected individuals.44,45 Therefore, the reduced uptake of eFMM, indicating decreased perfusion in patients with AD, may provide insights into predicting amyloid positivity. Additionally, early-phase perfusion images in amyloid PET are used to detect neuronal dysfunction and degeneration. 8 In amyloid-positive cases, early-phase images help distinguish between the various subtypes of AD, whereas, in amyloid-negative cases, they aid in identifying neurodegenerative diseases not associated with brain amyloidosis. 8 Different uptake patterns in early-phase images, reflecting neurodegeneration in amyloid-positive and amyloid-negative cases, may offer valuable clues for inferring amyloid positivity. In this study, the superior temporal eFMM SUVR was identified as the most important feature in the eFMM predictive models, with lower mean values observed in amyloid-positive patients than in amyloid-negative patients. This result is consistent with a previous longitudinal study showing that hypoperfusion in the temporal lobe, particularly in the temporal pole, may occur early in the disease process and be associated with subsequent atrophy and clinical progression in AD. 46 Taken together, these observations support the interpretation that reduced eFMM uptake in the superior temporal region may reflect early cerebral hypoperfusion associated with amyloid pathology. Although this study demonstrated that eFMM PET images contain information related to amyloid positivity, further research is required to improve model performance and better understand the complex relationship between eFMM PET images and amyloid positivity.
In this study, the eFMM + C + N models demonstrated excellent predictive performance for amyloid positivity. These relevant clinical and neuropsychological features significantly enhanced the predictive performance of the eFMM models. The three relevant clinical features used in the eFMM + C + N models were age, APOE ε4 allele status, and years of education. Janssen et al. reported that older age, APOE ε4 carriership, and lower education were associated with an increased likelihood of amyloid positivity, consistent with our findings. 47 Another previous study using PiB PET data reported that individuals with APOE ε4 positivity had approximately a threefold higher risk of Aβ accumulation. 48 In addition to the relevant clinical features, five relevant neuropsychological features, including the MMSE, CDR-SB, GDS, SNSB-II language percentile score, and SNSB-II memory percentile score, enhanced the predictive performance for amyloid positivity. Golomb et al. reported that, among 56 cognitively impaired patients with idiopathic normal-pressure hydrocephalus who underwent shunt surgery and biopsy, those with positive biopsies for neuritic plaques exhibited lower MMSE and higher GDS scores than those with negative biopsies for neuritic plaques. 49 Ho et al. reported that high CDR-SB scores were identified as a risk factor for amyloid PET positivity in 171 patients with MCI and APOE ɛ3/ɛ3 genotypes. 50 Another study found that amyloid-positive patients with MCI exhibited a moderate decline in language, visuospatial, and attention functions, and those with AD demonstrated significant impairments in both memory and non-memory functions. 51 The findings of these studies are consistent with those of the present study, which demonstrated a decline in cognitive function in amyloid-positive patients based on relevant neuropsychological test outcomes. In the test group of this study, there was no significant difference in the AUROCs between the C + N models and the eFMM models; however, the AUROCs of the combined eFMM + C + N models were significantly higher than those of either the C + N or the eFMM models. These findings indicate that eFMM, in conjunction with relevant clinical and neuropsychological features, played an important role in enhancing the prediction of amyloid positivity. Additionally, since the predictive performance of the eFMM + C models for amyloid positivity was superior to that of the eFMM + N models, it can be inferred that relevant clinical features contribute more significantly to predicting amyloid positivity than the relevant neuropsychological features. Although the addition of relevant clinical and neuropsychological features to the eFMM models significantly improved their predictive performance, it remained significantly inferior to that of the dFMM models. Therefore, further studies are required to identify additional relevant features for predicting amyloid positivity.
Notably, the PET parameters identified as the most important eFMM and dFMM SUVRs in the predictive models exhibited consistent trends. In the predictive models, the most important eFMM SUVRs were lower in amyloid-positive patients than in amyloid-negative patients, whereas the most important dFMM SUVRs were higher in amyloid-positive patients than in amyloid-negative patients. CBF has been previously linked to glucose metabolism, as indicated by eFMM PET, in association with amyloid positivity. Kikukawa et al. reported that patients with MCI who exhibited an AD-characteristic pattern of reduced CBF had a higher PiB-positive/equivocal rate than those with MCI showing a non-AD pattern. 52 Mattsson et al. demonstrated that a greater Aβ burden was associated with reduced CBF across various brain regions, regardless of the diagnostic category, including healthy controls, early and late MCI, and AD with dementia. 53 A previous study involving 90 patients with MCI indicated that the clinic-based MCI cohort tended to exhibit a higher prevalence of amyloid positivity and mean PiB uptake value, as well as a lower mean fluorine-18 fluorodeoxyglucose uptake value than the community-based MCI cohort. 54 In contrast, Ehrlich et al. suggested that regional Aβ deposition was not negatively associated with corresponding glucose metabolism in patients with early-stage AD. 55 Previous studies have shown inconsistent findings regarding the relationships between CBF, glucose metabolism, and amyloid positivity, underscoring the need for further research in light of the findings from this study.
This study has some limitations. First, this was a single-center study, which may limit the generalizability of the findings. Therefore, validation through future multicenter studies is warranted. Second, no significant differences in the clinical and neuropsychological features or amyloid positivity were observed between the training and test groups, except for sex, where the male proportion in the test group was significantly higher than that in the training group. However, since sex was not selected as a relevant clinical feature during feature selection, this suggests that the inclusion of relevant clinical features in the eFMM + C or eFMM + C + N models likely had minimal impact on predicting amyloid positivity. Third, the eFMM + C + N models were constructed using a limited set of three relevant clinical and five neuropsychological features. Incorporating additional clinical, neuropsychological, and imaging biomarkers, such as those related to tau and MR, may further enhance the model's performance.
Conclusions
In the present study, the ML predictive models composed solely of eFMM data confirmed that eFMM PET images contain information relevant to amyloid positivity. Therefore, the results of this study confirmed the potential utility of eFMM PET images in diagnosing amyloid positivity, as they not only provide information on cerebral perfusion, neuronal injury, and glucose metabolism but also contain information relevant to amyloid positivity. In addition, we confirmed that the eFMM + C + N models demonstrated excellent predictive performance for amyloid positivity. Building upon the current study, future research may focus on developing enhanced predictive models by integrating additional clinical features known to be associated with amyloid positivity alongside eFMM PET data. This approach could further improve predictive performance and potentially enable eFMM-based models to achieve diagnostic accuracy comparable to those using dFMM PET data. Ultimately, these findings highlight the potential of eFMM PET as a cost-effective and clinically feasible imaging option for patient screening and repeated assessments in the context of anti-amyloid therapies.
Supplemental Material
sj-docx-1-alz-10.1177_13872877251351275 - Supplemental material for Machine learning-based prediction of amyloid positivity using early-phase F-18 flutemetamol PET
Supplemental material, sj-docx-1-alz-10.1177_13872877251351275 for Machine learning-based prediction of amyloid positivity using early-phase F-18 flutemetamol PET by Yong-Jin Park, Sang Won Seo, Seong Hye Choi, So Young Moon, Sang Joon Son, Chang Hyung Hong and Young-Sil An in Journal of Alzheimer's Disease
Footnotes
Acknowledgments
This study utilized biospecimens and data from the Biobank Innovations for Chronic Cerebrovascular Disease With Alzheimer's Disease Study (BICWALZS) consortium, supported by funding from the Korea Disease Control and Prevention Agency as part of the Korea Biobank Project (#6637-303). The biospecimens and data were obtained from the Biobank of Ajou University Medical Center, a participant in the Korea Biobank Network. This research was also funded by the National Institute of Health under the research project (Project No. 2024-ER0505-00).
Ethical considerations
The clinical and imaging data used in this study were obtained from the Biobank of the Ajou University Medical Center, affiliated with the Korean Biobank Network (AJHB-ABD-2024-08). Ethical approval for this study was granted by the Institutional Review Board of the Ajou University Medical Center (AJOUIRB-EX-2024-493).
Consent to participate
Written informed consent was obtained from all participants prior to enrollment.
Author contributions
Funding
The authors received no financial support for the research, authorship, and/or publication of this article.
Declaration of conflicting interests
The authors declared the following potential conflicts of interest with respect to the research, authorship, and/or publication of this article: S.W.S. is an associate editor of this journal but was not involved in the peer-review process of this article nor had access to any information regarding its peer review. The other authors declare no conflicts of interest concerning the research, authorship, or publication of this study.
Data availability statement
The datasets generated and/or analyzed in this study are available from the corresponding author upon reasonable request.
Supplemental material
Supplemental material for this article is available online.
References
Supplementary Material
Please find the following supplemental material available below.
For Open Access articles published under a Creative Commons License, all supplemental material carries the same license as the article it is associated with.
For non-Open Access articles published, all supplemental material carries a non-exclusive license, and permission requests for re-use of supplemental material or any part of supplemental material shall be sent directly to the copyright owner as specified in the copyright notice associated with the article.