
Abstract
Background
Diagnosis of Alzheimer's disease (AD) is crucial for effective intervention and care planning. Recently, artificial intelligence-driven eye-tracking (AI-driven ET) tools have emerged as promising diagnostic aids.
Objective
To evaluate the diagnostic accuracy of AI-driven ET models for AD detection.
Methods
A systematic review and meta-analysis were conducted according to PRISMA2020. Different database and grey literature were searched up to March 2025. Data were analyzed with Meta-Disc 1.4 and R software. This meta-analysis has been registered in PROSPERO (CRD420251020284).
Results
Ten papers were included in the narrative synthesis and eight in the meta-analysis. Our systematic review found that most studies reported moderate to good accuracy of AI-driven ET tools in AD detection. The meta-analysis revealed that AI-driven ET tools achieved a sensitivity of 0.75 [95% CI: 0.67; 0.79], specificity of 0.75 [95% CI: 0.67; 0.81], positive likelihood ratio of 3.29 [95% CI: 2.36; 4.59], negative likelihood ratio of 0.36 [95% CI: 0.27; 0.48], diagnostic odds ratio of 10.40 [95% CI: 5.58; 19.39], and area under the ROC curve of 0.81. Deep learning seems to have better performance than supervised machine learning (SML). Among classification algorithms, support vector machines appear most robust across studies. The meta-regression identified population size, patient preparation, measurement systems, AI techniques, and SML algorithms as significant sources of heterogeneity.
Conclusions
AI-driven ET tools suggest moderate to good diagnostic accuracy for distinguishing AD patients from healthy controls, based on available case-control studies. However, evidence for effective screening in broader populations is lacking. Further research is needed to confirm these results across diverse clinical settings and strengthen model robustness.
Keywords
Introduction
Alzheimer's disease (AD) is a progressive neurodegenerative disorder characterized by an insidious onset and gradual decline in cognitive and behavioral functions, including memory, comprehension, language, attention, reasoning, and judgment. 1 As the global population ages, AD has become a major public health concern, affecting millions of individuals worldwide. 1 The incidence of the disease doubles with each passing decade. 1 Furthermore, AD has recently emerged as one of the leading causes of death among individuals aged 70 and older. 2 The main challenge for clinicians is the difficulty of timely and precise clinical diagnosis of AD, particularly in its early stages. 3 Given that therapeutic interventions are most effective before neuronal degeneration occurs in the brain, the need for earlier diagnosis of AD has become urgent. 4 Over the past decade, significant progress has been made in this field. Economical and non-invasive tests, including blood, cerebrospinal fluid, saliva, urine, speech, and ocular tests, have been proposed as methods for the early detection of AD.2,5,6 Among ocular tests, eye-tracking (ET) methods have recently emerged as promising tools for the diagnosis and classification of AD.7–16 This novel method objectively quantifies eye movements and tracks the position of a subject's gaze.7–16 Indeed, recent studies have demonstrated that AD patients exhibit distinct patterns in eye movement behaviors, like difficulties in maintaining stable fixation, deficient smooth pursuit, impaired saccades, and delayed vergence. 17 Furthermore, the integration of artificial intelligence (AI), regardless different techniques and models, has further enhanced the diagnostic capabilities of ET data, supporting earlier intervention in AD.7–16
On the other hand, current systematic reviews and meta-analyses have mainly explored the use of AI-based ET technologies in dementia, with no prior studies focusing exclusively on AD. 18 Thus, to date, the effectiveness of AI-driven ET methods for AD diagnosis remains insufficiently supported by robust evidence. Considering this gap in the literature, this meta-analysis aims to synthesize the available evidence and offer a clearer understanding of the potential of this emerging tool in the detection of AD.
Methods
This systematic review and meta-analysis followed the recommendations provided in the Cochrane Handbook for Systematic Reviews of Interventions and complied with the Preferred Reporting Items for Systematic Reviews and Meta-Analyses (PRISMA) 2020 guidelines. The clinical question was formulated using the PICO framework (Population, Intervention, Comparison, Outcome) (Supplemental Table 1). This meta-analysis was registered in PROSPERO (CRD420251020284).
Search strategy
Two researchers independently performed a literature search on PubMed, Google Scholar, Scopus, PsychoINFO, Embase, Institute of Electrical and Electronics Engineers (IEEE), and the Cochrane Library to identify relevant studies. The search entries we used were as follows: ((“Alzheimer's disease” OR “cognitive impairment” OR “dementia” OR “Cognitive dysfunction” OR “Cognitive decline” OR “cognitive disorders” OR “Major neurocognitive disorder”) AND (“eye-tracking” OR “gaze-tracking” OR “eye movement” OR “saccade” OR “eye task”) AND (“Artificial intelligence” OR “Deep learning” OR “Machine learning” OR “Neural Networks” OR “algorithms” OR “Natural Language Processing”)). We exanimated the reference lists of relevant review articles and systematic reviews, with or without meta-analysis, to identify additional studies. We searched for conferences and unpublished papers, thesis database, and searching dissertation through OpenGrey. Technology-related gray literature databases such as Science.gov, arXiv, medRxiv, and ProQuest, as well as AI-focused journals from the ACM Digital Library, were explored. No restrictions were applied regarding the date or language. The search covered all records from inception up to March 2025. Records were imported into Mendeley to remove duplicates. Screening was conducted in two phases using the Covidence platform (https://www.covidence.org/). In the first phase, two independent authors manually screened the titles and abstracts. In the second phase, full texts were independently assessed for eligibility by the same two authors. Any discrepancies were resolved through discussions between the researchers.
Eligibility criteria
We included all studies that meet the following criteria: (i) Case-control, cohort, or cross-sectional studies; (ii) Adults diagnosed with AD using any recognized diagnostic criteria; (iii) Utilization of AI-driven tools related to ET for AD diagnosis, regardless of the type, model of AI, or ET technique; (iv) Availability of data for qualitative or quantitative analysis, including accuracy, or sensitivity (Recall or True Positive Rate), or specificity (True Negative Rate), or precision (Positive Predictive Value), or negative likelihood ratio (LR-), or positive likelihood ratio (LR+), or diagnostic odds ratio (DOR), or area under the ROC curve (AUC).
We excluded from our study: (i) Review articles, systematic reviews, or case reports; (ii) Adults with cognitive disorders other than AD; (iii) Animal models with AD; (iv) Studies using only ET for AD diagnosis without AI; (v) Studies using AI for AD diagnosis with techniques other than ET.
Data extraction
Data extraction was performed using Microsoft Excel Office 16. The relevant information and variables of interest were: (i) Authors, date of publication, origin, data source, study design and setting; (ii) Alzheimer cases characteristics (age, gender, disease duration, education years, diagnostic criteria); (iii) ET tools; (iv) AI models and algorithms; (v) Available findings including accuracy, sensitivity, specificity, F1 score, precision, AUC, true positive (TP), true negative (TN), false positive (FP), and false negative (FN).
When TP, TN, FP, and FN were unavailable, we calculated them using various formulas 19 based on the available data and entered the results into Microsoft Excel Office 16 (Supplemental Table 2).
Quality assessment and publication bias
Two reviewers independently evaluated the methodological quality of the studies using the Quality Assessment of Diagnostic Accuracy Studies 2 (QUADAS-2) tool. This tool was selected due to its focus on diagnostic accuracy studies, aligning closely with the goals of our systematic review and meta-analysis. QUADAS-2 evaluates the methodological quality of diagnostic accuracy studies in four domains: patient selection, index test, reference standard, and flow and timing. It assesses bias within each domain and examines the applicability of findings in the first three domains. Independent evaluators assigned assessments of “low”, “high”, or “unclear” risk of bias to each guiding question within the domains. Conflicts were resolved through consensus. Quality assessment was evaluated using R software version 4.4.1 (R Foundation for statistical Computing, Vienna, Austria). 20 Deek's Funnel Plot and Egger's method were used to evaluate potential publication bias when the study count exceeded 10. 20 The Egger test significance level was set at 0.1.
Data analysis
As stated in the Cochrane Handbook for Systematic Reviews of Interventions, at least two studies are required to perform a meta-analysis. 21 Given the potential differences among studies, we opted for a random-effects model with inverse variance weighting instead of a fixed-effects model. To generate the pooled values for sensitivity, specificity, LR+, LR-, and DOR, we used Meta-Disc Software version 1.4. The software calculations were based on the input of TP, TN, FP, and FN. Meanwhile, sensitivity and specificity are closely related, so changing the test cut-off to improve one usually lowers the other. To address this, a bivariate model was applied to jointly estimate sensitivity and specificity, using R version 4.4.1 (R Foundation for Statistical Computing, Vienna, Austria) with the mada package and the reitsma() function. 20 Hierarchical summary receiver-operating characteristic (HSROC) curve was also generated using R version 4.4.1. 20 The bivariate and HSROC models are more robust methods, accounting for both within-study and between-study variability. The AUC was estimated based on the bivariate analysis and the HSROC to evaluate diagnostic performance. To assess heterogeneity across studies, the Cochran Q test (with a significance level of p < 0.1) and the I² statistic was used. The levels of heterogeneity were categorized as follows: minimal (I² value, 0–25%), low (25–50%), moderate (50–75%), and high (>75%). To evaluate the influence of individual studies on the overall pooled estimates, we conducted a leave-one-out sensitivity analysis. This involved sequentially removing one study at a time and re-running the meta-analysis to evaluate whether any single study disproportionately affected the pooled estimates. A subgroup analysis according to AI models and algorithms alongside with patient preparation, measurement systems, task performed, and data collection was conducted if high heterogeneity is observed. In the subgroup analysis, sensitivity and specificity were estimated using a bivariate model implemented in R software. The threshold effect was analyzed using the Spearman correlation coefficient. Additionally, meta-regression was performed to identify the sources of heterogeneity between the studies. 20 The significance level for the pooled effect was set at p < 0.05. An effect was considered statistically significant when p = 0.05, provided that the 95% confidence interval (95% CI) did not include 0.
Results
Search outcomes
As shown in Figure 1, a total of 203 records were retrieved from electronic databases, 14 records were sourced from grey literature databases and reference searches, and 542 from Google Scholar. After excluding duplicates, the remaining 93 title and abstracts were independently reviewed by two investigators, leading to the evaluation of 16 full texts. Out of these, 2 papers were not retrieved. Among the remaining 14 studies, 4 were excluded, resulting in a final selection of 10 reports.
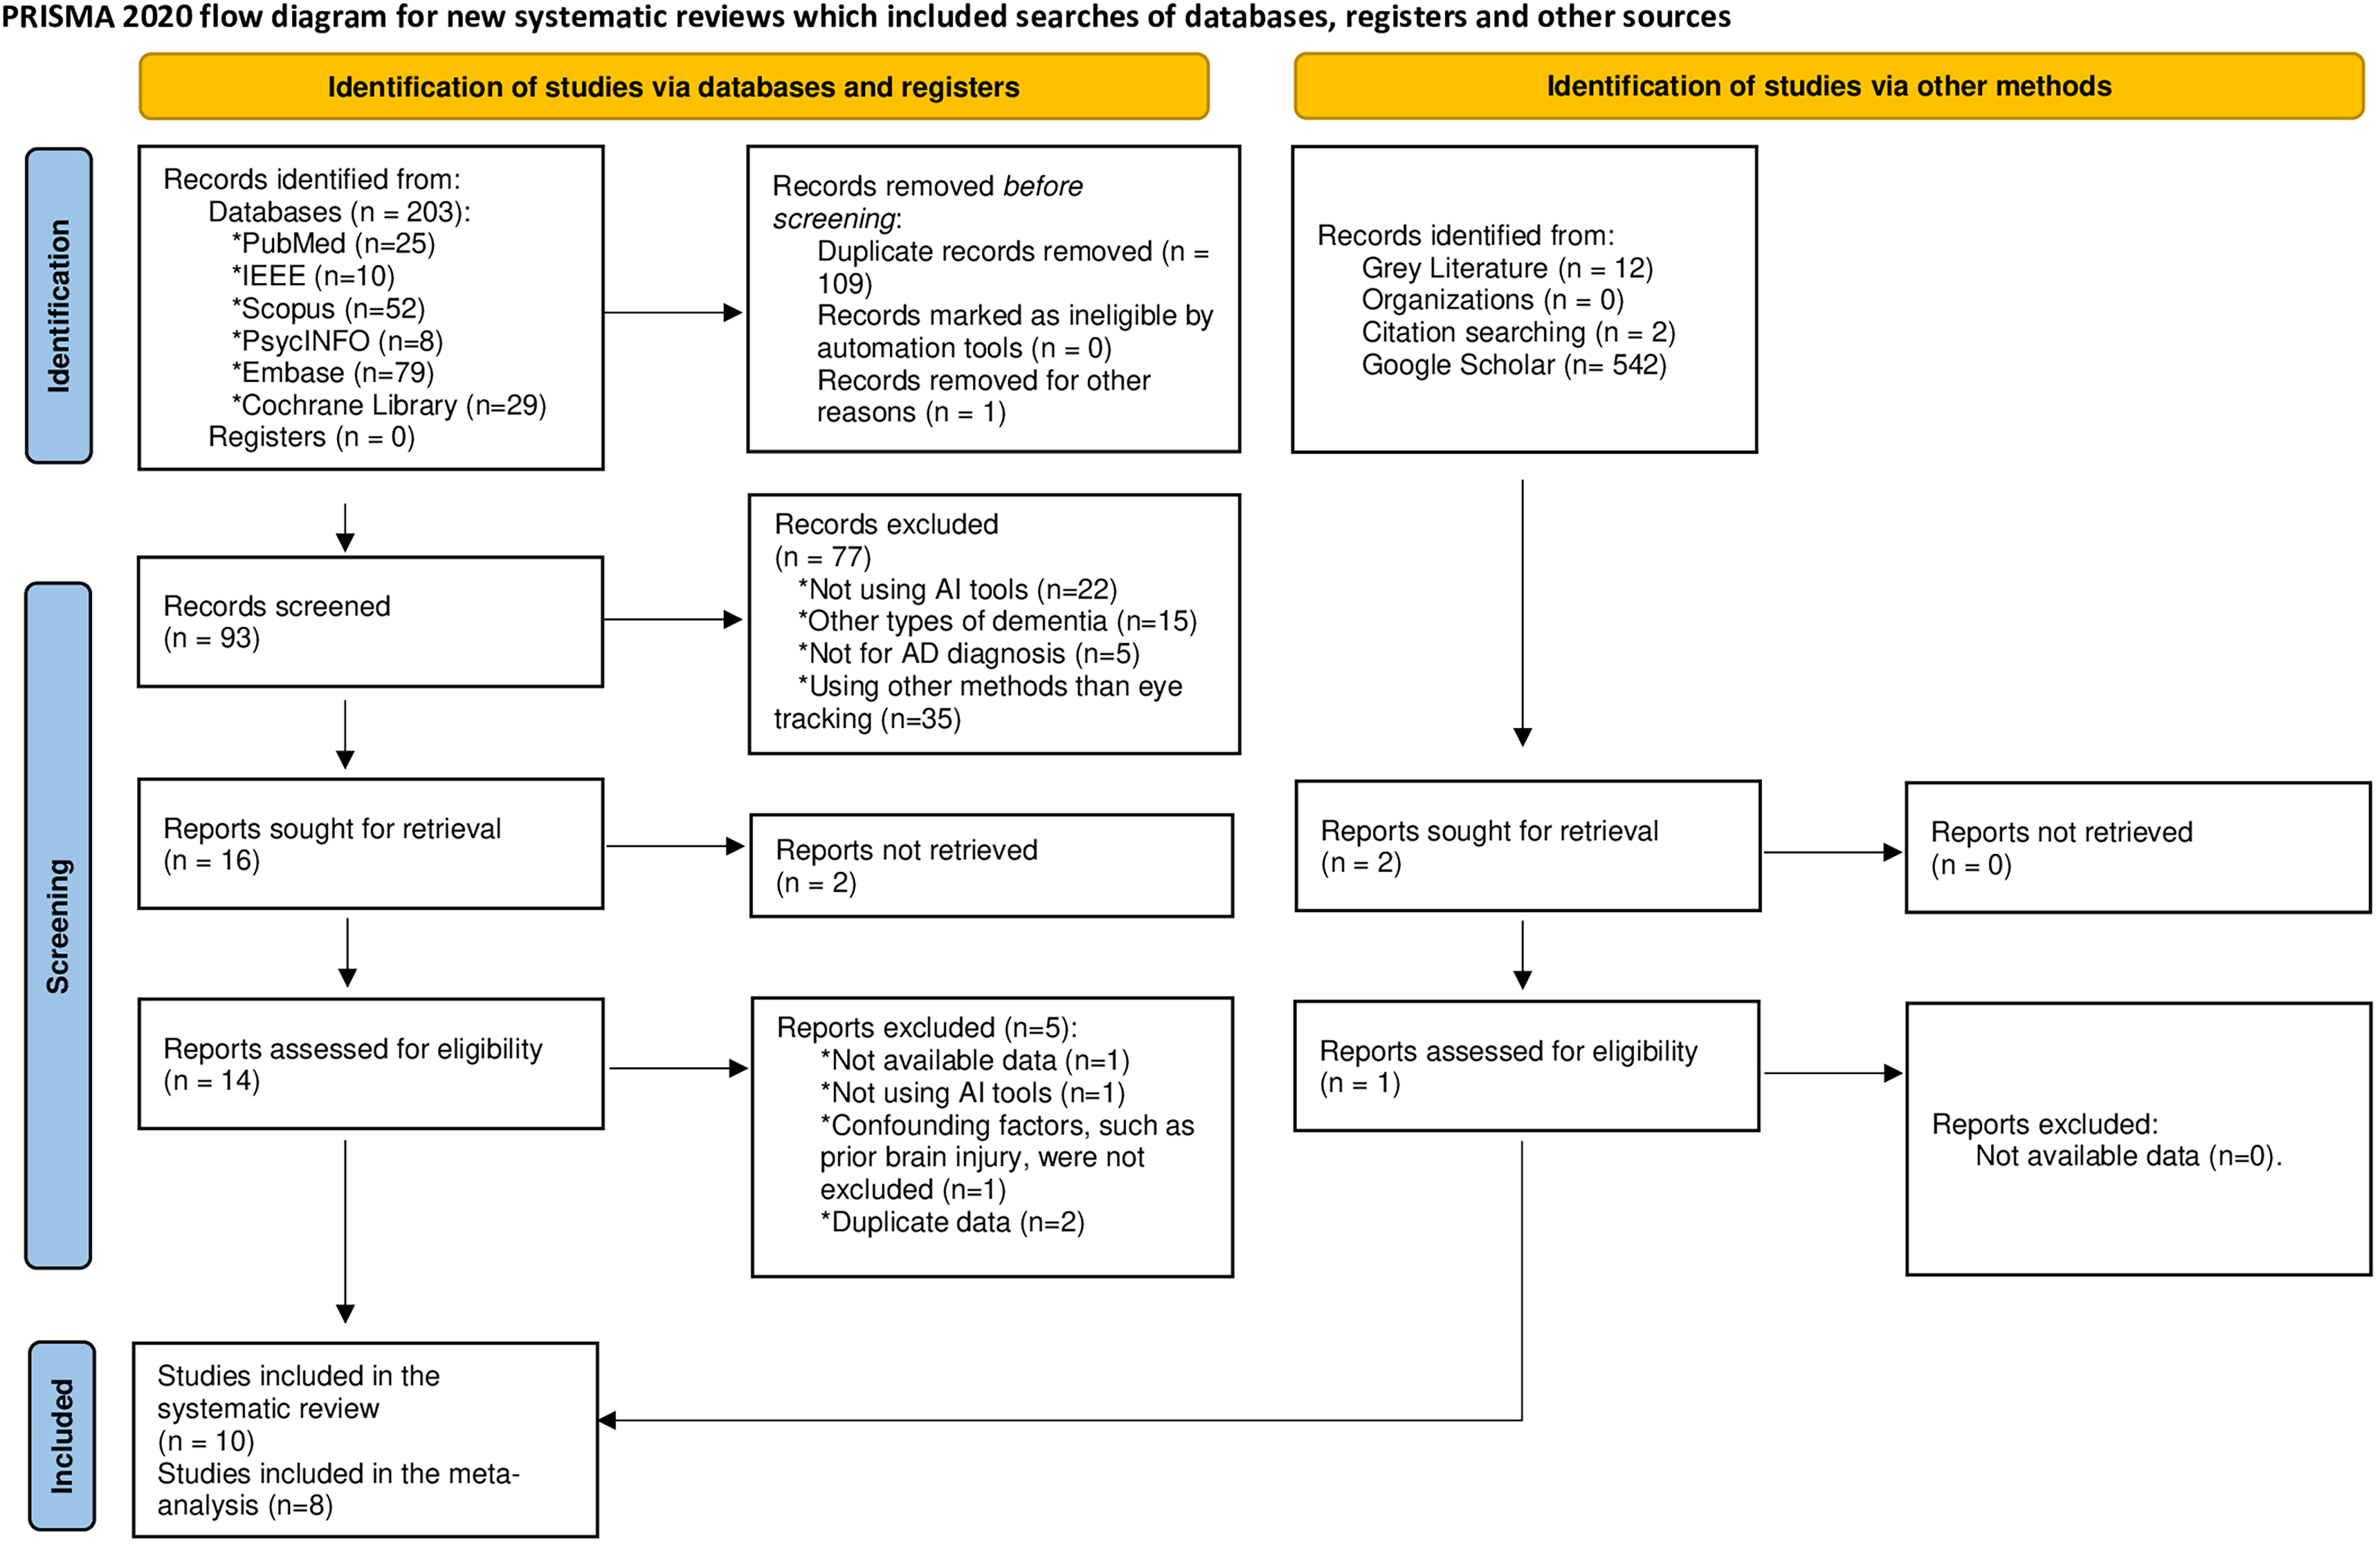
PRISMA flow diagram illustrating the processes of search and screening.
The studies conducted by Yin et al. 22 and Liu et al. 23 were excluded because they involved the same population and AI methods as those used by Sun et al., 15 to avoid duplication of data and potential bias in the analysis. However, although the study conducted by Zuo et al. 14 used the same population source as Sun et al., 15 it was included in the meta-analysis because it employed different criteria of diagnosis of AD and various AI tools and analytical approaches, thereby providing independent and non-duplicative data suitable for inclusion.
Quality evaluation
Figure 2 illustrate our evaluation of the risk of bias and applicability across each domain of the included studies. In total, two studies were judged to have a high risk of bias, five had a low risk, and three studies raised some concerns. While the assessment of the patient selection, the index test, and the reference standard generally appears to be of low risk, there are more significant concerns regarding flow and timing.
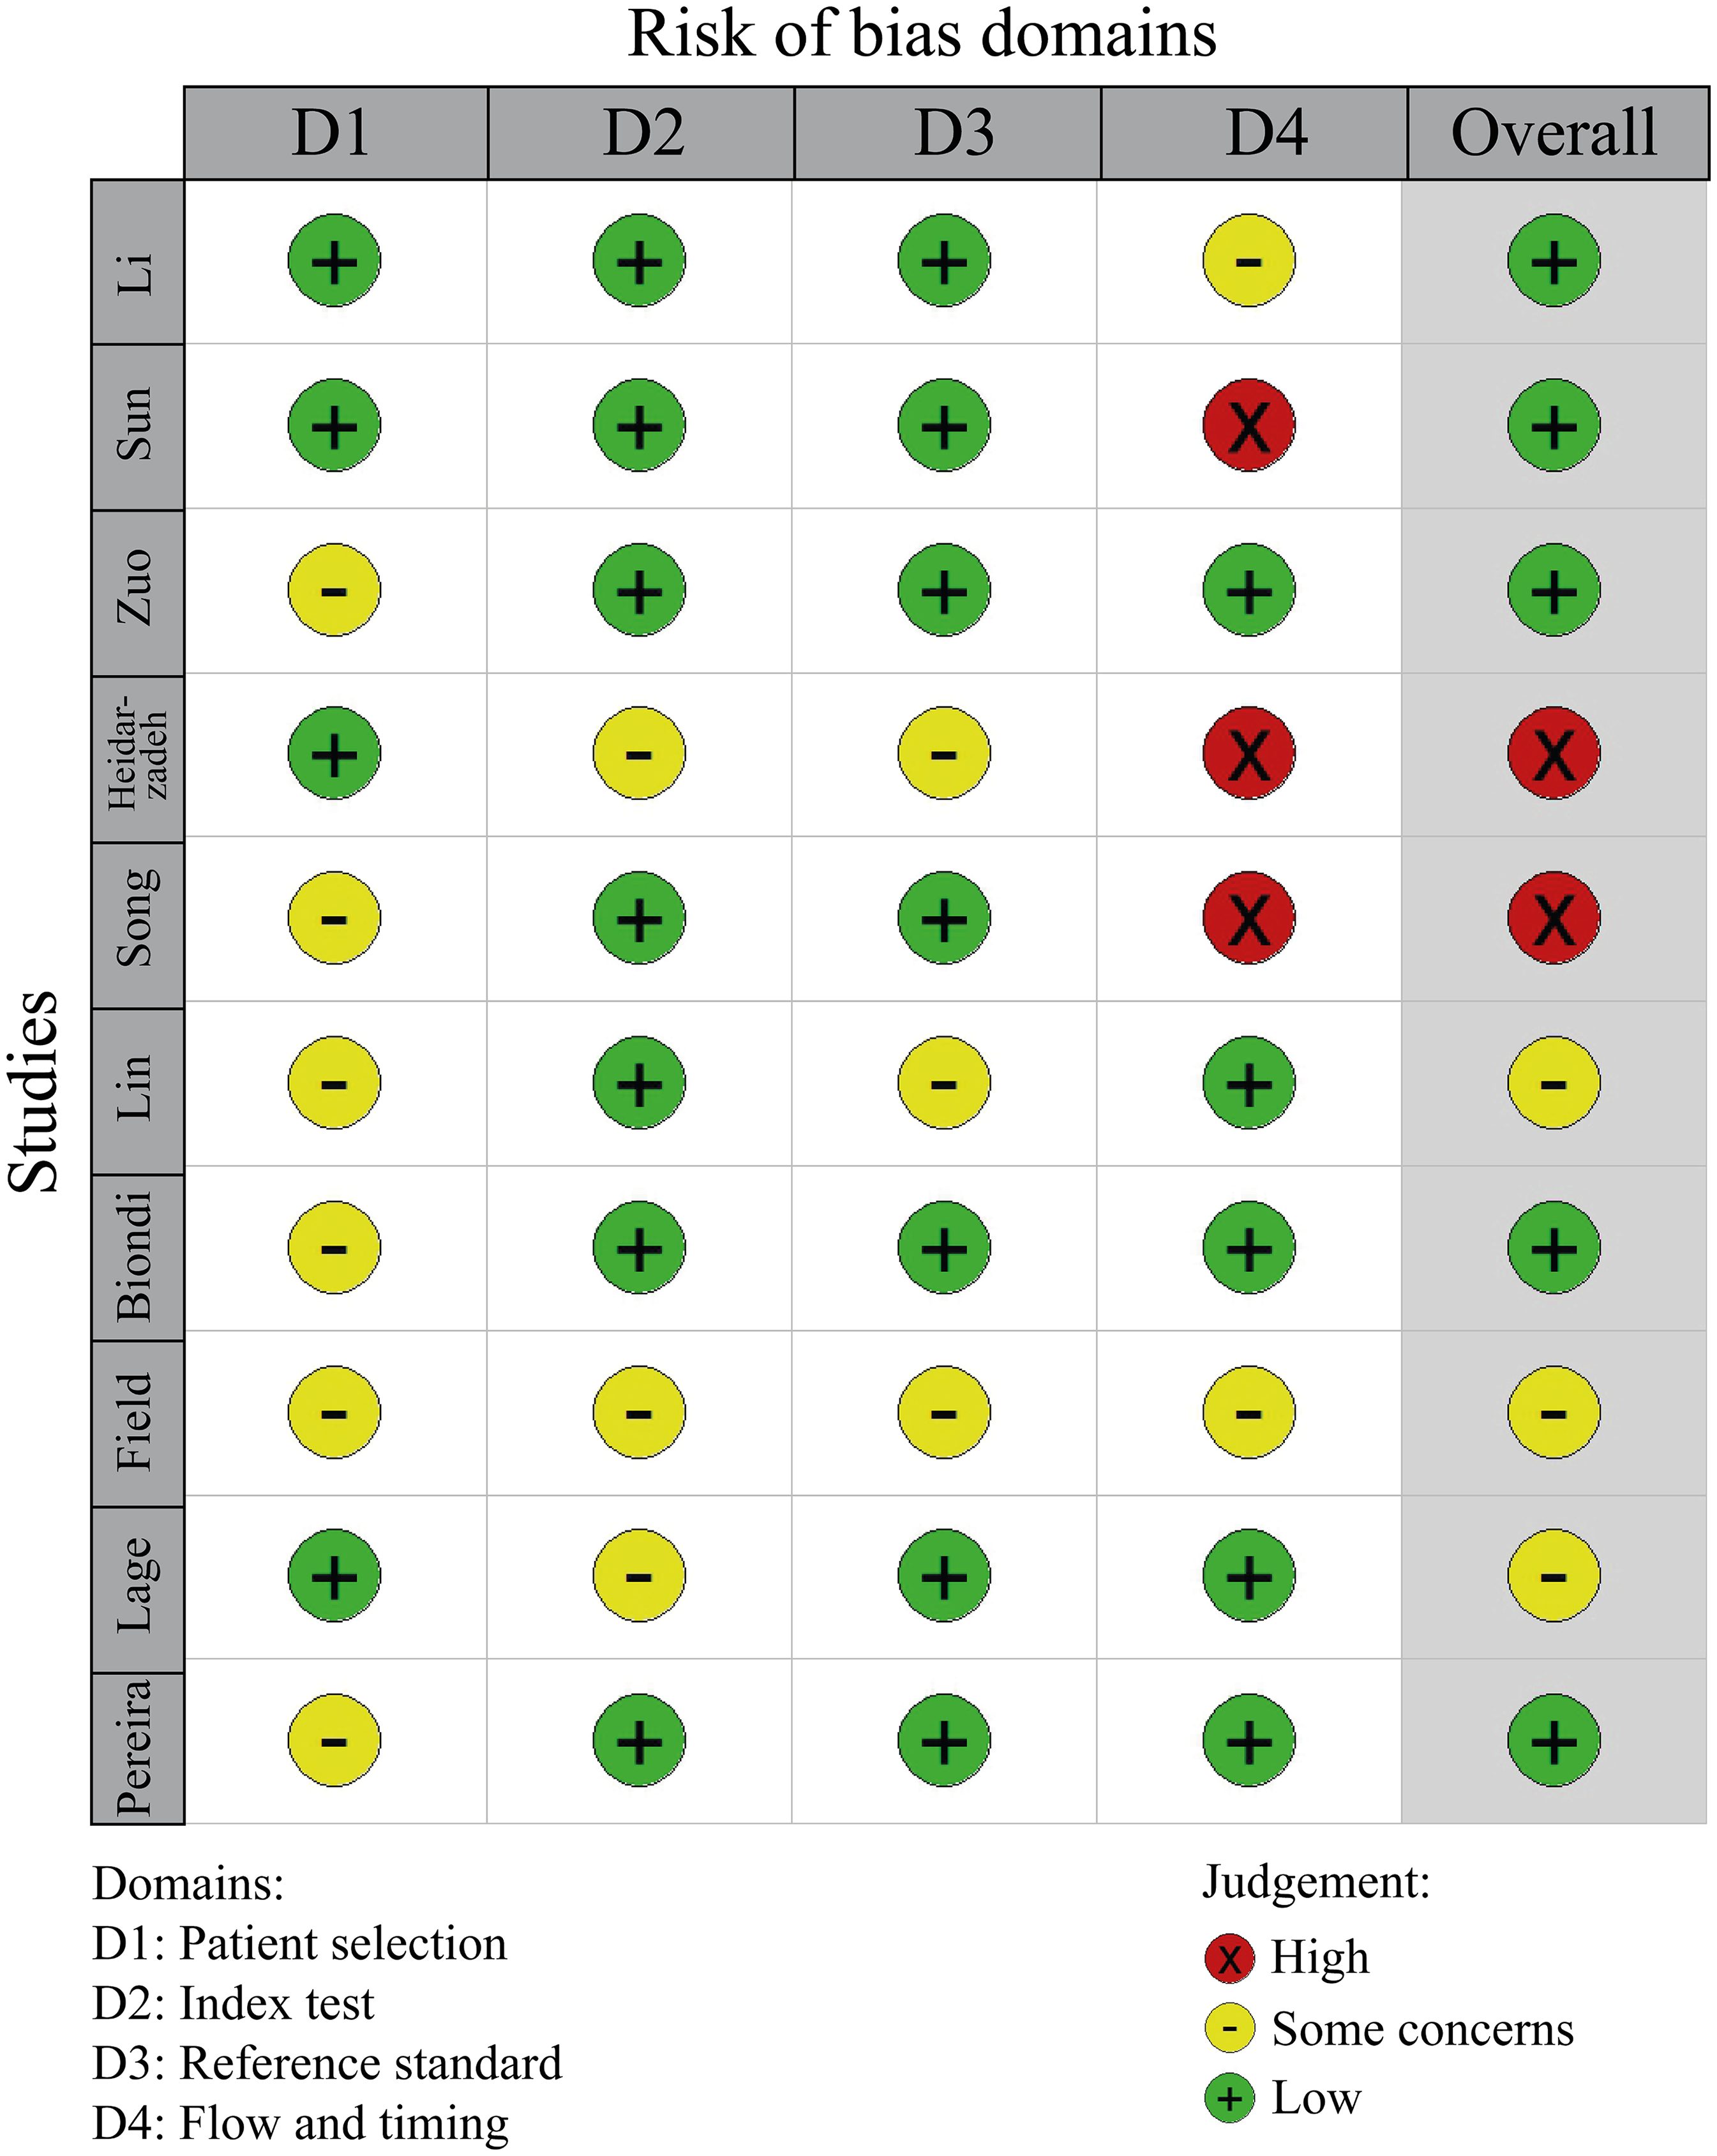
Risk of bias summary.
Study and subjects’ characteristics
Table 1 presents the characteristics of the studies included in the analysis. The geographical distribution revealed that the majority were conducted in China (n = 4), followed by Canada (n = 2), Taiwan region (n = 1), Brazil (n = 1), Spain (n = 1), and another study from Argentina (n = 1). All the studies were case-control studies conducted with hospital-based populations. The studies were published between 2018 and 2024. The sample size for AD ranged from 19 to 166, while the sample size for healthy controls (HC) ranged from 29 to 107. Nine studies excluded participants with confounding factors such as a history of mental disorders, illicit drug abuse, acute or chronic liver and kidney dysfunction, malignant tumors, or other severe underlying health conditions. The mean age of AD cases ranged from 68 to 76 years, with the percentage of females varying from 13.00% to 66.67%. AD was diagnosed using the National Institute on Aging and Alzheimer's Association criteria in 4 studies, the National Institute of Neurological and Communicative Disorders and Stroke – AD and Related Disorders Association criteria in 2 studies, and the DSM-IV criteria in 2 studies, one of which also used the National Institute of Neurological and Communicative Disorders and Stroke – AD and Related Disorders Association criteria. However, the diagnostic criteria for AD were not provided in 3 studies.9,11,13
Study characteristics and main results.
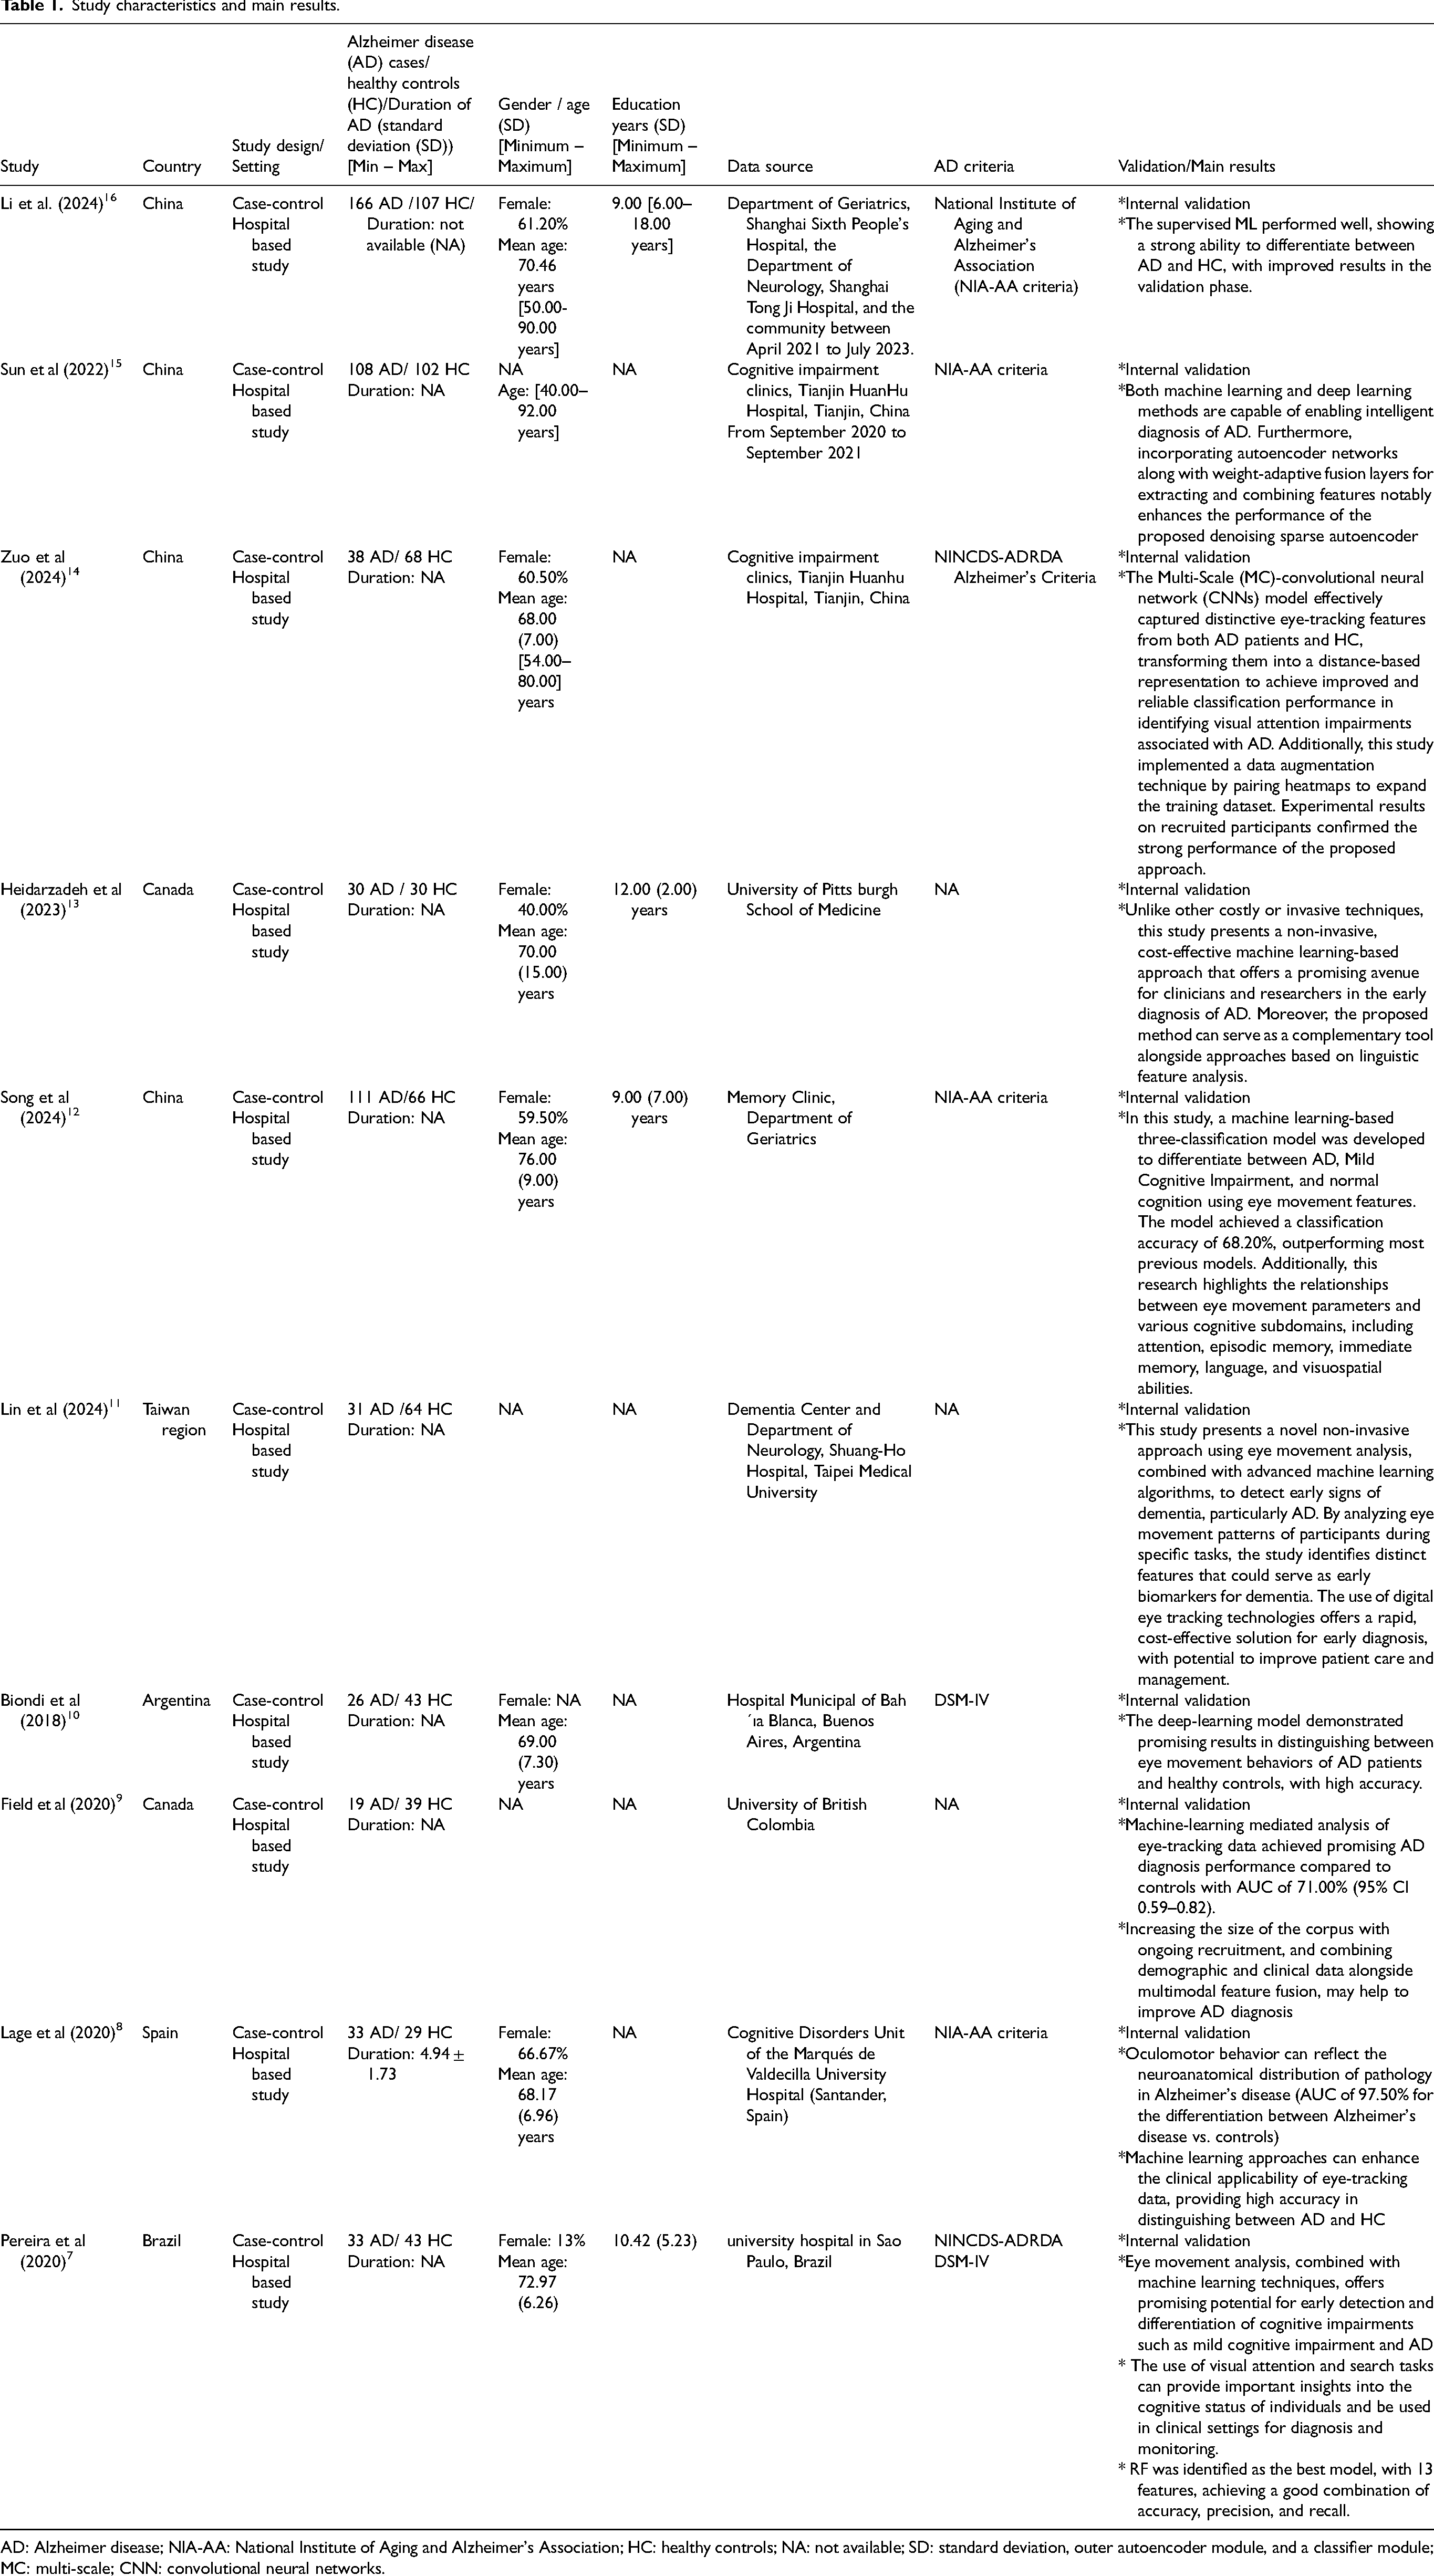
AD: Alzheimer disease; NIA-AA: National Institute of Aging and Alzheimer's Association; HC: healthy controls; NA: not available; SD: standard deviation, outer autoencoder module, and a classifier module; MC: multi-scale; CNN: convolutional neural networks.
Narrative synthesis
Ten studies were included for these outcomes.7–16 Table 2 provides a summary of the specific techniques and key findings related to the use of AI tools and ET methods for diagnosing of AD. Supplemental Table 3 summarizes the different aspects of patient preparation, measurement systems, tasks performed, and data collected across various studies. Four studies implemented structured preparation with precise physical control,12,14–16 while the remained studies applied minimal or unspecified preparation.7–11,13 These studies included measures such as head-pose calibration, chin or forehead rests to limit movement, fixed viewing distances, and testing in quiet, well-lit rooms with controlled lighting. Some studies excluded participants with uncorrected vision or significant ophthalmologic disease, while others allowed the use of usual corrective lenses but did not perform formal refractive correction. In certain cases, poor eye-tracker calibration was also an exclusion criterion. Measurement Systems were based on tablet- or Screen-based ET Systems in two studies,12,16 3D systems in two other studies,14,15 Audio-Derived Eye-Movement Estimation in two studies,9,13 Task-Specific ET during Reading or Cognitive Tests in two other studies,7,9 Oculomotor Tasks in one study. 8 However, it was not described in one study. 11 Regarding the tasks used to evaluate ET, five studies employed visual paired comparison (VPC) or recognition tasks,7,8,14–16 two studies focused on oculomotor or eye movement tasks,11,12 two studies utilized picture description with speech-linked eye tracking,9,13 and one study examined reading tasks. 10 Regarding data collection, five studies focused on eye movement and oculomotor features,8,10–12,16 including standard kinematic parameters such as saccades and anti-saccades; two studies utilized fixation maps and heatmaps14,15; and three studies employed speech, picture description, and cognitive assessments.7,9,13
Ai results for diagnosing Alzheimer's disease via eye-tracking.
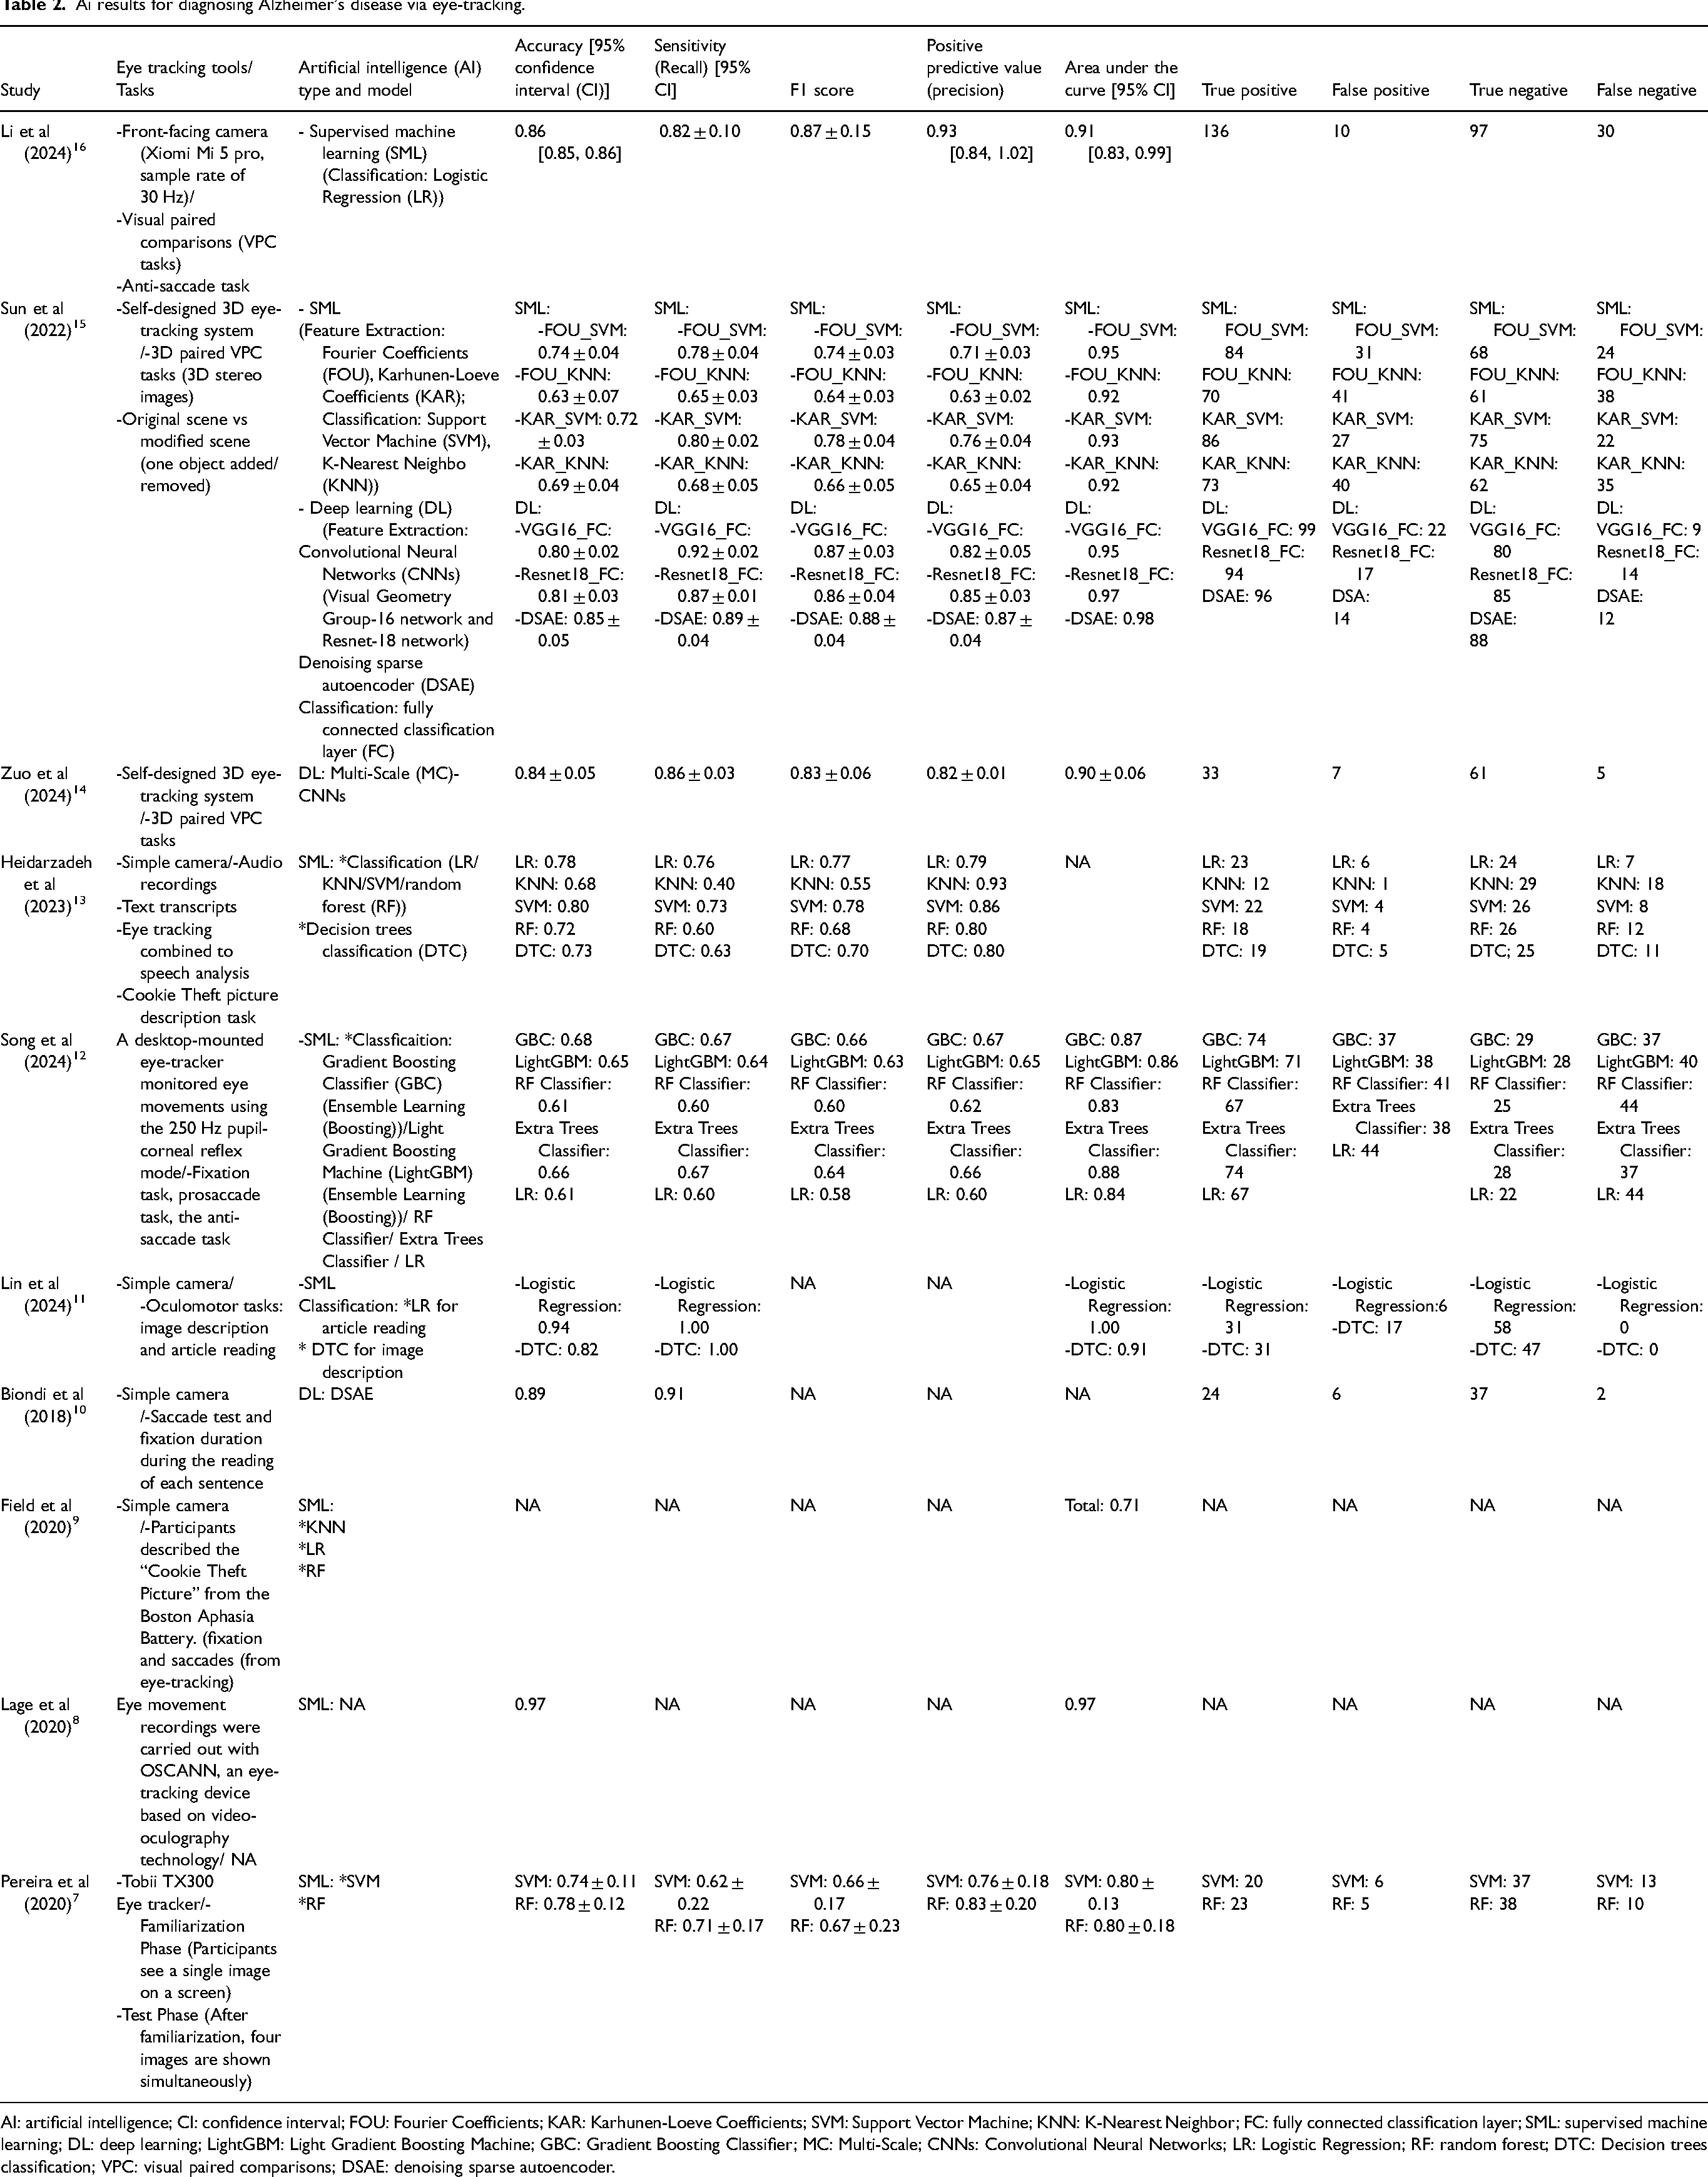
AI: artificial intelligence; CI: confidence interval; FOU: Fourier Coefficients; KAR: Karhunen-Loeve Coefficients; SVM: Support Vector Machine; KNN: K-Nearest Neighbor; FC: fully connected classification layer; SML: supervised machine learning; DL: deep learning; LightGBM: Light Gradient Boosting Machine; GBC: Gradient Boosting Classifier; MC: Multi-Scale; CNNs: Convolutional Neural Networks; LR: Logistic Regression; RF: random forest; DTC: Decision trees classification; VPC: visual paired comparisons; DSAE: denoising sparse autoencoder.
On the other hand, the included studies utilized a variety of ET tools, ranging from manual data extraction methods in ET tasks to front-facing cameras and desktop-mounted devices, as well as more advanced systems like the Tobii TX300 and OSCANN. Tasks varied across studies, including VPC, saccade and fixation tests, sentence reading, image description, and the Cookie Theft picture task. While some studies focused on standard 2D tasks, others implemented 3D ET setups. Regarding AI tools, our findings indicated that supervised machine learning (SML) (82.14%) was more frequently employed than deep learning (DL) (17.86%) for the diagnosis of AD. Unsupervised machine learning (ML) was not utilized in any of the included studies. All models of SML were classifications. Nonetheless, 4.35% of the models remained unclassified. Within the classification algorithms, Logistic Regression (LR) and SVM had the largest share in the dataset (21.10%), followed by k-Nearest Neighbors (KNN), Random Forest (RF), and Ensemble Learning other than RF (EL-), each contributing 15.80%. Decision tree classification (DTC) has the smallest share at 10.50%. In the context of DL, two studies employed convolutional neural networks (CNNs), one of which also incorporated a denoising sparse autoencoder (DSAE), while another study utilized a DSAE (Table 2). AI-driven ET tools showed accuracy of 0.61–0.97, sensitivity of 0.55–0.92, precision of 0.61–0.93, F1 scores of 0.55–0.88, and AUC values of 0.60–0.93.7–9,11,12,14–16 Results showed that 4 studies using SML had an AUC of 0.90–1.00 and three studies had an AUC of 0.70–0.89. All studies using DL had an AUC of 0.90- 1.00. All studies used an internal validation. Detailed main findings of each study are summarized in Tables 1 and 2.
Meta-analysis
Performance of the AI-driven ET tracking tools in AD detection
The bivariate analysis showed a sensitivity of 0.75 [95% CI: 0.67; 0.79] and specificity of 0.75 [95% CI: 0.67; 0.81] with significant heterogeneity between studies (I2= 76.4%). The univariate analysis indicated a sensitivity of 0.74 [95% CI: 0.72; 0.76] and specificity of 0.72 [95% CI: 0.70; 0.74] with significant heterogeneity (Figure 3(a) and (b)). The AI-driven ET tracking tools had a LR + of 3.29 [95% CI: 2.36; 4.59], a LR- of 0.36 [95% CI: 0.27; 0.48] and a DOR of 10.40 [95% CI: 5.58; 19.39], all exhibiting significant heterogeneity (Figure 3(c)–(e), respectively).
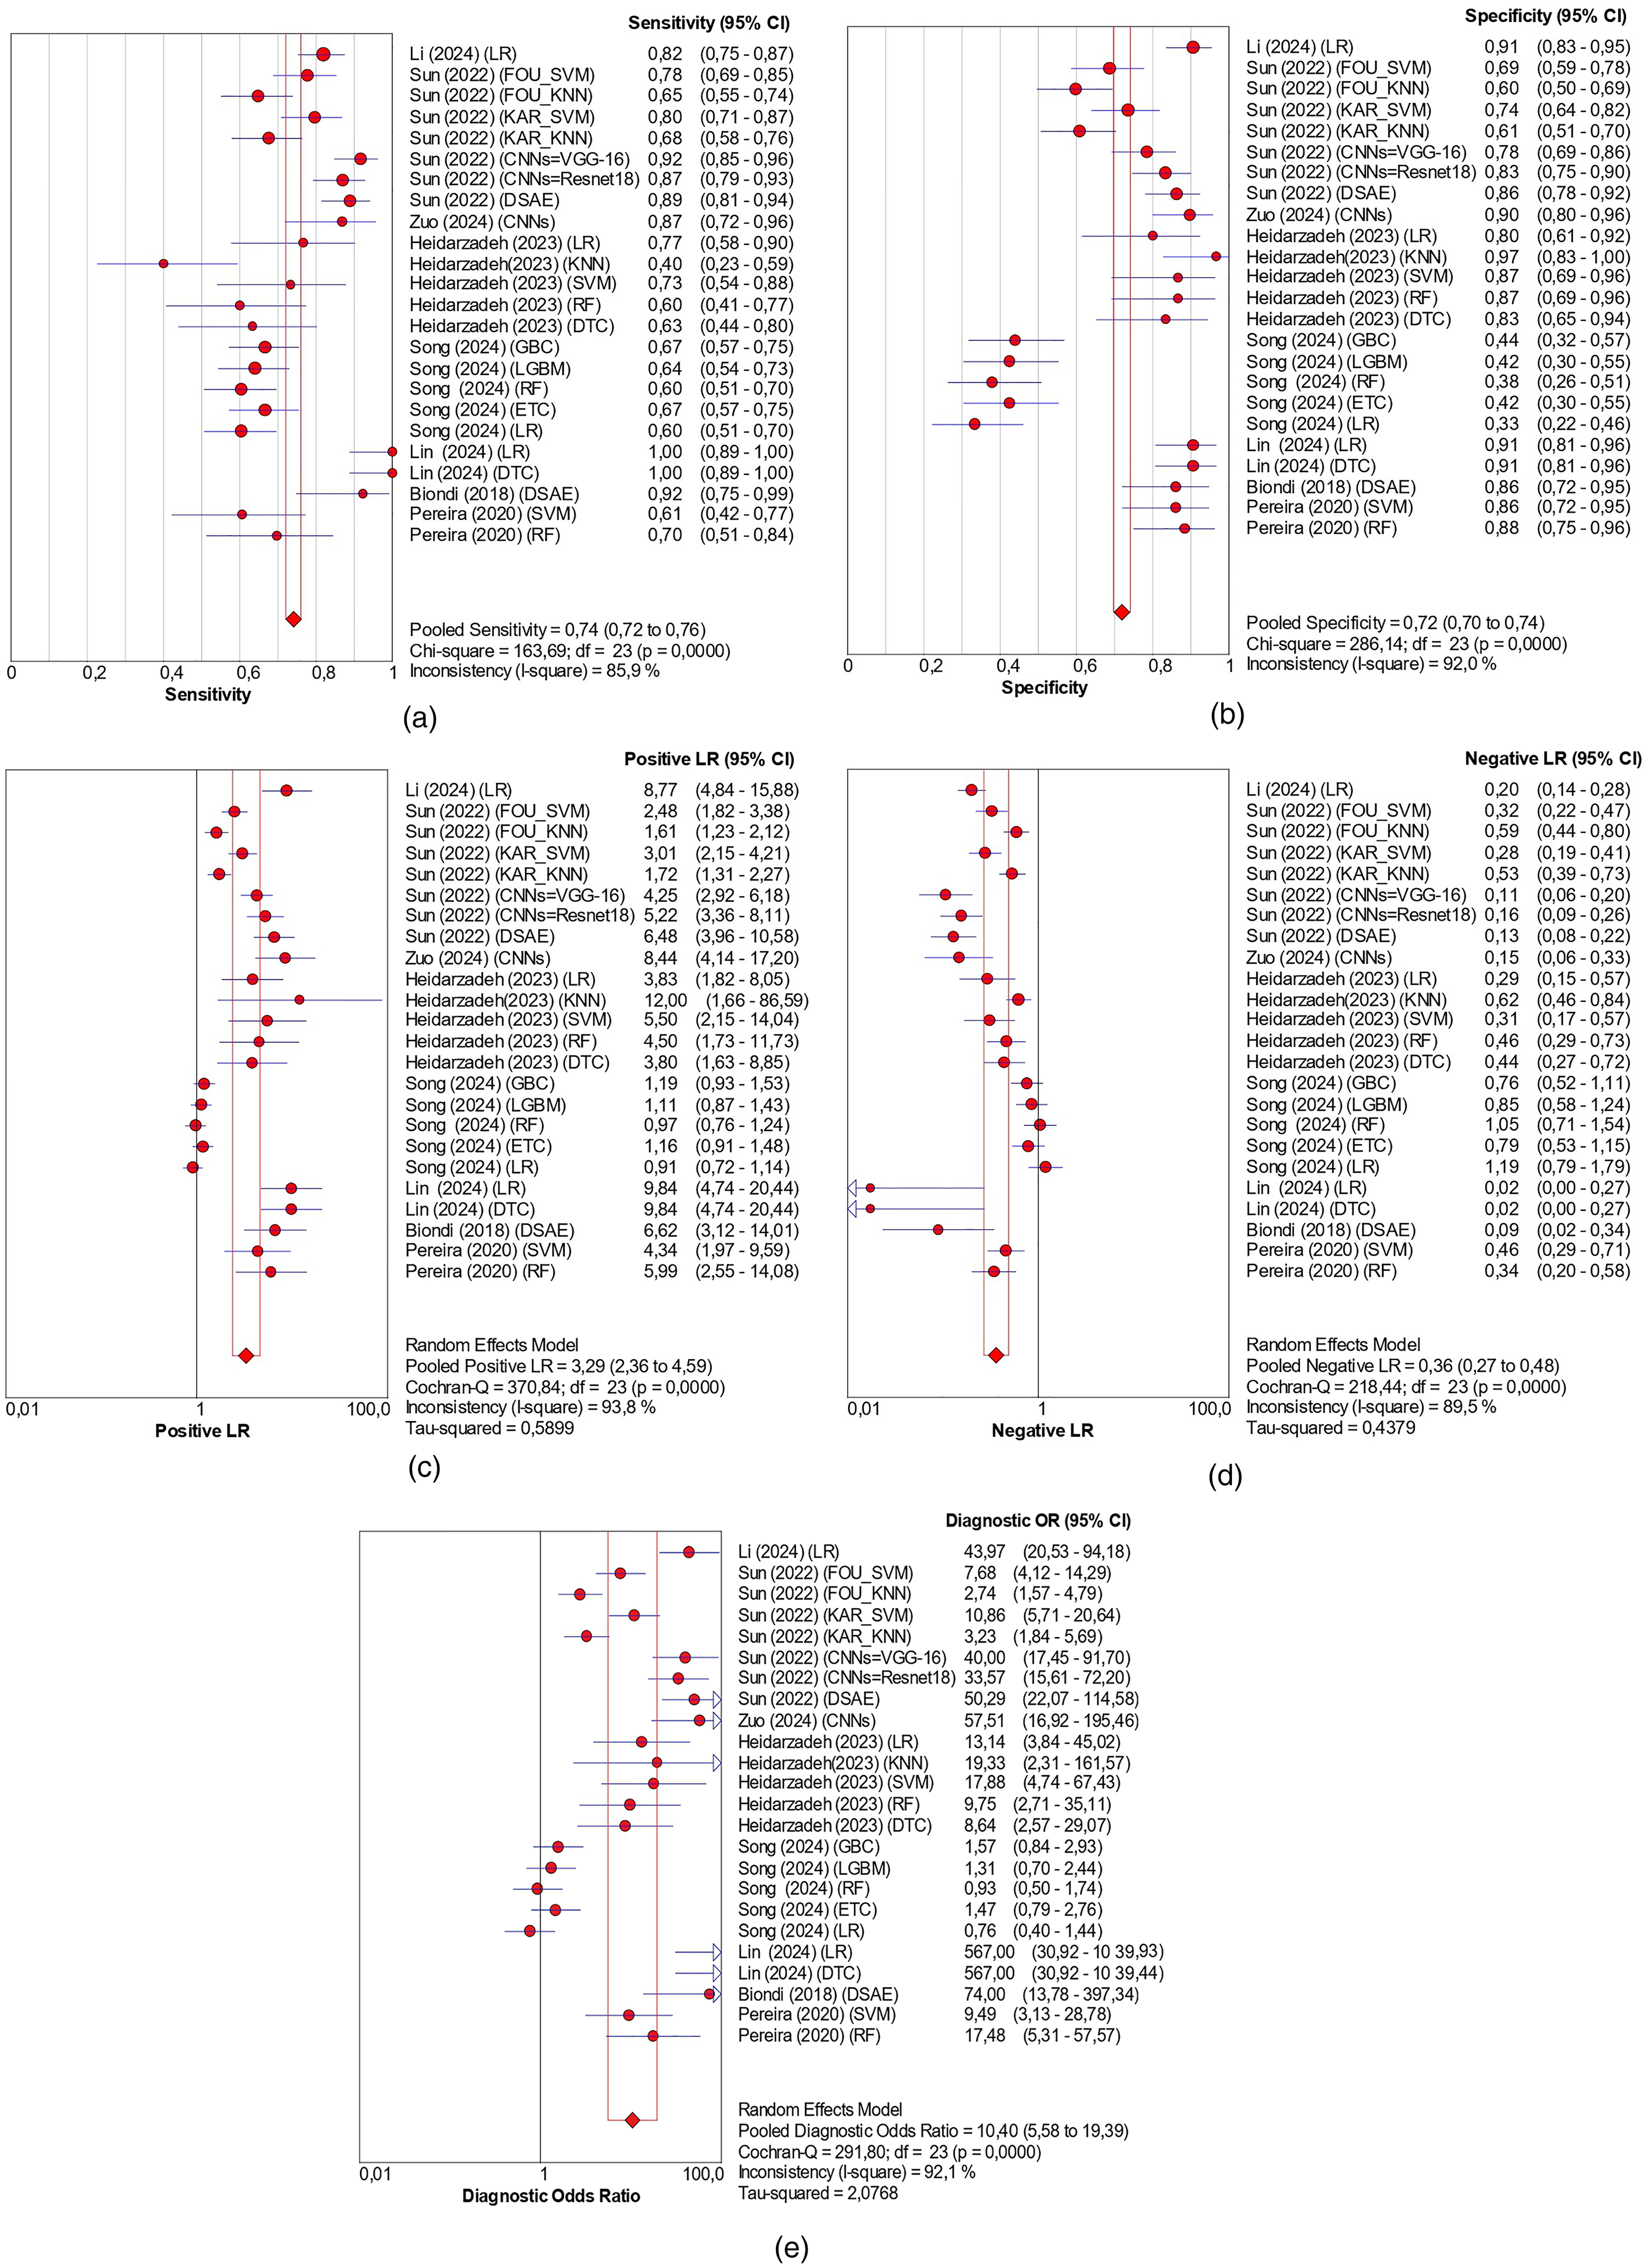
(a) Forest plot of the sensitivity; (b) forest plot of the specificity; (c) forest plot of the LR+; (d) forest plot of the LR-; (e) forest plot of the DOR. LR: logistic regression; FOU_SVM: Fourier Coefficients_Support Vector Machine; FOU_KNN: Fourier Coefficients_k-Nearest Neighbors; KAR_SVM: Karhunen-Loeve Coefficients_ Support Vector Machine; KAR_KNN: Karhunen-Loeve Coefficients_ k-Nearest Neighbors; CNNs: convolutional neural networks; DSAE: denoising sparse autoencoder; RF: random forest; DTC: Decision tree classification; GBC: Gradient Boosting Classifier; LGBM: Light Gradient Boosting Machine; ETC: Extra Trees Classifier.
Leave-one-out sensitivity analysis showed that no single study substantially influenced the pooled diagnostic accuracy metrics. Sensitivity ranged narrowly from 0.73 to 0.75, specificity from 0.71 to 0.74, LR + from 3.13 to 3.51, LR- from 0.34 to 0.38, and DOR from 9.41 and 11.69 (Supplemental Table 4).
The HSROC curve in Figure 4 exhibits a smooth shape without a distinct “shoulder and arm” pattern, suggesting the absence of a threshold effect. The Spearman correlation coefficient also indicated that there was no threshold effect on our results (r = −0.37; p = 0.07). The AUC value was 0.81 indicating good diagnostic accuracy, with the small standard errors (0.03) confirming the reliability of these estimates.
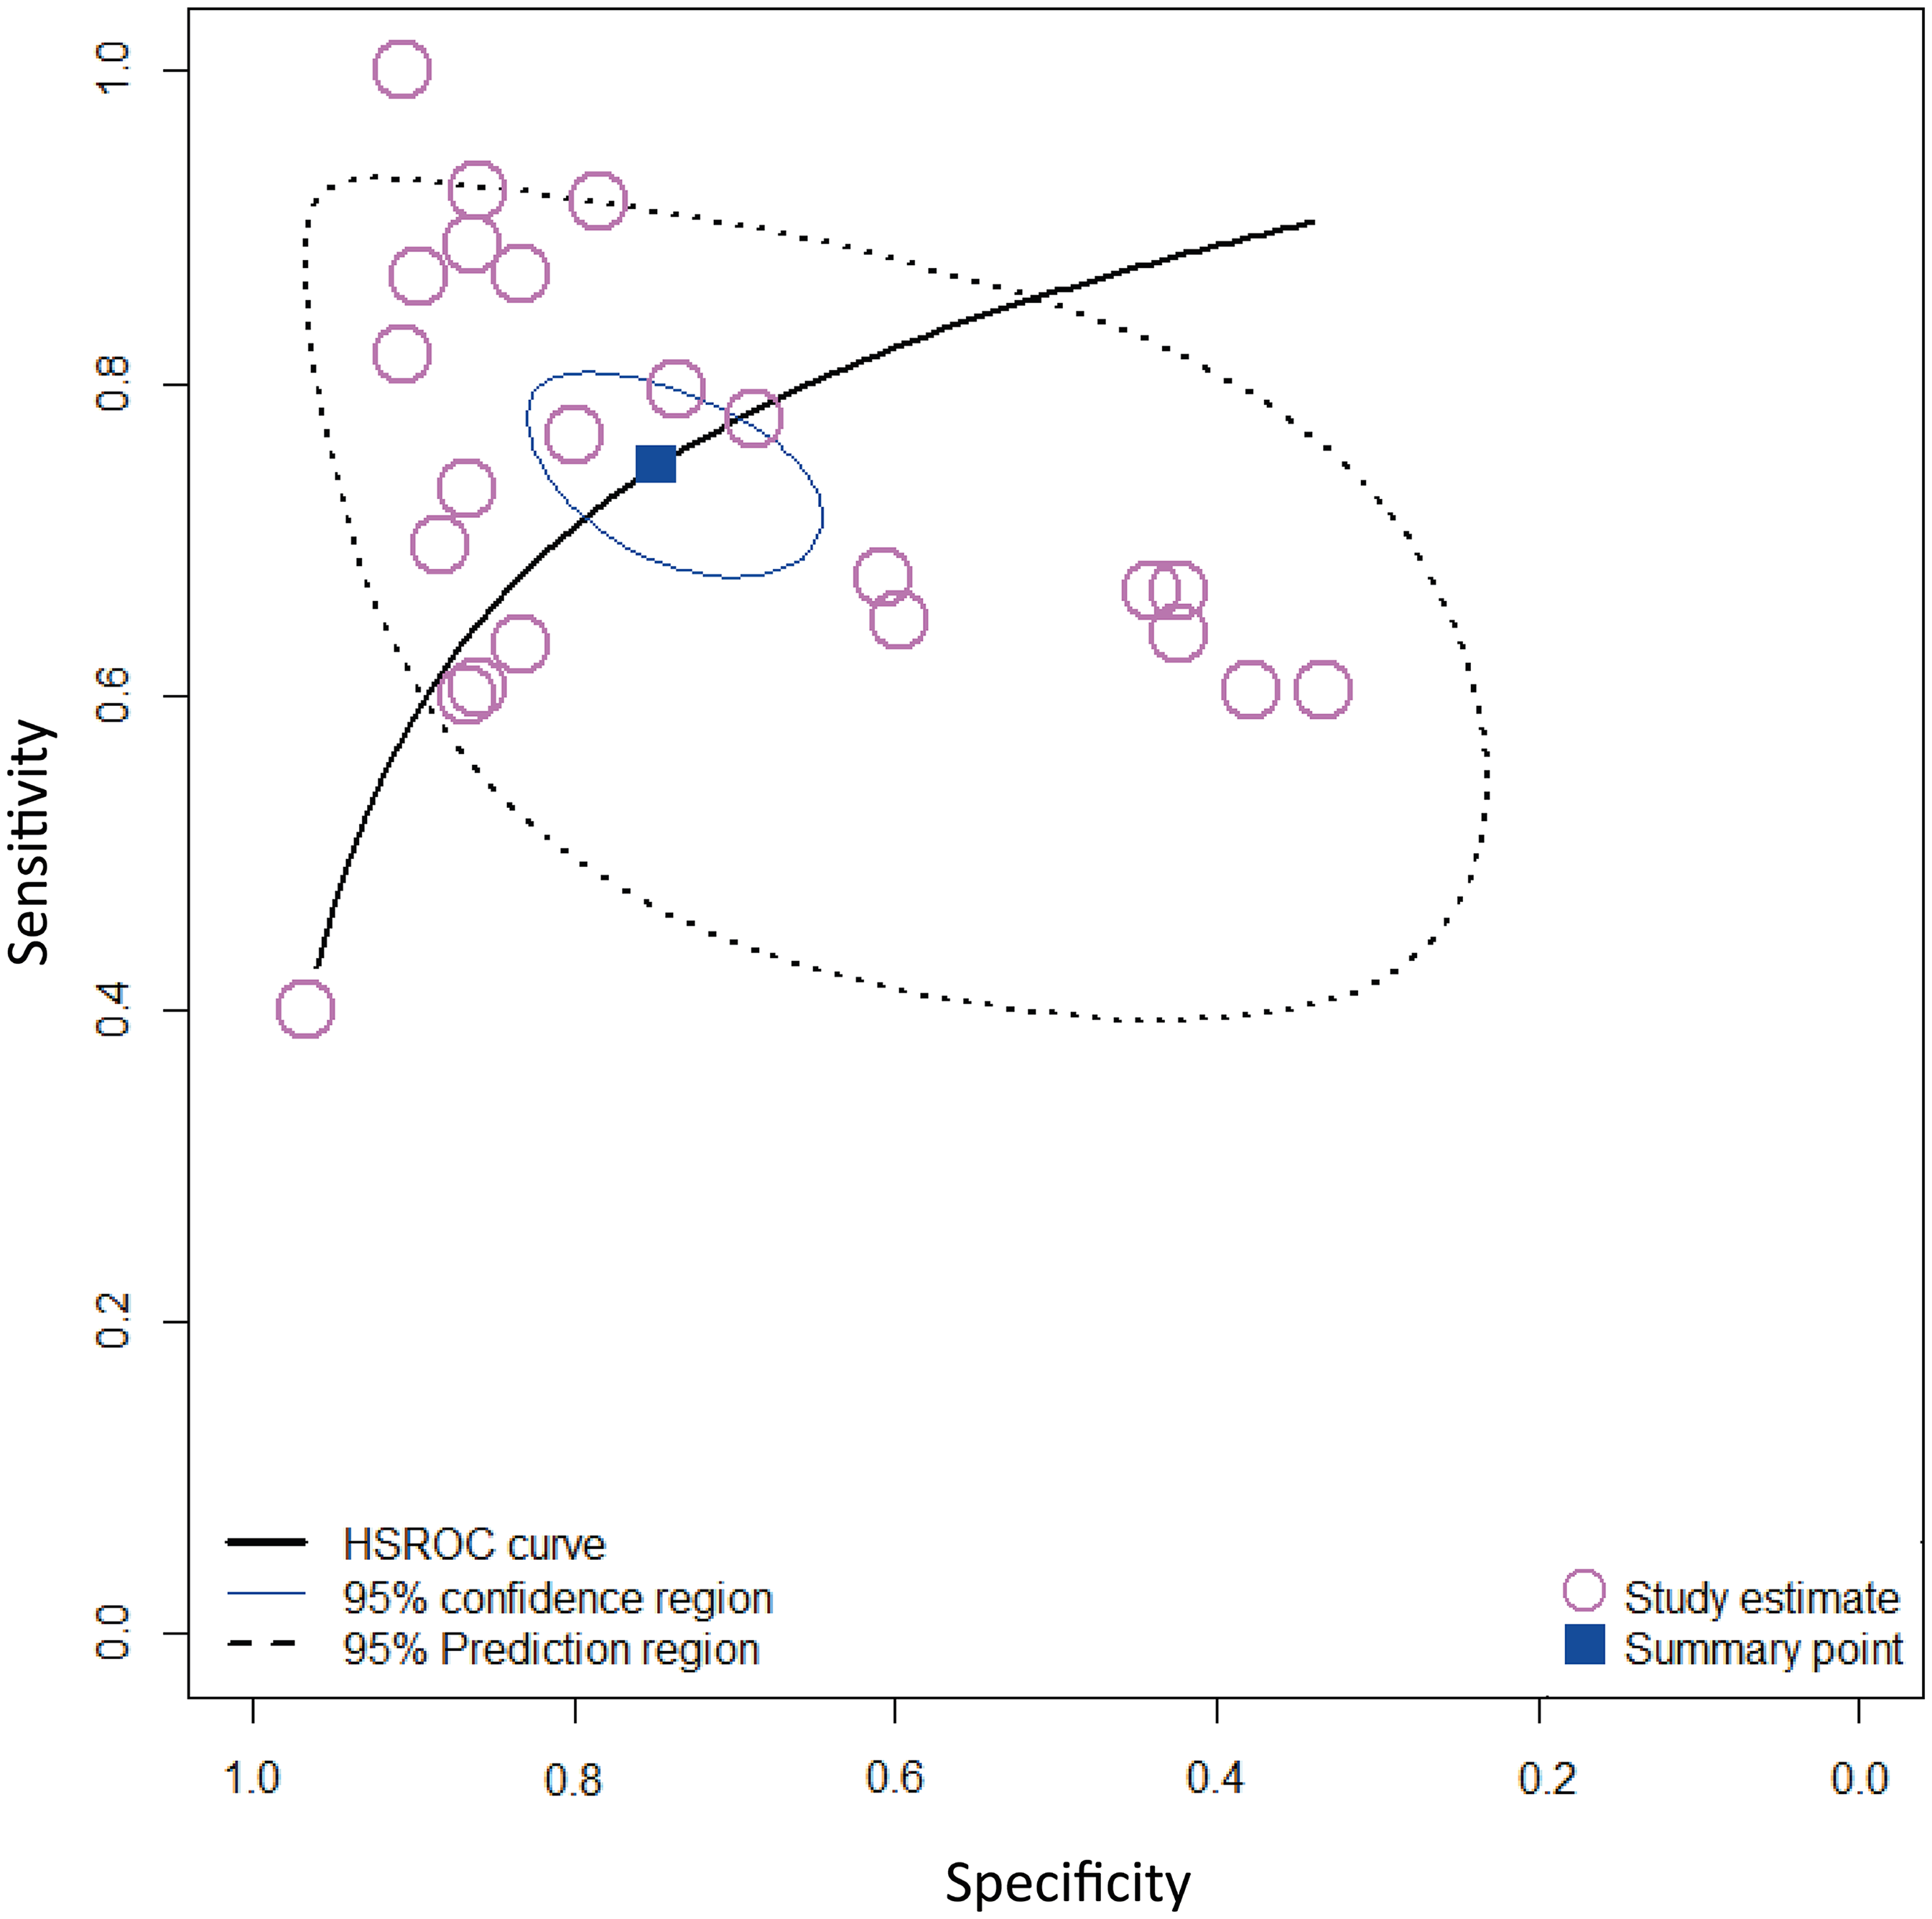
HSROC curve illustrating the diagnostic performance of AI-driven ET tools in Alzheimer's disease detection. The plot shows the summary point representing the pooled sensitivity and specificity across studies, along with the 95% confidence region and 95% prediction region. Each circle corresponds to an individual study's sensitivity and specificity estimates. The spread of these points shows variability among studies. The prediction region indicates the expected range of diagnostic accuracy for future studies conducted under similar conditions.
Subgroup analysis according to AI models
SML models showed a sensitivity of 0.69 [95% CI: 0.65 to 0.73] (I² = 78.00%), specificity of 0.72 [95% CI: 0.62 to 0.81] (I² = 78.00%), AUC of 0.73, LR + of 2.73 [95% CI: 1.96; 3.80] (I² = 92.40%), LR- of 0.47 [95% CI: 0.37; 0.62] (I² = 85.30%), and DOR of 6.51 [95% CI: 3.55; 11.96] (I² = 89.80%). DL had a sensitivity of 0.89 [95% CI: 0.85; 0.92], specificity of 0.84 [95% CI: 0.79; 0.88], AUC of 0.92, LR + of 5.43 [95% CI: 4.35; 6.78], LR- of 0.13 [95% CI: 0.10; 0.18], and DOR of 43.69 [95% CI: 28.69; 66.53], showing no heterogeneity (I² = 0.00%).
Subgroup analysis according to classification algorithms among SML
The DTC demonstrated the highest sensitivity, specificity, LR+, and DOR, and the lowest LR. However, the large heterogeneity and wide 95% CI for DOR, LR-, and LR + indicate that these results are imprecise, suggesting that its diagnostic performance may vary considerably across studies. SVM and LR demonstrated the highest values for sensitivity, specificity, LR+, DOR, and AUC along with the lowest LR-. While LR results exhibited significant heterogeneity, the SVM results did not show significant heterogeneity across different metrics. However, KNN, RF and EL- models showed lower sensitivity, specificity, DOR, LR + and higher LR-. LR and RF analysis showed wide 95% CI for the LR + and the DOR, reflecting imprecision and suggesting uncertainty in the estimates. Supplemental Tables 5–8 resume the subgroup analysis according to classification algorithms.
Subgroup analysis according to patient preparation
When comparing patient preparation strategies, studies with structured preparation showed slightly higher sensitivity than those with minimal or unspecified preparation, indicating a marginally better ability to detect true positives. However, minimal preparation demonstrated higher specificity, a greater LR+, DOR, and AUC (Supplemental Table 9). This unexpectedly high performance in the minimal preparation group may reflect an overestimation of accuracy due to less controlled testing conditions, rather than a true superiority.
Subgroup analysis according to measurement systems
Accuracy and robustness varied across subgroups. Task-specific ET during reading/cognitive tests showed the weakest performance (AUC 0.48), with wide 95% CI in DOR and marked heterogeneity. Tablet/screen-based systems performed slightly better (AUC 0.61) but also displayed wide 95% CI and high heterogeneity. 3D systems achieved moderate accuracy (AUC 0.80), but their DOR estimates were imprecise with wide 95% CI. Audio-derived estimation showed similar accuracy (AUC 0.84), though interpretation remains limited by reliance on a single dataset and wide 95% CI. Oculomotor tasks demonstrated the highest and most robust accuracy (AUC 0.95), with narrow 95% CI, high DOR, and lower heterogeneity (Supplemental Table 10).
Subgroup analysis according to task performed
VPC and recognition tasks demonstrated moderate sensitivity and specificity and good overall accuracy, making them suited for detecting AD. In contrast, oculomotor and eye movement tasks showed moderate sensitivity, lower specificity, and a low DOR, indicating they are less reliable overall. Picture description or speech-linked ET tasks exhibited lower sensitivity but high specificity, along with moderate LR+, suggesting they are particularly effective for confirming the absence of AD and provide good overall discriminative ability (Supplemental Table 11). Results from reading tasks could not be pooled, as they originated from a single study using one AI tool (Biondi et al.). 10 Biondi et al. found that this task had a high accuracy (Tables 1 and 2).
Subgroup analysis according to data collection
Eye movement and oculomotor features showed moderate sensitivity and specificity with acceptable discriminative ability. Fixation maps and heatmaps perform better, with higher sensitivity and specificity, a higher LR + results, and DOR. Speech, picture description, and cognitive tasks demonstrate lower sensitivity but high specificity, combined with the highest AUC and a good LR+ (Supplemental Table 12).
Meta-regression
The meta-regression showed that the significant sources of heterogeneity in our meta-analysis were population size, patient preparation, measurement systems, AI techniques, and SML algorithms. While SML algorithms and measurement systems contribute to reducing the effect on the outcome (with a RDOR of 0.66 and 2.65 respectively), population size (≥100 AD), patient preparation, and AI techniques contribute to elevating the outcome (with a RDOR of 7.14, 5.14, and 9.06, respectively). However, study origin, year of publication, criteria of AD diagnosis and SML models were not a source of heterogeneity (Supplemental Table 13).
Discussion
Despite the growing interest in AI in the medical field, there are limited studies focusing on AI-based ET in cognitive disorders. To the best of our knowledge, this is the first innovative systematic review and meta-analysis evaluating the performance of AI-driven ET tools for AD detection. However, only one meta-analysis has assessed this tool in patients with dementia, highlighting the robust performance of various ML and DL algorithms, with accuracy, sensitivity, and specificity of 88%, 85%, and 86%, respectively. 18 Our systematic review, including 10 studies, found that most studies reported high accuracy, sensitivity, precision, F1 score, and AUC values near 1, indicating high effectiveness of AI-driven ET tools in distinguishing AD patients from HC. Our meta-analysis of 8 studies showed a moderate to good overall performance of AI-driven ET tools, with a DOR of 10.40 and an AUC of 0.81. The AI-driven ET tool was able to accurately detect 75% of AD cases and exclude 75% of non-AD cases. In practical terms, this indicates that out of 100 patients with mild symptoms, the test would fail to detect approximately 25 cases of AD and would incorrectly classify about 25 patients without AD as having the disease. However, our findings should be interpreted with caution for several reasons. First, all included studies were conducted in hospital-based settings, where cases and controls are typically well-defined. These hospital-based populations are more uniform compared with the general population, which is characterized by a wider variety of symptoms and comorbidities. This discrepancy may have contributed to an overestimation of the pooled diagnostic performance. Second, some results in the subgroup analyses had wide 95% CI, indicating uncertainty that may reduce the performance of the test. Third, the included studies exhibited considerable heterogeneity, with most estimates exceeding 80%. However, it is important to acknowledge that heterogeneity is an unavoidable challenge in meta-analyses. 24 While our results indicated the absence of threshold effect on our meta-analysis heterogeneity, some confounding factors were identified in the meta-regression, including sample size, patient preparation, measurement system, AI techniques, and SML algorithms.
The subgroup analysis showed higher accuracy and low heterogeneity in unprepared patients, likely reflecting overestimation rather than true diagnostic gain. In such cases, the models may have capitalized on artifacts introduced by uncontrolled conditions, rather than learning disease-specific features. In the absence of external validation, several uncontrolled factors may contribute to this apparent gain in accuracy. Variability in head positioning, such as tilts or inconsistent viewing distances, could alter gaze trajectories in a systematic way that artificially enhances class separation. Similarly, the lack of refractive correction may cause blurred or distorted visual input, leading participants to exhibit atypical gaze or response patterns unrelated to the underlying disease. By contrast, strict preparation protocols are designed precisely to reduce technical noise. These procedures ensure uniform alignment, stable viewing distance, and visual clarity, thereby improving data reliability and reproducibility across participants. Although this may reduce apparent accuracy, it provides a more realistic estimate of the true diagnostic capability of AI-driven ET tools, particularly when aiming for deployment in clinical or multi-center settings. Ultimately, the discrepancy between prepared and unprepared conditions underscores the importance of external validation and standardized acquisition protocols.
The subgroup analysis by measurement system suggested that oculomotor tasks and audio-derived eye-movement estimation may represent promising approaches for AI-driven diagnosis of AD. However, performance metrics for each modality were reported in only a single study, with limited methodological detail, and therefore these findings cannot be considered conclusive. Among the remaining ET modalities, 3D systems appeared the most reliable, achieving higher sensitivity and specificity than tablet- or screen-based systems and task-specific ET, with an AUC of 0.80, indicating moderate to good discriminative ability. Nevertheless, although 3D systems and oculomotor tasks demonstrated the most effective performance, the overall evidence remains limited and inconclusive due to wide 95% CI and small study numbers, underscoring the need for further research to validate their reliability and generalizability.
Although VPC tasks show the most consistent effectiveness across studies, highlighting their potential as screening tools, heterogeneity remains high, with wide 95% CI for the DOR. In contrast, oculomotor tasks are less reliable for detecting AD due to moderate sensitivity and low specificity and DOR, whereas picture or speech-linked ET tasks, despite lower sensitivity, demonstrate higher specificity and DOR, making them more effective for confirming the absence of AD. Indeed, image description and Cookie Theft can be influenced by examiner subjectivity and individual differences, affecting consistency. In contrast, 3D VPC uses stereoscopic stimuli, engaging depth perception and spatial reasoning, and has been shown to stimulate richer eye movements and brain activity than 2D tasks. 25 Boujelbane et al. highlighted the VPC task as a reliable alternative to conventional paper-based cognitive assessments. 26 The VPC task is simple, accessible, and culturally neutral, making it suitable for diverse populations and helping to overcome barriers linked to standard cognitive testing. 26 Furthermore, some studies in our meta-analysis used high-frequency eye trackers (Song et al. (2024) 12 and Pereira et al. (2020) 7 ), while others relied on low-frequency static cameras (Li et al. (2024) 16 ), contributing to variability in AI tool accuracy. Raynowska et al. showed that low-frequency and low-resolution ET systems had major drawbacks compared to high-frequency devices, including frequent signal interruptions, poor capture of saccadic main sequence patterns, fewer saccade detections, and greater variability in inter-saccadic intervals, ultimately reducing data reliability. 27 Indeed, future research should explore the potential of AI combined to the EyeLink 1000 Plus, which captures at up to 2000 Hz with exceptional precision. Up to date, this is considered the best ET tool.
Subgroup analysis according to data collection revealed clear differences in diagnostic performance for AD using AI-driven ET tools. Eye movement and oculomotor tasks showed moderate discriminative ability, whereas fixation maps and heatmaps proved more reliable for identifying AD cases and may be especially valuable for screening purposes. In contrast, speech, picture description, and cognitive tasks, with lower sensitivity but higher specificity, appear better suited for confirming the absence of AD rather than initial detection. These results suggest that combining different task types could enhance both detection and confirmation. However, study heterogeneity, wide 95% CI, and small sample sizes highlight the need for further comparative research.
Conversely, some uncertainty in our findings may arise from studies with a high risk of bias. In our meta-analysis, two studies were judged to have a high risk of bias and one had some concerns, primarily due to non-random or selective recruitment methods and bias of flow and timing. Thus, clear reporting and careful selection of training datasets are essential to ensure that AI-based tools for AD detection are beneficial across diverse healthcare systems. The characteristics of the training dataset, including factors like healthcare setting, cognitive profile, age, education level, gender, and race, should be documented.
Subgroup analysis by AI technique indicated that DL appeared to perform better than SML, achieving notably higher sensitivity, specificity, and DOR with insignificant heterogeneity. However, this result should be interpreted with caution, taking into account differences in participant qualifications, AD diagnostic criteria, and the ET tasks and systems used across studies. Similarly to our results, Ding et al. reported that DL models- based on speech analysis dominate in AD detection, outperforming traditional ML approaches. 28 Indeed, these findings could be due to the different algorithms used by SML and DL. ML relies on manually engineered features such as fixation duration and saccade patterns. 29 While effective, this approach may miss subtle and complex patterns inherent in ET data. 29 However, DL automatically extracts features from raw data like heatmaps or numeric data, capturing intricate temporal and spatial patterns. DL is considered the most widely used diagnostic method due to its capacity to manage complex decision-making processes. 30 Likewise, it was identified to surpass ML in detecting AD and dementia based on brain imaging methods.31,32
In our meta-analysis, two studies used CNNs, one of which also employed DSAE, while another study used DSAE alone. These autoencoder introduce a sparsity constraint on the hidden units during training, encouraging the model to learn more efficient representations. 29 Denoising autoencoder trained to reconstruct the original input from a corrupted version, enhancing the model's robustness to noise. 29 Given the limited number of studies investigating DL in ET-based AD detection, there is a clear need to encourage further research in this area. However, it is important to note that the small sample size of included studies can cause overfitting, particularly in AI algorithms of greater complexity such as DL. 29 Overfitting occurs when the algorithm memorizes the training data and could not adapt to newer cases. 29 DL excels in handling large, complex datasets and capturing intricate patterns, leading to higher accuracy in predictions. 29 The choice between ML and DL depends on the specific requirements of the application, including data availability, computational resources, and the need for model interpretability. Figure 5 illustrates a comparison between SML and DL technique, for diagnosing AD based on ET data.
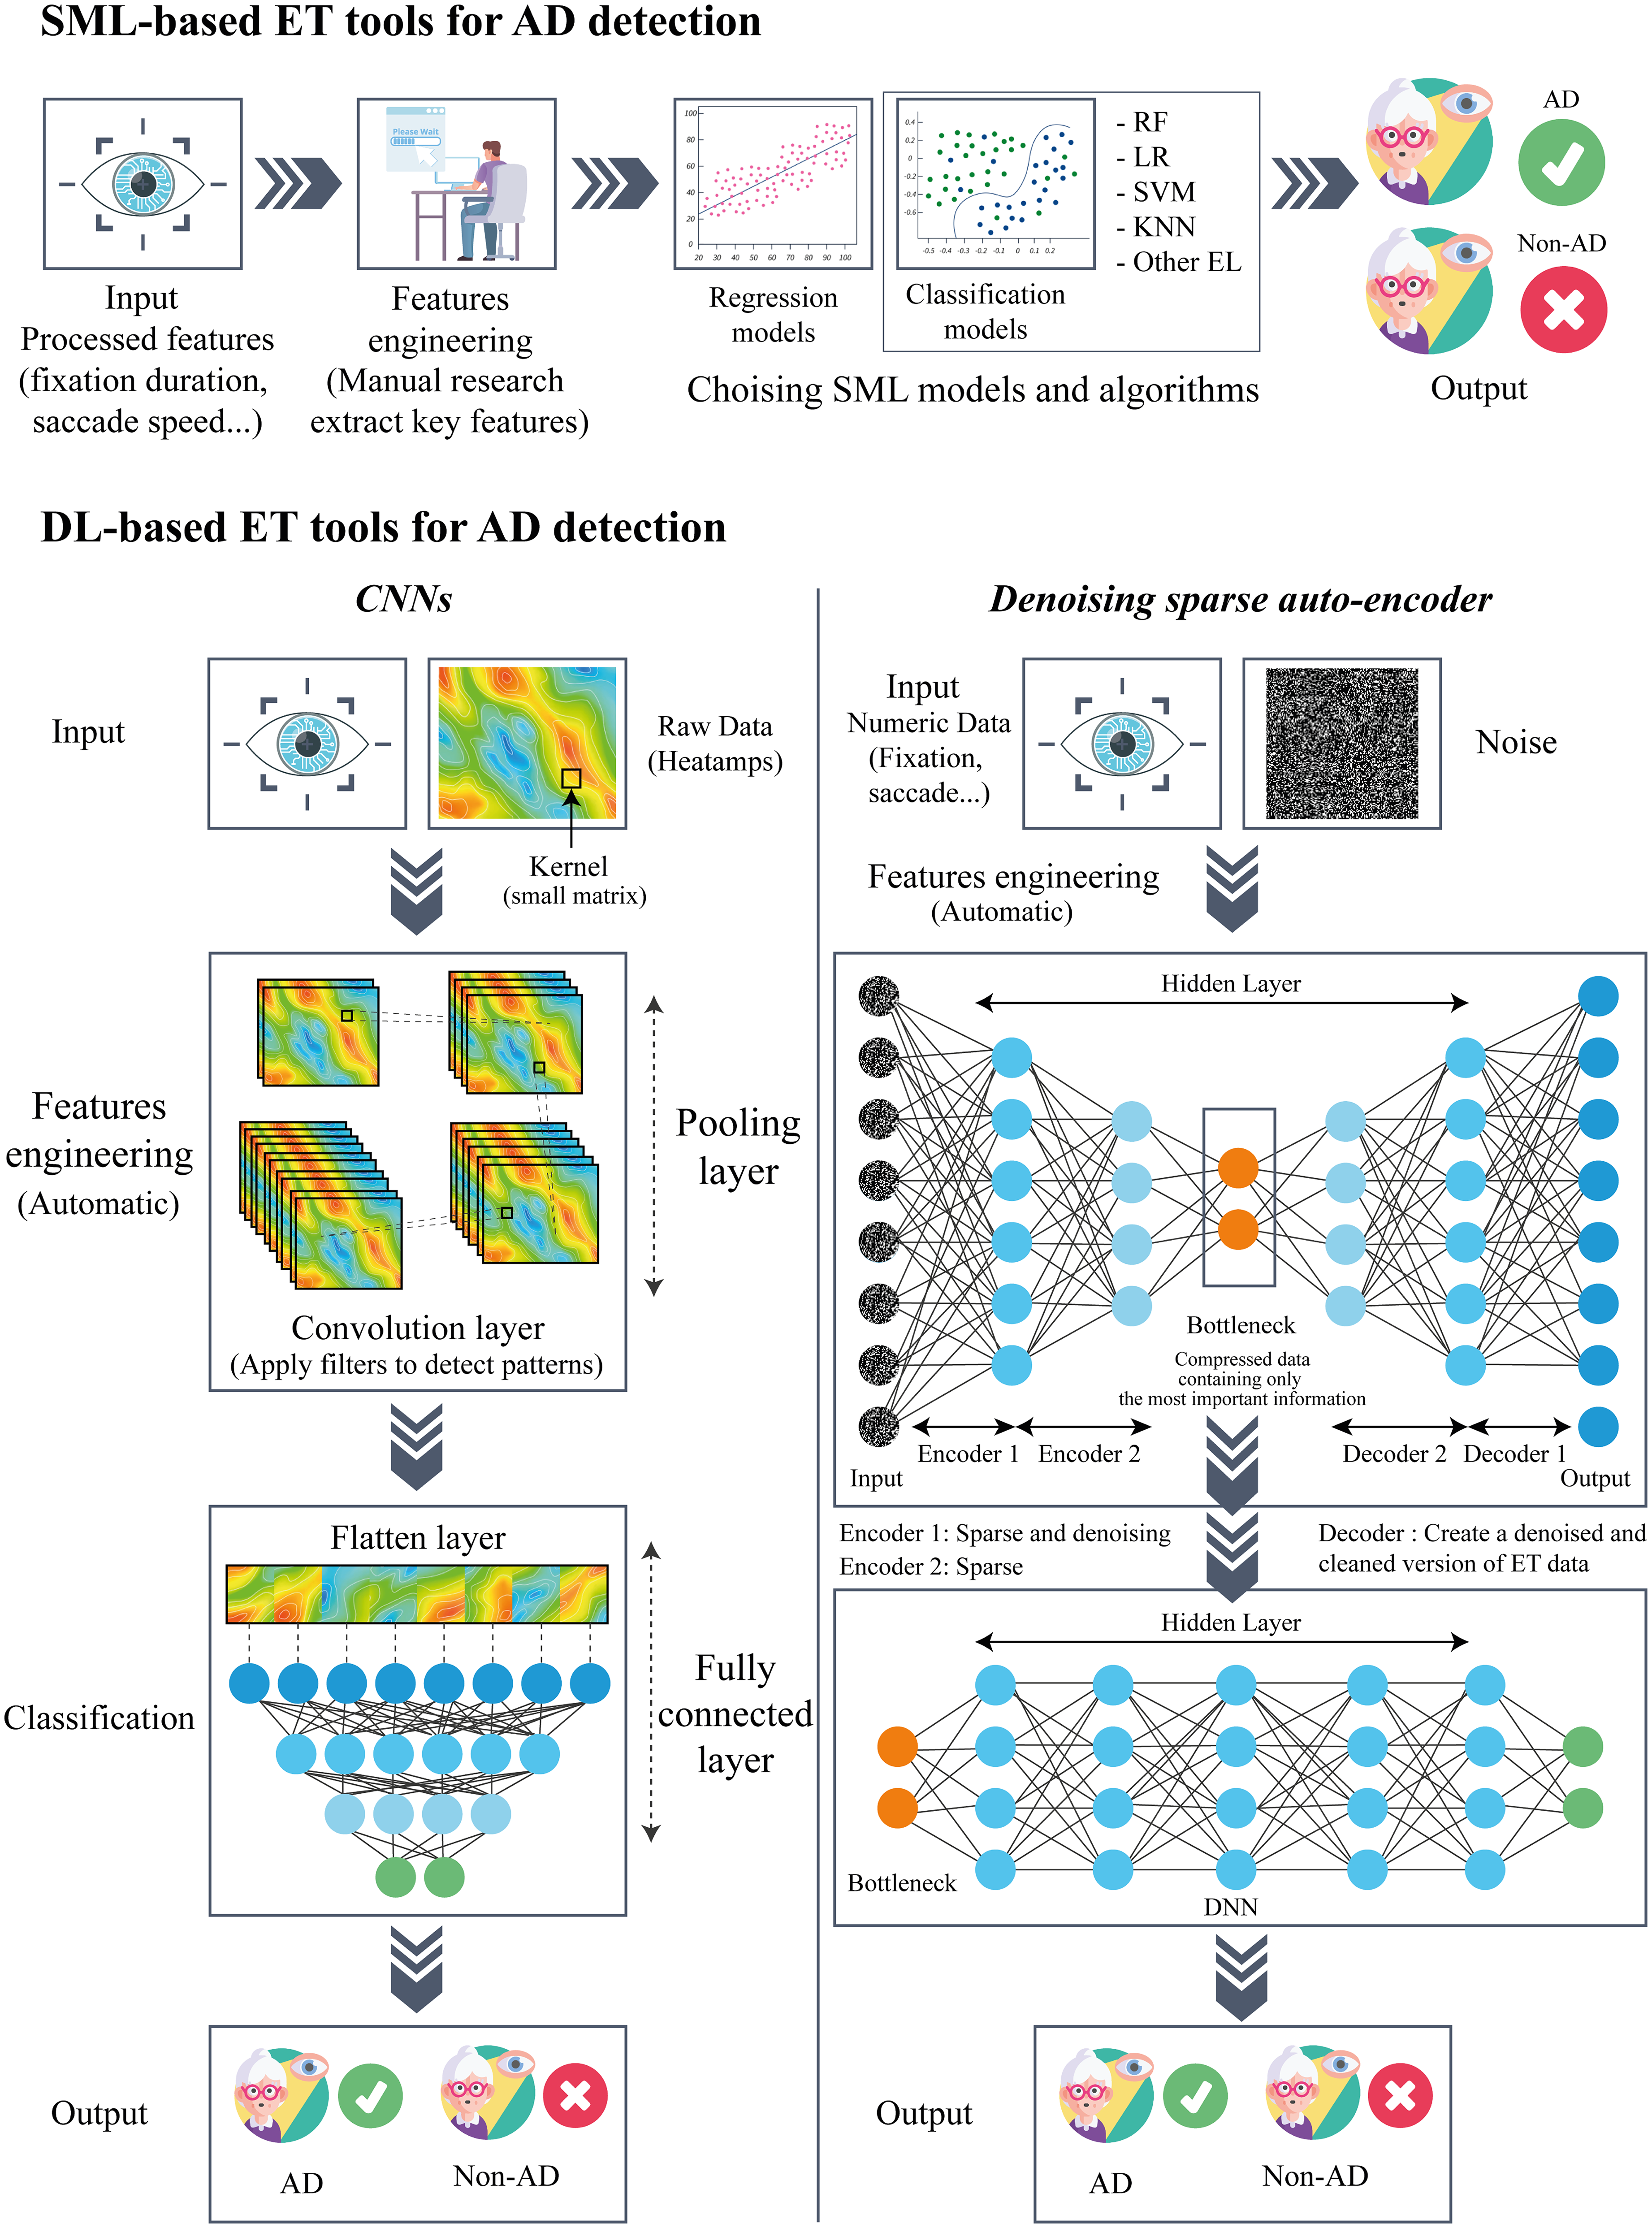
Comparison between SML and DL for ET-based AD diagnosis.
Our analysis revealed that among the classification algorithms, DTC, SVM, and LR demonstrated moderate to good diagnostic performance for AD detection. However, DTC and LR exhibited high heterogeneity and wide CI, indicating variable and less precise estimates. Despite variations in ET tasks, AD diagnostic criteria, and study populations, the SVM models consistently demonstrated moderate to good performance with minimal heterogeneity. This can suggest their potential as a reliable tool for AD detection across diverse settings. Consistent with our findings, Kaczorowska et al. reported that LR and SVM had the best performance in classifying cognitive workload levels based on ET data, achieving accuracy rates of 0.95 ± 0.05, and 0.94 ± 0.05, respectively. 33 In a systematic review including studies on classification (cognitive states, intentions, actions, or events) using ET technology, it was found that SVM substantially shows a better performance in ET classification compared to other classifiers. 34 SVM are particularly effective in early AD detection when the feature space is clear and well-defined. 35 This effectiveness stems from SVMs’ ability to identify optimal hyperplanes that separate data into distinct classes, making them suitable for early studies in detecting AD. 35
Clinical implication of AI-driven ET tools for AD detection
In contrast to conventional diagnostic methods, which typically rely on subjective clinical assessments or invasive neuroimaging that may not be suitable for routine screenings, AI-driven ET tools is a personalized monitoring, non-invasive, moderately cost-effective, providing rapid, objective measures of visual attention and cognitive function, which can be useful for early detection. Moreover, AI-driven ET technology can be implemented using widely available devices, including smartphones, making it more accessible for widespread screening. Early identification through routine screenings would allow for early intervention, which is critical in slowing the progression of AD and improving patient outcomes. Although our meta-analysis indicates that DL integrated with high-frequency and high-resolution ET tools may offer the highest accuracy and performance for AD detection, further studies with larger datasets are needed. However, comparative studies with other non-invasive techniques are warranted in the future to establish which tool provides the greatest benefit for patient. In fact, while ET tools offer several advantages, their use requires specialized equipment and standardized tasks, which may limit broad implementation. Additionally, results can be affected by participant factors such as fatigue, visual impairments, or poor calibration, potentially reducing accuracy. Speech analysis is also non-invasive and can be conducted remotely with low cost, making it highly accessible. It effectively captures AD in early stage through linguistic and vocal features, though its accuracy can be influenced by language, education, and cultural factors. Blood biomarkers, as a minimally invasive approach, can identify AD at early or even preclinical stages. Yet, they require laboratory infrastructure, and are more expensive, which may restrict their use in some clinical settings. For the accuracy of these tools combined to AI, according to a recent narrative review, speech analysis models achieved 69.60–97.2% accuracy. 28 Serum metabolomics is especially promising; a 14-metabolite panel with SML algorithms reached 100% accuracy in the discovery cohort and 97% in validation. 36 Combining blood metabolites with DL, XGBoost, and random forest models yielded AUCs of 0.85–0.88. 37 Overall, while blood biomarkers are most accurate and biologically grounded, ET and speech analysis offer more practical and scalable, particularly for initial screening.
Limit of the study
Our study presents some limitations that could be addressed in future meta-analyses. Although our search encompassed a wide range of datasets and grey literature, we identified only a limited number of studies addressing the issue. Some of our pooled estimates exhibited substantial heterogeneity, notably I² > 80%, which may limit the robustness and generalizability of our findings. Although subgroup analyses were performed to explore potential sources, residual heterogeneity persisted, warranting cautious interpretation of the results. While most metrics exhibited narrow 95% CI, indicating good precision, certain estimates in the subgroup analyses displayed extremely wide intervals, reflecting considerable statistical uncertainty. These results should be interpreted with caution, as they may lead to over-interpretation and potential over-estimation of the AI performance. All included studies were hospital-based, retrospective, and involved relatively small sample sizes. Thus, results could be biased toward patients who are sicker or have more severe conditions, limiting their applicability to broader groups.
Retrospective data may have drawbacks related to data quality and availability, as well as recall bias. Small sample size might decrease the reliability of model performance. Additionally, all the studies included in our analysis relied on internal validation, which may limit the generalizability of the results. Indeed, the absence of data on confounding factors such as education level, age, and comorbidities may impact the robustness of the results. Variability in eye movement patterns related to age, comorbidities, and cultural differences should also be considered.
Conclusion
Based on this exploratory meta-analysis including hospital-based and case-controls studies, we cautiously conclude that AI-driven ET tools appear to have moderate to good accuracy in detecting AD. DL appears to outperform traditional SML approaches. Within SML models, regression methods tend to perform better than classification methods, with SVM seems to be the most effective classification algorithm. Factors such as patient preparation, measurement methods, task type, and data collection procedures likely influence model performance, highlighting the need to consider these elements when interpreting diagnostic accuracy. Therefore, future studies should adopt standardized protocols, include participants from the general population, and conduct external validation. Transparent reporting is also essential to enhance the accuracy and reliability of AI-based ET tools for AD detection.
Supplemental Material
sj-docx-1-alz-10.1177_13872877251389145 - Supplemental material for Artificial intelligence-driven eye tracker models for Alzheimer's disease diagnosis: A systematic review and meta-analysis
Supplemental material, sj-docx-1-alz-10.1177_13872877251389145 for Artificial intelligence-driven eye tracker models for Alzheimer's disease diagnosis: A systematic review and meta-analysis by Imen Ketata and Emna Ellouz in Journal of Alzheimer's Disease
Footnotes
Acknowledgements
The authors have no acknowledgments to report.
Ethical considerations
The protocol was registered in PROSPERO (CRD420251020284).
Consent to participate
Not applicable.
Consent for publication
Not applicable.
Author contribution(s)
Funding
The authors received no financial support for the research, authorship, and/or publication of this article.
Declaration of conflicting interests
The authors declared no potential conflicts of interest with respect to the research, authorship, and/or publication of this article.
Data availability statement
The datasets analyzed during the current study are available from the corresponding author on reasonable request.
Supplemental material
Supplemental material for this article is available online.
References
Supplementary Material
Please find the following supplemental material available below.
For Open Access articles published under a Creative Commons License, all supplemental material carries the same license as the article it is associated with.
For non-Open Access articles published, all supplemental material carries a non-exclusive license, and permission requests for re-use of supplemental material or any part of supplemental material shall be sent directly to the copyright owner as specified in the copyright notice associated with the article.