
Abstract
Background
Alzheimer's disease (AD) involves interactions among genetic, environmental, and lifestyle factors, yet the contribution of environmental exposures to cognitive decline and biomarker changes remains unclear. Detoxification genes such as EPHX1 may influence susceptibility to environmental neurotoxicants.
Objective
To evaluate associations between environmental risk, cognitive outcomes, and AD biomarkers, and to examine potential contributions of detoxification genes.
Methods
We analyzed 5101 participants from the Alzheimer's Disease Neuroimaging Initiative (ADNI) across four study phases. Environmental exposure was summarized using a composite Environmental Risk Score (ERS) derived from Rural–Urban Continuum Codes, Rural–Urban Commuting Area codes, Risk-Screening Environmental Indicators, and occupational exposure. Cognitive outcomes included Mini-Mental State Examination, Clinical Dementia Rating, Montreal Cognitive Assessment, Neuropsychological Test Battery, Alzheimer's Disease Assessment Scale–Cognitive Subscale (ADAS-Cog), and Executive Dysfunction Cognitive Assessment. Biomarkers included PET amyloid/tau, MRI hippocampal volume, and cerebrospinal fluid amyloid-β, tau, and neurofilament light chain. Multivariable regression models adjusted for sociodemographic factors and APOE ε4 carrier status.
Results
ERS was significantly associated with CDR (β = −1.13E−07; 95% CI −1.98E−07, −2.75E−08; p = 0.00956) but not with other cognitive measures. EPHX1 showed a significant main effect on ADAS-Cog (β = 0.479; 95% CI 0.0305, 0.927; p = 0.0356). ERS × gene interaction terms were not significant. ERS was not associated with amyloid PET SUVR.
Conclusions
Environmental risk showed limited associations with AD-related outcomes, while EPHX1 demonstrated a significant main effect on cognitive performance. Longitudinal studies are needed to clarify mechanisms linking environmental exposure and AD.
Keywords
Introduction
Alzheimer's disease (AD) is a leading cause of dementia, affecting over 55 million people globally, with projections nearing 150 million by 2050. 1 It accounts for 60–80% of dementia cases and imposes substantial economic and societal burdens. 2 Women are disproportionately affected, comprising 68% of AD-related deaths. 3 Despite major research advances, AD remains incurable, highlighting the urgency to identify modifiable risk factors. 4
Risk factors for Alzheimer's disease
AD arises from a complex interplay of genetic, environmental, and lifestyle factors. 5 Age is the most significant risk factor. 6 The APOE4 allele is the most established genetic predictor of late-onset AD. 7 Emerging evidence demonstrates that additional factors such as diet, physical activity, metabolic dysfunction (including insulin resistance), liver disease, and early-life exposures contribute meaningfully to disease heterogeneity and may partially explain the modest effect sizes observed in environmental analyses. 7 Environmental exposures, including air pollution, heavy metals, pesticides, and industrial chemicals, are implicated in neurodegeneration via oxidative stress, mitochondrial dysfunction, and neuroinflammation.8,9 Detoxification genes such as EPHX1 and CYP1A1 metabolize environmental neurotoxicants like polycyclic aromatic hydrocarbons, which are prevalent in pollution.10,11 Socioeconomic determinants such as education, income, and healthcare access also influence AD risk.12,13
Environmental contributions to disease progression
Environmental pollutants contribute significantly to AD progression. Chronic exposure to airborne toxins such as PM2.5, ozone (O3), and nitrogen oxides (NOx) is associated with cognitive decline and neuroinflammation.14,15 Heavy metals like lead (Pb), mercury (Hg), and cadmium (Cd) induce oxidative stress and inflammation, promoting neuronal damage. 16 Pesticides, including organophosphates and organochlorines, and industrial chemicals like PCBs, benzene, and toluene, are also linked to neurodegeneration.17,18 Polycyclic aromatic hydrocarbons further exacerbate cognitive decline through oxidative and inflammatory pathways. 19 However, many environmental toxicants such as cyanobacterial neurotoxins, waterborne contaminants, and mycotoxins are not captured within the available Alzheimer's Disease Neuroimaging Initiative (ADNI) dataset and therefore could not be included in the present analysis.
Genetic susceptibility and biomarker associations
Genetic factors contribute to variability in AD risk and progression. In addition to established risk loci such as APOE, genes involved in detoxification and xenobiotic metabolism may influence biological responses to environmental toxicants. Detoxification enzymes encoded by GSTM1 and GSTT1 are involved in the metabolism of environmental pollutants and cellular defense against oxidative stress, and variants in these pathways have been associated with inflammatory responses, oxidative damage, and processes linked to amyloid accumulation and neurodegeneration.20–22
Treatments for Alzheimer's disease
Current treatments aim to manage symptoms and slow disease progression. Cholinesterase inhibitors and memantine address cognitive and behavioral symptoms, while newly approved monoclonal antibodies (e.g., aducanumab and lecanemab) target amyloid pathology.23,24 These therapies vary in efficacy and carry specific risks, underscoring the importance of preventive research on modifiable exposures.
Study rationale and objectives
Despite recognition of environmental contributions, critical uncertainties remain regarding how environmental exposures are quantified, how such exposures relate to specific cognitive and biomarker outcomes, and whether detoxification genes meaningfully alter these relationships. To address these questions, we defined the Environmental Risk Score (ERS) and specified statistical models to evaluate ERS main effects and exploratory ERS × gene terms. This study investigates the association between environmental exposure and cognitive and biomarker outcomes in AD while also examining detoxification-related genes as candidate genetic contributors to these relationships. We hypothesized that higher environmental risk would be associated with poorer cognitive performance and greater amyloid burden.
Methods
Study design and data source
This retrospective observational study used publicly available data from the ADNI, a multicenter longitudinal study designed to evaluate clinical, imaging, genetic, biomarker, and related factors associated with cognitive aging and AD. Data were obtained through the ADNI repository and analyzed in accordance with the ADNI Data Use Agreement. The present analysis incorporated data from four ADNI phases, including ADNI-1, ADNI-GO, ADNI-2, and ADNI-3. Standardized harmonization procedures were used to align cognitive, biomarker, genetic, sociodemographic, and environmental variables across study phases.
Ethical considerations
All data used in this study were de-identified prior to access. This secondary analysis was reviewed and approved by the Juniata College Institutional Review Board (Protocol #IRB 32–2024) and was designated exempt because it used publicly available, de-identified data. Written informed consent for original data collection was obtained by ADNI investigators at participating sites.
Study population
A total of 5101 participants were included in the analytic dataset. Participants were classified according to ADNI diagnostic criteria as cognitively normal, mild cognitive impairment, or AD. Individuals were included if they had at least one available baseline cognitive measure, residential information required for geographic exposure classification, APOE genotype information, and sufficient environmental and genetic data to construct the ERS and evaluate detoxification-gene effects.
Participants were excluded from specific analyses if key geographic variables were missing, relevant detoxification-gene data were unavailable, or required positron emission tomography (PET) or cerebrospinal fluid (CSF) biomarker data were absent for the corresponding outcome models. For cognitive outcomes, the earliest available baseline timepoint was used to reduce variability attributable to disease progression. For biomarker outcomes, values were averaged across all available timepoints to better reflect longer-term biological burden and reduce measurement noise.
Cognitive and clinical assessments
Cognitive and clinical outcomes included the Mini-Mental State Examination (MMSE), Clinical Dementia Rating (CDR), Montreal Cognitive Assessment (MoCA), Neuropsychological Test Battery (NTB), Alzheimer's Disease Assessment Scale–Cognitive Subscale (ADAS-Cog), and Executive Dysfunction Cognitive Assessment (ED-Cog). All cognitive variables were obtained directly from the ADNI dataset as raw, untransformed values.
Higher MMSE, MoCA, and NTB scores indicated better cognitive functioning, whereas higher ADAS-Cog, CDR, and ED-Cog scores indicated greater impairment. Cognitive measures were drawn from the baseline visit to maintain temporal alignment with baseline environmental exposure classification. Additional details for each cognitive and clinical measure, including the domain assessed, score interpretation, and ADNI source variable, are provided in Supplemental Table 1.
Imaging and biomarker measures
Imaging biomarkers included magnetic resonance imaging (MRI)-derived hippocampal volume and PET standardized uptake value ratios (SUVRs) for amyloid and tau. CSF biomarkers included amyloid-β (Aβ42), total tau, and neurofilament light chain (NFL). MRI hippocampal volumes were obtained from ADNI-processed imaging datasets generated using standardized ADNI MRI acquisition and preprocessing procedures. PET SUVR values were obtained from ADNI-processed PET datasets using standardized reference-region normalization procedures implemented by the ADNI PET Core. CSF biomarker values were obtained from ADNI assay datasets generated using validated biomarker protocols.
Detailed descriptions of the ADNI imaging acquisition, preprocessing pipelines, and biomarker assay procedures have been published previously in ADNI core methods publications.25–27 For participants with multiple biomarker timepoints, values were averaged across available observations to account for temporal variability and to better represent longer-term pathological burden.
Environmental exposure and geographic risk assessment
Environmental exposure was operationalized using a composite ERS derived from four indicators available through the linked dataset: Rural–Urban Continuum Codes (RUCC), Rural–Urban Commuting Area codes (RUCA), Risk-Screening Environmental Indicators (RSEI), and occupational exposure status.
RUCC and RUCA were included as ordinal indicators of rurality, urbanization, and commuting context. RSEI was included as a continuous indicator of potential environmental toxicant burden based on geographic linkage. Occupational exposure was coded as a binary variable reflecting reported routine engagement in work environments involving industrial, chemical, or hazardous materials.
The ERS was calculated as an unweighted additive composite:
This unweighted additive approach was selected to summarize cumulative environmental burden across multiple exposure domains represented in the available data. No differential weighting was applied because no validated dataset-specific weighting framework was available a priori to justify assigning greater importance to one component over another. Because the ERS combines variables on different numeric scales, particularly the larger magnitude of RSEI relative to the ordinal and binary indicators, the resulting continuous ERS is also on a large numeric scale. Accordingly, regression coefficients for ERS represent the expected change in outcome per one-unit increase in the composite score and may therefore appear numerically small.
For descriptive analyses only, participants were additionally classified into low, medium, and high ERS groups using tertile-based thresholds derived from the ERS distribution. Because the ERS distribution contained a substantial proportion of zero values, participants with ERS = 0 were classified as the low-exposure group. Among participants with nonzero ERS values, the distribution was divided into approximately equal tertiles using the 33rd and 66th percentiles to define the medium- and high-exposure groups. The resulting threshold separating the medium- and high-exposure categories corresponded to an ERS value of 359,112.8. Tertile-based categorization was used to create balanced descriptive groups and to facilitate comparison of participant characteristics across exposure strata. These ERS categories were used solely for descriptive summaries and unadjusted group comparisons. In all covariate-adjusted regression analyses, ERS was modeled as a continuous predictor.
Descriptive statistics for each ERS component and for the total ERS are provided in Supplemental Table 2.
Genetic data and detoxification-gene variables
Genetic data included APOE and selected detoxification-related polymorphisms. Detoxification genes evaluated in this study included EPHX1, GSTM1, GSTT1, CYP1A1, and MTATP6P1, which were selected based on their relevance to xenobiotic metabolism, oxidative stress pathways, and potential susceptibility to environmental toxicants. Single nucleotide polymorphisms were annotated using the Ensembl Variant Effect Predictor. Detoxification-related variants were coded as binary indicators representing the presence or absence of the putative risk allele or gene deletion.
APOE was operationalized as ε4 carrier status (carrier versus non-carrier) and was included as a covariate in all covariate-adjusted regression models. Interaction terms were constructed by multiplying the continuous ERS by each detoxification-gene variable to evaluate potential modification of environmental effects.
Sociodemographic and clinical covariates
Social and demographic variables included age, sex/gender, race/ethnicity, marital status, education, home type, and family history of AD. Medical and psychiatric history variables were included as broad categories. Income and employment variables were reviewed during data preparation but were excluded from final adjusted models because of substantial missingness and concerns regarding model stability.
Statistical analysis
All statistical analyses were conducted in R version 4.3.2. Descriptive statistics were used to summarize participant characteristics across low, medium, and high ERS groups. Unadjusted comparisons across ERS categories were performed for descriptive purposes only and are presented to characterize the sample rather than to serve as the basis for primary inference.
Primary inference regarding associations between environmental exposure and cognitive or biomarker outcomes was based on covariate-adjusted multivariable regression models. In all adjusted regression analyses, ERS was entered as a continuous predictor. Multivariable linear regression models were used to examine associations between ERS and cognitive or biomarker outcomes while adjusting for age, sex/gender, race/ethnicity, education, and APOE ε4 carrier status.
To evaluate potential effect modification by detoxification genes, interaction models were constructed by adding ERS × gene interaction terms to the adjusted regression framework. These interaction models were adjusted for the same covariates as the primary regression models, including APOE ε4 carrier status. For presentation purposes, tables reporting gene analyses display the focal coefficients for ERS, detoxification-gene main effects, ERS × gene interaction terms, and selected covariates included in the adjusted models.
Regression coefficients, 95% confidence intervals, and p values were reported. Statistical significance was defined as p < 0.05. Because multiple outcomes and models were examined and no formal correction for multiple comparisons was applied, findings should be interpreted with appropriate caution.
Results
Descriptive characteristics and unadjusted comparisons across environmental risk groups
A total of 5101 participants were categorized into low (n = 4701), medium (n = 133), and high (n = 267) environmental exposure groups based on ERS categories. Table 1 summarizes participant characteristics and unadjusted comparisons across these groups. These analyses are presented for descriptive purposes; primary inferential results are reported from covariate-adjusted regression models in the subsections below.
Association of study characteristics among exposure level groups.
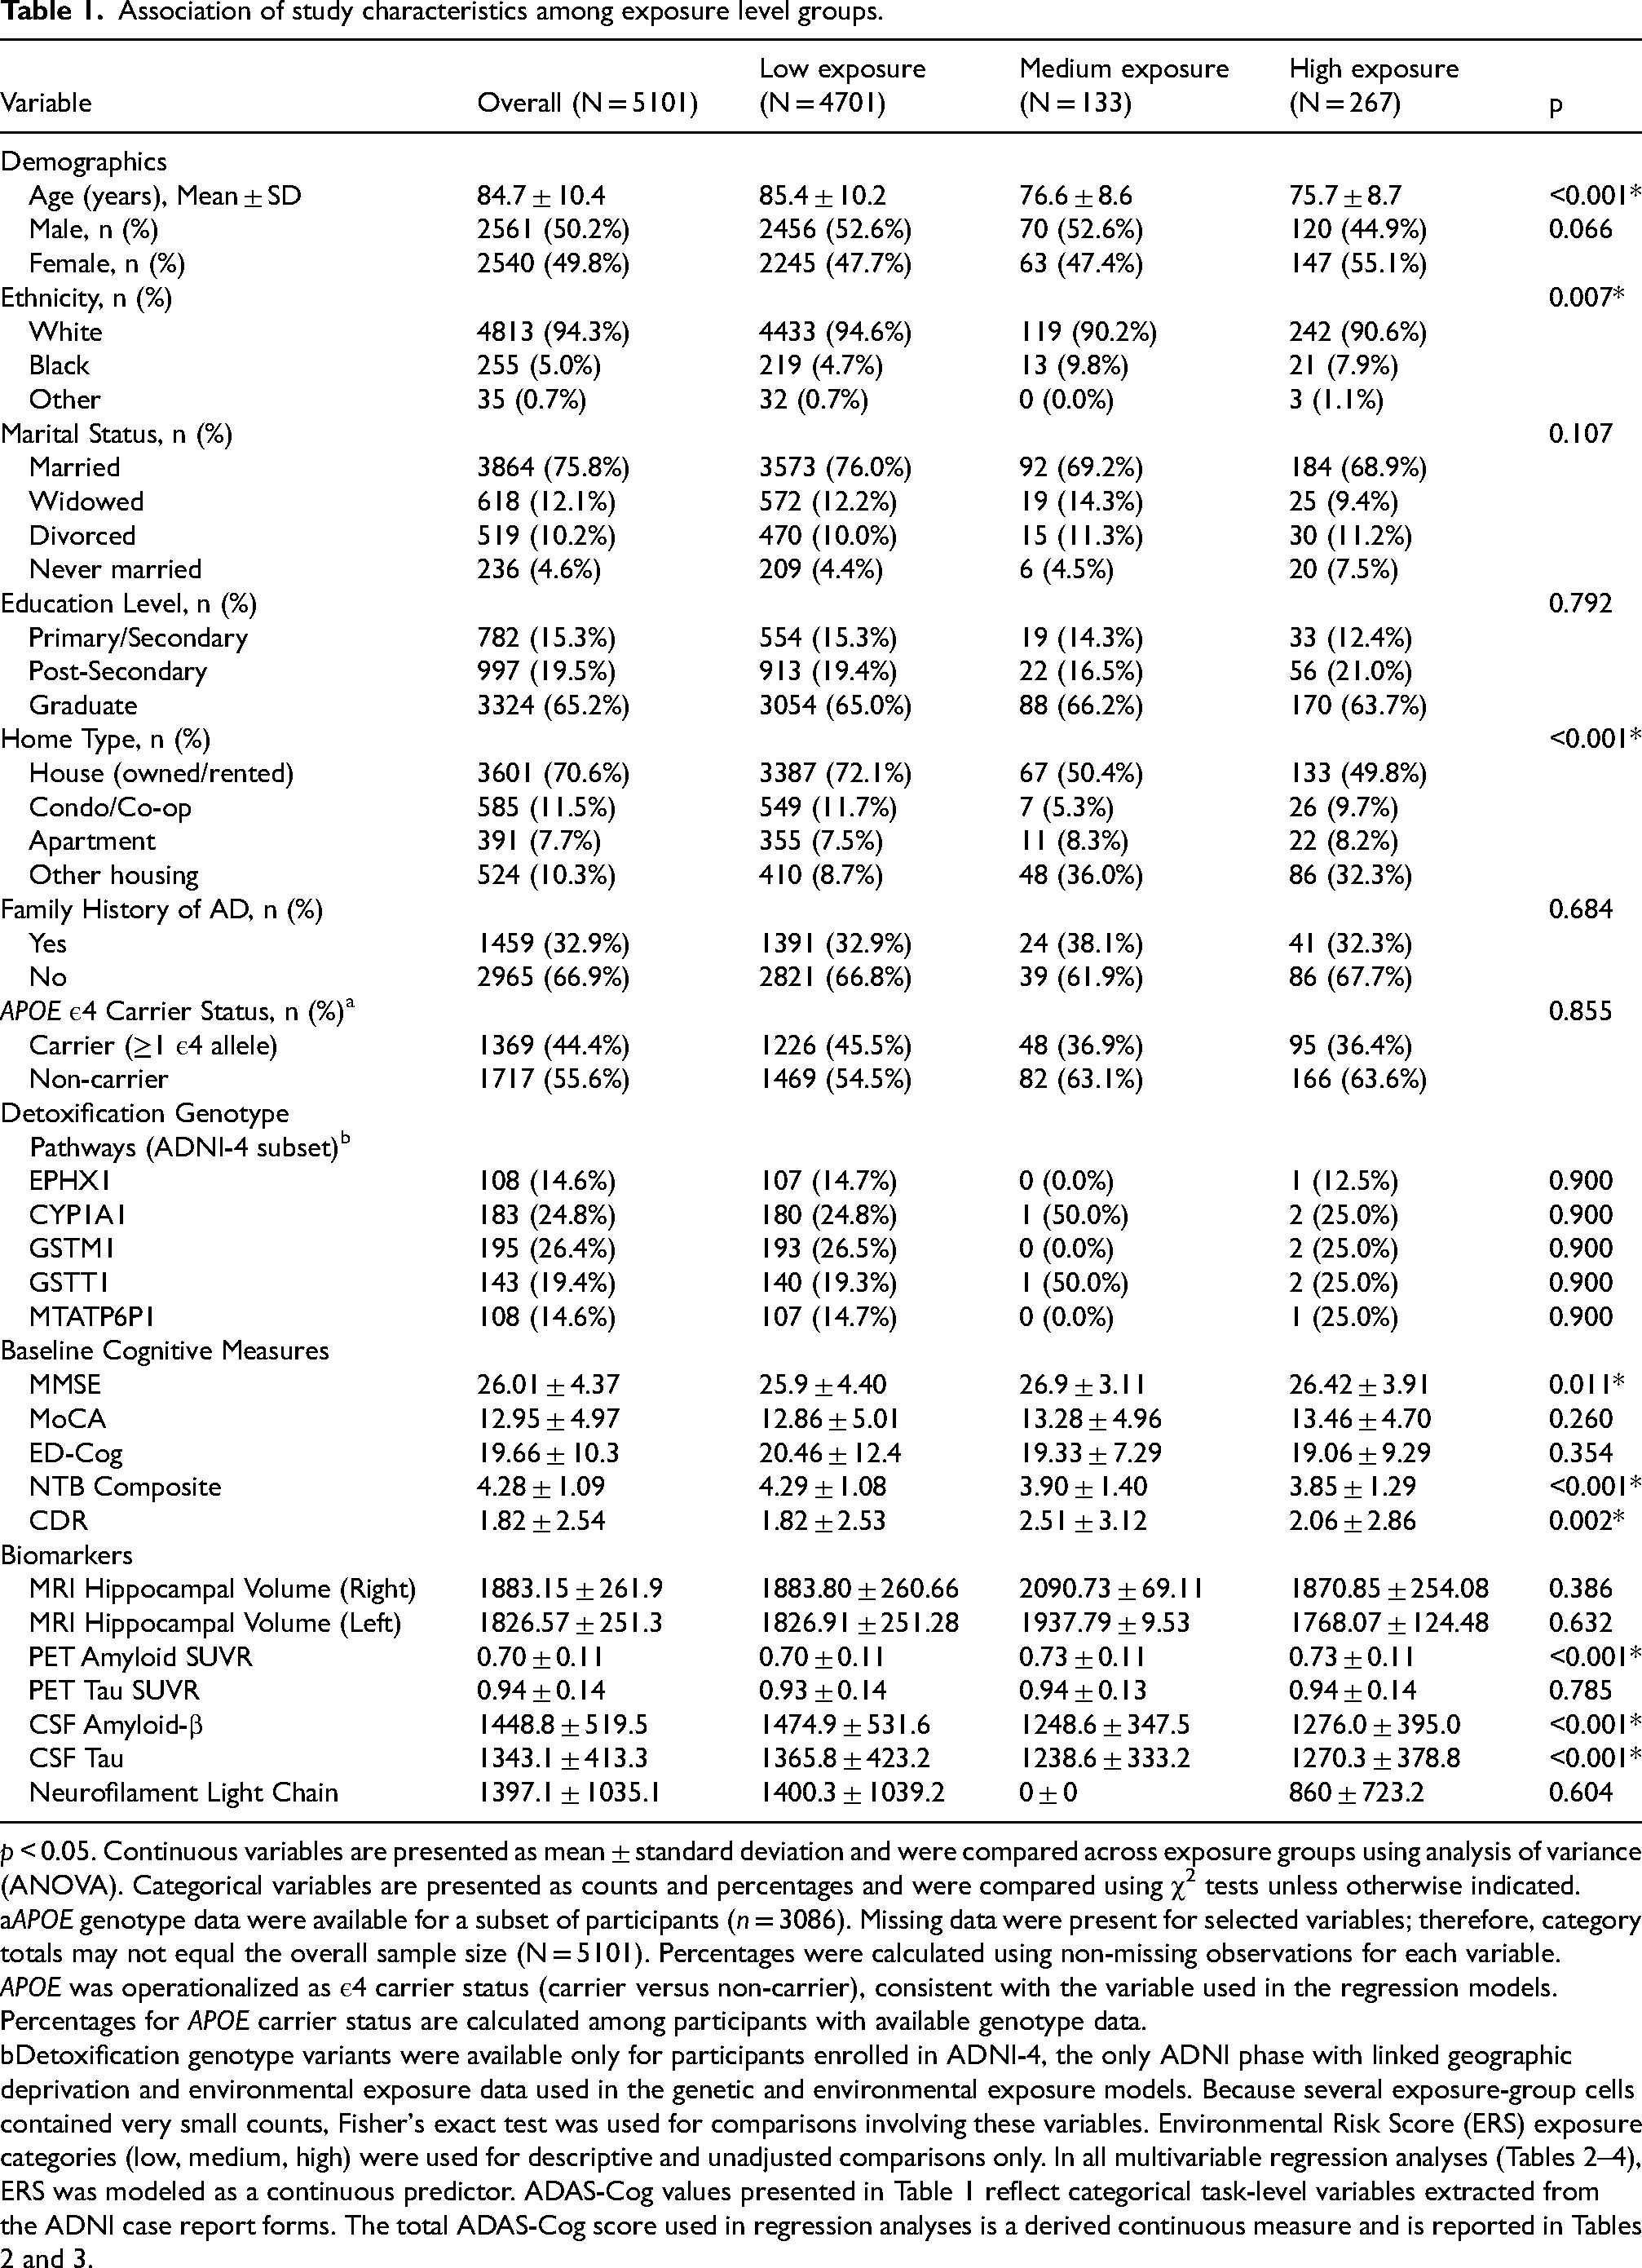
p < 0.05. Continuous variables are presented as mean ± standard deviation and were compared across exposure groups using analysis of variance (ANOVA). Categorical variables are presented as counts and percentages and were compared using χ2 tests unless otherwise indicated.
APOE genotype data were available for a subset of participants (n = 3086). Missing data were present for selected variables; therefore, category totals may not equal the overall sample size (N = 5101). Percentages were calculated using non-missing observations for each variable.
APOE was operationalized as ε4 carrier status (carrier versus non-carrier), consistent with the variable used in the regression models. Percentages for APOE carrier status are calculated among participants with available genotype data.
Detoxification genotype variants were available only for participants enrolled in ADNI-4, the only ADNI phase with linked geographic deprivation and environmental exposure data used in the genetic and environmental exposure models. Because several exposure-group cells contained very small counts, Fisher's exact test was used for comparisons involving these variables. Environmental Risk Score (ERS) exposure categories (low, medium, high) were used for descriptive and unadjusted comparisons only. In all multivariable regression analyses (Tables 2–4), ERS was modeled as a continuous predictor. ADAS-Cog values presented in Table 1 reflect categorical task-level variables extracted from the ADNI case report forms. The total ADAS-Cog score used in regression analyses is a derived continuous measure and is reported in Tables 2 and 3.
In unadjusted descriptive comparisons, significant differences were observed in age (p < 0.001), ethnicity (p = 0.007), and home type (p < 0.001). Participants in the low-exposure group were older and more likely to reside in single-family homes. No significant differences were observed in gender, education, family history of AD, comorbidities, or adverse events (Table 1).
The environmental variables used to construct the ERS differed significantly across exposure groups. RSEI, RUCC, and RUCA each varied by exposure category (all p < 0.001), and total ERS values were highest in the high-exposure group. Occupational exposure did not differ significantly across groups (p = 0.106) (Table 1).
Genetic characteristics did not differ meaningfully across ERS groups in unadjusted comparisons, including APOE ε4 carrier status and the evaluated detoxification-related variants (Table 1).
Unadjusted cognitive comparisons identified group differences for several measures. MMSE scores differed across groups (p = 0.011), with the medium-exposure group showing the highest mean MMSE (26.9 ± 3.11) compared with the low- (25.9 ± 4.40) and high-exposure groups (26.42 ± 3.91). CDR scores also differed (p = 0.002), with higher mean CDR values in the medium- (2.51 ± 3.12) and high-exposure groups (2.06 ± 2.86) than in the low-exposure group (1.82 ± 2.53). NTB scores were lower in the medium- (3.90 ± 1.40) and high-exposure groups (3.85 ± 1.29) than in the low-exposure group (4.29 ± 1.08; p < 0.001). ED-Cog and MoCA did not differ significantly across exposure groups in unadjusted analyses (p = 0.354 and p = 0.260, respectively).
Unadjusted biomarker comparisons identified differences in selected measures across exposure groups. PET amyloid SUVR, CSF Aβ, and CSF tau differed across exposure categories (all p < 0.001). MRI hippocampal atrophy (left and right), PET tau SUVR, and NFL did not differ significantly across groups (all p > 0.05).
Covariate-adjusted associations between environmental risk and cognitive outcomes
Covariate-adjusted regression models for cognitive outcomes are presented in Table 2. ERS was significantly associated with CDR (β = −1.13E−07; 95% CI, −1.98E−07 to −2.75E−08; p = 0.00956). ERS was not significantly associated with MMSE (β = 8.84E−08; 95% CI, −4.36E−08 to 2.20E−07; p = 0.189), ADAS-Cog (β = −3.47E−08; 95% CI, −3.98E−07 to 3.28E−07; p = 0.851), ED-Cog (β = 4.53E−08; 95% CI, −2.79E−07 to 3.69E−07; p = 0.783), MoCA (β = −4.78E−08; 95% CI, −2.39E−07 to 1.43E−07; p = 0.624), or NTB (β = −1.81E−08; 95% CI, −5.67E−08 to 2.04E−08; p = 0.356).
Covariate-adjusted associations between environmental risk and cognitive outcomes.
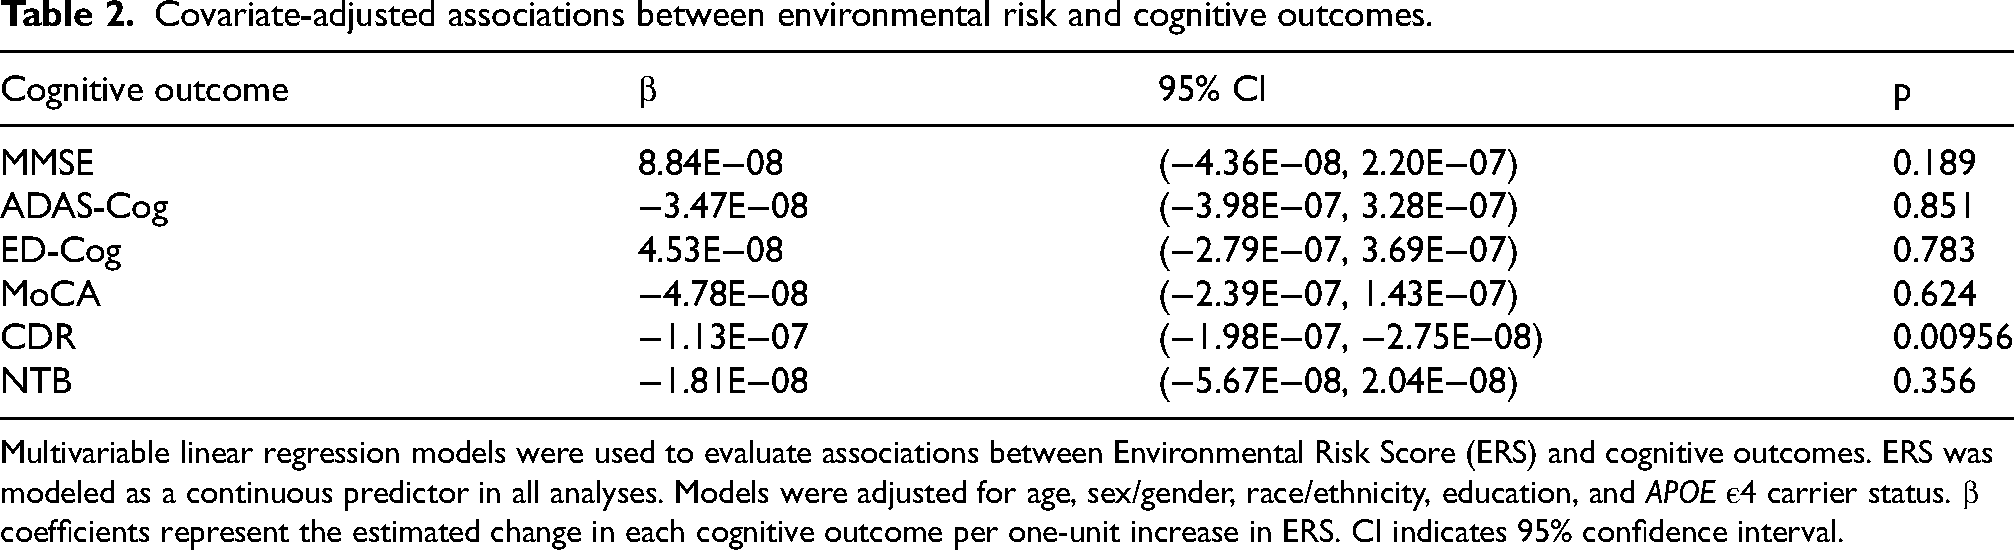
Multivariable linear regression models were used to evaluate associations between Environmental Risk Score (ERS) and cognitive outcomes. ERS was modeled as a continuous predictor in all analyses. Models were adjusted for age, sex/gender, race/ethnicity, education, and APOE ε4 carrier status. β coefficients represent the estimated change in each cognitive outcome per one-unit increase in ERS. CI indicates 95% confidence interval.
Covariate-adjusted gene models
Covariate-adjusted gene models are summarized in Table 3. EPHX1 showed a significant main effect on ADAS-Cog (β = 0.479; 95% CI, 0.0305 to 0.927; p = 0.0356). No other detoxification gene showed a statistically significant association in the reported adjusted cognitive models. No ERS × gene interaction term reached statistical significance in the adjusted models.
Covariate-adjusted models of detoxification gene variants, environmental exposure, and cognitive outcomes.
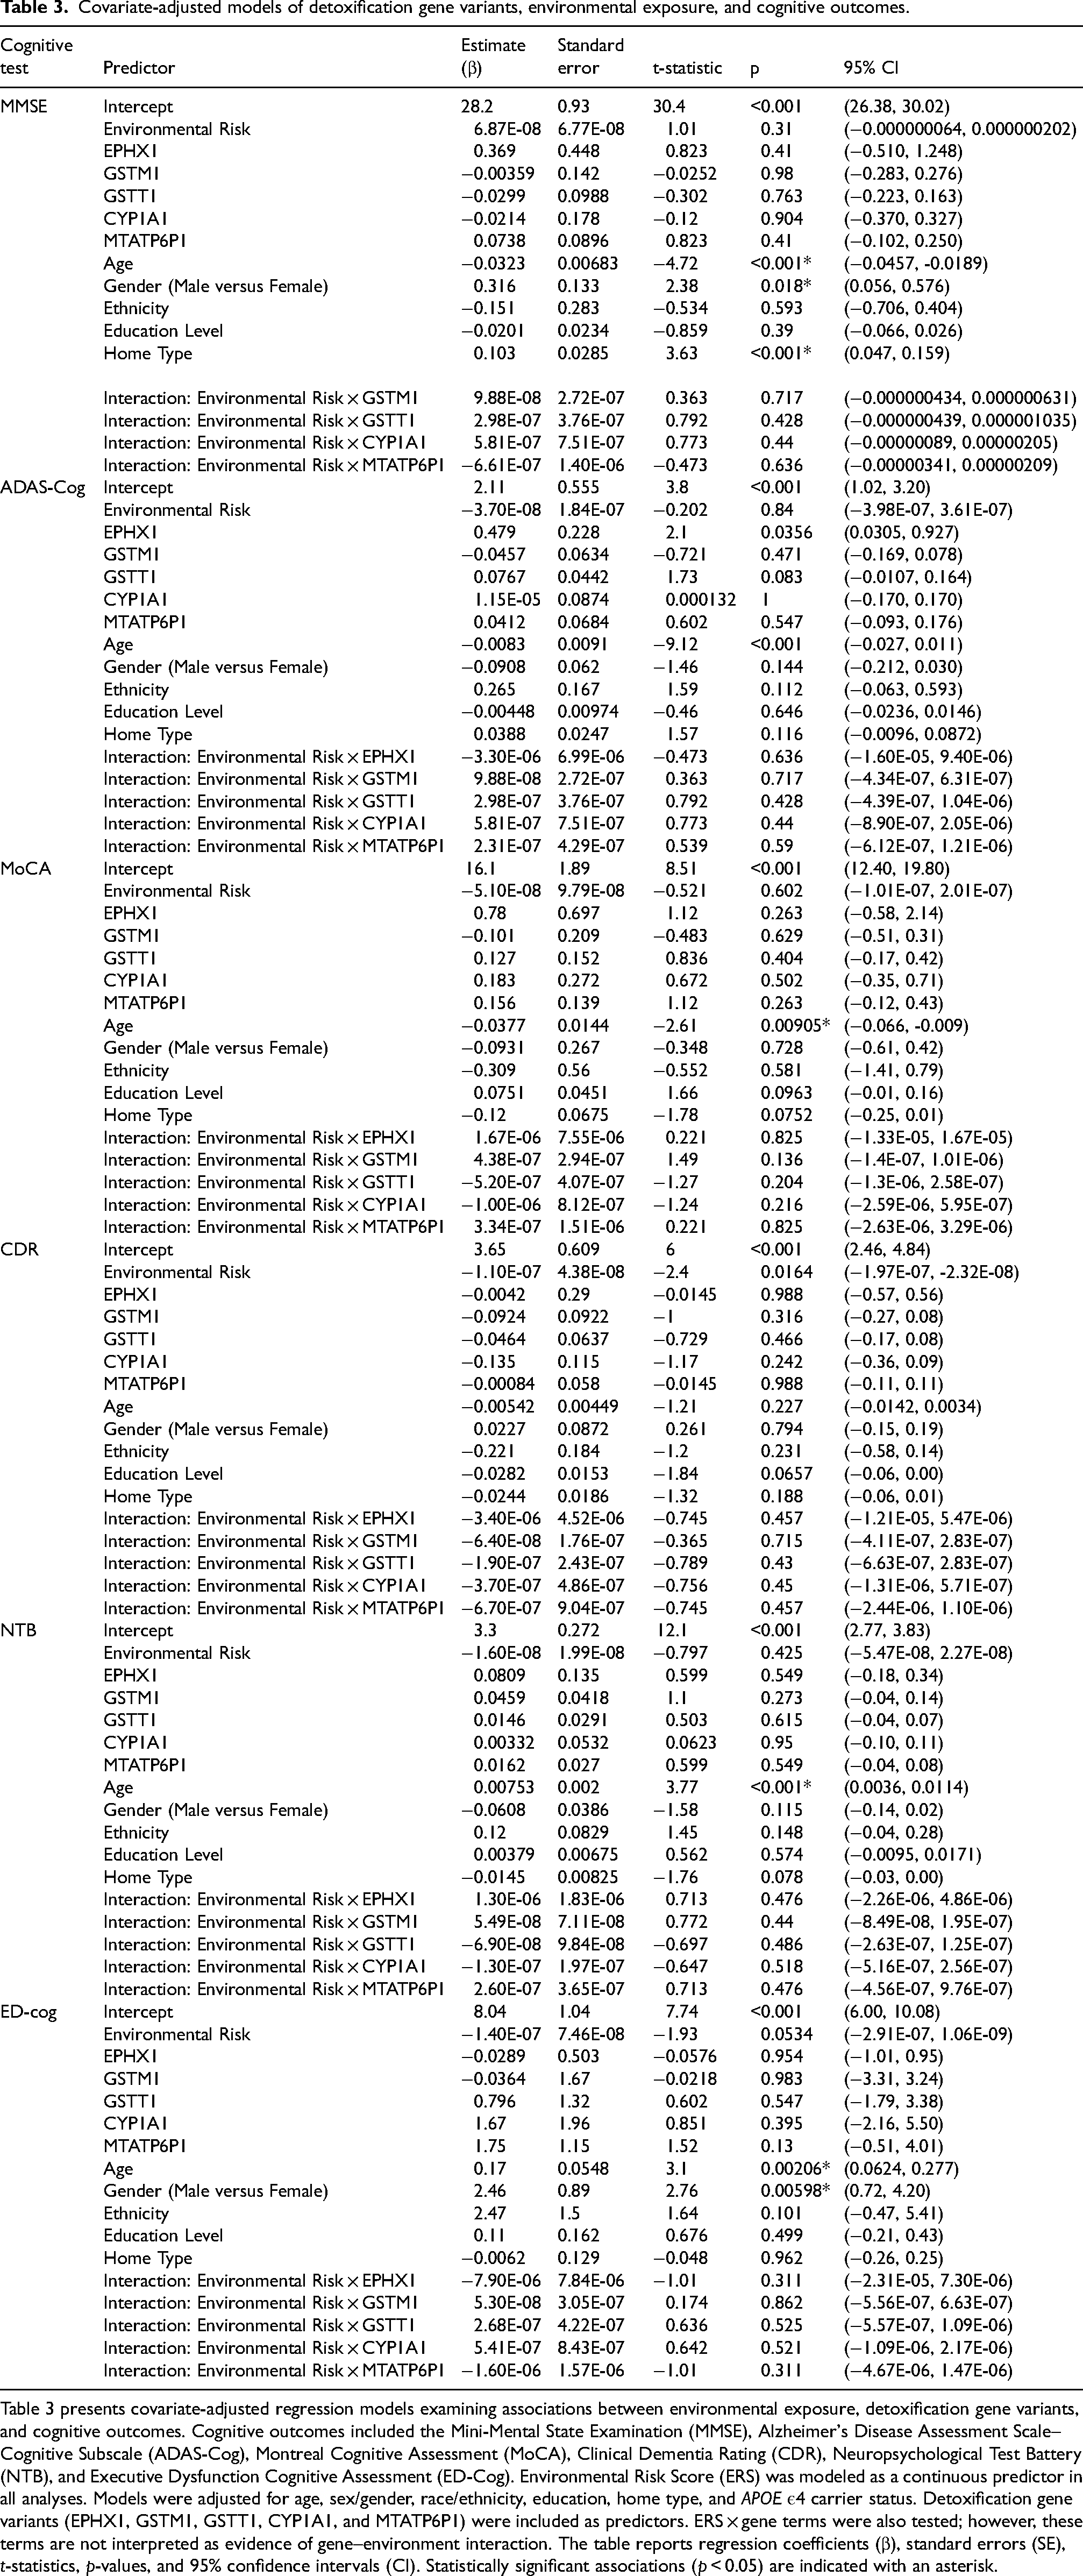
Table 3 presents covariate-adjusted regression models examining associations between environmental exposure, detoxification gene variants, and cognitive outcomes. Cognitive outcomes included the Mini-Mental State Examination (MMSE), Alzheimer's Disease Assessment Scale–Cognitive Subscale (ADAS-Cog), Montreal Cognitive Assessment (MoCA), Clinical Dementia Rating (CDR), Neuropsychological Test Battery (NTB), and Executive Dysfunction Cognitive Assessment (ED-Cog). Environmental Risk Score (ERS) was modeled as a continuous predictor in all analyses. Models were adjusted for age, sex/gender, race/ethnicity, education, home type, and APOE ε4 carrier status. Detoxification gene variants (EPHX1, GSTM1, GSTT1, CYP1A1, and MTATP6P1) were included as predictors. ERS × gene terms were also tested; however, these terms are not interpreted as evidence of gene–environment interaction. The table reports regression coefficients (β), standard errors (SE), t-statistics, p-values, and 95% confidence intervals (CI). Statistically significant associations (p < 0.05) are indicated with an asterisk.
Covariate-adjusted biomarker models
Covariate-adjusted biomarker models are presented in Table 4. ERS was not significantly associated with PET amyloid SUVR, PET tau SUVR, hippocampal atrophy, CSF tau, or NFL. ERS was not associated with amyloid PET SUVR in the adjusted model (β = 5.07E−12; 95% CI, −4.0E−09 to 5.0E−09; p = 0.998). A significant association was observed between CSF Aβ and CDR (β = 0.000435; p = 0.0446).
Covariate-adjusted associations among biomarkers, cognitive outcomes, and environmental exposure.
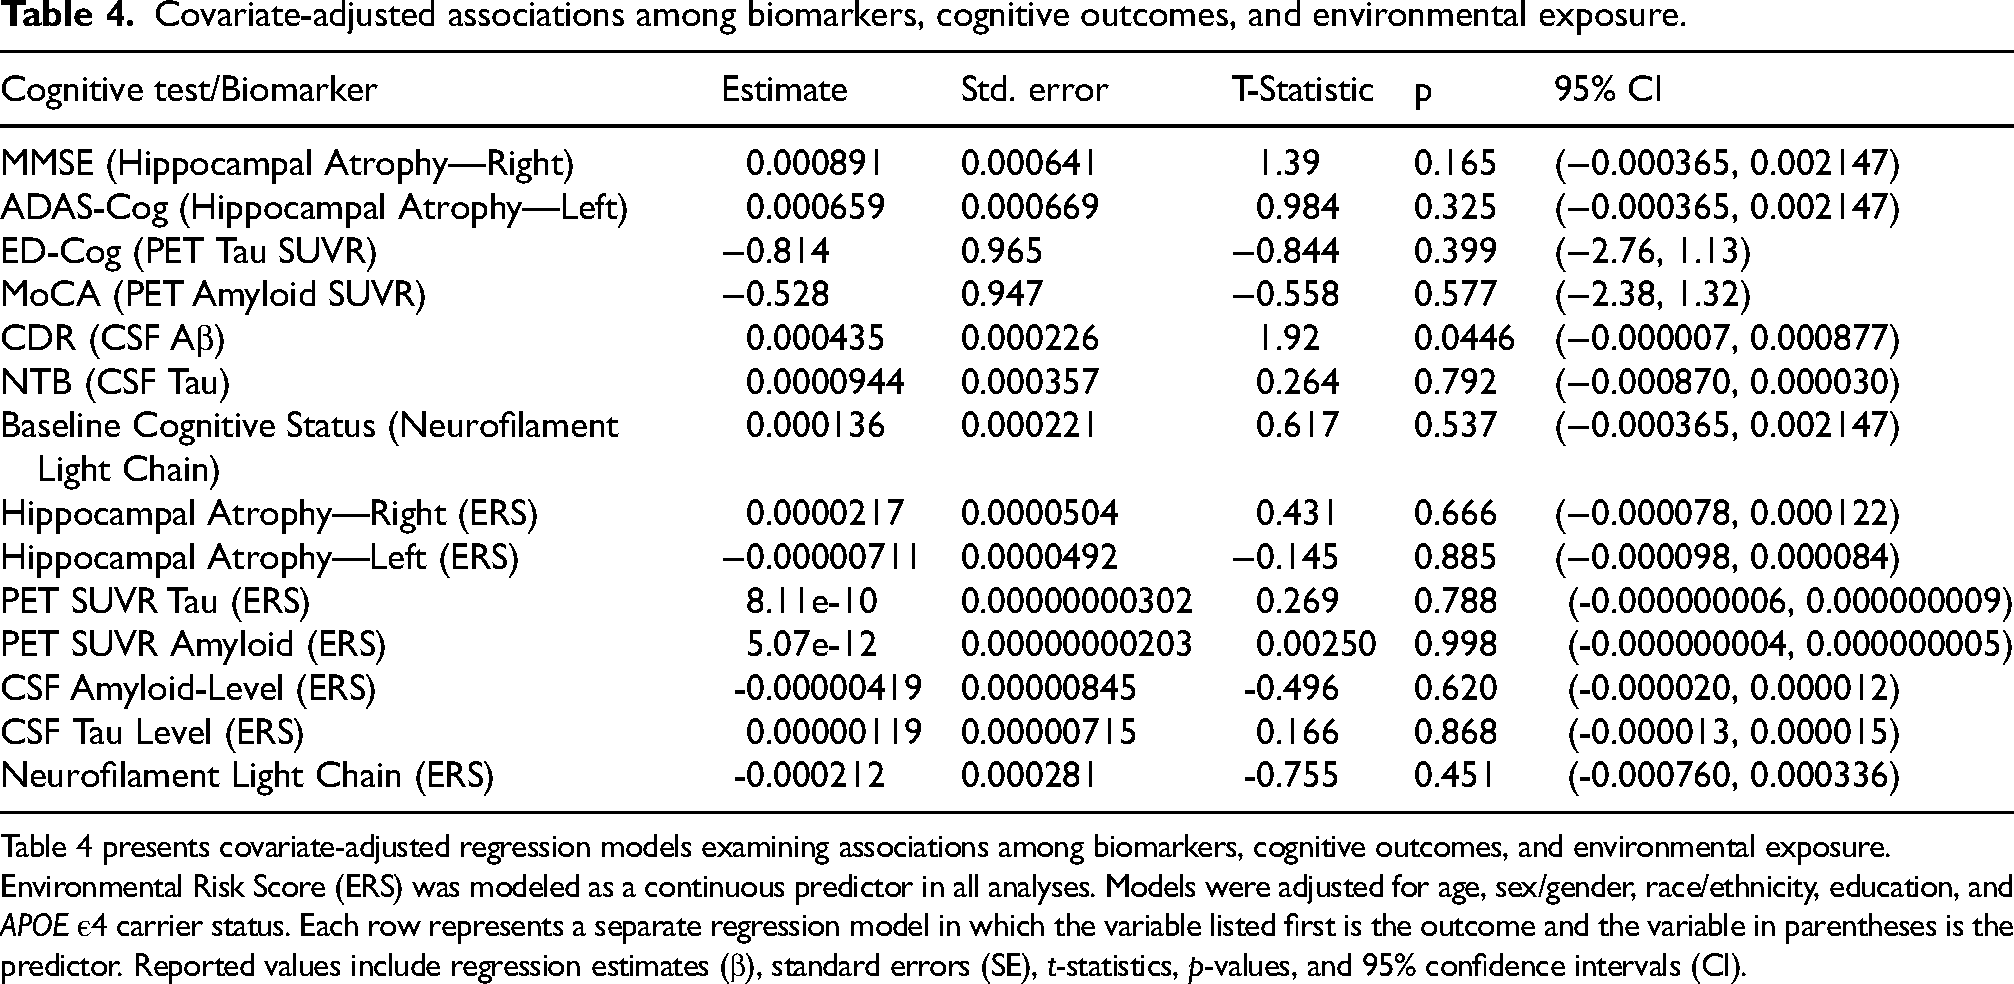
Table 4 presents covariate-adjusted regression models examining associations among biomarkers, cognitive outcomes, and environmental exposure. Environmental Risk Score (ERS) was modeled as a continuous predictor in all analyses. Models were adjusted for age, sex/gender, race/ethnicity, education, and APOE ε4 carrier status. Each row represents a separate regression model in which the variable listed first is the outcome and the variable in parentheses is the predictor. Reported values include regression estimates (β), standard errors (SE), t-statistics, p-values, and 95% confidence intervals (CI).
Discussion
This study examined associations between environmental exposure, cognitive outcomes, and AD–related biomarkers in the ADNI cohort using covariate-adjusted regression models. In descriptive, unadjusted comparisons across ERS categories, several demographic, cognitive, and biomarker measures varied across exposure groups. However, the primary adjusted analyses showed more limited associations. ERS was significantly associated with CDR, whereas associations with MMSE, ADAS-Cog, ED-Cog, MoCA, and NTB were not statistically significant after adjustment. In the genetic models, EPHX1 showed a significant main effect on ADAS-Cog, whereas ERS × gene interaction terms were not statistically significant. In the biomarker models, ERS was not significantly associated with most imaging or fluid biomarkers.
Sociodemographic considerations
Descriptive differences in age, ethnicity, and housing type were observed across ERS exposure groups, indicating that sociodemographic context varied within the cohort. Participants in higher exposure groups were more likely to reside in multi-unit dwellings, a pattern consistent with research linking built environment characteristics to differences in environmental burden and health risk.28,29 Education is strongly associated with cognitive reserve and resilience to neurodegenerative processes,30,31 and environmental factors may differentially affect cognitive aging across educational strata. 32 Age may also modify vulnerability, as older adults have shown heightened sensitivity to environmental exposures such as chronic noise and air pollution. 33 However, because these exposure-group comparisons were unadjusted, they should be interpreted as descriptive rather than inferential. In the present study, primary inference was based on covariate-adjusted models that accounted for several sociodemographic factors directly.
Environmental exposure and cognitive function
The adjusted analyses indicated a limited and domain-specific relationship between environmental exposure and cognitive outcomes. ERS was significantly associated with CDR, whereas associations with MMSE, NTB, MoCA, ADAS-Cog, and ED-Cog were not statistically significant after covariate adjustment. This pattern suggests that environmental exposure was not consistently associated with cognitive performance across domains in this dataset. Prior work has linked environmental toxicants, including air pollution, with cognitive decline and AD-related pathology,34,35 but the present findings suggest that these relationships may depend on outcome definition, exposure characterization, and covariate structure.
The observed association between EPHX1 and ADAS-Cog further supports the relevance of detoxification pathways in cognitive vulnerability. However, because ERS × gene interaction terms were not statistically significant, this association is interpreted as a genetic main effect rather than as evidence of environmental moderation. These findings support the need for longitudinal studies examining cumulative exposure, timing of exposure, and biologically relevant thresholds, 36 as well as integration of neuroinflammation and oxidative stress biomarkers to clarify potential mechanisms.37–39
Role of genetic factors and detoxification pathways
The EPHX1 gene emerged as a significant predictor of ADAS-Cog performance, reinforcing its potential involvement in detoxifying neurotoxic compounds.40,41 Given its enzymatic role in metabolizing polycyclic aromatic hydrocarbons and other toxins, individuals with EPHX1 variations may experience differential susceptibility to cognitive decline. The absence of a statistically significant interaction term indicates that EPHX1 did not significantly modify the association between environmental exposure and cognition in this dataset and instead contributed as a genetic main effect. Other detoxification genes showed no significant associations with cognitive function across the reported models, suggesting possible specificity in genetic pathways related to oxidative stress and toxin metabolism.40,41
APOE ε4 carrier status was included as an adjustment covariate because of its established role in AD risk. 42 While APOE is a well-established risk factor for AD, its relationship with environmental toxicants remains uncertain. 42 These findings underscore the need for broader genetic panels and functional biomarkers to identify individuals most vulnerable to environmentally related cognitive decline.
Biomarker evidence: amyloid versus tau pathology
In adjusted biomarker models, ERS was not significantly associated with PET amyloid SUVR, PET tau SUVR, hippocampal atrophy, CSF tau, or NFL, although a significant association was observed between CSF Aβ and CDR. Prior studies have linked environmental exposures with amyloid-related processes, vascular dysfunction, and oxidative stress,43,44 but the present findings did not show a consistent pattern across imaging and fluid biomarkers. This may indicate that environmental effects are modest, heterogeneous, or more difficult to detect in cross-sectional data using composite exposure measures. The absence of consistent associations across amyloid, tau, and structural markers underscores the need for more granular exposure assessment and longitudinal follow-up when evaluating environmental contributions to AD-related pathology.
Limitations, strengths, and key insights
An important strength of this study is the use of a large, well characterized cohort, which enhances statistical power and analytic robustness. The integration of environmental, genetic, cognitive, and biomarker data provides a multidimensional perspective on AD risk factors. However, several limitations warrant consideration. First, the cross-sectional design limits causal inference, as measurements represent a single timepoint rather than longitudinal progression.45,46 Second, the cohort's demographic composition, which is predominantly White and highly educated, limits generalizability to more diverse populations. Third, the number of statistical comparisons conducted across cognitive domains, biomarkers, and gene models increases the potential for Type I error. Fourth, the ERS was constructed as an unweighted additive composite and retained on its original scale, which contributed to very small regression coefficients and reflects the wide numerical range of its component variables. Despite these limitations, the significant main effect of EPHX1 on ADAS-Cog suggests that genetic susceptibility in detoxification pathways may warrant further study in relation to environmental risk.
Future directions
The findings of this study highlight potential directions for future public health and clinical research. Environmental monitoring and exposure reduction strategies may be relevant considerations for populations potentially vulnerable to environmental toxicants. In clinical settings, incorporating environmental exposure assessments into cognitive evaluations may help inform future risk assessment and management strategies. For future research, longitudinal designs are essential to clarify causal relationships between environmental exposures and cognitive decline. 47 Further work examining individual toxicants, specific genetic pathways, and mechanistic biomarkers may refine understanding of gene-independent and gene-related vulnerability to environmental neurotoxicity.
Conclusion
In summary, descriptive analyses of the ADNI cohort showed differences across environmental exposure categories in several cognitive and biomarker measures. In covariate-adjusted models, ERS was significantly associated with CDR, whereas associations with MMSE, ADAS-Cog, ED-Cog, MoCA, and NTB were not statistically significant. Biomarker models did not demonstrate consistent associations between environmental exposure and PET amyloid or tau SUVR, hippocampal atrophy, CSF tau, or NFL, although CSF Aβ was significantly associated with CDR. A significant main effect of EPHX1 on ADAS-Cog was observed, whereas ERS × gene interaction terms were not statistically significant. Taken together, these results support cautious interpretation of environmental associations in this dataset and highlight the need for longitudinal and mechanistically informed studies to clarify how environmental burden and genetic susceptibility relate to AD–related outcomes.
Supplemental Material
sj-docx-1-alz-10.1177_13872877261451855 - Supplemental material for Environmental risk and genetic susceptibility in Alzheimer's disease: Impacts on cognitive function and biomarkers
Supplemental material, sj-docx-1-alz-10.1177_13872877261451855 for Environmental risk and genetic susceptibility in Alzheimer's disease: Impacts on cognitive function and biomarkers by Khushi Kanani, Prevena Ramakrishnan, Snabu Neupane, Manali Misra, Kaitlynn Balmer-Brown, Sarah Halteman, Tia Warrick and in Journal of Alzheimer's Disease
Footnotes
Acknowledgements
Data collection and sharing for this project were funded by the Alzheimer's Disease Neuroimaging Initiative (ADNI) (National Institutes of Health Grant U01 AG024904) and DOD ADNI (Department of Defense award number W81XWH-12-2-0012). ADNI is funded by the National Institute on Aging, the National Institute of Biomedical Imaging and Bioengineering, and through contributions from private and public sponsors. The Canadian Institutes of Health Research supports ADNI sites in Canada. Private sector contributions are facilitated by the Foundation for the National Institutes of Health. The study is coordinated by the Alzheimer's Therapeutic Research Institute at the University of Southern California, and data are disseminated by the Laboratory for Neuro Imaging at the University of Southern California.
Ethical considerations
This study used publicly available, de-identified data from the Alzheimer's Disease Neuroimaging Initiative (ADNI). All procedures complied with the ADNI Data Use Agreement and relevant ethical guidelines.
Consent to participate
All participants provided written informed consent at original ADNI data collection sites. No new participants were enrolled for this analysis.
Consent for publication
Not applicable
Author contribution(s)
Funding
The authors disclosed receipt of the following financial support for the research, authorship, and/or publication of this article: This study was supported by the Alzheimer's Disease Neuroimaging Initiative (National Institutes of Health Grant U01 AG024904) and DOD ADNI (Department of Defense award number W81XWH-12-2-0012), along with contributions from public and private sponsors listed at ![]() .
.
Declaration of conflicting interests
The authors declared no potential conflicts of interest with respect to the research, authorship, and/or publication of this article.
Data availability statement
Data used in this study are publicly available from the Alzheimer's Disease Neuroimaging Initiative (ADNI) at adni.loni.usc.edu. Processed data and analytic code are available from the corresponding author upon reasonable request.
Supplemental material
Supplemental material for this article is available online.
References
Supplementary Material
Please find the following supplemental material available below.
For Open Access articles published under a Creative Commons License, all supplemental material carries the same license as the article it is associated with.
For non-Open Access articles published, all supplemental material carries a non-exclusive license, and permission requests for re-use of supplemental material or any part of supplemental material shall be sent directly to the copyright owner as specified in the copyright notice associated with the article.