
Abstract
Background
Depressive symptoms frequently co-occur with cognitive impairment in older adults. Although depression and cognition interact in brain activity, the underlying functional connectivity mechanisms in mild cognitive impairment (MCI) remains unclear.
Objective
To investigate how depressive symptoms modulate the relationship between cognition and amygdala/hippocampus functional connectivity in MCI.
Methods
This study included 138 participants (45 healthy controls and 93 MCI patients) who underwent resting state functional magnetic resonance imaging (rs-fMRI) and neuropsychological assessment using the Montreal Cognitive Assessment-Basic (MoCA-B) for cognitive function and Hamilton Depression Rating Scale (HAMD) for depressive symptoms. Seed-based functional connectivity analysis was performed using bilateral amygdala and hippocampus as seed regions to quantify the HAMD × MoCA-B non-monotonic interactions on whole-brain connectivity. Simple slopes analyses were conducted to characterize directionality changes across depression severity levels.
Results
Whole-brain analyses revealed significant HAMD × MoCA-B interaction effects (cluster p value < 0.05, voxel p value < 0.01, GRF corrected) demonstrating symptom-dependent reorganization of cognition-FC relationships. Amygdala connectivity decreased to anterior/middle cingulate and precuneus but increased to triangular part of inferior frontal gyrus (IFGtri), medial superior frontal gyrus, and cerebellar lobule IX. Hippocampal connectivity decreased to cuneus, insula, thalamus, and caudate but increased to opercular part of inferior frontal gyrus (IFGop), orbitofrontal cortex, and cerebellar lobule VIII.
Conclusion
Depressive symptoms alter amygdala and hippocampal FC relationships with cognition in MCI. Depression-dependent hippocampal/amygdala connectivity changes with the frontoparietal network (FPN-A)-particularly IFGop/IFGtri and cerebellum-suggest their role as critical hubs for emotional-cognitive integration, highlighting them as potential neuromodulation targets for cognitive and depressive symptoms in MCI.
Keywords
Introduction
Mild cognitive impairment (MCI), a transitional stage between normal aging and Alzheimer's disease (AD) characterized by impairment in one or more cognitive domains, affects approximately 38.77 million older people in China. 1 At the same time, depression is common in individuals with MCI. 2 This clinical overlap has a neurobiological basis: not only does depression accelerate MCI progression to dementia, 3 but MCI patients with comorbid depressive symptoms also demonstrate accelerated cognitive decline compared to their non-depressed patients. 4 Emerging evidence suggests these conditions represent a clinical continuum, 5 though the underlying neural mechanisms remain unclear.
Neuroimaging studies implicate overlapping structural and functional abnormalities in depression and MCI, primarily affecting the hippocampus, amygdala, and prefrontal regions.6,7 Structural imaging studies reveal volumetric reductions in the hippocampus, amygdala, and inferior frontal gyrus (IFG) in both depression and MCI.8,9 Beyond structural changes, functional analyses demonstrate characteristic impairments in hippocampal-prefrontal connectivity across these disorders, 10 with similar alterations observed even in older adults with subthreshold depression. 11 At the network level, the orbitofrontal cortex (OFC) and anterior cingulate cortex (ACC) further exhibit disrupted emotion-cognition integration patterns.12–14 Importantly, depressive symptoms significantly moderate these neural alterations in MCI, as evidenced by symptom-dependent variations in hippocampal-gray matter associations with cognition 15 and reduced amygdala-OFC/ACC connectivity patterns. 16 Despite these advances, the mechanistic basis through which depressive symptoms modulate functional connectivity (FC)-cognition relationships in MCI remains unexplored.
The amygdala processes sensory input and projects it widely to cortical regions. 17 Structural and functional abnormalities in the amygdala have been linked to depression, particularly in older adults. 18 In depressed patients, amygdala network dysfunction may contribute to emotional and cognitive deficits. 19 Notably, among AD patients with depressive symptoms, amygdala-frontal lobe connectivity mediates the relationship between depressive symptoms and cognitive decline. 20 Therefore, dysregulation of the amygdala network may underlie emotional and cognitive disturbances in MCI. The hippocampus also critically regulates cognition and emotion. 21 Studies report disrupted hippocampal connectivity in major depressive disorder (MDD), 22 and similar impairments in MCI patients. 23 These evidence highlight an important yet understudied aspect: how depressive symptoms may modulate FC-cognition relationships in MCI, particularly within hippocampal and amygdala networks.
In this work, we hypothesized that depressive symptoms might non-monotonically alter FC-cognition associations in MCI, within hippocampal and amygdala networks. Specifically, this modulation may follow a symptom severity-dependent pattern, where depressive symptom intensity determines the FC-cognition relationships. We first conducted hippocampus- and amygdala-seeded FC analysis to examine the modulatory effects of depressive symptoms on FC-cognition relationships in both MCI and cognitively normal older adults; and then, utilized simple slopes test to characterize non-monotonic interactions between affective symptoms and neural network organization in MCI and aging populations.
Methods
Participants
Participants were recruited from the outpatient memory clinic at the fourth people's hospital of Chengdu between April 2021 and September 2024. General inclusion criteria were age 50–85 years for MCI and cognitively normal older adults, availability of family/caregiver to provide collateral information, modified Hachinski ischemia score≤4, right-handed, and good general health. All participants completed a battery of neuropsychological tests and clinical assessments. MCI was established by an experienced psychiatrist based on a comprehensive clinical assessment using Petersen's criteria, 24 which required: (a) impaired memory performance, adjusted for age and education; (b) memory complaint lasting ≥6 months; (c) generally normal cognitive function, as determined by clinical evaluation of performance across multiple non-memory domains (e.g., language, executive function); (d) normal activities of daily living; (e) the clinical dementia rating scale score of 0.5; and (f) the absence of dementia. Exclusion criteria were comorbid major psychiatric illness, previous or current alcohol or drug dependence, neurological illness (including stroke, transient ischemic attacks, and dementia), illness or medication precluding cognitive testing, metal implants precluding MRI scanning, and electroconvulsive therapy in the past 6 months.
We included 43 age- and gender-matched comparison participants who had no current or prior depressive illness or cognitive impairment, as determined by formal clinical and neuropsychological assessment. Exclusion criteria were the same as for the patient group. This subset fulfilled additional inclusion criteria: they had no self-reported persistent cognitive decline with the absence of objective cognitive impairment, and a Clinical Dementia Rating (CDR) score of 0. Recruitment was done through an existing departmental database and advertisement in local community. The study protocol was approved by the Institutional Review Board of the fourth people's hospital of Chengdu. Written informed consent was obtained from all participants prior to study participation.
Neuropsychological assessment
We used the Montreal Cognitive Assessment-Basic (MoCA-B) to assess global cognitive functioning. Depressive symptoms were identified by professional psychiatrists. The presence of a depressive syndrome was clinically evaluated according to the Diagnostic and Statistical Manual of Mental Disorders, fourth edition (DSM-IV) criteria. 25 To quantify symptom severity and to define groups for subsequent analysis, the 24-item Hamilton Depression Rating Scale (HAMD) was administered.26,27 For the primary analyses in this study, participants were categorized as having clinically depressive symptoms if their HAMD score was ≥ 8. This cut-off corresponds to the lower bound of “mild depression” in standard severity classifications 27 and has been commonly used in studies of older adults and MCI populations to capture a broad spectrum of symptom burden. 28
MRI data acquisition and preprocessing
The experiments were performed on a 3.0 T MRI scanner (Trio 3 T, Siemens Healthcare, Erlangen Germany) at the fourth people's hospital of Chengdu. During scanning, we used foam padding and ear plugs to reduce head motion and scanning noise, respectively. The resting-state functional MRI (rs-fMRI) data were acquired using gradient-echo echo planar imaging sequences (repetition time [TR] = 2000 ms, echo time [TE] = 30 ms, field of view [FOV] = 1440*1440, matrix = 64 × 64, voxels = 3.75*3.75*4.40 mm3, flip angle [FA] = 90◦).The other scanning sequence was in descending sequence with 34 layers, 255 volumes were collected, and the total collection time was about 8.5 min. Subsequently, high-resolution T1-weighted images were acquired using a magnetization prepared rapid gradient echo imaging sequence (TR = 2300 ms, TE = 2.32 ms, FOV=240 × 240, matrix=256 × 256, voxels = 0.94*0.94*0.90 mm3, 192 slices). Given the 3D acquisition mode, contiguous slices were acquired with no slice gap. The collection time is about 5 min and 20 s in total. During the resting-state fMRI, all the participants were instructed to have their eyes-closed and to move as little as possible without falling asleep.
The functional data preprocessing was performed using Neuroscience Information Toolbox (NIT) 29 (https://www.neuro.uestc.edu.cn/NIT.html) integrated with SPM12. To ensure the stable state and magnetic field intensity of the subjects during scanning, the first 5 images were discarded to allow for T1 equilibrium stabilization. 30 Pre-processing includes time correction, spatial alignment, and spatial normalization, where the fMRI data is spatially aligned to the input high-resolution T1-weighted structure image. The normalization voxel size is [2 × 2 × 2mm3]. This resolution is a common field standard that provides an optimal balance for preserving spatial detail in subcortical structures while maintaining manageable computational demands for connectivity analysis. The toolkit was further used to regression 24 head motion parameters, 31 white matter and cerebrospinal fluid signals, linear drift and whole brain mean signals, and then a band-pass filter with a pass band of 0.01∼0.08 Hz was used for filtering. Finally, the images are smoothed [6-mm full-width at half-maximum (FWHM)] to further retain useful signals, reduce noise signals and ensure the continuity of the clumps as much as possible.
Functional connectivity calculation
The toolbox REST1.8 was used to calculate the voxel level functional connection of the preprocessed functional image. 32 For seed-based FC analysis, the selection of seed sites is as follows: The template BN_Atlas_246 is used as reference, 33 and the selected regions are left anterior hippocampus (label 215), right anterior hippocampus (label 216), left posterior hippocampus (label 217) and right posterior hippocampus (label 218). With template AAL3 34 as reference, the left amygdala (label 45) and the right amygdala (label 46) were selected as seed points. The correlations between seed points and each voxel in gray matter were calculated. Finally, Fisher-z transformation is applied to the image of correlation coefficients to make it obey normal distribution.
Statistical analysis
To determine the interactive effects of emotional and cognitive effects on functional connectivity indicators, we employed a multiple regression model for statistical analysis. We treated MoCA-B scores and HAMD scores as continuous variables, with all statistical models adjusting for age, sex, education, brain volume and mean head motion parameters as covariates. The interactive effects linear regression model included MoCA-B scores and HAMD scores as independent variables, and an additional HAMD × MoCA-B interaction term, according to the formula135,36:
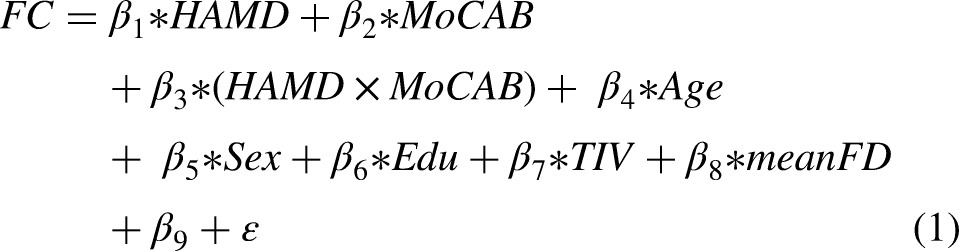
In this model, HAMD scores, MoCA-B scores, and their interaction term (HAMD × MoCA-B) were the primary predictors of interest, while age, sex, education, total intracranial volume (TIV), and mean framewise displacement (mean FD) were included as covariates. β9 represents the intercept, and ε is the error term. To eliminate scale differences and facilitate the interpretation of effect sizes, all independent variables were standardized across participants using z-score transformation prior to model fitting.
Considering the potential sample bias arising from the fact that sample collection may not conform to the overall distribution, which makes it difficult to determine whether individual sample points are outliers, we used Robust Regression 37 instead of Ordinary Least Squares (OLS) regression. Finally, statistical inference was performed on the obtained partial regression coefficients to assess the influence of different effects on FC indices. The significance of the seed-based FC maps was determined using Gaussian Random Field (GRF) theory for multiple comparison correction (as implemented in the DPABI toolbox). The corrected threshold was set at a voxel-level p < 0.01 and a cluster-level p < 0.05. The resulting statistical plots are displayed in different layers of the brain template using the DPABI toolbox (http://rfmri.org/dpabi).
To ensure the robustness and validity of the regression estimates, we assessed potential multicollinearity among all predictors (age, sex, education, TIV, mean FD, HAMD, MoCA-B, and the HAMD × MoCA-B interaction term) using variance inflation factors (VIF). All VIF values were well below the conservative threshold of 5 (see Supplemental Table 1), indicating no substantial multicollinearity that would compromise the stability of the model.
To determine the directionality of MoCA-B × HAMD interaction effects, mean FC values were extracted from significant clusters for each participant. Specifically, for each cluster showing a significant MoCA-B × HAMD interaction effect after multiple-comparison correction, FC values were averaged across voxels within the cluster to obtain a mean FC value for each participant. These values were then used for simple slopes analyses to examine continuous by continuous interactions. In simple slopes analyses, two moderator levels were chosen based on HAMD cutoff groupings (e.g., HAMD<8; HAMD≥8). 27 Specifically, simple slopes analyses tested the relationship between MoCA-B scores and FC values at the mean HAMD levels of both the low-HAMD and high-HAMD groups.
Network affiliation analysis
To interpret the anatomical findings within a functional network framework, significant clusters from the whole-brain interaction analysis were assigned a network label based on the Yeo-17 canonical functional network atlas. 38 Specifically, the peak Montreal Neurological Institute (MNI) coordinate of each significant cluster was overlapped with the Yeo-17 parcellation to determine its primary functional network affiliation (e.g., frontoparietal network [FPN], default mode network [DMN], cerebellar network).
Results
Demographic and clinical characteristics
A total of 138 participants (MCI: n = 93; HCs: n = 45) were included in the study. MCI had lower MoCA-B scores and higher ratings of mental health according to the HAMD. The average MoCA-B scores of MCI suggested worse performance than that of the HC. The demographic and clinical characteristics were showed in Table 1. The distribution graph of the scores of HAMD and MoCA-B were presented in Supplemental Figure 1.
Characteristics of participants.
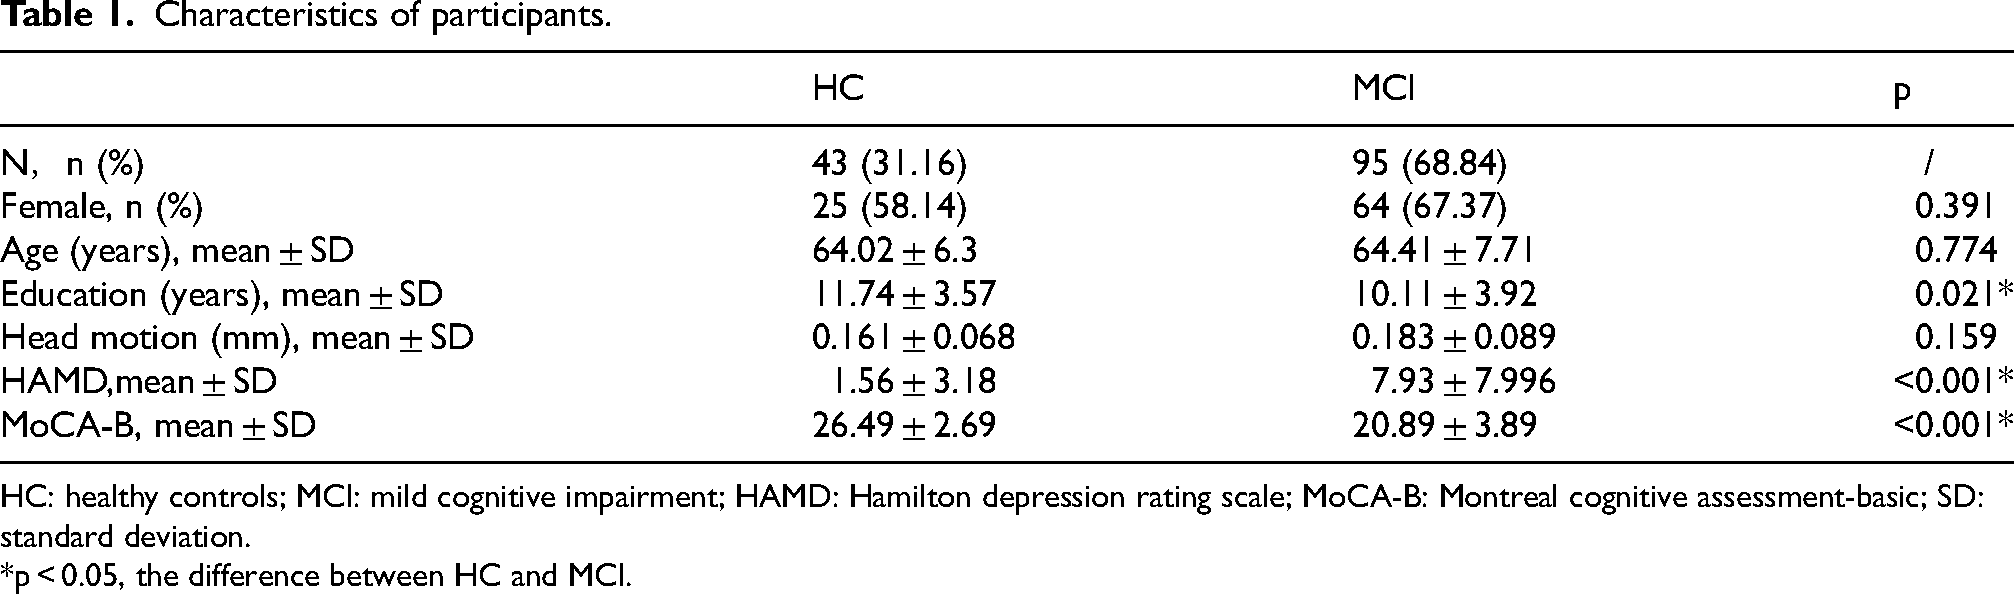
HC: healthy controls; MCI: mild cognitive impairment; HAMD: Hamilton depression rating scale; MoCA-B: Montreal cognitive assessment-basic; SD: standard deviation.
*p < 0.05, the difference between HC and MCI.
Whole-brain voxel-wise analyses
Whole-brain voxel-wise analysis revealed significant HAMD × MoCA-B interaction effects on FC (cluster-level p < 0.05, voxel-level p < 0.01, Gaussian random field corrected). The main effects of HAMD and MoCA-B on FC are shown in Supplemental Figures 2 and 3. For FCs derived from different seed regions, significant clusters were primarily localized to the following brain areas.
Interaction of amygdala network
Using the left amygdala as a seed region, significant interaction effects were observed in the cerebellum, ACC, medial superior frontal gyrus, triangular inferior frontal gyrus (IFGtri), middle cingulate gyrus, and precuneus (Figure 1A). When seeding from the right amygdala, significant interactions were detected in cerebellar regions, including lobules VIII (cerebellum_8), IX (cerebellum_9), and portions of the cerebellar vermis (Figure 1B).
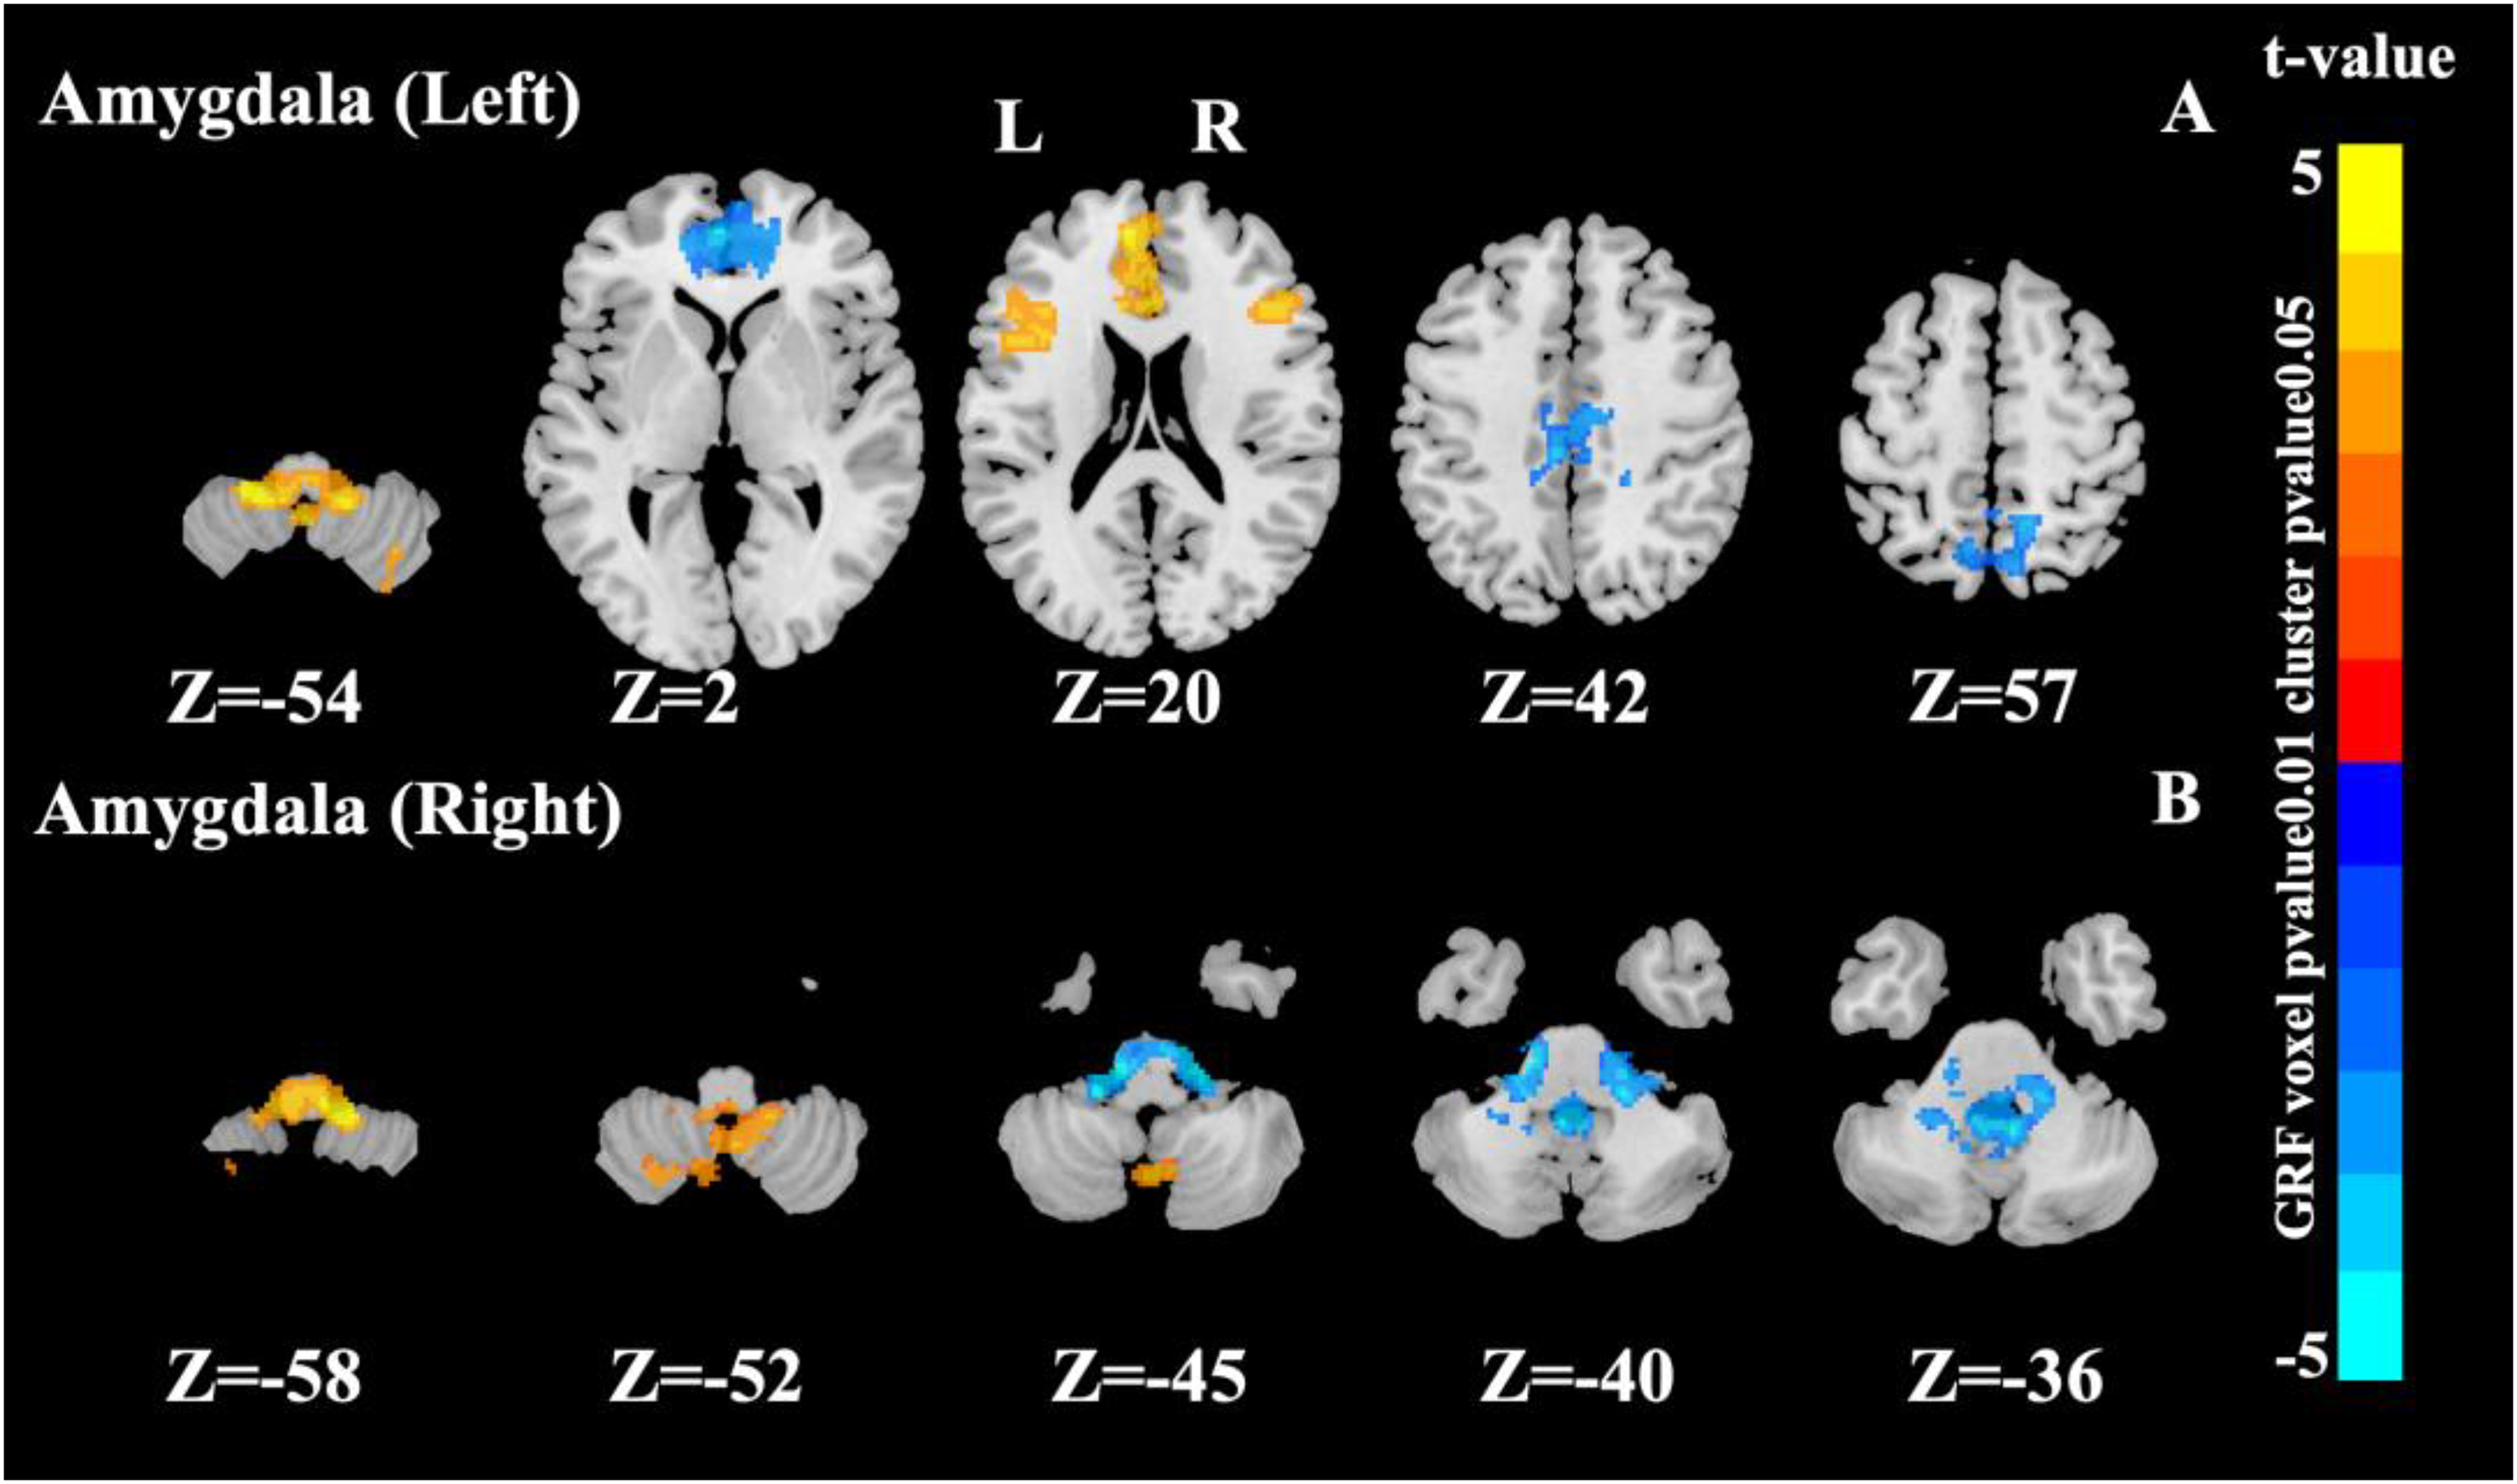
Significant interaction effects area in the amygdala as a seed point (cluster p value < 0.05, voxel p value < 0.01, Gaussian random field corrected).
Interaction of hippocampus network
Left hippocampus as seed region
For the left rostral hippocampus, significant FC interaction effects were observed in the cerebellum, thalamus, left caudate nucleus, cuneus, and precuneus (Figure 2A). For the left caudal hippocampus, significant interactions involved the medial frontal gyrus (Frontal_Sup_Medial), ACC, orbital medial frontal gyrus (Frontal_Med_Orb), cuneus, precuneus, left thalamus (Thal_L), and left caudate nucleus (Caudate_L) (Figure 2B).
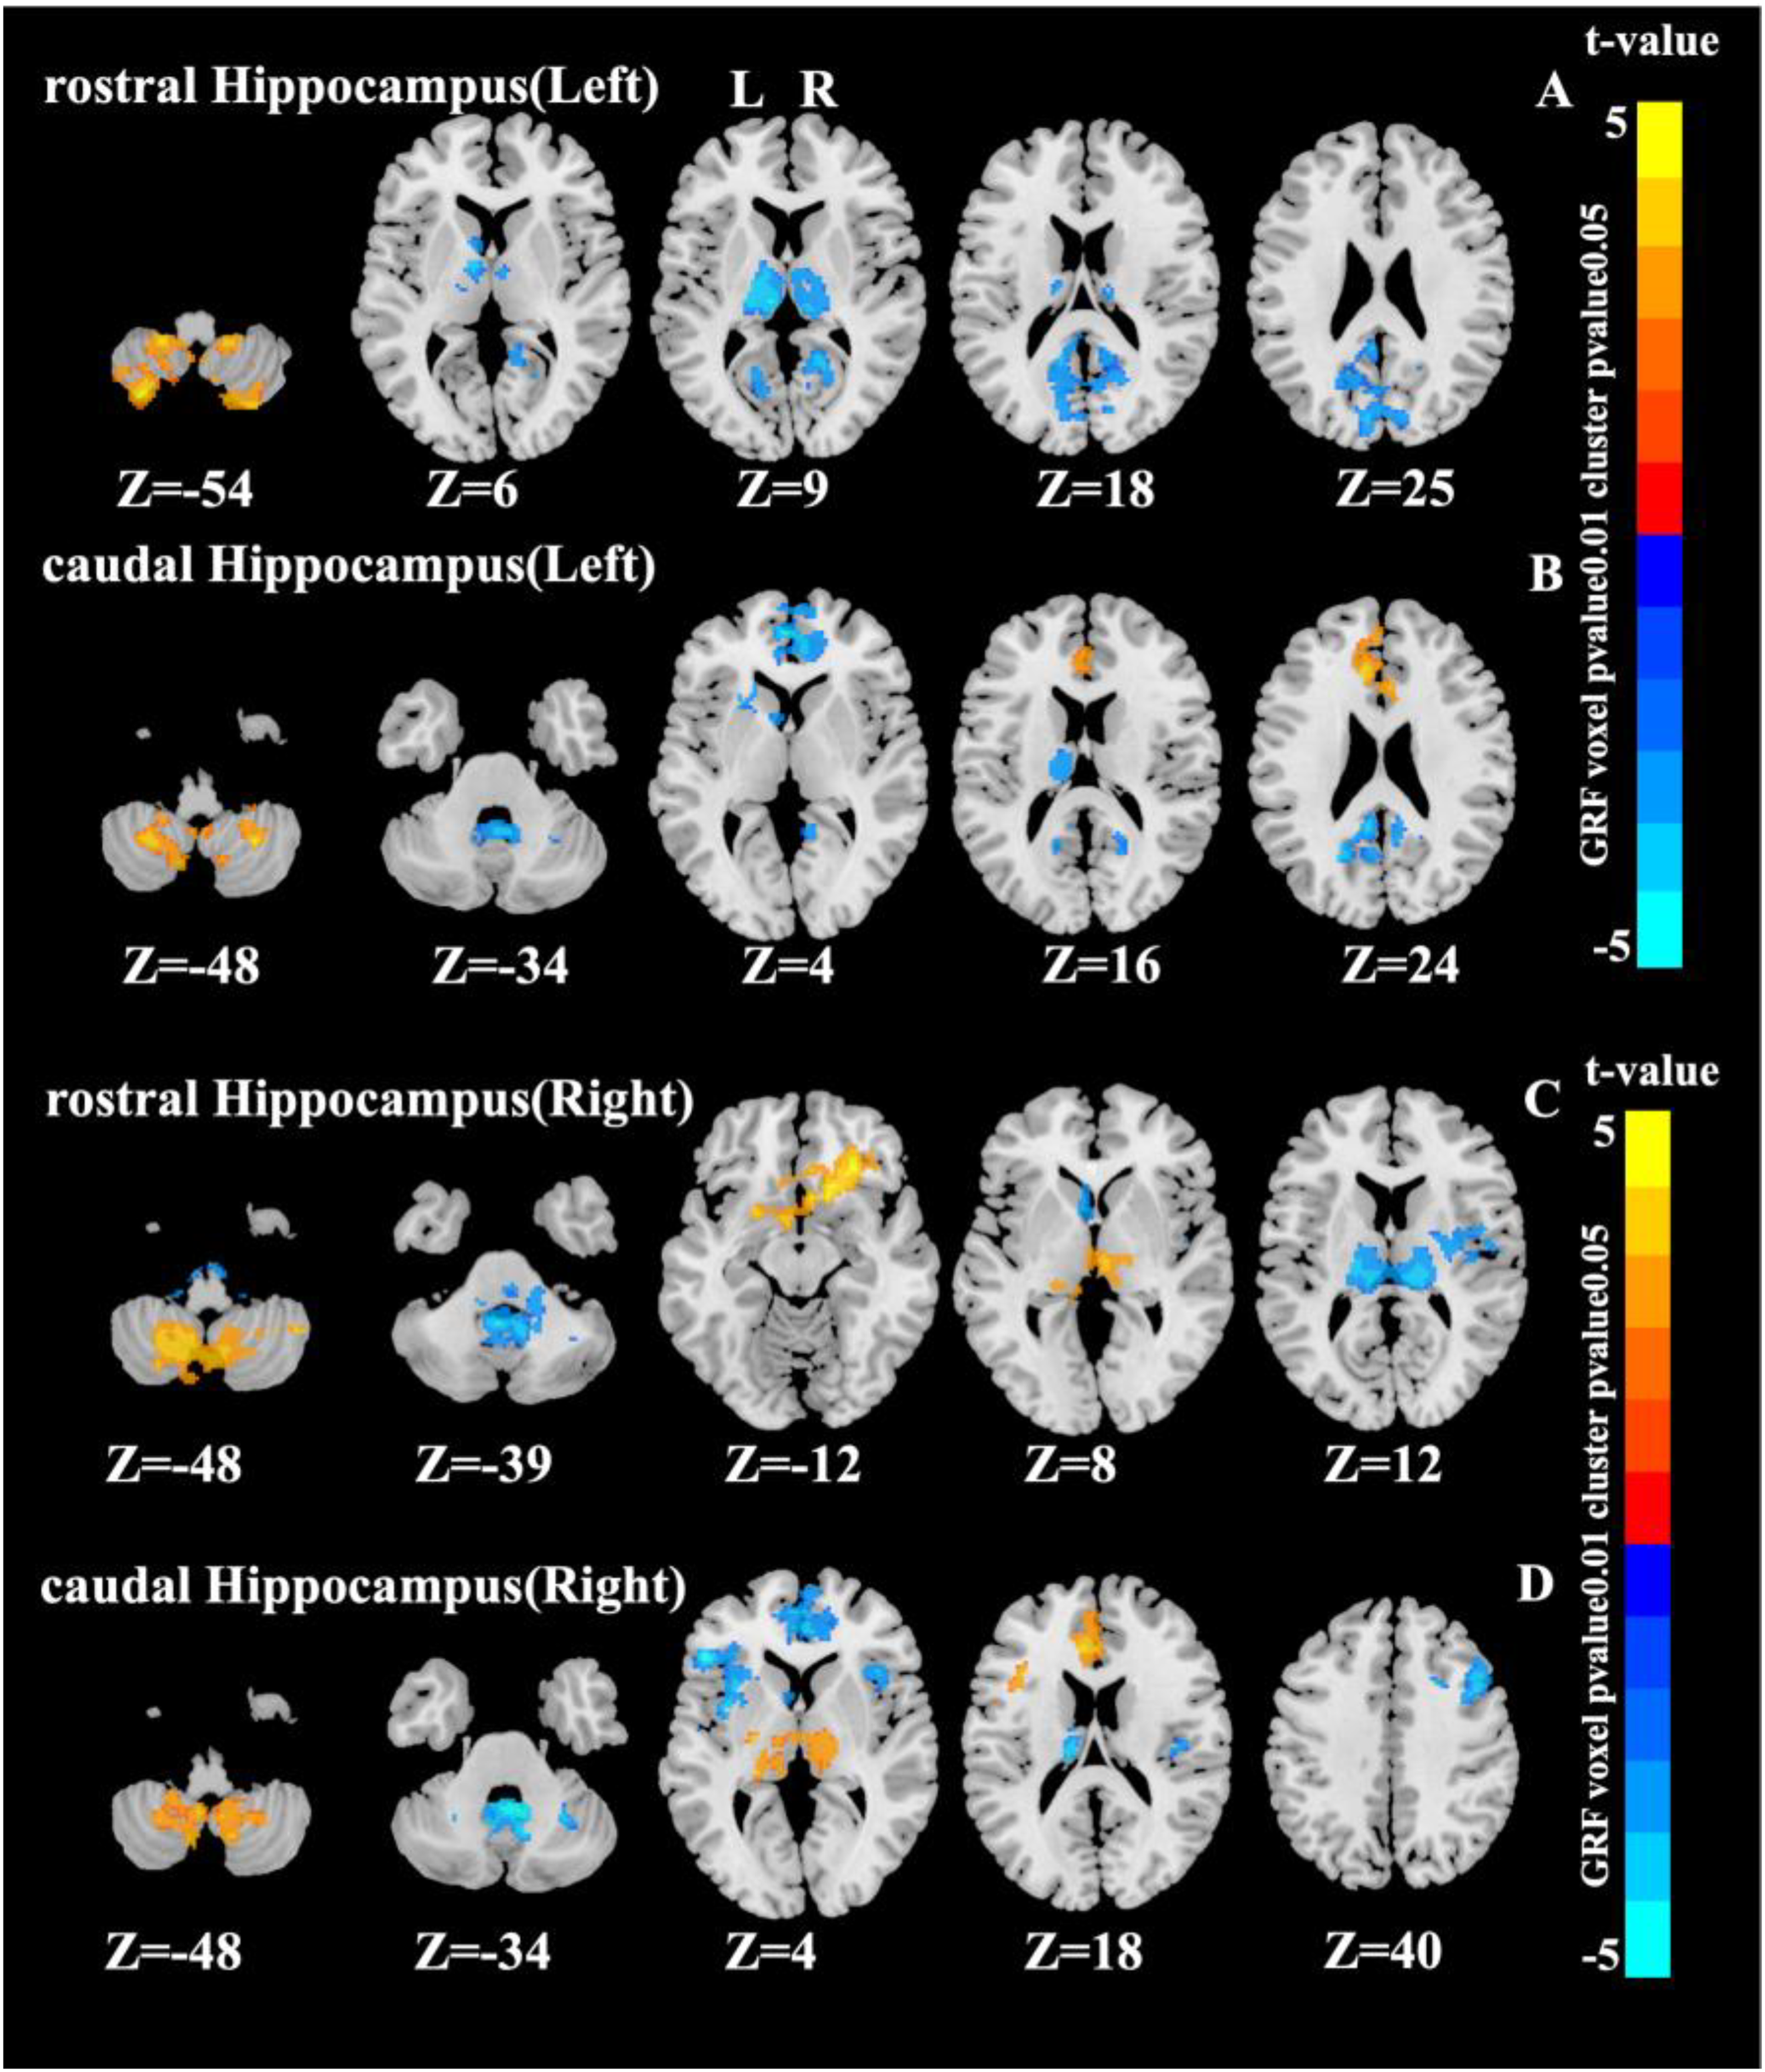
Significant interaction effects area in the hippocampus as a seed point (cluster p value < 0.05, voxel p value < 0.01, Gaussian random field corrected).
Right hippocampus as seed region
With the right rostral hippocampus as seed region, significant FC interaction effects emerged in the cerebellum, OFC, left caudate nucleus (Caudate_L), thalamus, and right insula (Insula_R) (Figure 2C). Seeding from the right caudal hippocampus revealed interactions in the cerebellum, ACC, medial frontal gyrus (Frontal_Sup_Medial), insula, IFGtri (Frontal_Inf_Tri), opercular inferior frontal gyrus (Frontal_Inf_Oper_L), left thalamus (Thal_L), left caudate nucleus (Caudate_L), and right middle frontal gyrus (Frontal_Mid_2_R) (Figure 2D).
Table 2 details all clusters showing significant interaction effects, including peak coordinates (MNI), corresponding AAL3 regions, T-values, cluster sizes, and their primary functional network affiliation based on the Yeo-17 atlas. Consistent patterns were observed in MCI patients (Supplemental Figure 4, Supplemental Table 2). Network Correspondence Analysis for these interaction regions are provided in Supplemental Figure 5.
Peak-level brain regions showing significant HAMD × MoCA-B interaction effects on functional connectivity.
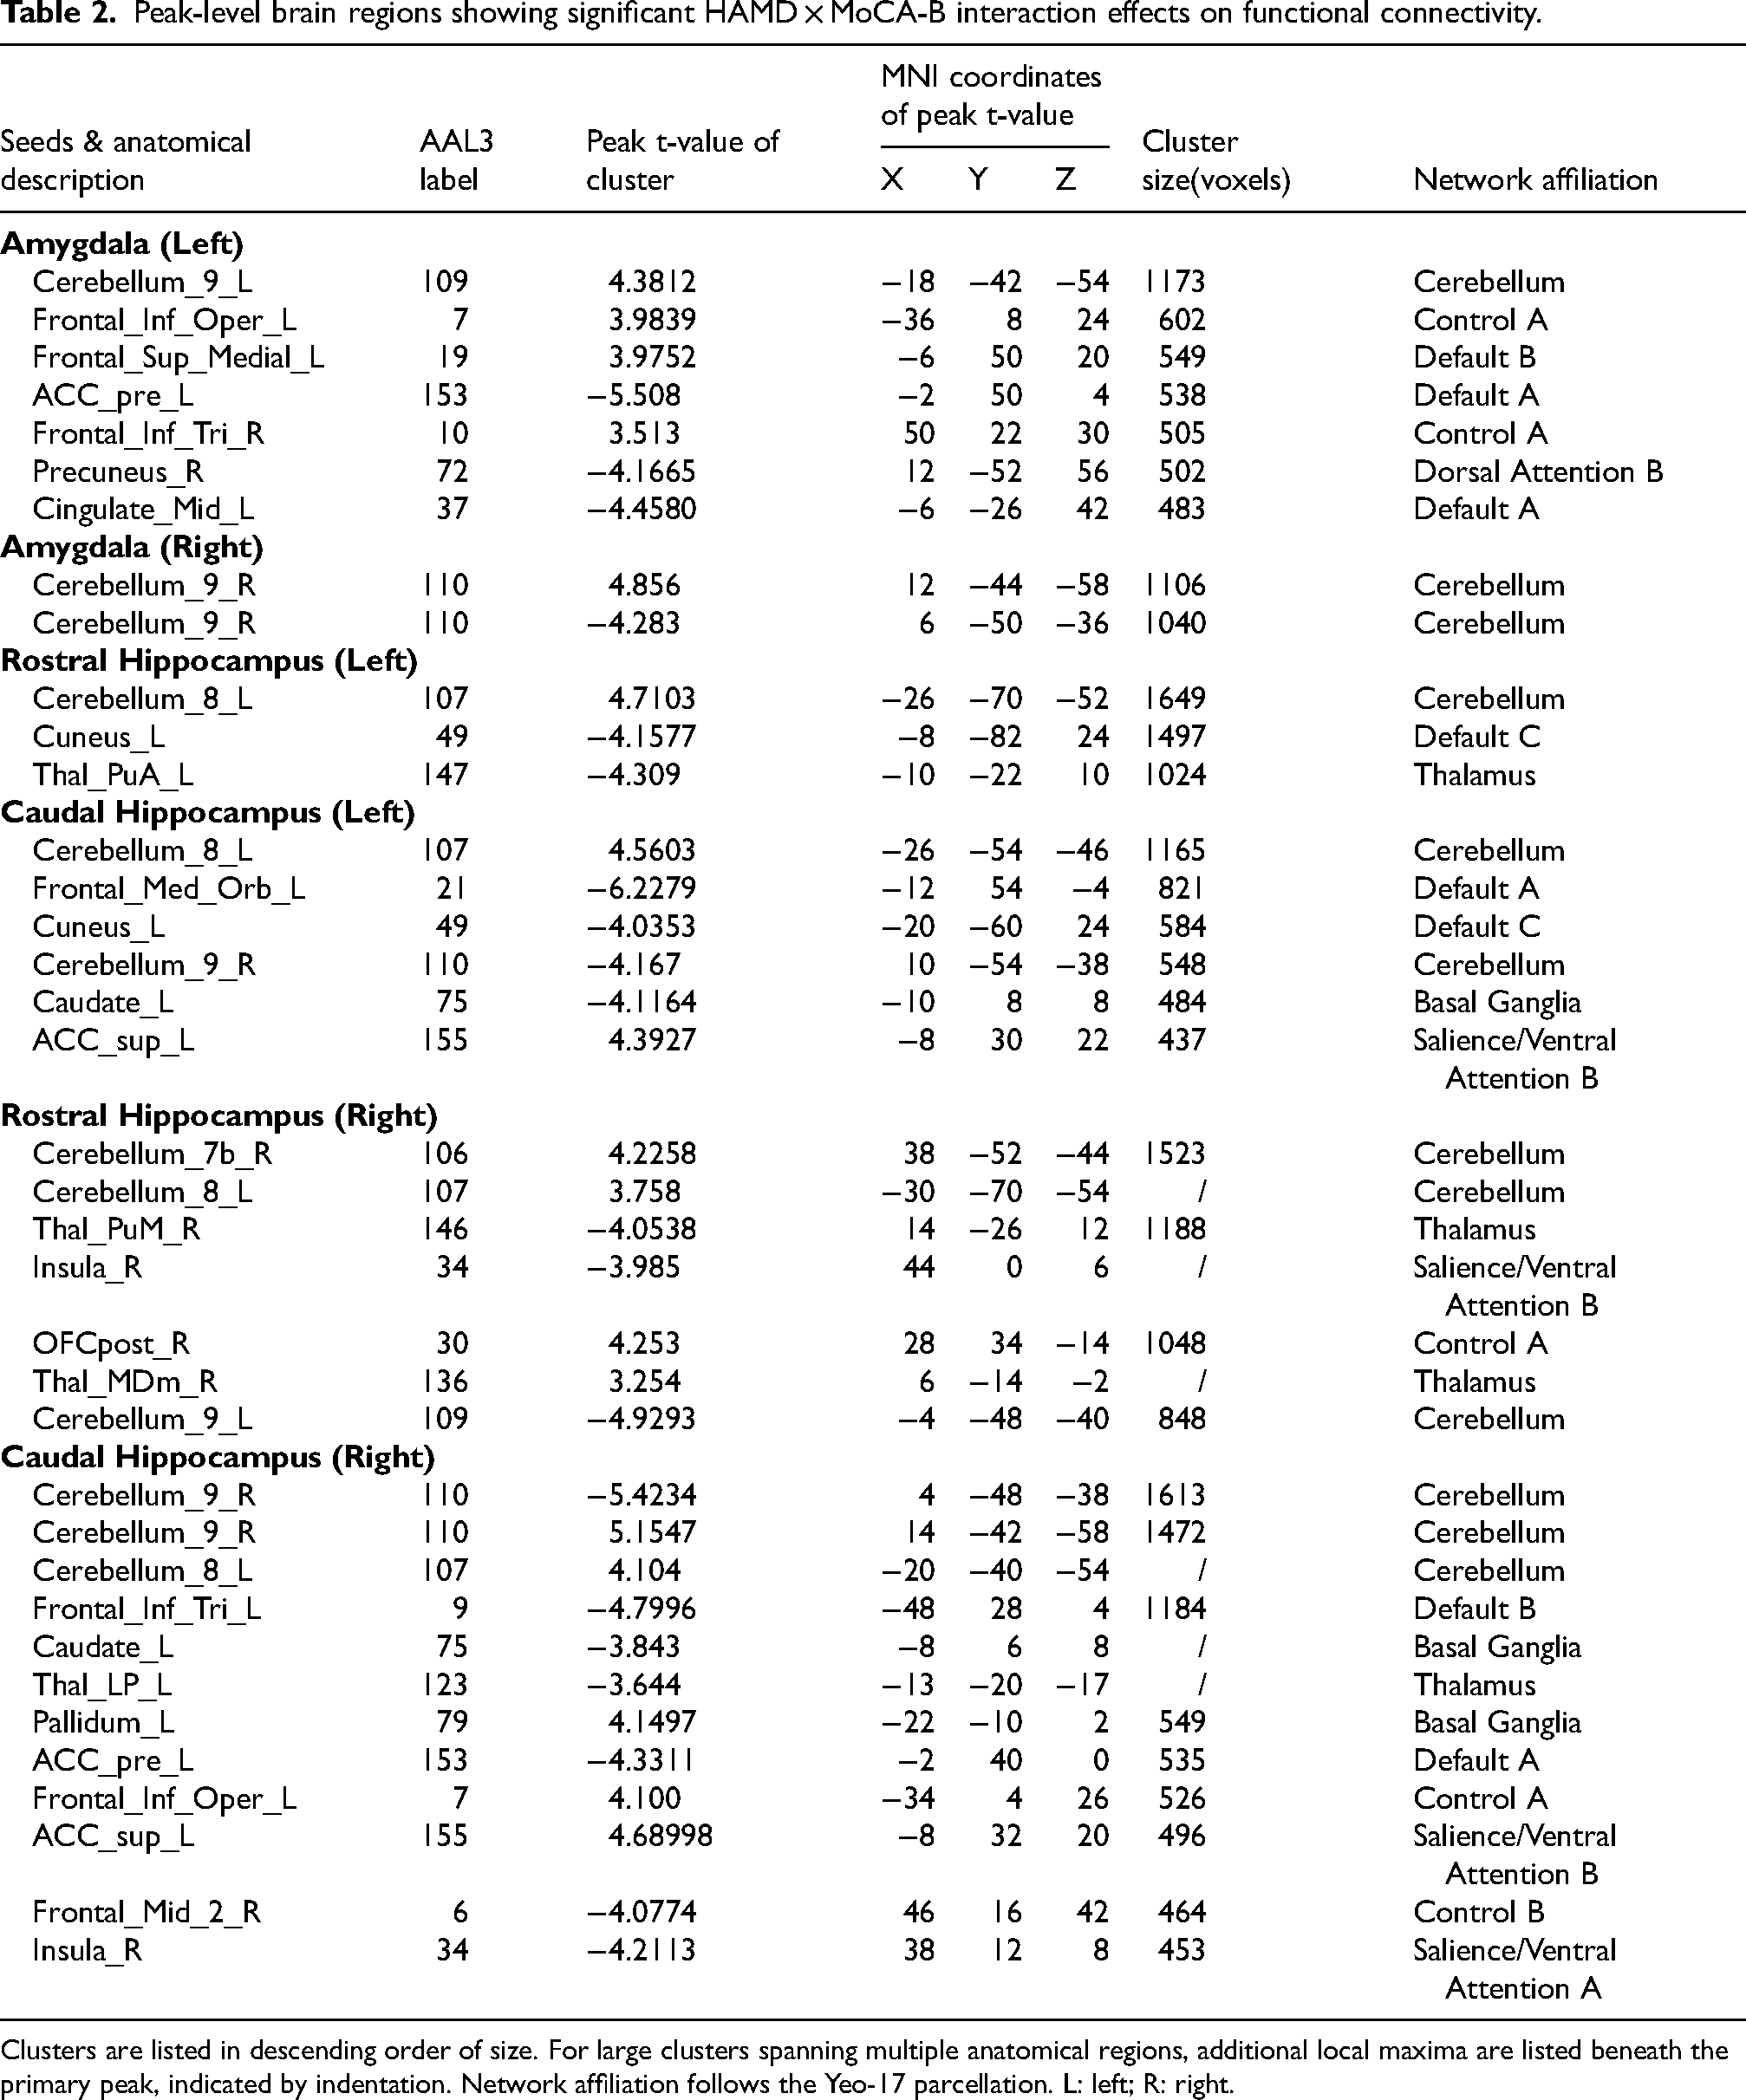
Clusters are listed in descending order of size. For large clusters spanning multiple anatomical regions, additional local maxima are listed beneath the primary peak, indicated by indentation. Network affiliation follows the Yeo-17 parcellation. L: left; R: right.
Simple slopes analysis
Amygdala-seeded FC
For left amygdala-seeded FC, positive-to-negative slope reversals (from HAMD<8 to HAMD≥8)occurred in anterior/medial superior frontal gyrus (ACC: (from t (94) = 2.18 to t (40) = -2.43), middle cingulate gyrus (from t(94) = 1.75 to t(40) = −2.82), and precuneus (from t (94) = 2.61 to t (40) = -1.98), while negative-to-positive transitions appeared in cerebellum (from t (94) = -2.58 to t (40) = 2.38) and bilateral IFGtri/ACC/medial superior frontal gyrus (from t(94) = −3.09 to t(40) = 2.41). Right amygdala-seeded FC showed positive-to-negative shifts in lower cerebellum (from t(94) = 2.69 to t(40) = −2.39) and negative-to-positive shifts in upper cerebellum (from t(94) = −1.68 to t(40) = 3.04) (Figure 3).
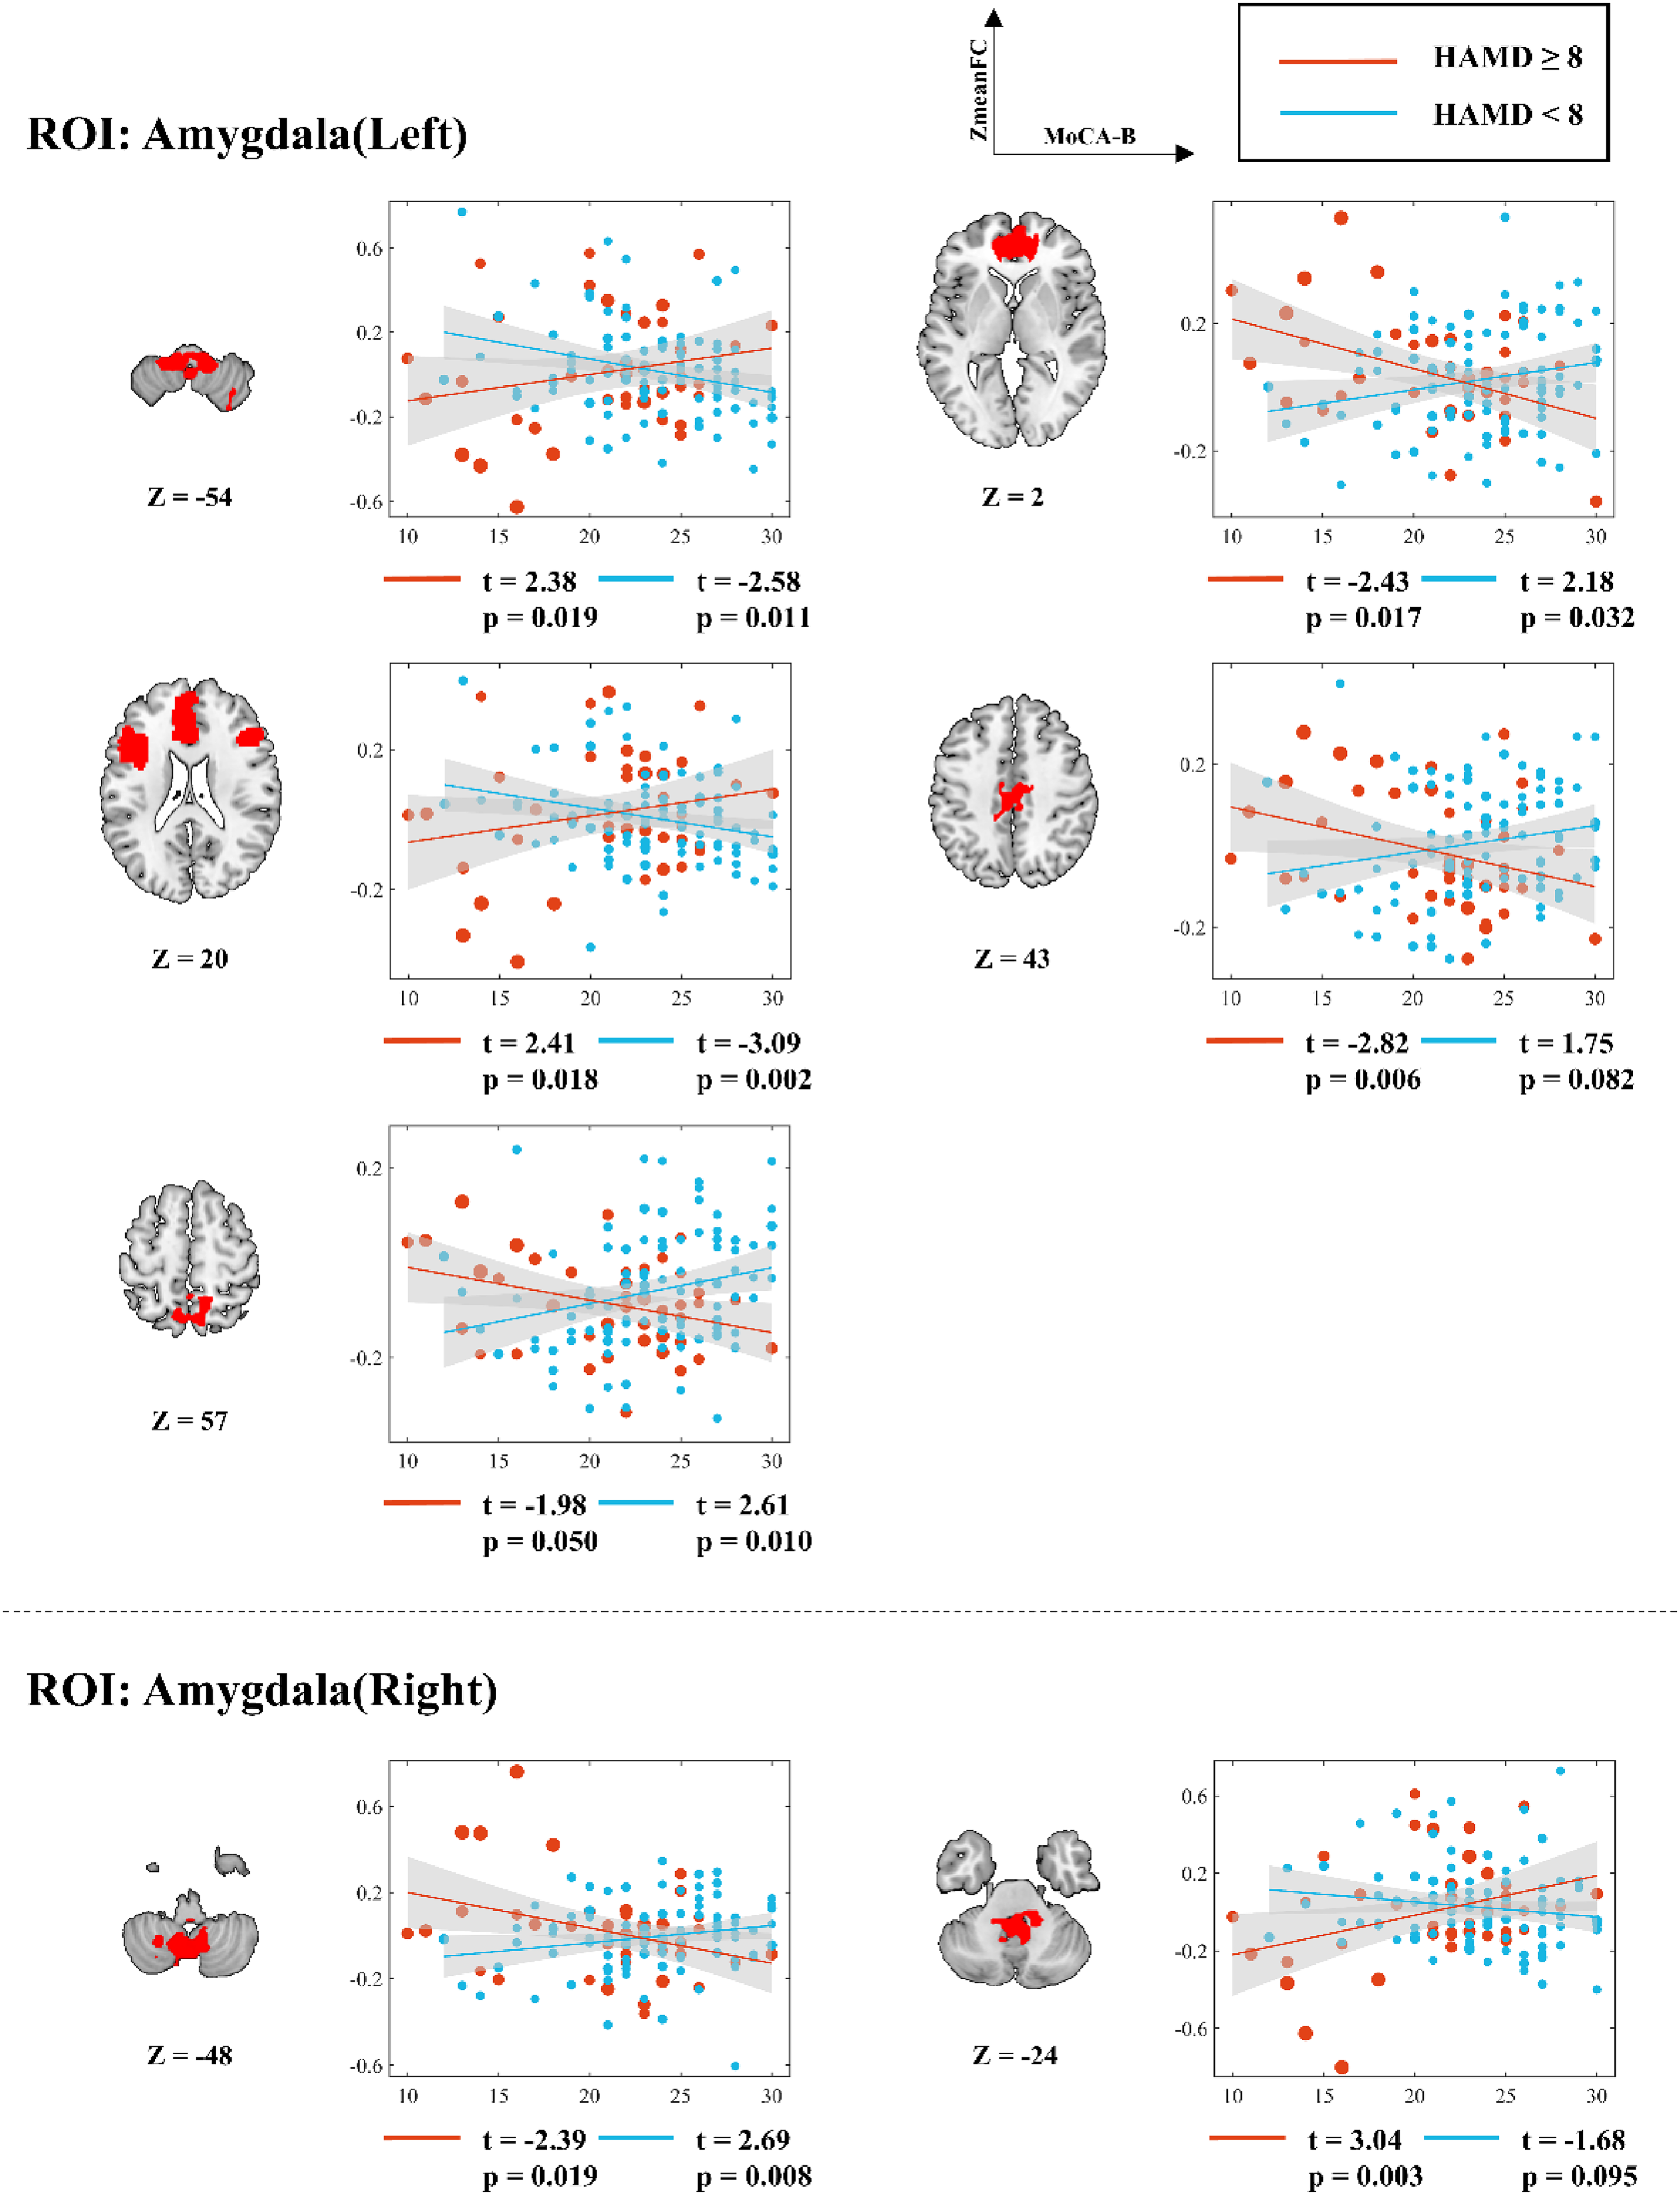
Simple slopes analysis of voxel mean value and MoCA-B score in the FC significant region of amygdala as the seed point under different HAMD score conditions. r: slope; t: t value; p: significance level.
Hippocampus-seeded FC
For left rostral hippocampus-seeded FC, positive-to-negative slope transitions (from HAMD<8 to HAMD≥8) were observed in thalamus (from t(94) = 1.42 to t(40) = −2.96) and cuneus/precuneus (from t(94) = 2.32 to t(40) = −2.4), while cerebellum showed negative-to-positive reversal (from t(94) = −2.62 to t(40) = 2.74). Left caudal hippocampus-seeded FC exhibited positive-to-negative shifts in: higher cerebellum (from t(94) = 2.59 to t(40) = −1.93), ACC/medial superior frontal gyrus (from t(94) = 2.63 to t(40) = −2.42), left thalamus/caudate (from t(94) = 2.69 to t(40) = −1.89), and anterior cuneus (from t(94) = 2.8 to t(40) = −1.08); negative-to-positive transitions occurred in lower cerebellum (from t(94) = −2.42 to t(40) = 2.14) and superior ACC (from t(94) = −2.19 to t(40) = 2.3) (Figure 4).
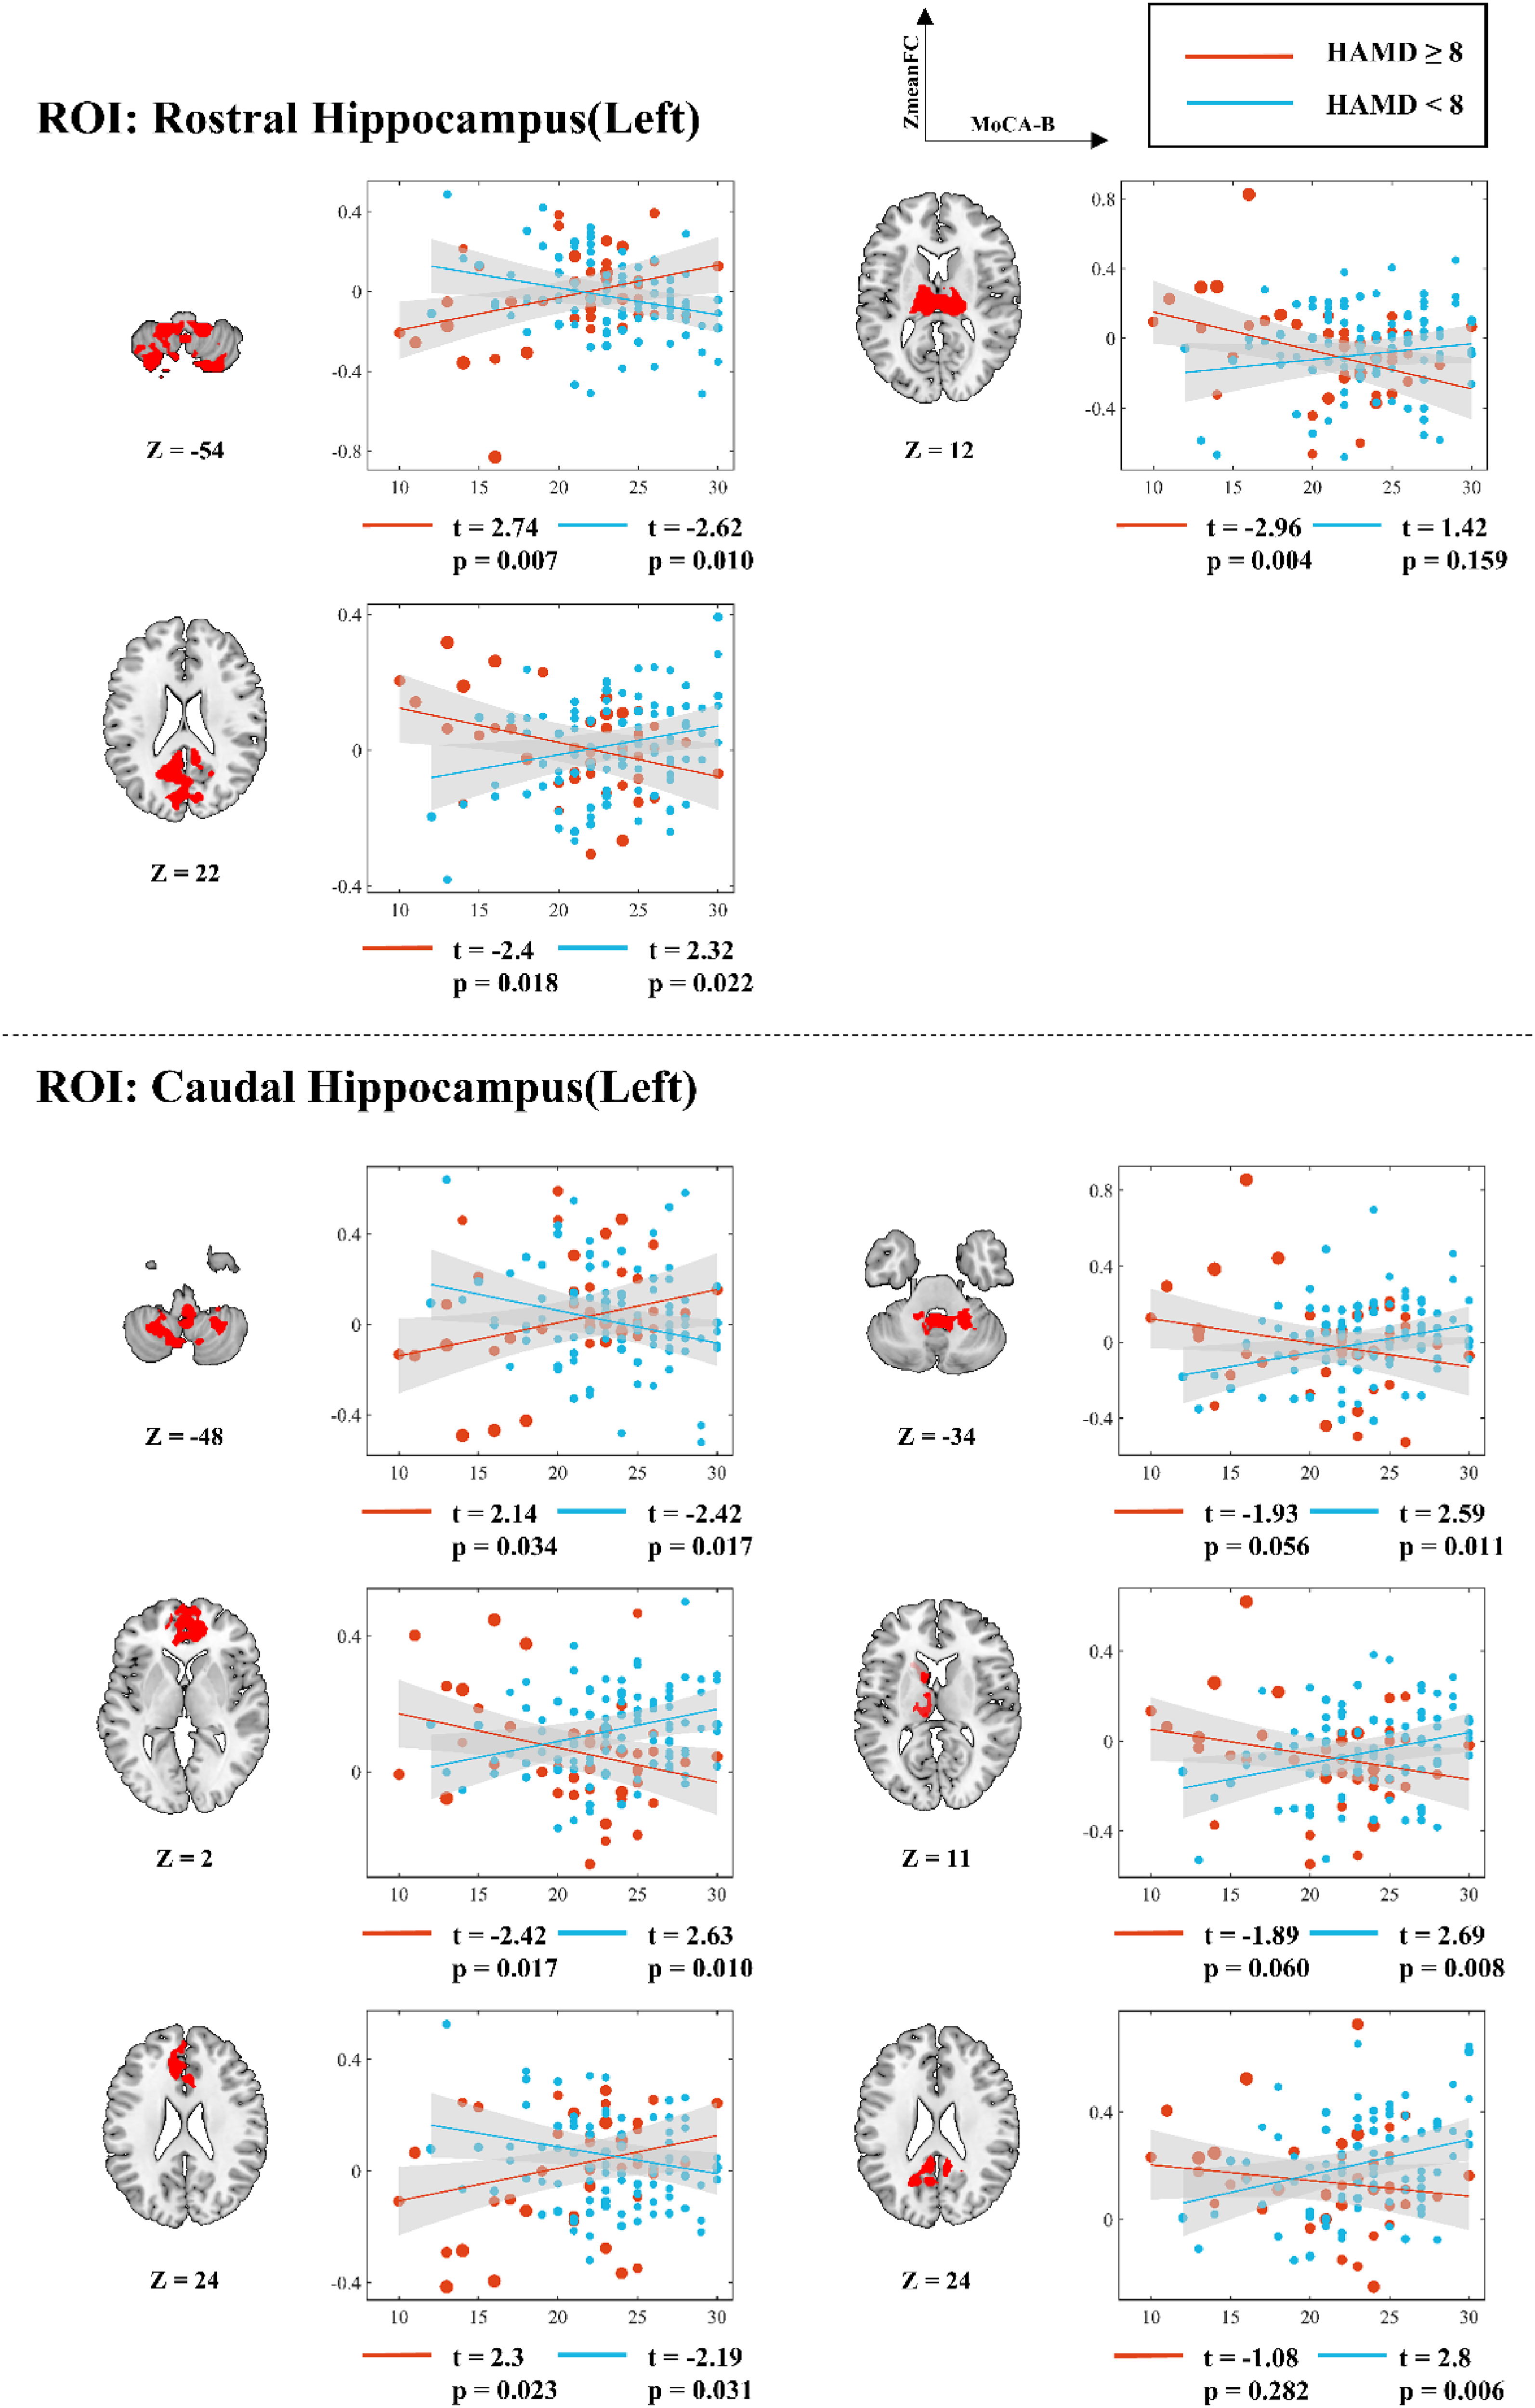
Simple slopes analysis of voxel mean value and MoCA-B score in the FC significant region of left hippocampus as the seed point under different HAMD score conditions. r: slope; t: t value; p: significance level.
Right rostral hippocampus-seeded FC demonstrated positive-to-negative changes in upper cerebellum (from t(94) = 3.02 to t(40) = −2.18) and bilateral thalamus/right insula (from t(94) = 1.13 to t(40) = −3.13), with negative-to-positive shifts in lower cerebellum (from t(94) = −1.38 to t(40) = 2.85) and OFC (from t(94) = −1.05 to t(40) = 4.46). Right caudal hippocampus-seeded FC showed positive-to-negative transitions in: upper cerebellum (from t(94) = 2.6 to t(40) = −2.67), bilateral insula/left IFGtri/ACC (from t(94) = 2.11 to t(40) = −3.00), and right medial frontal gyrus (from t(94) = 1.47 to t(40) = −3.66); negative-to-positive changes appeared in lower cerebellum (from t(94) = −1.84 to t(40) = 2.85), thalamus (from t(94) = −0.851 to t(40) = 4.10), and superior ACC/medial frontal gyrus (from t(94) = −2.15 to t(40) = 2.23) (Figure 5).
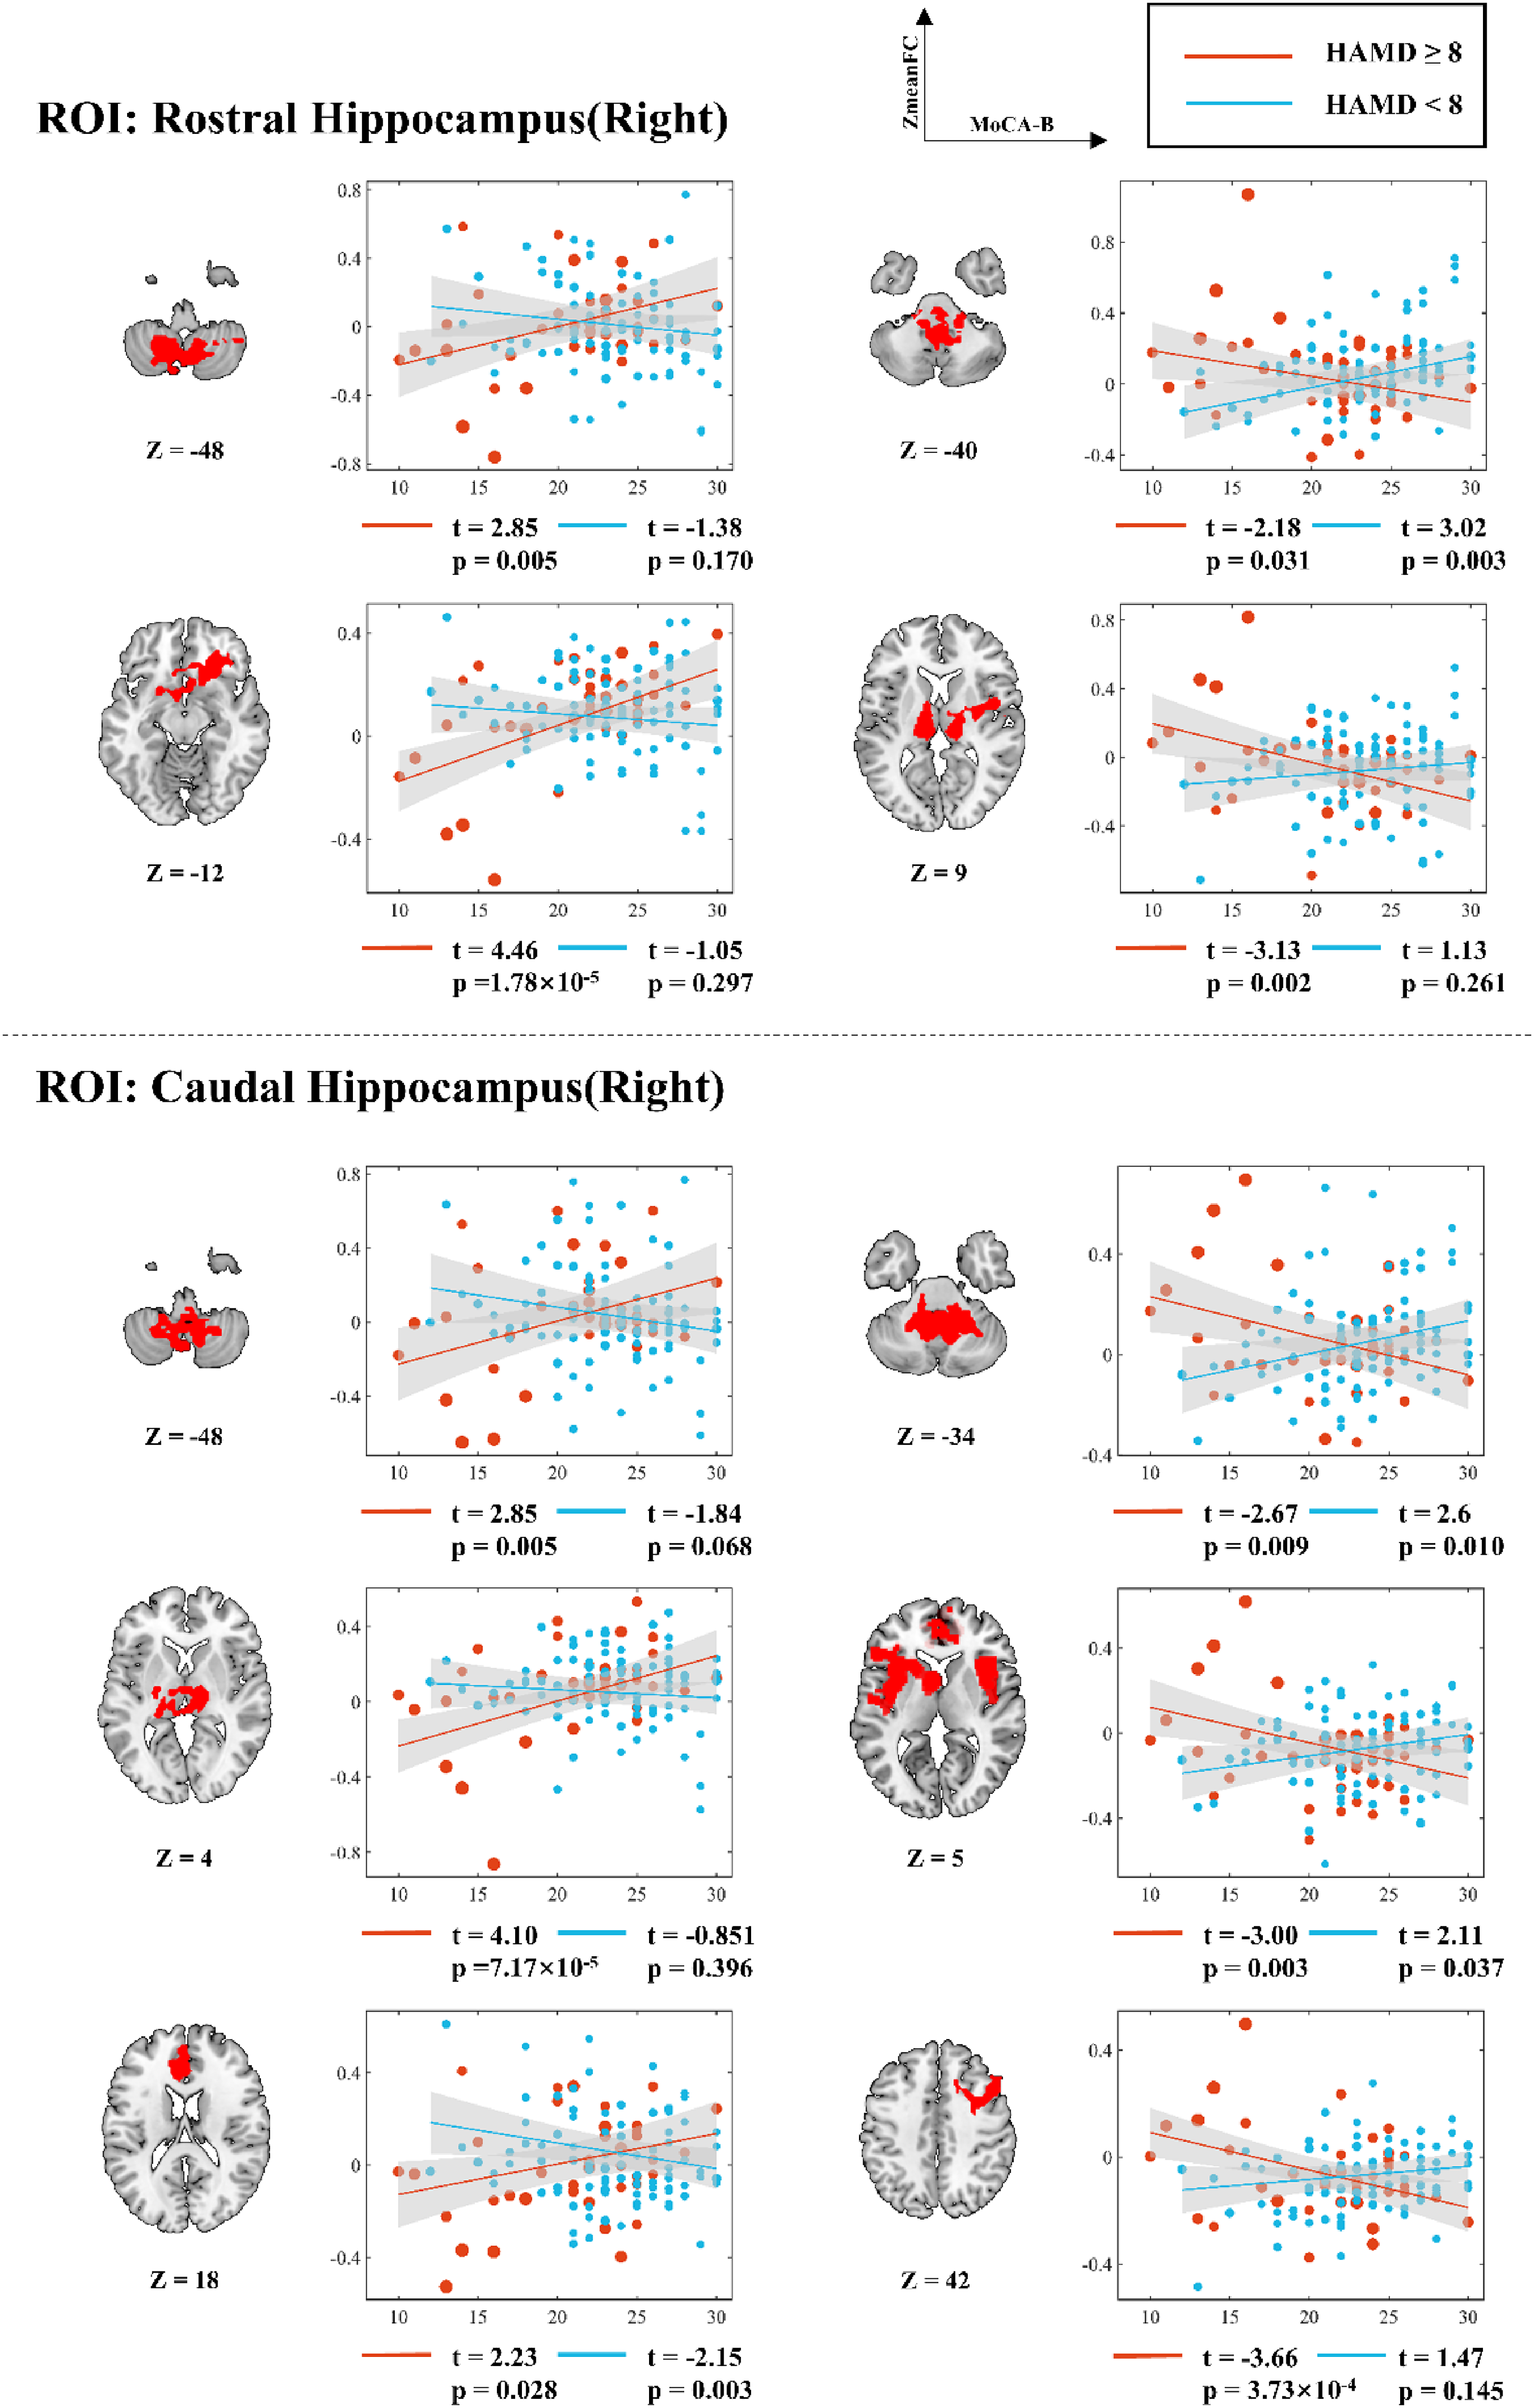
Simple slopes analysis of voxel mean value and MoCA-B score in the FC significant region of right hippocampus as the seed point under different HAMD score conditions. r: slope; t: t value; p: significance level.
Discussion
Our findings confirmed the hypothesized non-monotonic relationship between cognitive function and FC in MCI, moderated by depressive symptom severity. Specifically, the cognition-FC relationships reversed with increasing depressive symptom severity, revealing connectivity patterns for amygdala versus hippocampal pathways. These symptom-dependent shifts identified the IFG (triangularis and opercularis) and cerebellum (lobules VIII and IX) as critical hubs for neural reorganization, suggesting a potential compensatory response to maintain cognitive function amidst affective burden.
Depressive symptom modulation of amygdala-FPN circuits
The amygdala plays a critical role in processing emotions, and its dysfunction implicated in depression.39,40 Our seed-based analysis revealed depressive symptom-dependent alterations in amygdala connectivity with key FPN regions—specifically, the IFG triangularis (FPN-A) and precuneus (FPN-C).38,41,42 A central finding was a symptom-dependent reversal in amygdala-FPN-A connectivity, which shifted from negative in individuals without depressive symptoms (HAMD < 8) to positive in those with depressive symptoms (HAMD ≥ 8). This severity-dependent reversal in MCI contrasts with the stable reduction in amygdala-IFG connectivity observed in depressed AD patients, 20 highlighting a distinct process in the prodromal stage.
We interpret this phenomenon within two mechanistic frameworks: adaptive neural plasticity versus pathological network inefficiency. We hypothesize that the emergence of positive connectivity under high depressive load may reflect compensatory reorganization, where the brain upregulates frontal-limbic circuits to maintain cognitive-emotional integration, a capacity that appears diminished in AD. 20 This view is consistent with the broader vulnerability of the FPN in MCI, 43 suggesting a critical, potentially adaptive interaction within a declining network. An alternative explanation is that it signifies maladaptive hyper-synchronization and declining efficiency. While our cross-sectional data preclude causal inference, the specificity and symptom-dependence of the pattern lead us to cautiously favor the compensatory hypothesis. Crucially, these interpretations carry divergent clinical implications: reinforcing such plasticity (e.g., via targeted neuromodulation) versus mitigating network stress (e.g., via aggressive depression treatment). Longitudinal studies are essential to resolve this.
Furthermore, depressive symptoms were associated with inverse amygdala-FPN-C connectivity-cognition relationships, suggesting symptom-mediated disruption. This supports reports of FPN hypoconnectivity related to emotional symptoms in MCI,43,44 particularly in angular gyrus and precuneus, 45 and with precuneus dysconnectivity in depression.46,47
Additionally, our findings implicate the cerebellum within this circuitry. Amygdala-cerebellar connectivity correlated positively with cognition in MCI patients with depressive symptoms but negatively in those without depressive symptoms. This suggests cerebellar integration into a broader compensatory network during affective challenge. This is in line with reports of increased cerebellar regional homogeneity in depressed MCI 48 and fits the framework wherein cerebellar recruitment represents a prodromal-stage adaptive response before its functional capacity declines in later dementia. 49
Collectively, depressive symptoms in MCI appear to drive a multi-circuit reorganization, engaging frontoparietal and cerebellar nodes in an integrated effort to maintain cognitive-emotional homeostasis.
Depressive symptom modulation of hippocampus circuits
The hippocampus is integral to emotional and cognitive functioning. Our study revealed that depressive symptoms significantly modulate hippocampal connectivity across multiple functional networks. In the DMN, we observed reduced connectivity between the left hippocampus and key cortical regions (precuneus and ACC), consistent with previous reports of DMN dysfunction in depression50,51 and findings in amnestic MCI, 52 as well as positive DMN connectivity-depressive symptoms correlations in recurrent MDD. 53 Within the visual network, the cuneus demonstrated negative hippocampal-cuneus connectivity correlations under severe depressive symptoms, aligning with reported visual cortex abnormalities in MDD. 54 Similarly, depressive symptoms modulated ventral attention network (VAN) connectivity (insula/ACC-hippocampus) in relation to MCI cognition, supporting prior evidence linking VAN-hippocampus abnormalities to attention and memory deficits. 55 Notably, MCI patients showed a reversal from negative to positive hippocampal-limbic network correlations under depressive symptoms. This contrasts with the typical reduction in hippocampal-OFC connectivity observed in depression, 56 potentially indicating that depressive symptoms induce adaptive remodeling of hippocampal-limbic coupling to reduce emotional interference on cognitive processing. Furthermore, depressive symptoms modulated both right insula-hippocampus connectivity in somatomotor network (SMN) and IFG (IFGop/IFGtri)-hippocampus connectivity in FPN-A, with severity-dependent directional reversals observed in each network. These findings are supported by established evidence demonstrating that altered effective connectivity in sensorimotor cortices characterizes depression severity and clinical course. 57 The cerebellum also exhibited depression-related connectivity changes, reflecting its well-documented involvement in both emotional and cognitive processing, 58 in agreement with prior reports of hippocampal-cerebellar alterations in MDD.22,59,60 Collectively, these results suggest that depressive-cognitive interactions manifest as decreased left hippocampal-DMN/visual network and right hippocampal-SMN connectivity, alongside increased right hippocampal-limbic network/FPN-A connectivity.
Depressive symptom-mediated reconfiguration of FPN and cerebellar circuits
Our results demonstrated that depressive symptoms in MCI individuals induce a directional reversal of hippocampal/amygdala-FPN-A connectivity-cognition relationships from negative to positive correlations. This identifies FPN-A (particularly IFGop and IFGtri) as a critical hub for emotional—cognitive integration. While the IFG typically supports cognitive control functions 61 and shows task-related hypoactivation in depression, 62 our observed resting-state hyperconnectivity concurs with evidence that IFG stimulation enhances cognitive flexibility in healthy adults. 63 This suggests that in MCI with depressive symptoms, the IFG may compensate for local processing deficits through increased network-level connectivity. Concurrently, depression-modulated cerebellar connectivity with hippocampal/amygdala circuits was observed through established pathways, revealing its role in limbic balance regulation. These findings suggest that depressive symptoms may contribute to functional reorganization in both IFG and cerebellar circuit in MCI patients. This potentially adaptive mechanism could be selectively targeted using neuromodulation approaches to simultaneously address both affective and cognitive symptoms. 64
Our identification of IFG subregions (IFGop/IFGtri) and cerebellar lobules (VIII/IX) as critical hubs could serve as a framework for future neuromodulation approaches (e.g., TMS, tDCS), while also highlighting inherent challenges. Conventional non-invasive brain stimulation techniques face limitations in spatial resolution and may struggle to selectively engage such focal or deep-seated targets without affecting adjacent regions, a difficulty compounded by inter-individual anatomical variability.65,66 Crucially, our findings help sharpen the focus for potential interventions by pinpointing these specific subregions as key nodes. Furthermore, the observed symptom-dependent reversal in connectivity-cognition relationships provides a potential functional biomarker for patient stratification. This mechanistic insight lays a theoretical foundation for future studies aiming to develop targeted neuromodulation strategies specifically for the subgroup of MCI patients exhibiting this distinct neurobiological profile associated with depressive symptoms.
Limitation
There are some limitations in this study. First, the cross-sectional design precludes causal or temporal inferences regarding the observed “directional reversal” in hippocampal/amygdalar-FPN-A connectivity. Thus, we cannot determine whether this pattern represents compensatory adaptation or pathological progression. A more cautious interpretation is warranted, as the observed connectivity shifts may reflect state-dependent changes, pre-existing vulnerability traits, or their combination. Future longitudinal studies are needed to track these patterns over time. Second, the clinical scales used (HAMD, MoCA-B) measure syndromal severity rather than the specific cognitive/affective functions most directly linked to amygdala and hippocampal operations. Thus, while our findings link symptoms to network connectivity, they do not clarify the role of these discrete neural functions. Future studies should integrate task-based fMRI with domain-specific assessments to address this. Third, several potential confounders were not assessed, including depression chronicity (e.g., first episode versus recurrent), sleep quality, vascular risk factors, and, in female participants, menopausal status/hormonal levels. Without data on depression chronicity, we cannot determine whether the observed connectivity reversals are driven primarily by current symptom severity or are modulated by the cumulative burden of past episodes. This distinction is important for interpreting these connectivity patterns. Future studies should incorporate detailed clinical histories to address this question, as well as measures of sleep, vascular health, and menopausal status to control for their potential confounding effects. Fourth, the clinical heterogeneity of MCI was not addressed, as we did not stratify analyses by subtype (e.g., amnestic versus non-amnestic). Whether our findings generalize across all MCI subtypes remains to be examined. Finally, while we controlled for major demographic variables, the potential confounding effect of pharmacological treatment in some participants cannot be fully excluded, underscoring the need for replication in medication-naïve cohorts. Complementary multimodal imaging, including white matter hyperintensity assessment, would also provide valuable structural context in the future.
Conclusion
This study suggests that depressive symptoms modulate hippocampal and amygdalar FC relationships with cognition in MCI, as shown by significant HAMD × MoCA-B interactions. Our findings suggest that FPN-A's connectivity reorganization may serve compensatory functions, while cerebellar changes reflect its role in affective-cognitive balance. The convergence of these mechanisms suggests that FPN-A and cerebellar may serve as candidate targets for neuromodulation interventions in future longitudinal studies.
Supplemental Material
sj-docx-1-alz-10.1177_13872877261462932 - Supplemental material for Depressive-cognitive interactions modulate amygdala and hippocampus functional connectivity in mild cognitive impairment
Supplemental material, sj-docx-1-alz-10.1177_13872877261462932 for Depressive-cognitive interactions modulate amygdala and hippocampus functional connectivity in mild cognitive impairment by Wei Jian, Haiyang Sun, Yulin He, Xinru Lan, Li Dong, Ziqi Wang, Sisi Jiang, Qingyan Cai, Hongyi Li and Dezhong Yao in Journal of Alzheimer's Disease
Footnotes
Acknowledgements
The authors have no acknowledgments to report.
Ethical considerations
This study was performed in line with the principles of the Declaration of Helsinki. Approval was granted by the Ethics Committee of the fourth people's hospital of Chengdu.
Consent to participate
Written informed consent for publication was obtained from all participants. For participants with mild cognitive impairment, consent for publication was confirmed by their legal guardians/family members to ensure complete understanding and agreement.
Consent for publication
Not applicable
Author contribution(s)
Funding
The authors disclosed receipt of the following financial support for the research, authorship, and/or publication of this article: This work was supported by Brain Science and Brain-like Intelligence Technology- National Science and Technology Major Project (grant number 2022ZD0208500), the CAMS Innovation Fund for Medical Sciences (grant number 2019-I2M-5-039), the National Natural Science Foundation of China (grant number 82201628), Sichuan Science and Technology Program (grant number 2026NSFSC0970) and Chengdu Medical Research Project (grant number 2021381).
Declaration of conflicting interests
The authors declared no potential conflicts of interest with respect to the research, authorship, and/or publication of this article.
Data availability statement
The raw MRI datasets are not publicly available to protect participant privacy, as required by the ethics committee and participant consent forms. De-identified functional connectivity matrices and demographic data supporting the findings of this study are available from the corresponding author, Dezhong Yao, upon reasonable request. Requestors will need to sign a data access agreement.
Supplemental material
Supplemental material for this article is available online.
References
Supplementary Material
Please find the following supplemental material available below.
For Open Access articles published under a Creative Commons License, all supplemental material carries the same license as the article it is associated with.
For non-Open Access articles published, all supplemental material carries a non-exclusive license, and permission requests for re-use of supplemental material or any part of supplemental material shall be sent directly to the copyright owner as specified in the copyright notice associated with the article.