






Abstract
Background
A scalable, objective measure of cortical function that differentiates Alzheimer's disease (AD) from other causes of cognitive impairment is still lacking. Transcranial magnetic stimulation combined with electroencephalography (TMS–EEG) enables direct assessment of cortical reactivity.
Objective
To test whether left primary motor cortex (M1L) P30 amplitude captures AD-related excitability changes, distinguishes biomarker-confirmed AD patients from controls (CN) and from other non-AD causes of cognitive impairment.
Methods
Ninety participants underwent M1L TMS-EEG with Delphi-MD: biomarker-confirmed AD (n = 22), other cognitively impaired (n = 27: vascular/mixed n = 12; frontotemporal dementia n = 4; unknown etiology n = 11), and CN (n = 41).
Results
P30 differed across biomarker-confirmed AD, other cognitively impaired, and CN (Quade F(2,80) = 4.989, p = 0.009, ηp2 = 0.11). Pairwise tests showed higher P30 in biomarker-confirmed AD versus other cognitively impaired (t = 2.117, p = 0.037, d = 0.61) and versus CN (t = 3.14, p = 0.002, d = 0.80). Among 27 clinically suspected AD tested for biomarkers, P30 was higher in biomarker + (22/27) versus biomarker− (5/27) (p = 0.035, d = 0.98), had good discriminatory performance for biomarker-confirmed AD (ROC = 0.853 [95% CIboot 0.627–1.000], p < 0.001), and was not associated with cerebrovascular changes (p = 0.455, d = 0.24).
Conclusions
P30 amplitude is elevated in biomarker-confirmed AD relative to CN and other causes of cognitive impairment, aligning with amyloid-associated cortical hyperexcitability. These findings support P30 as a promising, non-invasive physiological biomarker to aid differential diagnosis and, potentially, disease monitoring in AD.
Trial registry name and URL: https://clinicaltrial.health.gov.il/clinicaltrials/?MOHResearchId=MOH_2022-04-13_010726
Introduction
Alzheimer's disease (AD) remains the most common cause of dementia and a formidable public-health challenge as populations age. Over the past decade, diagnostic strategies have evolved from purely clinical assessments to biology-informed frameworks integrating cerebrospinal fluid (CSF) biomarkers, amyloid/tau positron emission tomography (PET), structural and functional magnetic resonance imaging (MRI), and emerging blood-based biomarker assays. 1 These advances have enhanced early detection and therapeutic targeting, yet a widely adopted, direct, noninvasive, and scalable measure of cortical function, one that captures real-time neurophysiological integrity, remains lacking. Such a measure could meaningfully complement molecular biomarkers by reflecting the systems-level impact of amyloid–tau pathology on neuronal network operations.
Transcranial magnetic stimulation combined with electroencephalography (TMS–EEG) offers exactly this window into cortical physiology. By applying a brief, focal magnetic pulse and recording the ensuing TMS-evoked potentials (TEPs), TMS–EEG quantifies amplitude, latency, and propagation of cortical responses with excellent temporal precision and without reliance on peripheral pathways. 2 TEPs reflect the spatiotemporal dynamics of cortical responses to a focal perturbation, providing a direct measure of cortical excitability and effective connectivity. Early components (e.g., P30, N45) are thought to index local cortical activation and excitatory/inhibitory balance, whereas later components (e.g., N100, P180) are associated with intracortical inhibition and distributed network processing. As such, TEPs offer a unique window into both local and network-level neurophysiological function. 3 TEPs have shown great potential for real-time measurement of brain neurophysiology in various clinical indications, 4 with significant advancement over the past few years. 5 TEP components (e.g., P30, N45, P60, N100, P180) are thought to reflect excitatory-inhibitory balance, cortico-cortical loops, and thalamo-cortical interactions, dynamics that are likely disrupted in AD. 6 TMS-EEG has demonstrated potential in predicting amnestic mild cognitive impairment (MCI) patients who would convert to dementia from those who would not in a small longitudinal study. 7
Initial studies using TMS–EEG in AD reported altered cortical excitability and connectivity. For example, two studies demonstrated differences of P30 amplitude in AD compared to controls in both motor network 8 and frontal regions stimulation. 9 Bagattini et al. (2019) found that the amplitude of the P30 component, originating in the right superior parietal cortex, predicted both Mini-Mental State Examination (MMSE) scores and face-name associative memory performance, with higher P30 amplitudes indicating greater cognitive impairment. 10 Similarly, Julkunen et al. (2008) observed that P30 amplitudes in MCI were intermediate between those of healthy controls (HC) and AD patients, supporting an MCI-to-AD continuum. 11 More recent work by Tautan et al. (2022) applied machine-learning classifiers on time-domain TEP features, including early amplitudes around the P30 window, and reported high accuracy in distinguishing AD patients from HC. 12 Similarly, several other studies, probing different stimulation sites, have shown that P30 amplitude resulting from dorsolateral prefrontal (DLPFC), 13 precuneus, 14 and M1 stimulation 15 is increased in AD compared to controls. Several studies have demonstrated that a higher P30 amplitude correlated with cognitive decline10,14 with one study providing evidence for correlation of P30 in response to PC and PCC stimulations with Aβ and p-Tau concentration extracted from CSF. 16
In summary, most publications utilizing TEPs for AD, suggest that P30 amplitude is elevated in AD compared to healthy aging, and possibly other dementia types, and correlates with disease severity and progression. If validated further, P30 may serve as an objective, noninvasive marker of cortical dysfunction, aiding differential diagnosis, monitoring disease trajectory, and assessing therapeutic engagement.
In this study, we build on this evidence by testing the hypothesis that M1 P30 amplitude is increased in biomarker-confirmed AD compared with CN, and test whether P30 can also differentiate between biomarker-confirmed AD and other non-AD causes of cognitive impairment. We also assess P30 utility as an objective, noninvasive index of cortical dysfunction with potential applications in diagnosis and longitudinal surveillance.
Methods
Study design settings
This cross-sectional study included individuals evaluated (N = 90) at the Stroke and Cognition Institute, Rambam Health Care Campus, a tertiary referral center located in Haifa, northern Israel.
Participants
Cross sectional data were collected from two groups. A group of patients (n = 49) attending the Institute for cognitive complaints and a group of controls (n = 41).
All patients with cognitive impairment (n = 49), underwent a standardized diagnostic workup conducted by a senior neurologist specializing in cognitive Neurology. Diagnosis of cognitive impairment was based on standard clinical criteria. 17
The work-up included: comprehensive medical and cognitive history, including characterization of cognitive symptoms, affective complaints, activities of daily living (ADL), and instrumental activities of daily living (IADL); a neurological examination; a cognitive or neuropsychological assessment; neuroimaging, biomarker testing as clinically indicated and physiological brain network assessment using a TMS-EEG platform (Delphi-MD).
AD was diagnosed in 22 patients, based on cognitive assessments supported by biomarker evaluation. 18
Patients clinically suspected of having AD (n = 29), underwent lumbar puncture for CSF biomarker assessment (T-tau, P-tau181, and Aβ42 collected with ELISA by EROIMMUN). Amyloid PET imaging was performed in a subset of patients. Biomarker positivity was defined as per manufacturer cut-off values: P-tau181 > 61 pg/mL and Aβ42 < 570 pg/mL (biomarker-confirmed AD, n = 22), otherwise classified as negative, and reclassified (n = 7). 18 Patients who underwent Amyloid PET alone and showed positive results were also included in the biomarker-confirmed AD group (n = 4).
Controls: The control (CN) group (n = 41) consisted of participants enrolled in a brain health study conducted at the Institute. According to the study protocol, participants had no known cognitive impairment and reported no significant cognitive complaints. All subjects completed questionnaires, cognitive screening tests, and a physiological brain health assessment using TMS-EEG. Controls were defined as individuals with a Montreal Cognitive Assessment (MoCA) score >24 19 ,20and no history of neurodegenerative disease.
Ethical statement
The study protocol was reviewed and approved by the Institutional Review Board (IRB) of Rambam Health Care Campus.
TMS-EEG procedure
TMS-EEG acquisition was performed with the Delphi-MD system version 1.0, including Delphi acquisition and analysis software (QuantalX Neuroscience), EEG compatible TMS stimulator and 65 mm figure 8 coil and an MCF-B65-HO figure-8 Coil (MagVenture, Denmark), TMS compatible DC coupled amplifier with sampling rate of 5 KHz (Delphi Amplifier, QuantalX Neuroscience Ltd) and 34-electrode cap with Ag\AgCl sintered electrodes (Delphi MCS cap, QuantalX Neuroscience Ltd). The reference and ground electrodes were affixed to the ear lobes.
All subjects included in the study underwent the same TMS-EEG evaluation. The left resting motor threshold (RMT) was obtained at the beginning of each session, by stimulating the left and right M1 and was defined as the intensity that produced a visible twitch in abductor policis brevis on 50% of stimulations. Visual RMT determination is a clinically practical method, that can be readily implemented in routine care, is supported by FDA-cleared methodologies. A 0.5 mm foam pad was attached to the magnetic coil and ear plugs were used to minimize electrode movement and bone-conducted auditory artefact. The magnetic coil was positioned over the left and right M1 at 45◦ toward the contralateral forehead according to guidelines, 21 Single-pulse (<0.3 Hz), with 85% of RMT intensity applied to the left primary motor cortex (M1L). A stimulation intensity of 85% RMT was chosen to reflect cortico-cortical and cortico-subcortical connectivity, while reducing contamination from peripheral feedback arising from corticospinal tract activation and associated limb motor responses. Data acquisition, pre-processing, and cleaning were performed automatically by the Delphi-MD software including automatic rejection of bad channels and epochs followed by an automated preprocessing pipeline performed with Delphi software 1.0.22–28 Participants were instructed to keep their eyes closed throughout the examination to reduce ocular artifacts. The operator of the system conversed with subjects between the short stimulation protocol blocks to prevent drowsiness.
TEP preprocessing
All preprocessing and quality control procedures were performed automatically by Delphi software (Ver 1.0). Preprocessing included filtering to an effective 1-45 Hz passband, 29 powerline noise removal and TMS decay artifact removal using ICA (Independent component analysis) decomposition.30–32 Electrooculography artifacts were corrected using Canonical correlation analysis which uses maximization of linear independence.33–35 Data segments with high noise levels were automatically detected through processing stages using thresholding in the temporal and spectral domains. Trials with excessive noise were discarded, and noisy channels were interpolated using data from neighboring channels. Datasets were excluded when trial rejection exceeded 30% or when insufficient spatial coverage remained. Real-time alerts were provided to the operator for datasets classified as insufficient or noisy.
TEP analysis
The Delphi algorithm automatically analyses the regional and network TEP recorded in response to a specific stimulation site and extracts numeric output of TEP features.22–28 These features include specific peak latencies, amplitudes, and slopes of typical negative and positive peaks detected automatically by the Delphi algorithm. In this study, we were interested in examining only the P30 amplitude, which was calculated as the mean absolute amplitude at 25–35 milliseconds in the contralateral electrodes: C4, C6, Cz and FC2 to stimulation. Contralateral electrodes were selected to capture the transcallosal inhibitory transmission to homologous cortex. 36
Statistical analysis
Comparison of proportions was done with Chi-square or Fisher's exact test as appropriate. Independent t-tests or one-way ANOVA were used to compare continuous measures such as age. Non-parametric Kruskal-Wallis was used to compare ordinal scales such as MoCA and MMSE. Continuous measures were evaluated for normality with the Shapiro-Wilk test. Quade non-parametric analysis of covariance was used to compare groups, with P30 as the dependent variable, Group as factor and Years of Education included as a covariate to adjust for its potential confounding influence. 37 Mann-Whitney analysis was used to establish differences between dichotomous group stratifications by MoCA score (≤19), cerebrovascular findings (positive/negative) and AD biomarker (positive/negative). A follow up ROC analysis was performed with 5000 bootstrap resamples to estimate AUC and 95% confidence intervals.
Analysis was performed with SPSS version 31.0, and plots were created with the GraphPad Prism version 10.0.
Results
Patient characteristics
The study included a total of 90 participants who underwent TMS-EEG. Of which, 22 were biomarker-confirmed AD, 27 were other cognitively impaired patients and 41 were CN. Biomarker-confirmed AD patients were defined by positivity for CSF P-Tau181 and Aβ42 with or without positive Amyloid PET, or positive Amyloid PET alone. 18 The other cognitively impaired group was composed of n = 12 vascular or mixed cognitive impairment, n = 4 frontotemporal dementia (FTD) and n = 11 unknown etiology.
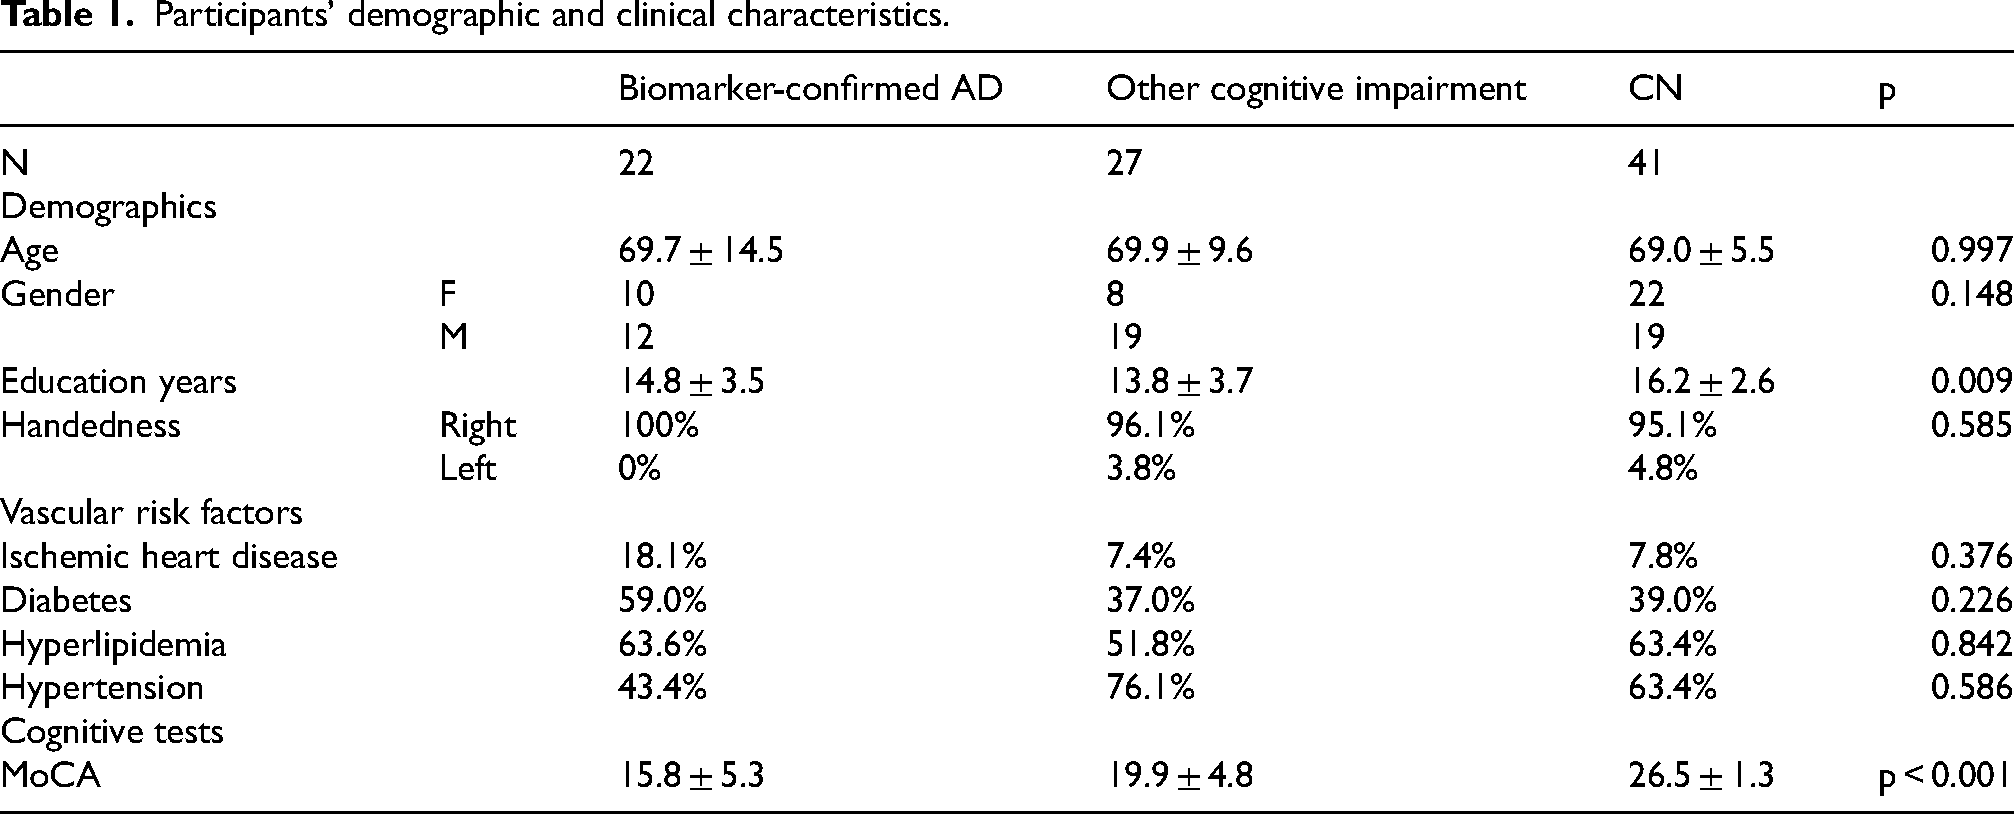
The groups demographically differed only in years of education (p = 0.009), derived by the CN group representing a more educated group. To account for this difference, all following comparisons of these groups included education as a covariate, as well as age and sex. The groups did not differ in age, sex, handedness, or any of the medical backgrounds relating to vascular risk factors. As expected, the groups differed in cognitive performance, with the cognitive impairment group demonstrating significantly lower cognitive scores (p < 0.001). Pairwise comparisons revealed that the CN MoCA scores were significantly higher than both the biomarker-confirmed AD and other cognitive impairment groups (p < 0.001, p < 0.001, respectively). See Table 1 for patients' characteristics.
Neurophysiological differentiation of dementia types
TMS-EEG measurements from M1L stimulation were used to measure the P30 amplitude, a marker previously shown to increase in AD. Since P30 amplitude displayed a non-normal distribution (Shapiro-Wilk p < 0.001) and group sizes were unbalanced, a non-parametric approach was taken. The three groups (biomarker-confirmed AD, other cognitive impairment, CN) displayed significantly different P30 amplitude (F (2,80) = 4.989, p = 0.009, ηp2 = 0.11) shown by Quade non-parametric ANCOVA while controlling for age, sex, and years of education. Pairwise comparisons revealed that biomarker-confirmed AD group P30 amplitude was higher compared to both the other causes of cognitive impairment groups and CN (t = 2.117, p = 0.037, d = 0.61; t = 3.14, p = 0.002, d = 0.8, respectively) (Figure 1A, B). P30 amplitude was not significantly different between other cause cognitive impairment groups and CN (t = 0.953, p = 0.344). Butterfly plots and scalp density maps of mean groups TEP responses are presented in Supplemental Figure 1.
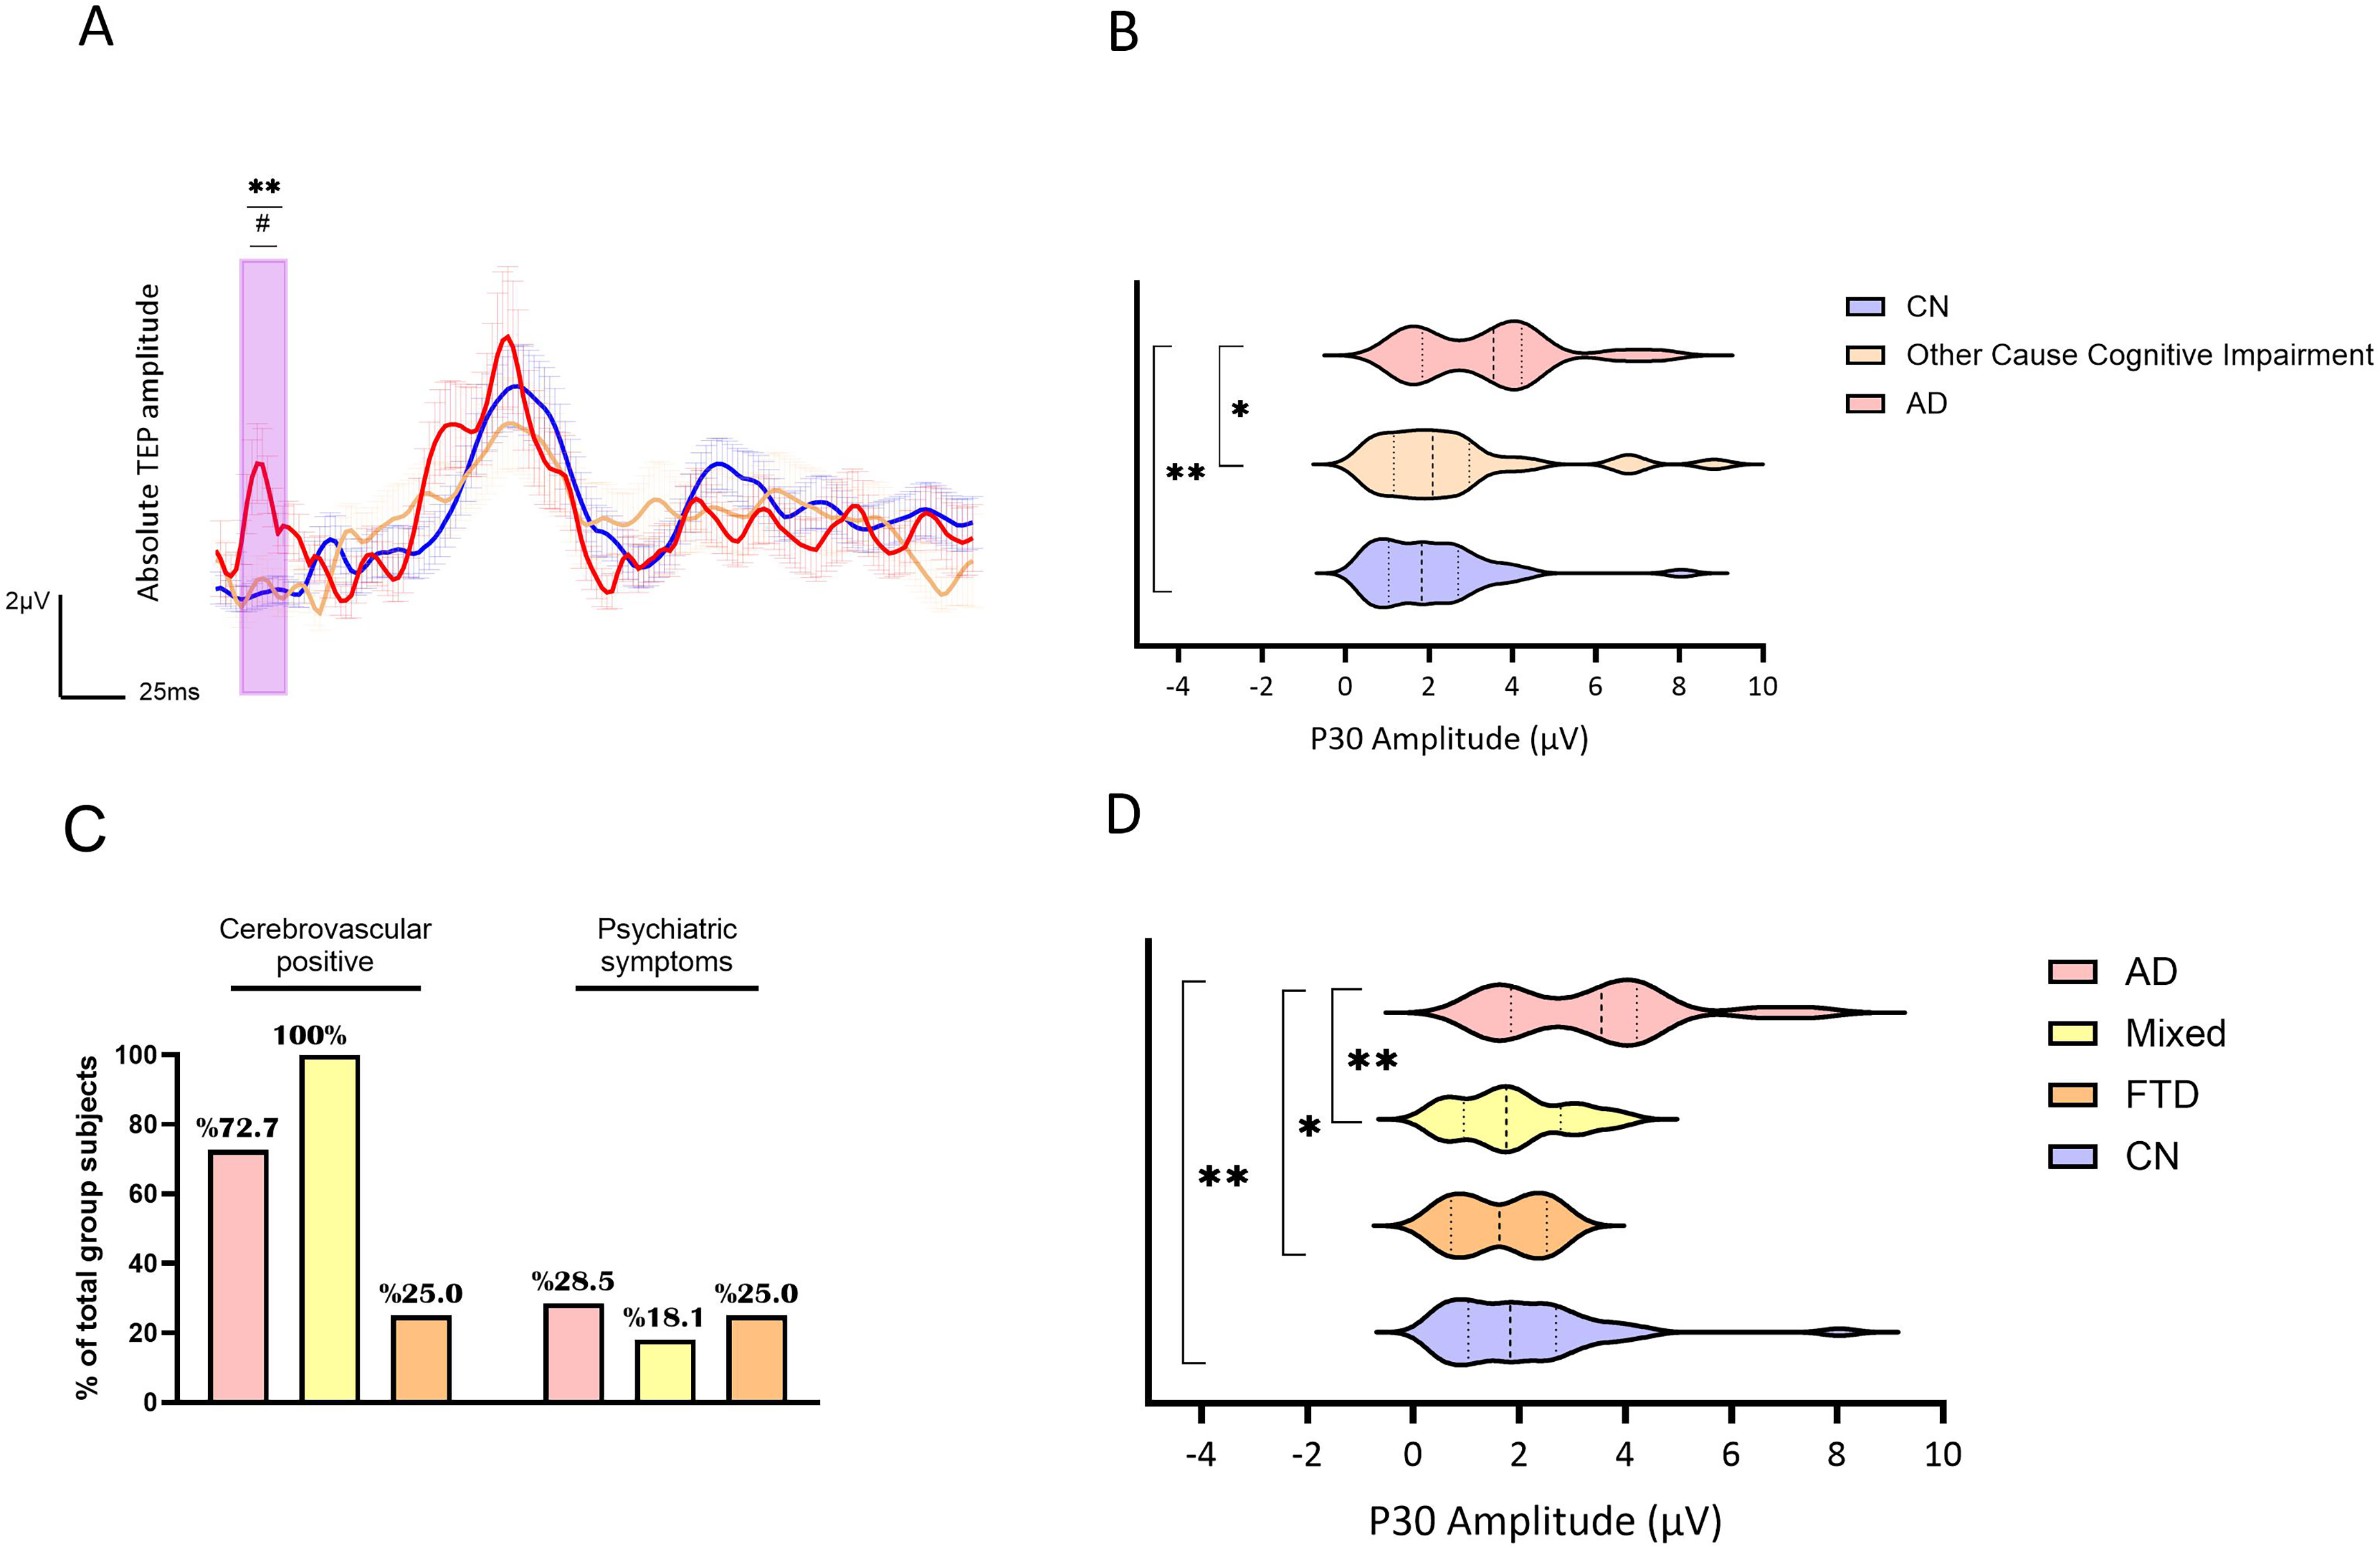
AD, Other Cause of cognitive impairment, and CN groups P30 amplitude and TEP waveform. Groups are represented by different colors: In red-AD, in beige- other cause of cognitive impairment and in blue- CN. A) Line plots of the groups’ averaged absolute TEP amplitudes (µV) and standard error of the mean (shaded) over time (milliseconds) following TMS pulse. Purple rectangle outlines the time frame of interest (TOI) compared. **p-value <0.01 between AD and CN, ##p-value <0.01 between AD and other cause of cognitive impairment. B) Violin plots presenting the groups mean P30 amplitude distribution. Thick dashed line represents median, thin dashed lines represent the interquartile range. **p-value<0.01. (Color figure online).
In order to understand whether a specific cause of cognitive impairment is driving the difference from AD, we conducted a follow-up analysis, where we divided other cognitively impaired types into FTD and mixed groups, and further compared them with biomarker-confirmed AD and CN, controlling for age, sex, and years of education. There was a significant difference in P30 amplitude between the groups (F (3,68) = 4.943, p = 0.004, ηp2 = 0.18). P30 amplitude was significantly higher in the biomarker-confirmed AD group compared to both mixed dementia and FTD groups as well as the CN group (t = 2.8, p = 0.007, d = 0.73; t = 2.16, p = 0.034, d = 0.51; t = 3.5, p = 0.001, d = 0.91 respectively) while the mixed and FTD groups did not differ from each other or from the CN (p = 0.812, p = 0.850, p = 0.699) (Figure 1D). Cerebrovascular findings by MRI/CT scan were evident in 73% of the biomarker-confirmed AD participants, 100% of the mixed pathology group and 25% of the FTD group (χ2 = 9.22, p = 0.01). Psychiatric symptoms were reported in 28.5% of the AD, 18.1% of the mixed pathology, and 25% of the FTD group (χ2 = 0.416, p = 0.812) (Figure 1C).
Link of TMS-EEG P30 with CSF biomarker status
A total of 49 cognitively impaired patients were stratified based on the presence or absence of cerebrovascular findings by imaging (CT/MRI), MoCA score (≤19 or >19) and Aβ status. P30 differentiated Aβ positive from Aβ negative patients (p = 0.035, d = 0.98) but did not differentiate between the presence or absence of vascular changes (p = 0.286, d = 0.24) or MoCA score (p = 0.790, d = 0.18) (Figure 2A, 2B, 2C), as indicated by Mann-Whitney U (Figure 2C). Further, in a ROC curve analysis, P30 amplitude discriminated biomarker-positive from biomarker-negative cases with AUC = 0.853 [95% CIboot 0.627–1.000], p < 0.001 (Figure 2D).
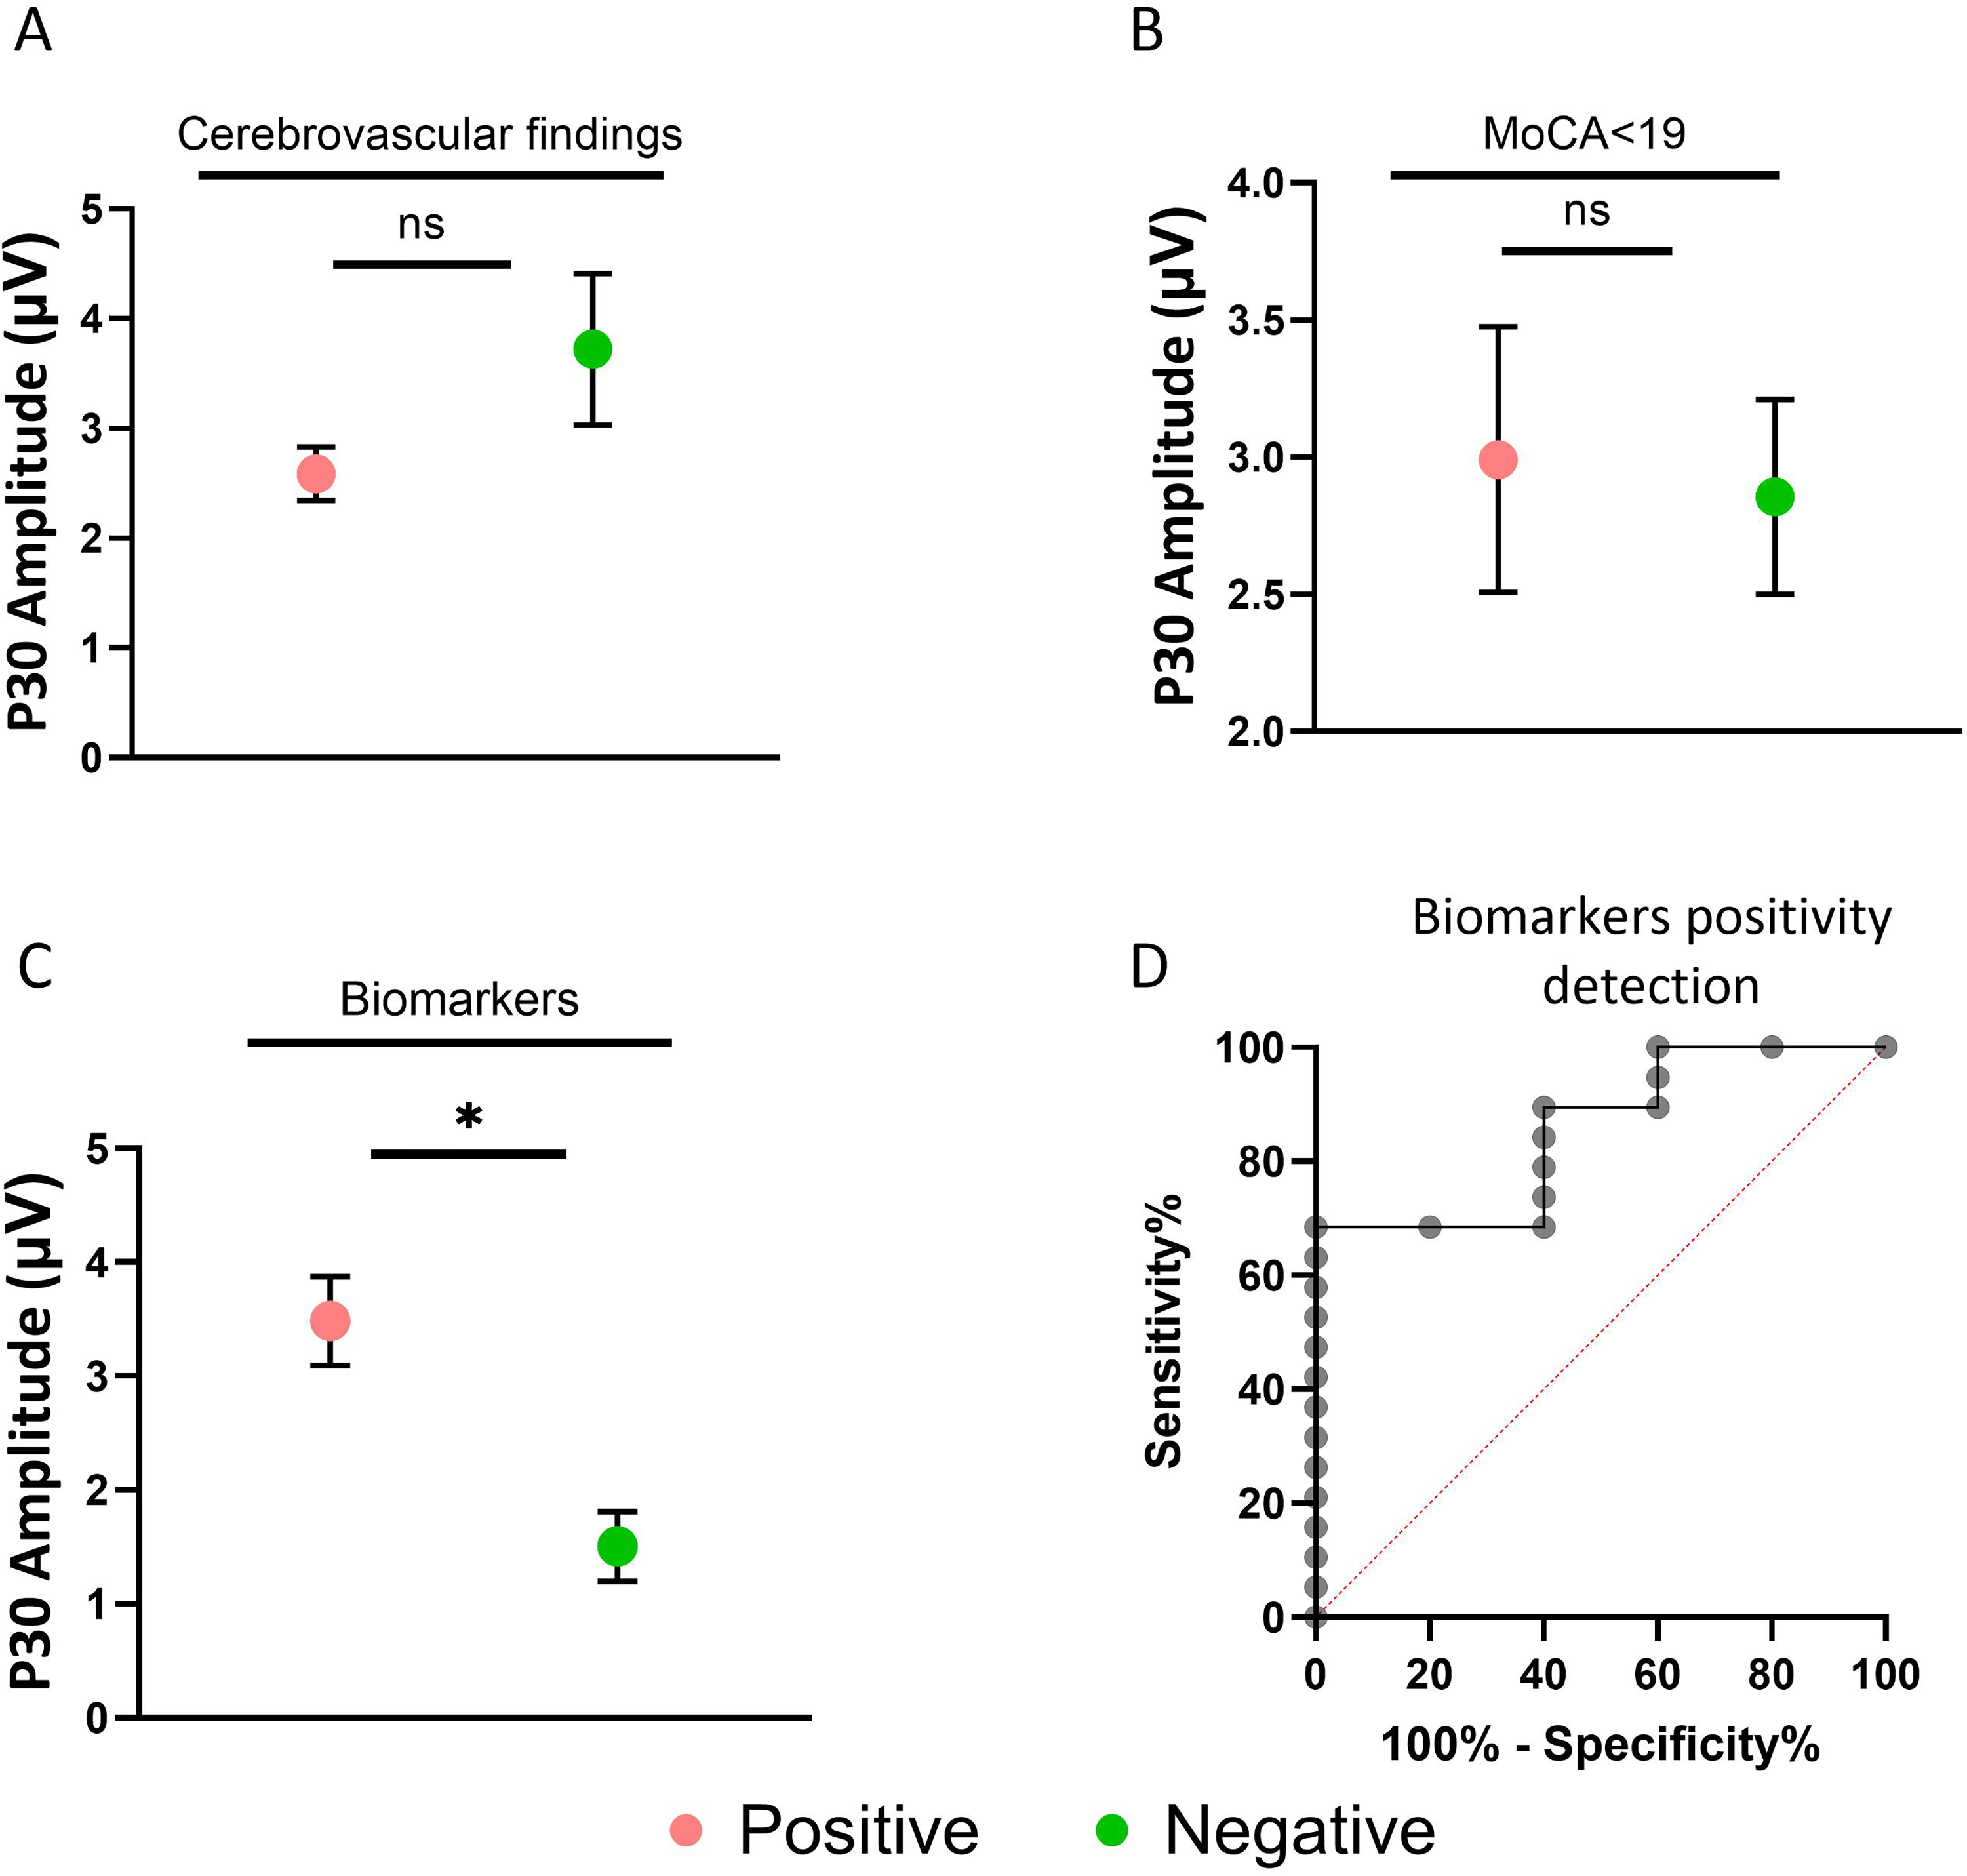
Comparisons of P30 amplitude among the cognitively impairment patients stratified based on a clinical feature. A) Cerebrovascular findings in CT/MRI: positive (green) versus cerebrovascular negative (red), B) Patients with MoCA score>19 (green) versus MoCA≤19 (red). C) Biomarkers Positive (green) cases versus biomarkers negative (red). D) ROC curve analysis describing P30 amplitude in discrimination of biomarkers positive cases versus biomarkers negative cases. (Color figure online).
Discussion
The main finding of this study is that the P30 component elicited by M1L stimulation using TMS-EEG is significantly increased in patients with biomarker-confirmed AD compared to controls and compared to patients with other non-AD cognitive impairment. This effect was observed both when non-AD etiologies were considered as a single group and when individual diagnostic categories were analyzed separately. Importantly, P30 differentiated biomarker-positive from biomarker-negative individuals and was not affected by cerebrovascular burden or cognitive impairment severity. Together, these findings indicate that early TMS-evoked cortical hyperexcitability, indexed by P30, is specifically associated with AD pathology rather than representing a nonspecific feature of neurodegeneration. These results support prior studies demonstrating cortical hyperexcitability in AD, specifically in P30 and other early TEP components. Our results further reinforce these results by demonstrating discrimination from other non-AD causes of cognitive impairment using P30.10,12,14,15
The finding of a higher M1L P30 in patients with biomarker-confirmed AD versus CN, aligns with one prior TMS–EEG study that also found heightened sensorimotor cortex excitability and altered connectivity in mild AD using M1L TMS–EEG co-registration 15 and several others relating to DLPFC.12–14 Importantly, the current study further identified that the increase in P30 may be specific to AD pathology. P30 was higher in AD compared to both CN and non-AD cognitive impairment, whereas the vascular/mixed and FTD groups did not differ from CN or from each other in P30. Prior TMS-EEG reports have focused mainly on AD versus CN.
Our cross-etiologic comparison suggests that amplified early cortical responses to motor stimulation are not a nonspecific feature of neurodegeneration but may instead reflect mechanisms preferentially engaged in AD pathology. It has been established that early AD is associated with lower resting and active motor thresholds, indicating increased cortical excitability. 38 These reductions have been positively correlated with motor cortex thickness, suggesting a link to cortical degeneration. 39
Furthermore, converging lines of evidence support a mechanistic connection between AD pathology and enhanced early TMS-evoked responses. Soluble Aβ oligomers disrupt inhibitory interneuron function, promoting cortical hyperexcitability and network hypersynchrony features, now recognized as core elements of AD pathophysiology.40,41 The P30 component, reflecting immediate responsiveness of local motor networks to stimulation and measured contralaterally in the present study, may capture transcallosal inhibitory transmission that facilitates this hyperexcitability. 36 Therefore, P30 may serve as an index of reduced inhibitory tone alongside increased excitatory drive.
AD has also been associated with disrupted functional connectivity and large-scale network reorganization, characterized by reduced long-range integration and deviation from optimal small-world topology, particularly in the alpha and beta frequency bands. Graph-theoretical studies using MEG, EEG, and fMRI consistently demonstrate a shift toward more random and locally clustered network organization. Such a configuration would be expected to amplify local, early evoked responses while constraining their propagation, providing a plausible explanation for the selective increase in P30.42,43
Consistent with this interpretation, TMS-EEG studies have linked larger early responses to poorer cognitive performance in AD, 10 reported inverse associations between DLPFC excitability, MoCA scores, and executive function, 12 and demonstrated correlations between parietal cortex P30 and global cognitive performance, 38 positioning P30 responses from prefrontal and parietal regions within a clinically meaningful excitability phenotype. However, the relationship between early TEP components and molecular AD pathology remains largely unexplored. One prior report showed that lower CSF Aβ42 levels were associated with larger TEP amplitudes following parietal stimulation, although etiological specificity was not addressed. 14
Here we demonstrate, for the first time, that increased M1L P30, within the cognitively impaired group, was associated with biomarker confirmed AD, but not with cognitive performance or cerebrovascular burden. Within the CSF-phenotyped subgroup, biomarker-positive individuals exhibited higher P30 amplitudes than biomarker-negative cases, and P30 was unrelated to vascular changes. Despite modest sample sizes, these findings suggest that elevated P30 may reflect amyloid-related network dysfunction rather than secondary effects of vascular pathology or global disease severity, in line with evidence linking amyloid to interneuron dysfunction and cortical hyperexcitability.41,42 This study supports, P30 as an adjunct diagnostic biomarker to complement molecular assays, by providing direct neurophysiological evidence, especially where access to PET tests is limited. The non-invasive and repeatable nature of this approach supports it utility as a pharmacodynamic or disease progression marker, as TMS–EEG readouts capture cortical excitability and respond to interventions. 4 In addition, data-driven pipelines indicate that early TMS–EEG features meaningfully enhance classification performance, underscoring their translational relevance for clinical decision support, 12 supporting deployment in real-world settings using a practical, clinically feasible acquisition framework, without reliance on specialized research techniques.
Limitations and future directions
Some considerations are warranted with interpretation of this data. Subgroup sizes for non-AD causes of cognitive impairment were modest, warranting replication in larger, pathologically confirmed cohorts. Although analyses were adjusted for years of education, residual confounding related to this variable cannot be entirely excluded. Our cross-sectional design limits inference on temporal dynamics; Given the cross-sectional design, causal inferences cannot be made regarding whether increased P30 reflects disease progression or compensatory mechanisms, highlighting the need for longitudinal studies to determine its temporal relationship with clinical decline and treatment response. Future studies should include larger samples to allow powered subset analysis, to control specific drug effects, as well as risk factors and demographic characteristics that may represent different pathophysiological signatures in AD. Additionally, in order to establish P30 as a viable marker, future work should include reproducibility assessments in these populations to establish the meaningful differences versus measurement error, as well as minimize the technical variability rising from cross-platform validation by independent labs to allow generalizability. Mechanistic work combining TMS-EEG with amyloid/tau PET and MRS (GABA/glutamate) could directly link P30 changes to synaptic and network alterations posited above. Also, evaluating P30 in biomarker-positive cognitively normal individuals may provide a valuable opportunity to investigate the interaction between underlying pathology and neurophysiological responses.
Conclusions
Participants’ demographic and clinical characteristics.
Supplemental Material
sj-docx-1-alz-10.1177_13872877261463653 - Supplemental material for Towards a neurophysiological diagnostic marker of Alzheimer's disease using transcranial magnetic stimulation combined with electroencephalography
Supplemental material, sj-docx-1-alz-10.1177_13872877261463653 for Towards a neurophysiological diagnostic marker of Alzheimer's disease using transcranial magnetic stimulation combined with electroencephalography by Rachel Ben-Hayun, Noa Zifman, Rafi Hadad, Hilla Fogel, Ofri Levy-Lamdan, Nastya Verhovski, Natalya Yarovinsky, Rawan Ayoub-Agbaria and David Tanne in Journal of Alzheimer's Disease
Footnotes
Acknowledgements
The authors thank all participants for their time and contribution to this study. We also acknowledge the clinical and research staff involved in data acquisition and processing for their valuable support.

Ethical considerations
The Rambam Health Care Campus Helsinki committee approved study. Patients underwent the Delphi-MD (TMS-EEG) evaluation as part of clinical practice (device registered and approved for neurological use). Their unidentified data was included in this study retrospectively. All controls signed an informed consent within a brain health study, conducted at the Institute, agreeing to undergo TMS-EEG evaluations and use of clinical data.
Consent to participate
Patient data were obtained as part of routine clinical care and included retrospectively in anonymized form under institutional review board approval with waiver of consent, whereas healthy controls provided written informed consent.
Consent for publication
Patient data were included retrospectively in anonymized form under institutional review board approval with waiver of consent; healthy controls provided written informed consent for publication.
Author contribution(s)
Funding
The authors disclosed receipt of the following financial support for the research, authorship, and/or publication of this article: This study was sponsored by QuantalX Neuroscience Ltd., the manufacturer of the TMS-EEG system used in this study.
Declaration of conflicting interests
The authors declared the following potential conflicts of interest with respect to the research, authorship, and/or publication of this article: This study was sponsored by QuantalX Neuroscience Ltd, the manufacturer of the TMS-EEG system used in this study. Some authors are affiliated with QuantalX Neuroscience Ltd All analyses and interpretations were conducted in accordance with standard scientific and ethical guidelines.
QuantalX Neuroscience is the company developing Delphi software used for acquisition and analysis of the TMS-EEG data. The company loaned the medical institute the hardware and software and supported the performance of the Delphi evaluations. NZ, HF, OLL and NV are employees of QuantalX Neuroscience. DT is a paid consultant of QuantalX Neuroscience.
The remaining authors declared no potential conflicts of interest with respect to the research, authorship, and/or publication of this article.
Data availability statement
The data supporting the findings of this study are available from the corresponding author upon reasonable request.
Supplemental material
Supplemental material for this article is available online.
References
Supplementary Material
Please find the following supplemental material available below.
For Open Access articles published under a Creative Commons License, all supplemental material carries the same license as the article it is associated with.
For non-Open Access articles published, all supplemental material carries a non-exclusive license, and permission requests for re-use of supplemental material or any part of supplemental material shall be sent directly to the copyright owner as specified in the copyright notice associated with the article.
