
Abstract
Background
Mild cognitive impairment is a prodromal stage of dementia, and early identification is crucial for prognosis.
Objective
This study aims to create and validate a machine learning model for diagnosing mild cognitive impairment (MCI) using eye movement and gait analysis data.
Methods
To facilitate model training and internal validation, a cohort of 235 patients was recruited from the Memory Clinic at Xi’an NO.3 Hospital between August 2024 and November 2025. In addition, data from 71 patients were randomly selected to form an independent test set. Feature selection was conducted using the Least Absolute Shrinkage and Selection Operator (LASSO) and multivariable logistic regression. Subsequently, various machine learning classifiers were compared. Model performance was assessed using metrics such as the area under the receiver operating characteristic curve (AUC) and decision curve analysis. To evaluate model interpretability, SHapley Additive exPlanations (SHAP) were employed.
Results
The study involved 235 participants, divided into mild cognitive impairment (MCI) (n = 130) and healthy control (HC) (n = 105) groups. The final prediction model used four features: gait speed during a dual-task test, ground reaction force in a single-task test, antisaccade task accuracy, and noise rate in a saccade-to-pursuit task. The Gaussian Naive Bayes (GNB) classifier showed excellent performance with an AUC of 0.952 (95% CI: 0.923–0.981) in the validation group and 0.944 (95% CI: 0.912–0.967) in the test set.
Conclusions
The GNB model, combining eye movement and gait parameters, enables early MCI detection with high accuracy and practical clinical use.
Keywords
Introduction
The global trend of population aging has led to a notable rise in dementia incidence, particularly Alzheimer's disease (AD), which has become a crucial public health concern. At present, dementia affects more than 50 million people around the world. In China alone, there are over 13 million cases, which is more than one-quarter of the global total. Estimates indicate that by 2050, the number of patients suffering from AD in China will exceed 30 million.1,2 Dementia is mainly caused by AD, accounting for approximately 60–80% of cases. 2 Clinical trajectory models indicate that the pace of cognitive decline is expected to rise significantly starting from the mild cognitive impairment (MCI) stage. 3 MCI, a vital intermediate stage between normal aging and dementia, impacts around 20% of the elderly population worldwide. Every year, 10% to 15% of those with MCI develop dementia, bringing significant economic and care giving pressures to individuals, families, and society.2,3 Consequently, identifying and dealing with problems during the MCI period or even earlier at the subjective cognitive decline (SCD) stage is an essential approach for decelerating disease development and lessening the incidence of dementia. 4
Currently, the diagnosis and screening of MCI and SCD mainly rely on neuropsychological evaluations like the Mini-Mental State Examination (MMSE) and the Montreal Cognitive Assessment (MoCA). However, these instruments have substantial drawbacks: they consume a great deal of time, require trained staff for implementation, and their results can be affected by the educational and cultural backgrounds of the evaluated individuals. Furthermore, they might not possess the necessary sensitivity to detect extremely early and subtle cognitive alterations. 5 Even though biomarkers, like cerebrospinal fluid Aβ/tau and amyloid positron emission tomography (PET) imaging, offer high diagnostic precision, their utilization is restricted by high expenses, invasive processes or radiation exposure, and limited availability, thus decreasing their practicality for extensive population screening. 6 Hence, there is a critical demand for the creation of new screening devices that are objective, uncomplicated, cost-efficient, and easily expandable to fulfill the increasing need for early identification of cognitive risks among the aging population.
The neural networks responsible for higher cognitive functions such as executive functioning, attention, and working memory exhibit considerable overlap with those that regulate gait and eye movement control. The neural substrate shared by cognitive and motor functions, which is involved in the relevant neural circuitry, mainly consists of the prefrontal cortex, parietal lobe, basal ganglia, and cerebellum.7,8 This shared neural basis offers a theoretical foundation for using behavioral metrics to explore early cognitive decline.7,8 Dual-task gait paradigms have been shown to more effectively reveal underlying deficits in executive function and divided attention compared to single-task walking. 9 This is due to the increased cognitive load, which amplifies the competition for resources between motor and cognitive systems. 10 A meta-analysis indicated that under single-task conditions, gait parameters such as speed, stride length, stride time, and its coefficient of variation were the most effective in distinguishing individuals with MCI from healthy controls. However, dual-task assessments further enhanced this discriminative capability. Notably, dual-task walking combined with a counting task demonstrated greater sensitivity (Cohen's d range 0.84–1.35) than verbal fluency tasks, such as fruit naming (d range 0.65–0.94). 11 Another study found that the area under the receiver operating characteristic curve (AUC) for dual-task gait tests in distinguishing MCI ranged from 0.78 to 0.79, 12 with high test-retest reliability, 13 indicating their potential utility in MCI screening. Utilizing a one-versus-one support vector machine with majority voting and gait features extracted from an electronic walkway, Boettcher et al. 14 achieved an accuracy of 86.0% in differentiating cognitively impaired individuals from healthy controls. Collectively, these findings underscore the efficacy of dual-task gait assessments in the early detection of cognitive impairments.
Eye-tracking, a non-invasive and cost-effective behavioral tool, has attracted significant attention for the early diagnosis of MCI. 15 Ocular movements indicative of cognitive dysfunction primarily encompass saccades, antisaccades, and microsaccades. Among these, the antisaccade error rate demonstrates the highest diagnostic accuracy, with an AUC of approximately 0.79, while other paradigms exhibit more limited effectiveness. 15 Opwonya et al. 16 employed logistic regression to integrate demographic information, MMSE scores, and eye-tracking metrics, achieving an AUC of 0.840. This finding suggests that MCI-related changes in eye movements reflect deficits in attention and executive function. Additionally, some researchers have investigated the early diagnosis of MCI using demographic data in conjunction with other digital markers.17–18 Song et al. 17 developed a LightGBM model based on demographic variables, including education level, social participation, gender, relationship with children, and age, achieving an AUC of 0.77. Butler et al. 18 conducted a study to explore the potential of passive monitoring of brain health through the use of smartphones and wearable devices. By analyzing digital phenotypes such as application usage frequency, screen time, call patterns, and GPS trajectories, and employing multidimensional feature extraction alongside ensemble learning techniques (specifically XGBoost and LightGBM), they were able to predict MCI with AUC values ranging from 0.76 to 0.83. Nonetheless, the incorporation of eye-tracking and gait—two non-invasive and complementary motor-cognitive modalities—into machine learning-based MCI detection remains largely underexplored. Furthermore, existing models frequently depend on conventional paradigms (such as simple dual-task walking or basic saccade metrics), which may not impose sufficient cognitive load to reveal subtle early-stage impairments.
In this study, we aim to develop and validate a highly accurate, objective, and user-friendly model for the early diagnosis of MCI utilizing advanced machine learning techniques. This model incorporates two underutilized indicators. Firstly, the high-cognitive-load dual-task gait paradigm involving serial subtraction by sevens, widely acknowledged as one of the most sensitive cognitive tasks for distinguishing MCI, has not been fully leveraged in machine learning classification. 19 Secondly, the smooth pursuit abnormality rate, 20 which captures subtle oculomotor control deficits during sustained visual tracking, has been largely overlooked in conventional eye-tracking feature engineering, which has predominantly focused on discrete metrics such as antisaccade error rate and saccadic latency, thereby neglecting this important indicator.
Methods
Research subjects
From August 2024 to November 2025, a cross-sectional study was conducted. Patients exhibiting subjective cognitive decline were systematically recruited at the Memory Clinic of Xi’an NO.3 Hospital. Neurologists with standardized training carefully gathered demographic information, medical histories, and details of subjective cognitive complaints from every participant. The study's inclusion requirements were as follows: (1) individuals should be 50 years old or above; and (2) they should be able to finish neuropsychological assessments and motor function evaluations.The criteria for exclusion were as follows: (1) a confirmed diagnosis of dementia, such as AD or dementia with Lewy bodies. (2) Severe visual dysfunction that precludes the completion of standardized eye-tracking tasks. To eliminate the impact of vision-related or ocular conditions on the analysis, eye movements were calibrated at the initial stage of eye tracking using a videonystagmography calibration procedure, ensuring a maximum calibration error of ≤1° in radius. Participants who did not successfully complete this step were excluded from eye movement evaluation. (3) Limb motor dysfunction, such as post-stroke hemiplegia or spinal cord injury, confirmed through clinical assessment to impede independent ambulation. (4) Comorbid neurological disorders affecting oculomotor control or fine motor execution, including but not limited to Parkinsonism (such as Parkinson's disease, multiple system atrophy, or progressive supranuclear palsy), active epilepsy (with seizures occurring within the past 6 months), cerebellar degeneration, and Huntington's disease.
The diagnosis of MCI was conducted thoroughly using Petersen's criteria. 21 These criteria consist of: (1) a subjective cognitive decline noticed by the patient, an informant, or a doctor; (2) objective cognitive impairment in one or multiple domains, evidenced by neuropsychological testing with the MoCA, along with age and education adjustments; (3) the ability to carry out daily activities remaining intact; and (4) A Clinical Dementia Rating (CDR) score of 0.5 suggests no signs of dementia. The diagnoses of all cases of MCI were separately confirmed by two experienced neurologists. Among the participants, 235 individuals successfully completed all the assessments. Among them, 130 people were identified as having MCI, while 105 individuals with normal cognitive function were set as the control group. Ethical approval for this study was granted by the Ethics Committee of Xi’an NO.3 Hospital, and the research followed the Declaration of Helsinki guidelines. All participants provided written informed consent.
Cognitive and mood assessment
The MoCA and the CDR scale were used to assess cognitive function. For participants who had fewer than 12 years of formal educational experience, a one-point adjustment was made to their MoCA score; an adjusted score below 26 was used to define cognitive impairment.22,23 The severity of dementia was evaluated through the application of the CDR scale, which had scores spanning from 0 to 3; a score of 1 or more indicated mild to severe dementia. 24 In addition, the Hamilton Anxiety Rating Scale (HAMA) and the Hamilton Depression Rating Scale (HAMD) were employed to evaluate anxiety and depression levels in all participants.
Gait assessment
Quantitative gait analysis was conducted utilizing the IDEEA 3.0 system. Participants engaged in a single-task walking trial, which involved walking at their habitual speed along a 12-meter straight path. Additionally, they completed three dual-task walking trials, during which they walked while concurrently performing cognitive tasks: serial 100-7 subtraction, fruit naming, and word recall (Prior to the walking task, participants were directed to either memorize or recall a set of 20 unrelated words concurrently with the act of walking). Furthermore, a Timed Up and Go (TUG) single-task test was administered. The system automatically analyzed ten gait parameters under various task conditions, including stride time (seconds), step length (meters), stride length (meters), velocity (meters per second), cadence (steps per minute), stance phase (percentage), pulling acceleration (G), swing power (G), ground reaction force (G), and heel angle relative to the ground (degrees).
Oculomotor function assessment
Data related to eye movements were obtained within a dedicated darkroom laboratory. With the use of a binocular EyeLink system (Beijing Baoruntong Research Co., Ltd, China), the participants’ heads were placed in a stable position, and they were required to keep their gaze fixed on the center of a black semi-cylindrical screen that was 120 cm away. Before testing, a calibration procedure consisting of nine points was carried out, guaranteeing that the calibration error radius was no greater than 0.2°. The stimulus employed was a red LED light point. The following were the test tasks and procedures:
Prosaccade task
Participants maintained continuous fixation on a central point (0°). After the central point vanished, a peripheral target randomly appeared horizontally (± 30°) for 1.0 s. It was instructed to the participants that they should carry out a saccade to the new target location with the utmost speed and precision. For both the left and right target positions, this process was carried out 10 times.
Memory-guided saccade task
In this task, participants initially fixated on a central fixation point for a duration of 2 s while a peripheral target was presented horizontally at ± 30° for 3 s before disappearing. During the time after the target vanished, participants had to keep their eyes on the central fixation point for an extra 2 s during the delay phase. After that, the central fixation point was taken away, causing participants to promptly perform a saccade to the remembered target location and keep their fixation there for 3 s. For each target position on both the left and right sides, this process was carried out 10 times.
Antisaccade task
Participants maintained continuous fixation on the central point (0°). Upon the disappearance of the central point, a peripheral target appeared randomly in the horizontal direction at ±30° for 1.0 s before disappearing. The participants received instructions to inhibit the automatic tendency to look in the direction of the target. Instead, they were required to perform an immediate eye movement (saccade) to the position that was the mirror image of the target (in the opposite direction). For each target position on both the left and right sides, this task was carried out 10 times.
Smooth pursuit task
Participants were told to smoothly follow a horizontally moving target in a sinusoidal pattern with a frequency of 0.2 Hz and an amplitude of ± 30° for a duration of 30 s. Among the key oculomotor parameters documented were the latency, precision, and speed of saccades during different tasks. 25 (1) Accuracy: The degree of consistency between the participant's eye movement trajectory and the target movement trajectory. The normal range is 70%–115%; below 70% is considered undershoot, and above 115% is considered overshoot. (2) Peak velocity: The maximum angular velocity of the eye as it moves from one target to the next. The normal range is greater than 400°/s. (3) Latency: The time interval between the appearance of the target and the onset of the eye movement. The normal range is less than 250 ms.
Furthermore, the gain of smooth pursuit (SPN) and the rate of abnormality were evaluated. Smooth pursuit eye movements (SPEM) are classified into four types based on velocity gain (eye velocity/target velocity ratio) and trajectory shape. Types I and II are normal, while III and IV are abnormal. Type I has a gain of ≥0.8 with a smooth sinusoidal path. Type II has a gain of 0.6–0.8 with a mostly smooth path and occasional saccades. Type III has a gain of <0.6 with a non-smooth, step-like path and multiple saccades. Type IV also has a gain of <0.6 but with a disorganized path. Videonystagmography (VNG) software calculates velocity gain and classifies SPEM by analyzing waveform patterns like saccade frequency and trajectory smoothness (Figure 1). 25
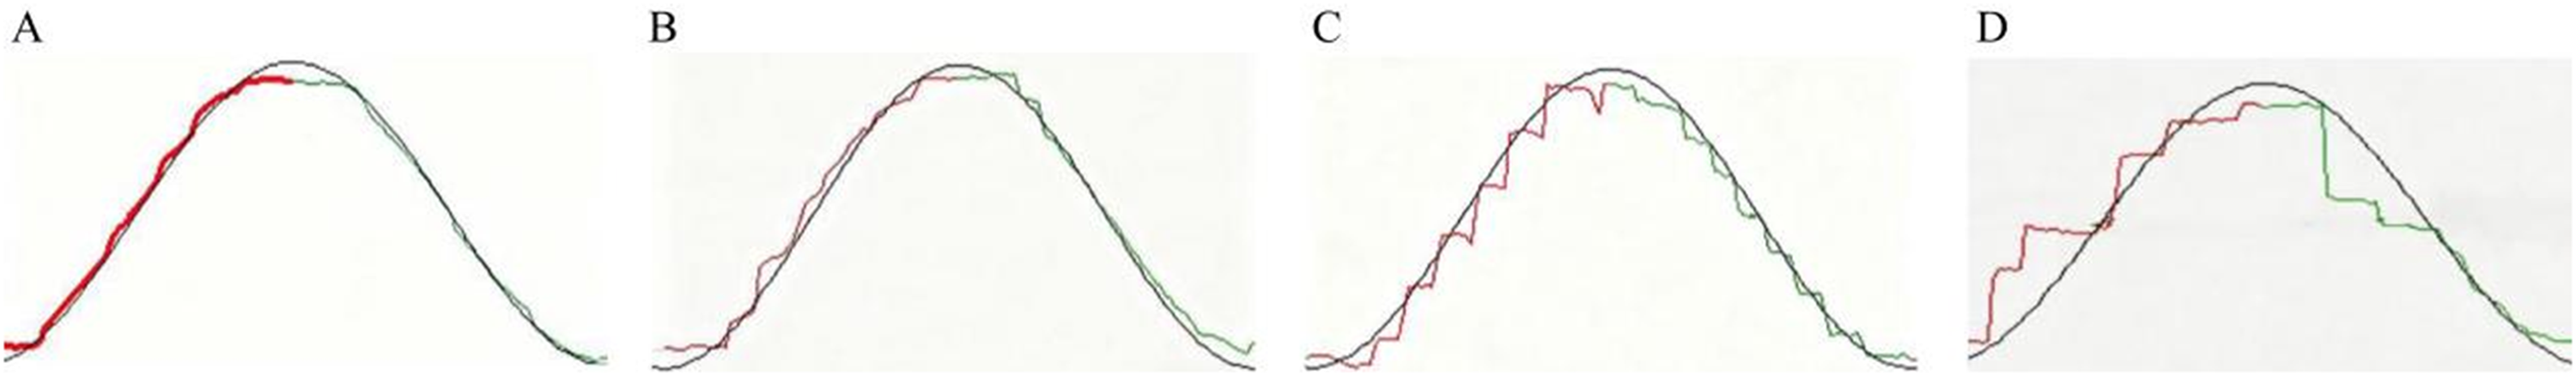
Schematic diagram of smooth tracking waveform (Types I–IV). A shows Type I wave, which presents a smooth sinusoidal path. B shows Type II wave, which presents a mostly smooth path with occasional saccades. C shows Type III wave, which presents a non-smooth, step-like path with multiple saccades. D shows Type IV wave, which presents a disorganized path.
Feature selection and prediction model development
An initial feature selection procedure was carried out on the gathered oculomotor and gait parameters to create the prediction model for MCI. For dimensionality reduction and to find the most predictive features, the R glmnet package version 4.1.2 was utilized to perform a LASSO regression analysis on the training set. The regularization parameter (λ) was chosen as the value that produces the simplest model within one standard error. Variables exhibiting non-zero coefficients in the LASSO regression analysis were incorporated into the logistic regression model. Subsequently, a Spearman correlation analysis was conducted to eliminate features demonstrating high collinearity (r > 0.8). The complete dataset, consisting of 235 entries, was split randomly into a training set of 164 entries and a distinct test set of 71 entries. The training set maintained a 7:3 ratio and ten-fold cross-validation was conducted using Python version 3.11.4. In addition, the test set was used for validation. This was also carried out in Python version 3.11.4.
The features that were finally chosen were utilized to create the MCI prediction model. Five machine learning algorithms, namely XGBoost, LightGBM, Random Forest, Gaussian Naive Bayes (GNB), and Support Vector Machine (SVM), were utilized to evaluate their effectiveness in detecting MCI risk. Bayesian optimization was carried out to automatically figure out the optimal hyperparameter setup for each model, thus enhancing the predictive performance and generalization ability. A validation dataset from within was used to evaluate the model's discrimination and calibration. The metrics used for evaluation encompassed the Area Under the Curve (AUC), accuracy, sensitivity, specificity, positive predictive value, negative predictive value, and F1-score. To evaluate the alignment between the predicted probabilities and the actual risks, calibration curves were generated. Furthermore, Decision Curve Analysis (DCA) was carried out to measure the clinical net benefit at different decision thresholds.
Model interpretability analysis
To enable both global and local interpretations of the model, the method of SHapley Additive exPlanations (SHAP) was employed. Regarding the global interpretation, each feature in the model is given consistent and accurate attribution values, thus clarifying the connection between input features and the occurrence of MCI. On the other hand, the local interpretation offers an understanding of the model's individualized prediction results for particular patients by examining their input data.
Statistical analysis
All statistical analyses were conducted using R version 4.2.3 and Python version 3.11.4. Categorical variables are displayed as frequencies and percentages, and group comparisons are made using the chi-squared (χ2) test. For continuous variables, descriptive statistics are presented as the mean with the standard deviation for normally distributed data, and as the median with the interquartile range for data that do not follow a normal distribution. Independent samples t-tests and the Mann-Whitney U test were used for suitable group comparisons. The evaluation of the predictive model was performed using the AUC-ROC, and the classification threshold was optimized by maximizing the Youden index. Subsequent validation via decision curve and precision—recall analyses was performed in the R software (version 4.2.3). Statistical significance was attributed to a p-value below 0.05.
Results
Participant recruitment and baseline characteristics
In the course of this cross-sectional research, 368 participants were initially screened. Among them, 93 individuals were dismissed because they did not adhere to the inclusion or exclusion guidelines, and another 40 were eliminated due to insufficient baseline data, lacking gait parameters, or being diagnosed with AD. A total of 235 eligible participants were enrolled in the study and subsequently allocated into a training set (n = 164) and a testing set (n = 71) to facilitate model development and validation (Figure 2).
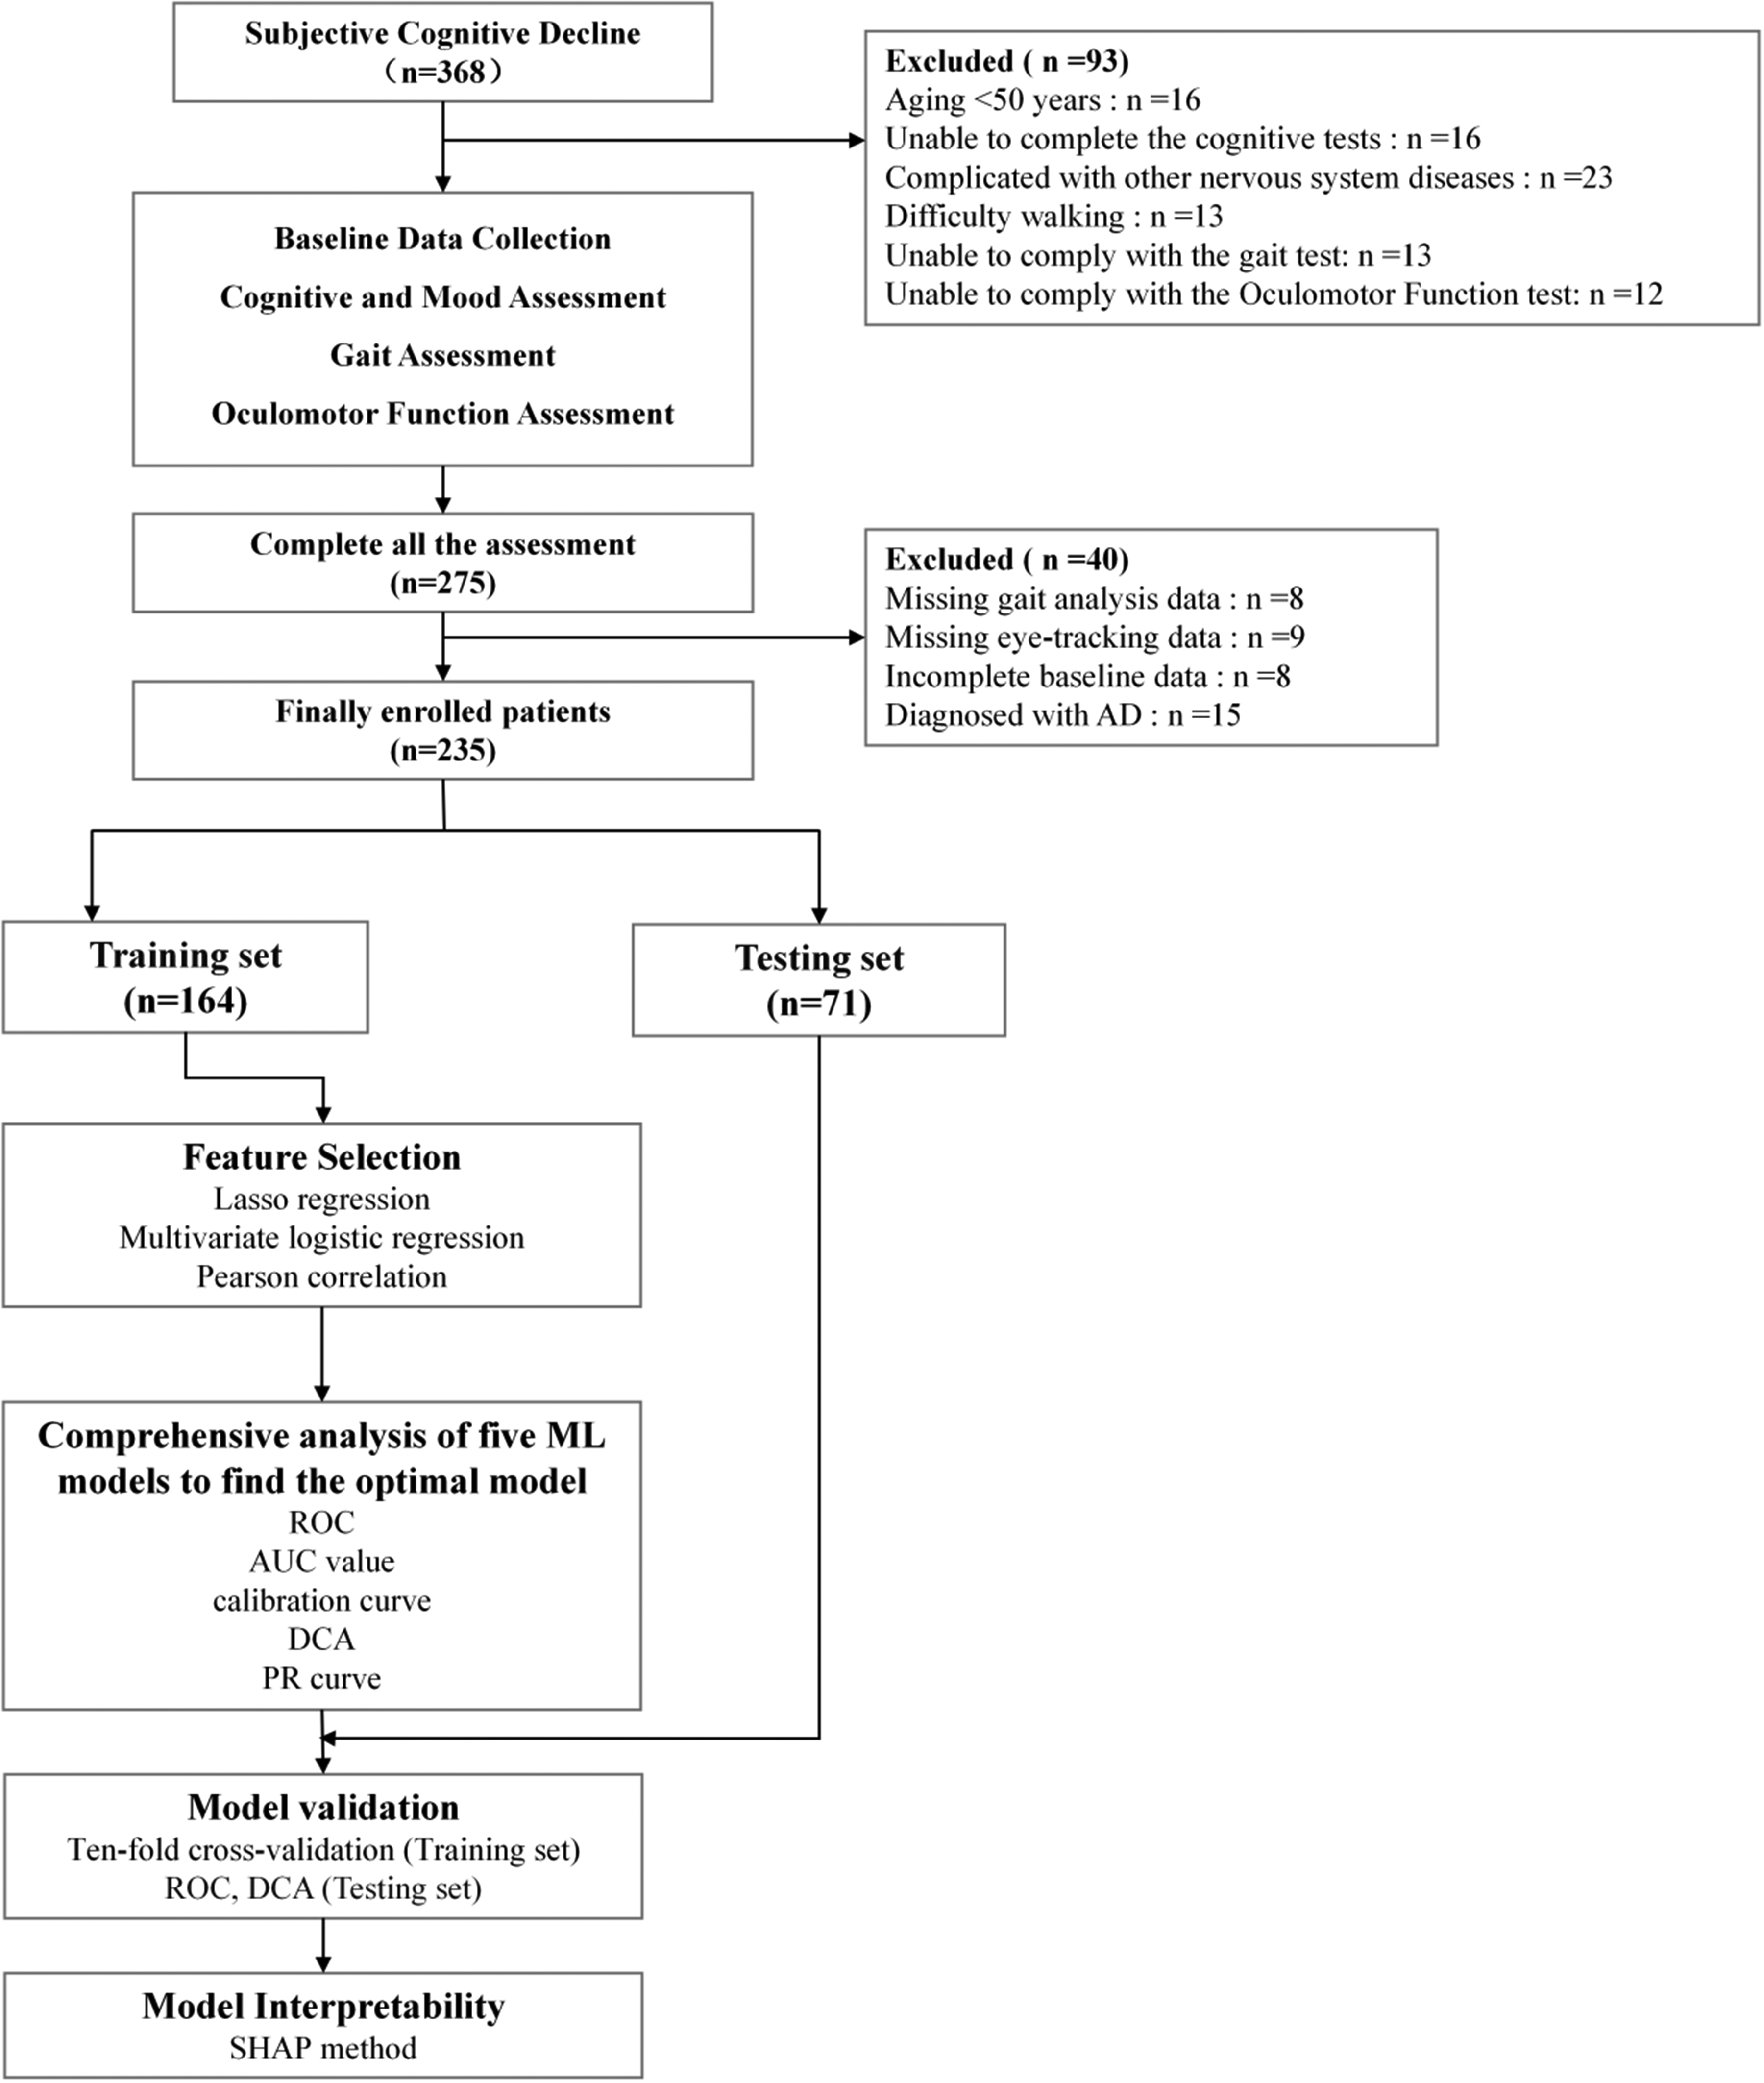
The flowchart depicting the participants included for analysis.
A comparative analysis of the baseline data between the two groups, those in the MCI group were notably older, had less education, showed lower MoCA scores, and presented higher levels of anxiety. Regarding depressive symptoms, height, weight, BMI, or sex distribution, no notable differences were found between the two groups (Table 1).
A comparison of demographic data between MCI and HC group.
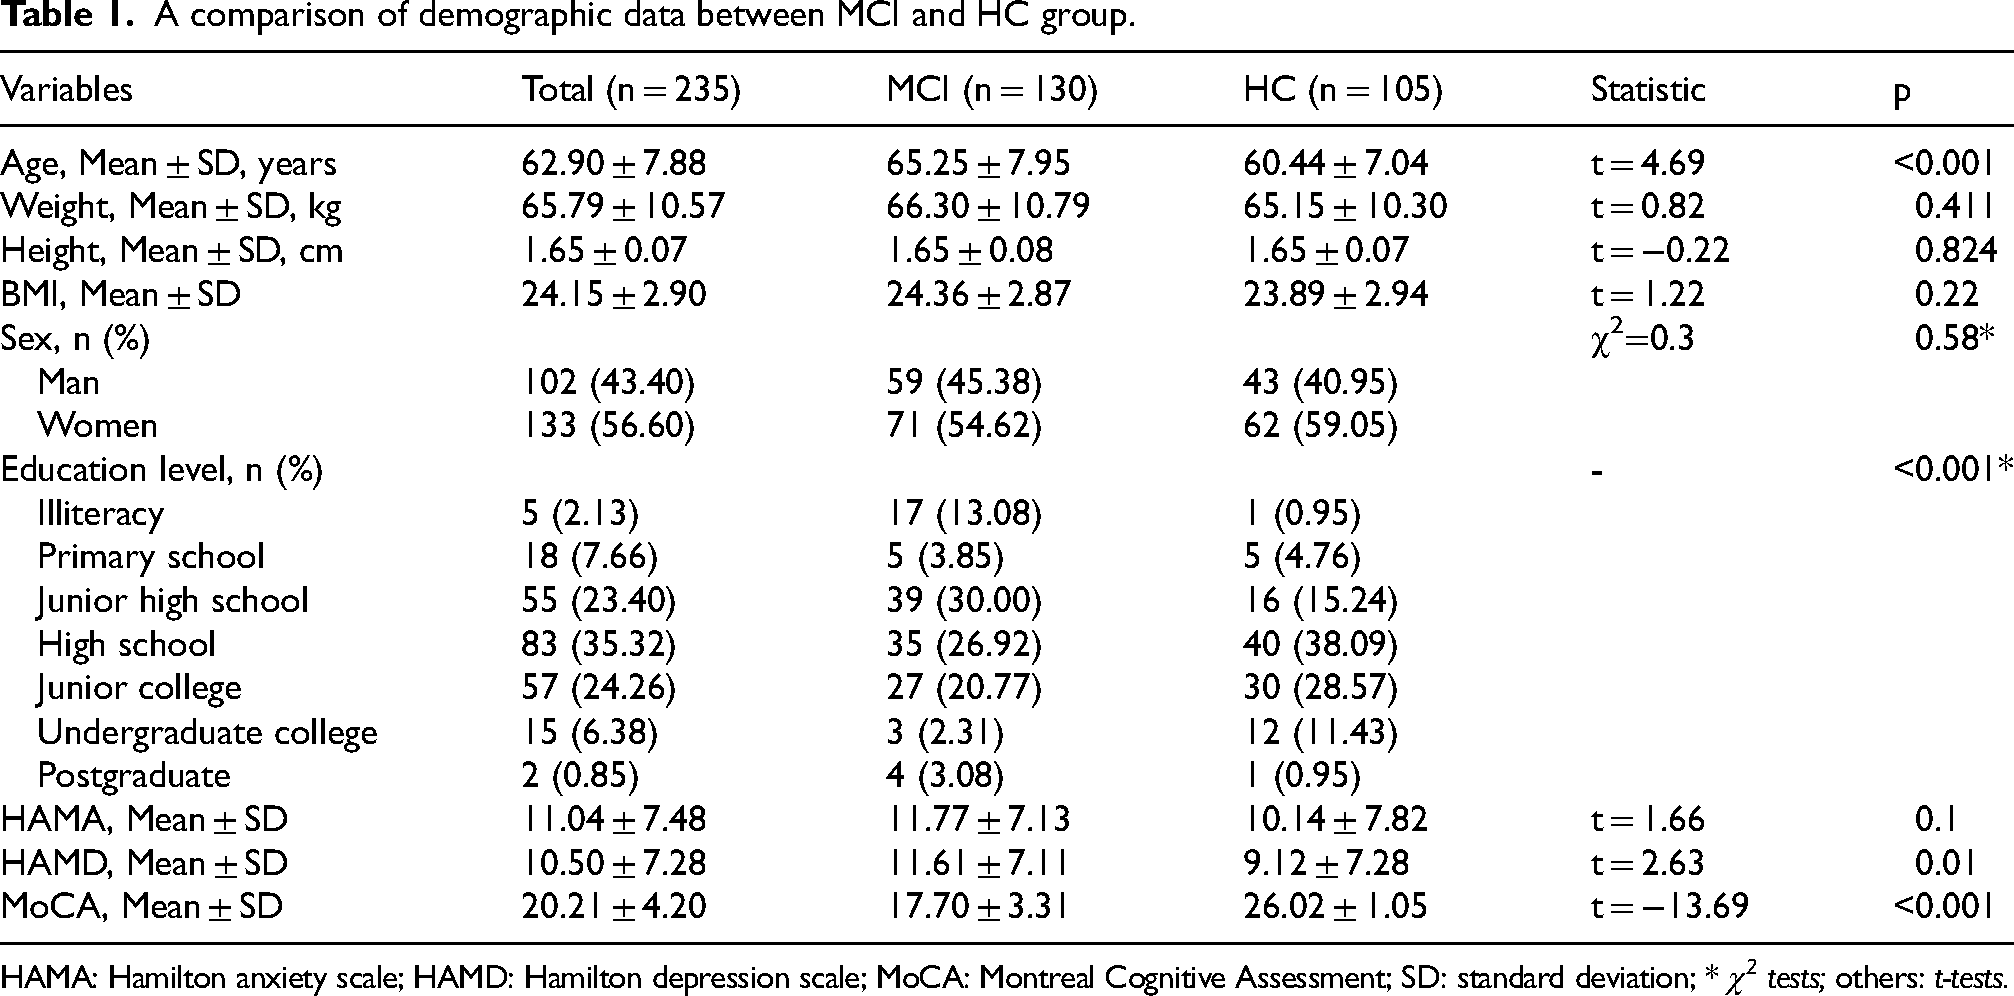
HAMA: Hamilton anxiety scale; HAMD: Hamilton depression scale; MoCA: Montreal Cognitive Assessment; SD: standard deviation; * χ2 tests; others: t-tests.
Comparison of oculomotor and gait features in patients with MCI and HC group
The analysis of gait revealed a persistent impairment in the gait parameters of those with MCI when they were under dual-task conditions. Notably, during the serial 100-7 subtraction task, the MCI group exhibited a significantly prolonged stride time (1.18 s compared to 1.07 s, p < 0.001), reduced step length (0.53 m compared to 0.63 m, p < 0.001), and decreased gait velocity (0.91 m/s compared to 1.19 m/s, p < 0.001). A similar reduction in velocity was observed during the memory recall task (0.89 m/s compared to 1.03 m/s, p < 0.001), alongside a shorter step length during the fruits naming task (0.54 m compared to 0.59 m, p < 0.001), and a slower velocity in the TUG test (0.90 m/s compared to 1.14 m/s, p < 0.001). Additionally, the MCI group exhibited significantly reduced ground reaction forces in all tasks (all p < 0.001) (Table 2).
The evaluation of oculomotor and gait features in people with MCI versus HC group.
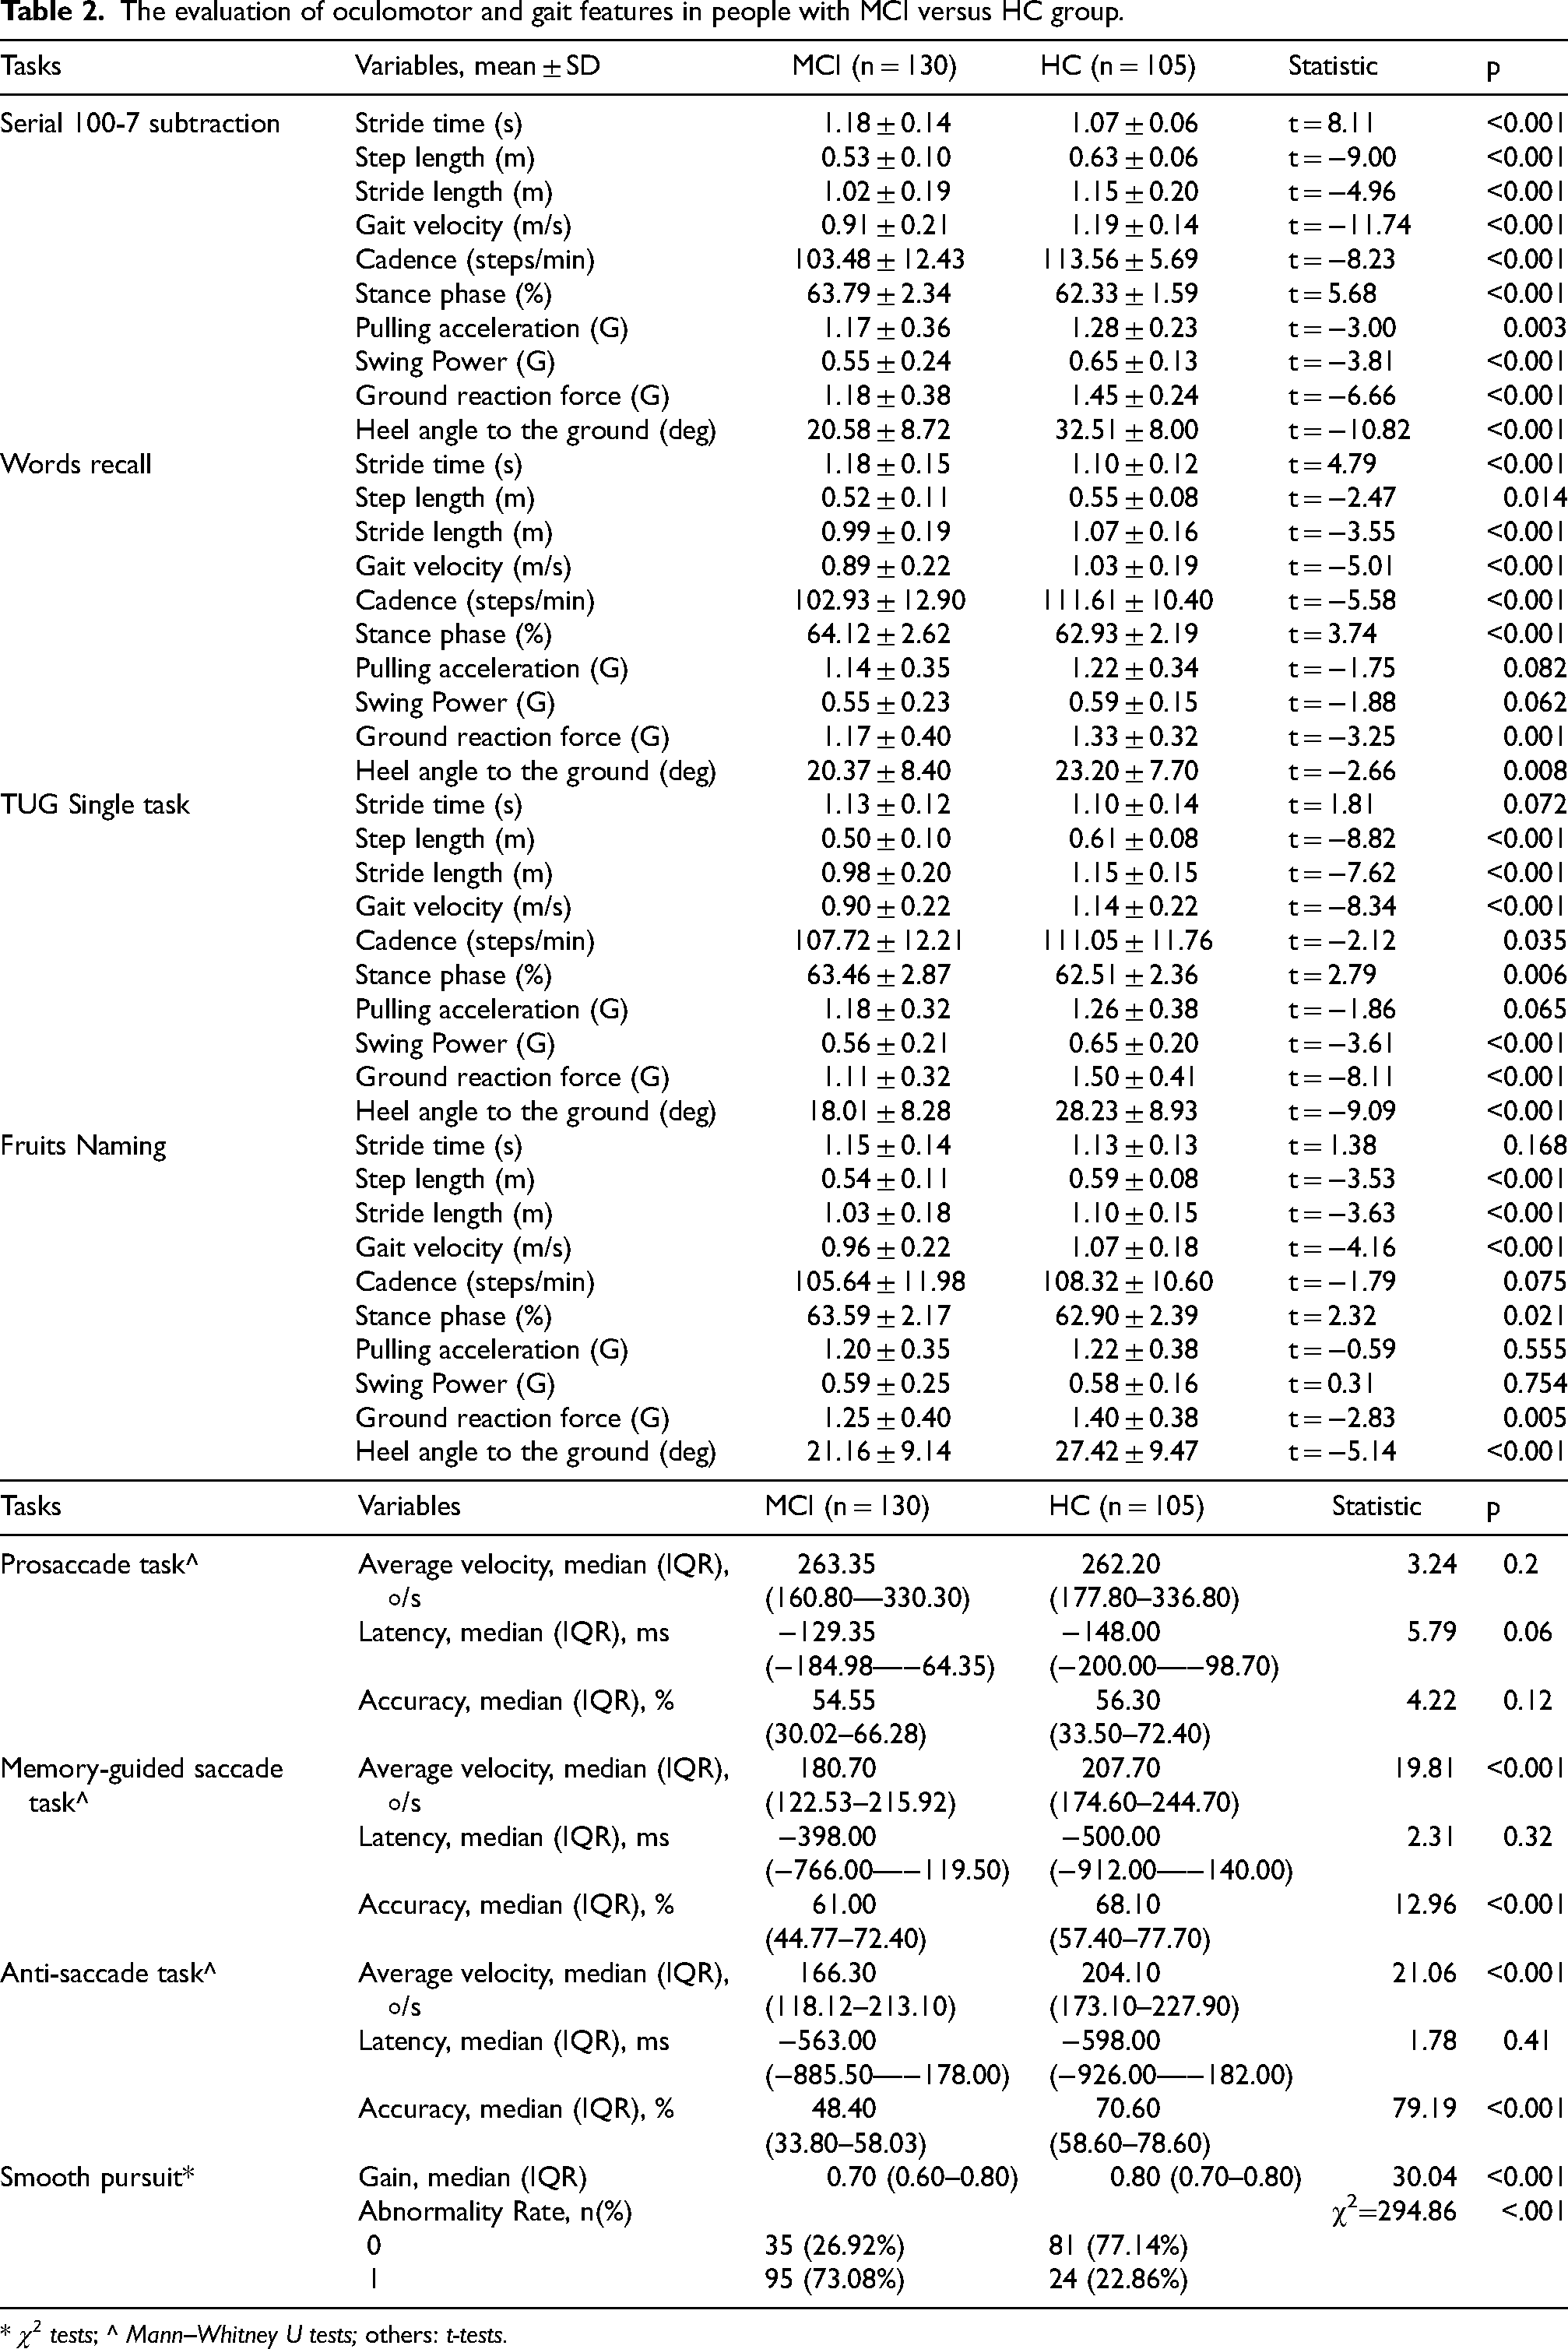
* χ2 tests; ^ Mann–Whitney U tests; others: t-tests.
Oculomotor assessments revealed that the MCI group had significantly lower velocity and accuracy in the memory-guided saccade task (180.70°/s versus 207.70°/s and 61.0% versus 68.1%, respectively, p < 0.001). These deficits were even more pronounced in anti-saccade tasks, with reduced velocity (166.30°/s versus 204.10°/s) and accuracy (48.40% versus 70.60%) (both p < 0.001). Additionally, smooth pursuit abnormalities were significantly more common in the MCI group (73.08% versus 22.86%, p < 0.001).
Variable screening and selection for the model
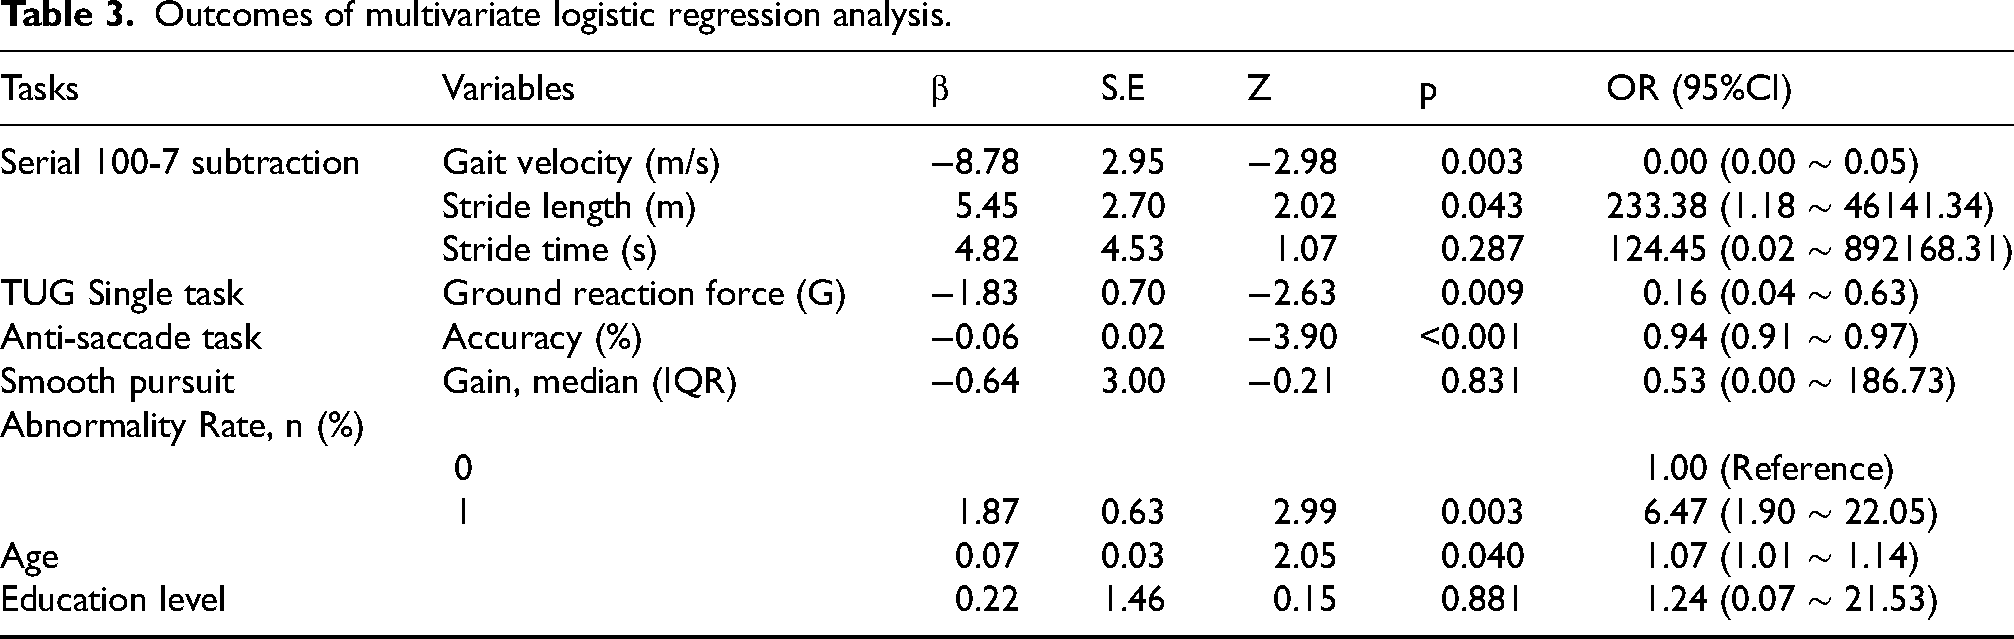
In order to ascertain the most pertinent predictors of MCI, we employed LASSO regression analysis on the training set, designating MCI as the dependent variable (Figure 3). The LASSO method makes use of L1 regularization to shrink variable coefficients. This helps in minimizing overfitting and dealing with multicollinearity among predictors. 26 Through this analysis, the initial 40 independent variables were narrowed down to 7 non-zero predictors: namely, Serial 100-7 subtraction Gait velocity, Serial 100-7 subtraction Stride time, Serial 100-7 subtraction Stride length, TUG Single task Ground reaction force, Anti-saccade task Accuracy, SPN Gain and SPN Abnormality Rate. A multivariate logistic regression was performed on these 7 chosen variables to further address potential confounding factors. 21 Ultimately, four variables were independently associated with MCI (p < 0.01) and a Spearman correlation analysis was conducted to eliminate features demonstrating high collinearity (r > 0.8): Serial 100-7 subtraction Gait velocity, TUG Single task Ground reaction force, Anti-saccade task Accuracy, and SPN Abnormality Rate (Table 3).
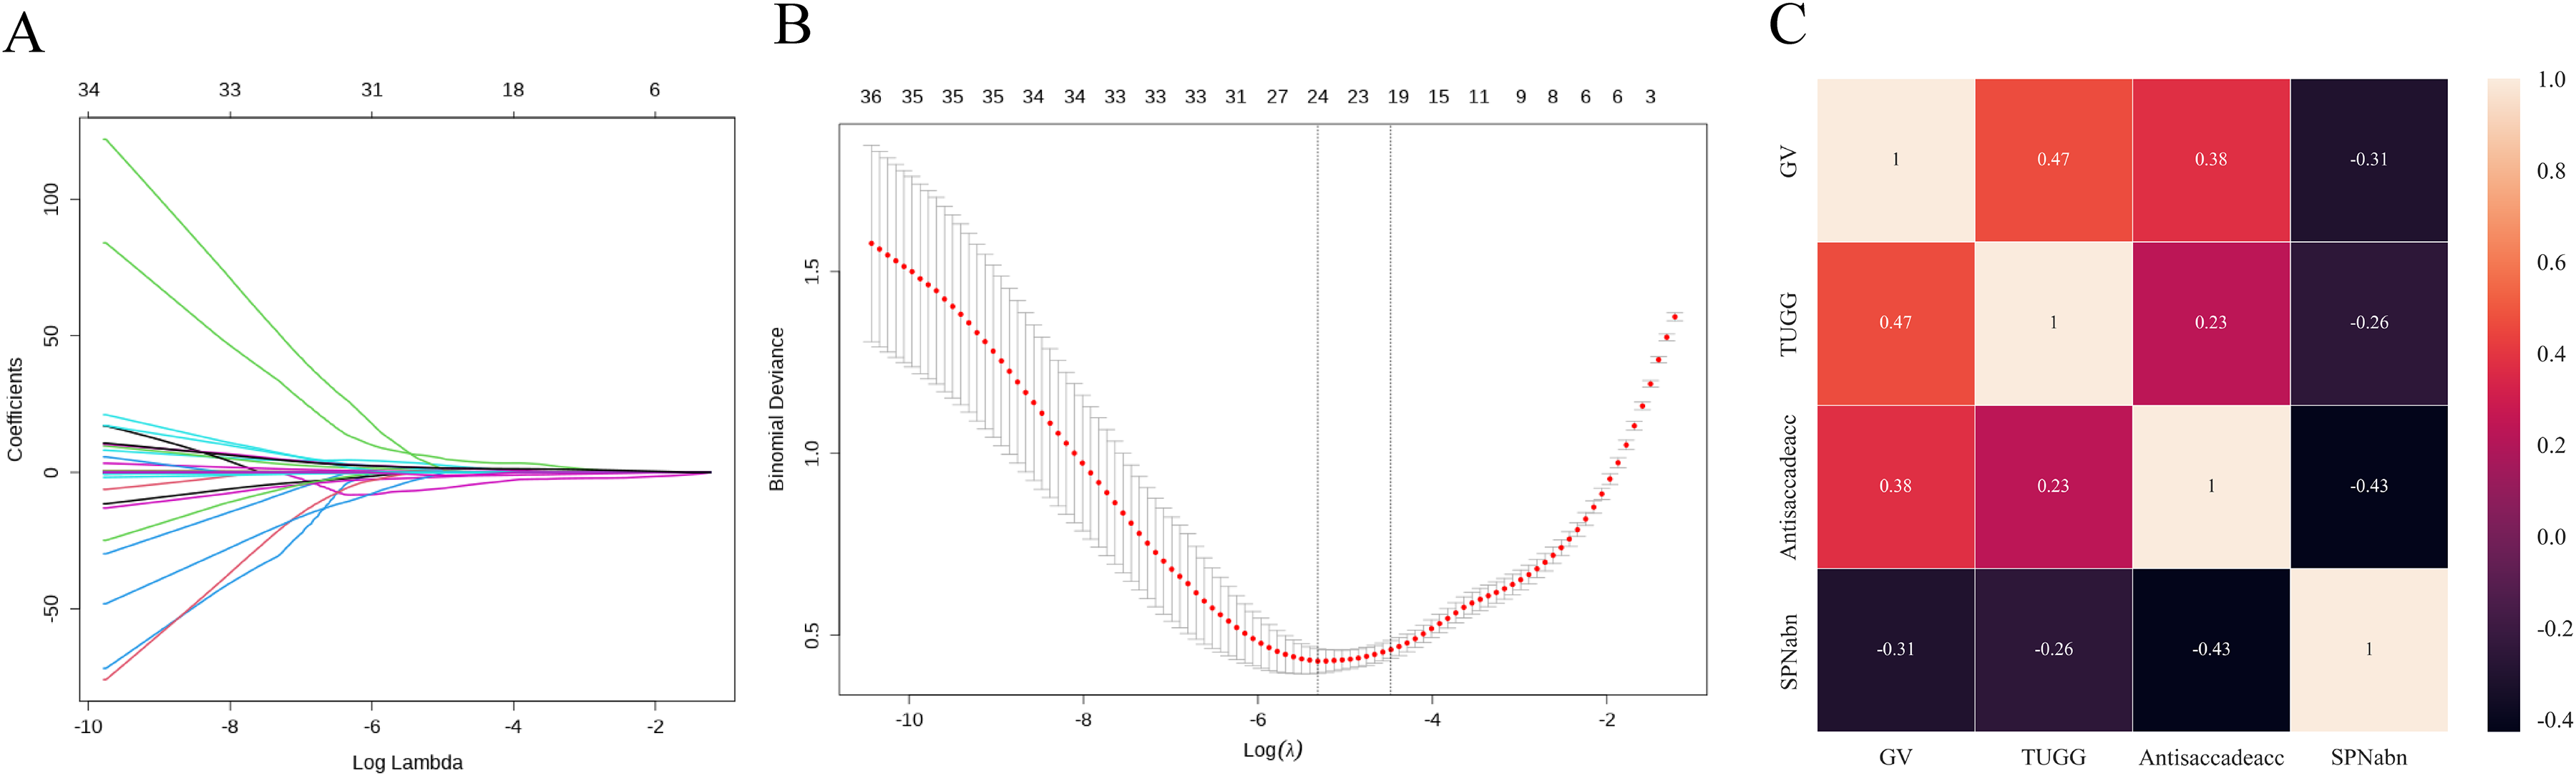
Displays the findings from the LASSO regression analysis. A showcases the plot illustrating the profiles of the LASSO coefficients. B presents the cross-validation error curve for the selection of the tuning parameter (λ). C Spearman correlation analysis. Gv stands for the serial 100-7 subtraction Gait velocity, Antisaccade represents the Anti-saccade task Accuracy, SPNabn denotes the SPN Abnormality Rate, and TUGG means the TUG Single task Ground reaction force.
Outcomes of multivariate logistic regression analysis.
Comprehensive analysis of multiple classification models
This study involved training and assessing various machine learning models, including XGBoost, LightGBM, Random Forest, GNB, and SVM, across ten distinct iterations. The primary performance metric used was the area under the receiver operating characteristic curve. On the training set, the highest AUC values were achieved by XGBoost and GNB. Moreover, GNB obtained the better AUC on the internal validation set (Figure 4A–C). Although AUC can show predictive discrimination ability, it cannot reflect clinical utility or make clinically significant comparisons among models. As a result, supplementary analyses such as DCA, calibration curve analysis, and precision-recall (PR) curve evaluation were carried out. The findings from the DCA indicated that the GNB regression model had improved clinical usability (Figure 4D). The alignment between the predicted probabilities produced by GNB and the actual outcomes was more distinct as shown by the calibration curves (Figure 4E). In addition, the average precision (AP) score of GNB in the validation set was the highest among all (Figure 4F). All in all, these findings indicate that the regression model of GNB offers reliable predictive capabilities and good clinical practicality.
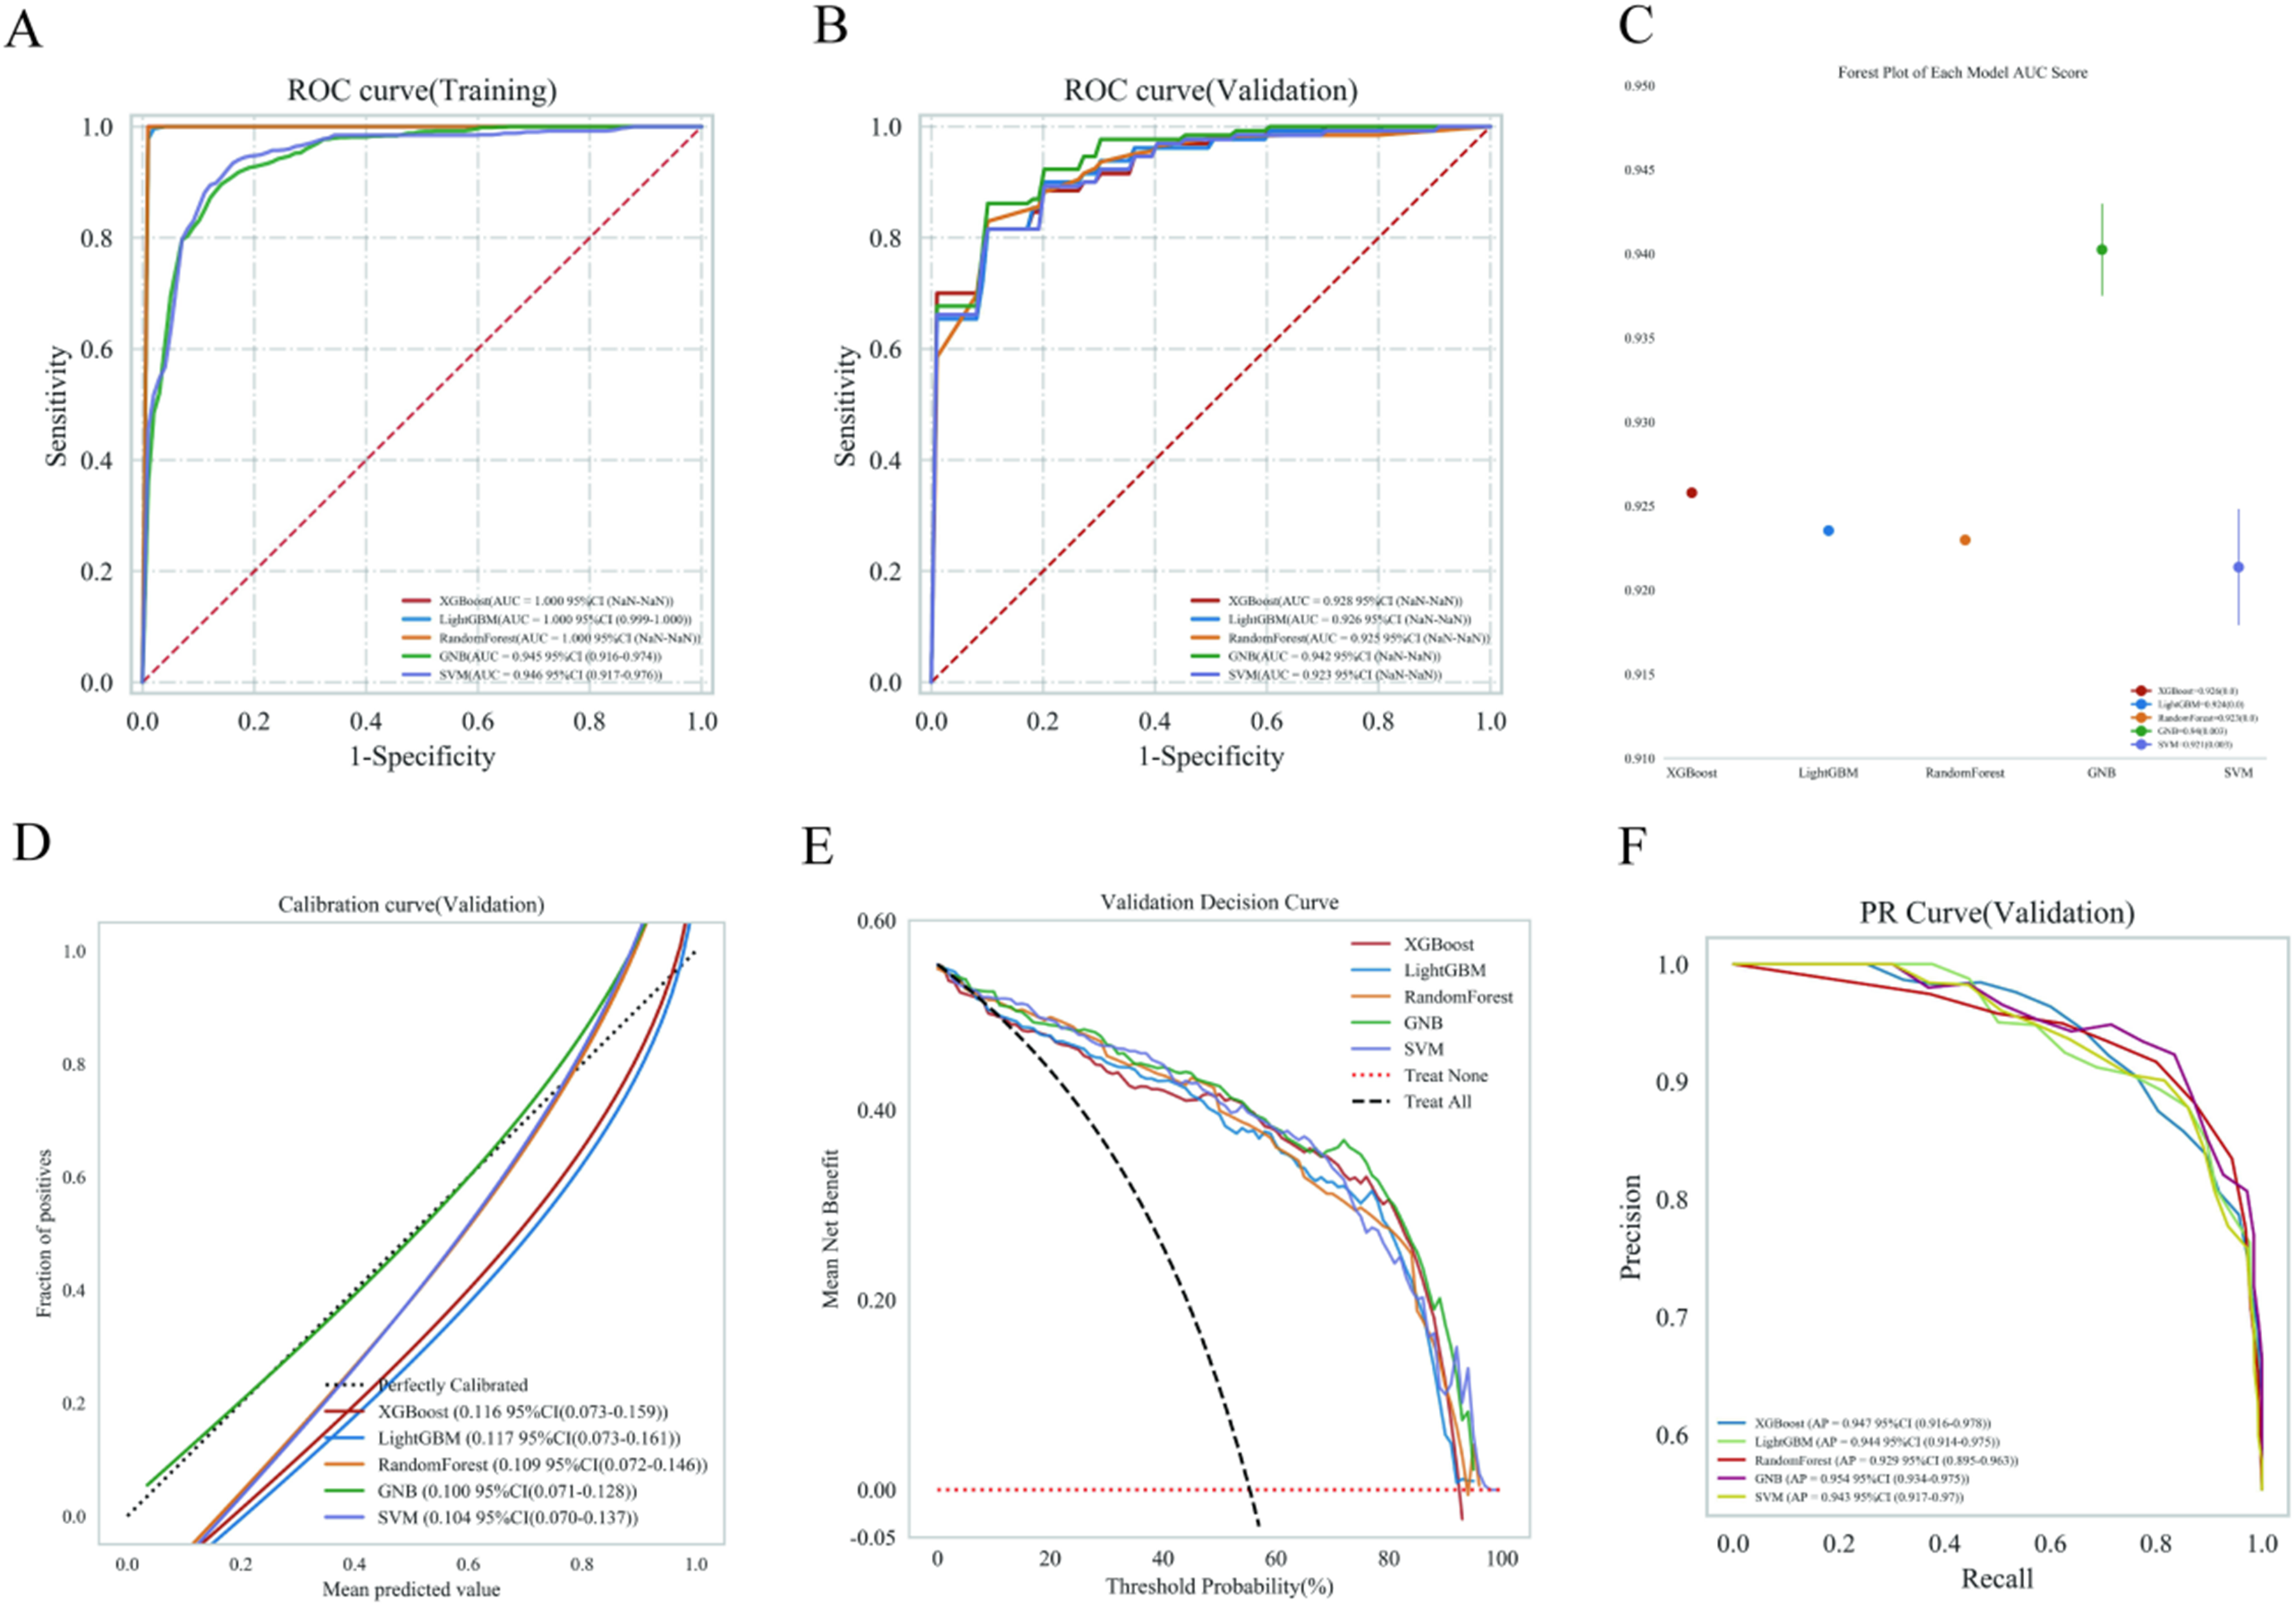
An overview of Machine Learning Model Evaluation: (A) The training dataset's ROC curves and AUC values. (B) For the validation dataset, ROC curves and AUC values were obtained by sampling patients 10 times at a 7:3 ratio. (C) A forest plot illustrates the AUC values for the validation dataset. (D) The validation dataset's calibration curves feature predicted probabilities on the x-axis and actual probabilities on the y-axis. The dashed line serves as a reference, and the solid lines represent different models. (E) The DCA for the validation dataset is outlined, with the black dotted line symbolizing the treatment of all patients, the red line indicating no treatment, and the solid lines referring to various models. (F) The validation dataset presents PR curves and AP values, with precision displayed on the vertical axis and recall on the horizontal axis. More effective models are characterized by PR curves that encompass those of other models and exhibit higher AP values. Different colors represent the various models (Color figure available online).
Development and testing of the most effective models
The model applied the GBN model with ten-fold cross-validation, achieving a mean AUC of 0.947 (95% CI: 0.915–0.980) for the training set, 0.952 (95% CI: 0.923–0.981) for the validation set (Figure 5A, B). The integrated oculo-gait model demonstrated superior performance compared to alternative models. In the testing set, the AUC values were 0.944 (model 1: oculo-gait model), 0.872 (model 2: oculo model), 0.864 (model 3: gait model), 0.848 (GV), 0.777 (TUGG), 0.833 (Antisaccadeacc), 0.751 (SPNabn) (Figure 5C). DeLong's test demonstrated that the Area Under the Curve (AUC) of the combined model was significantly superior to that of the oculo model, the gait model, and other individual indicator models (p < 0.01). Within the threshold range of 0.1–0.8, DCA indicated that Model 1 provided a greater net benefit compared to Model 2 and Model 3 (Figure 5D).
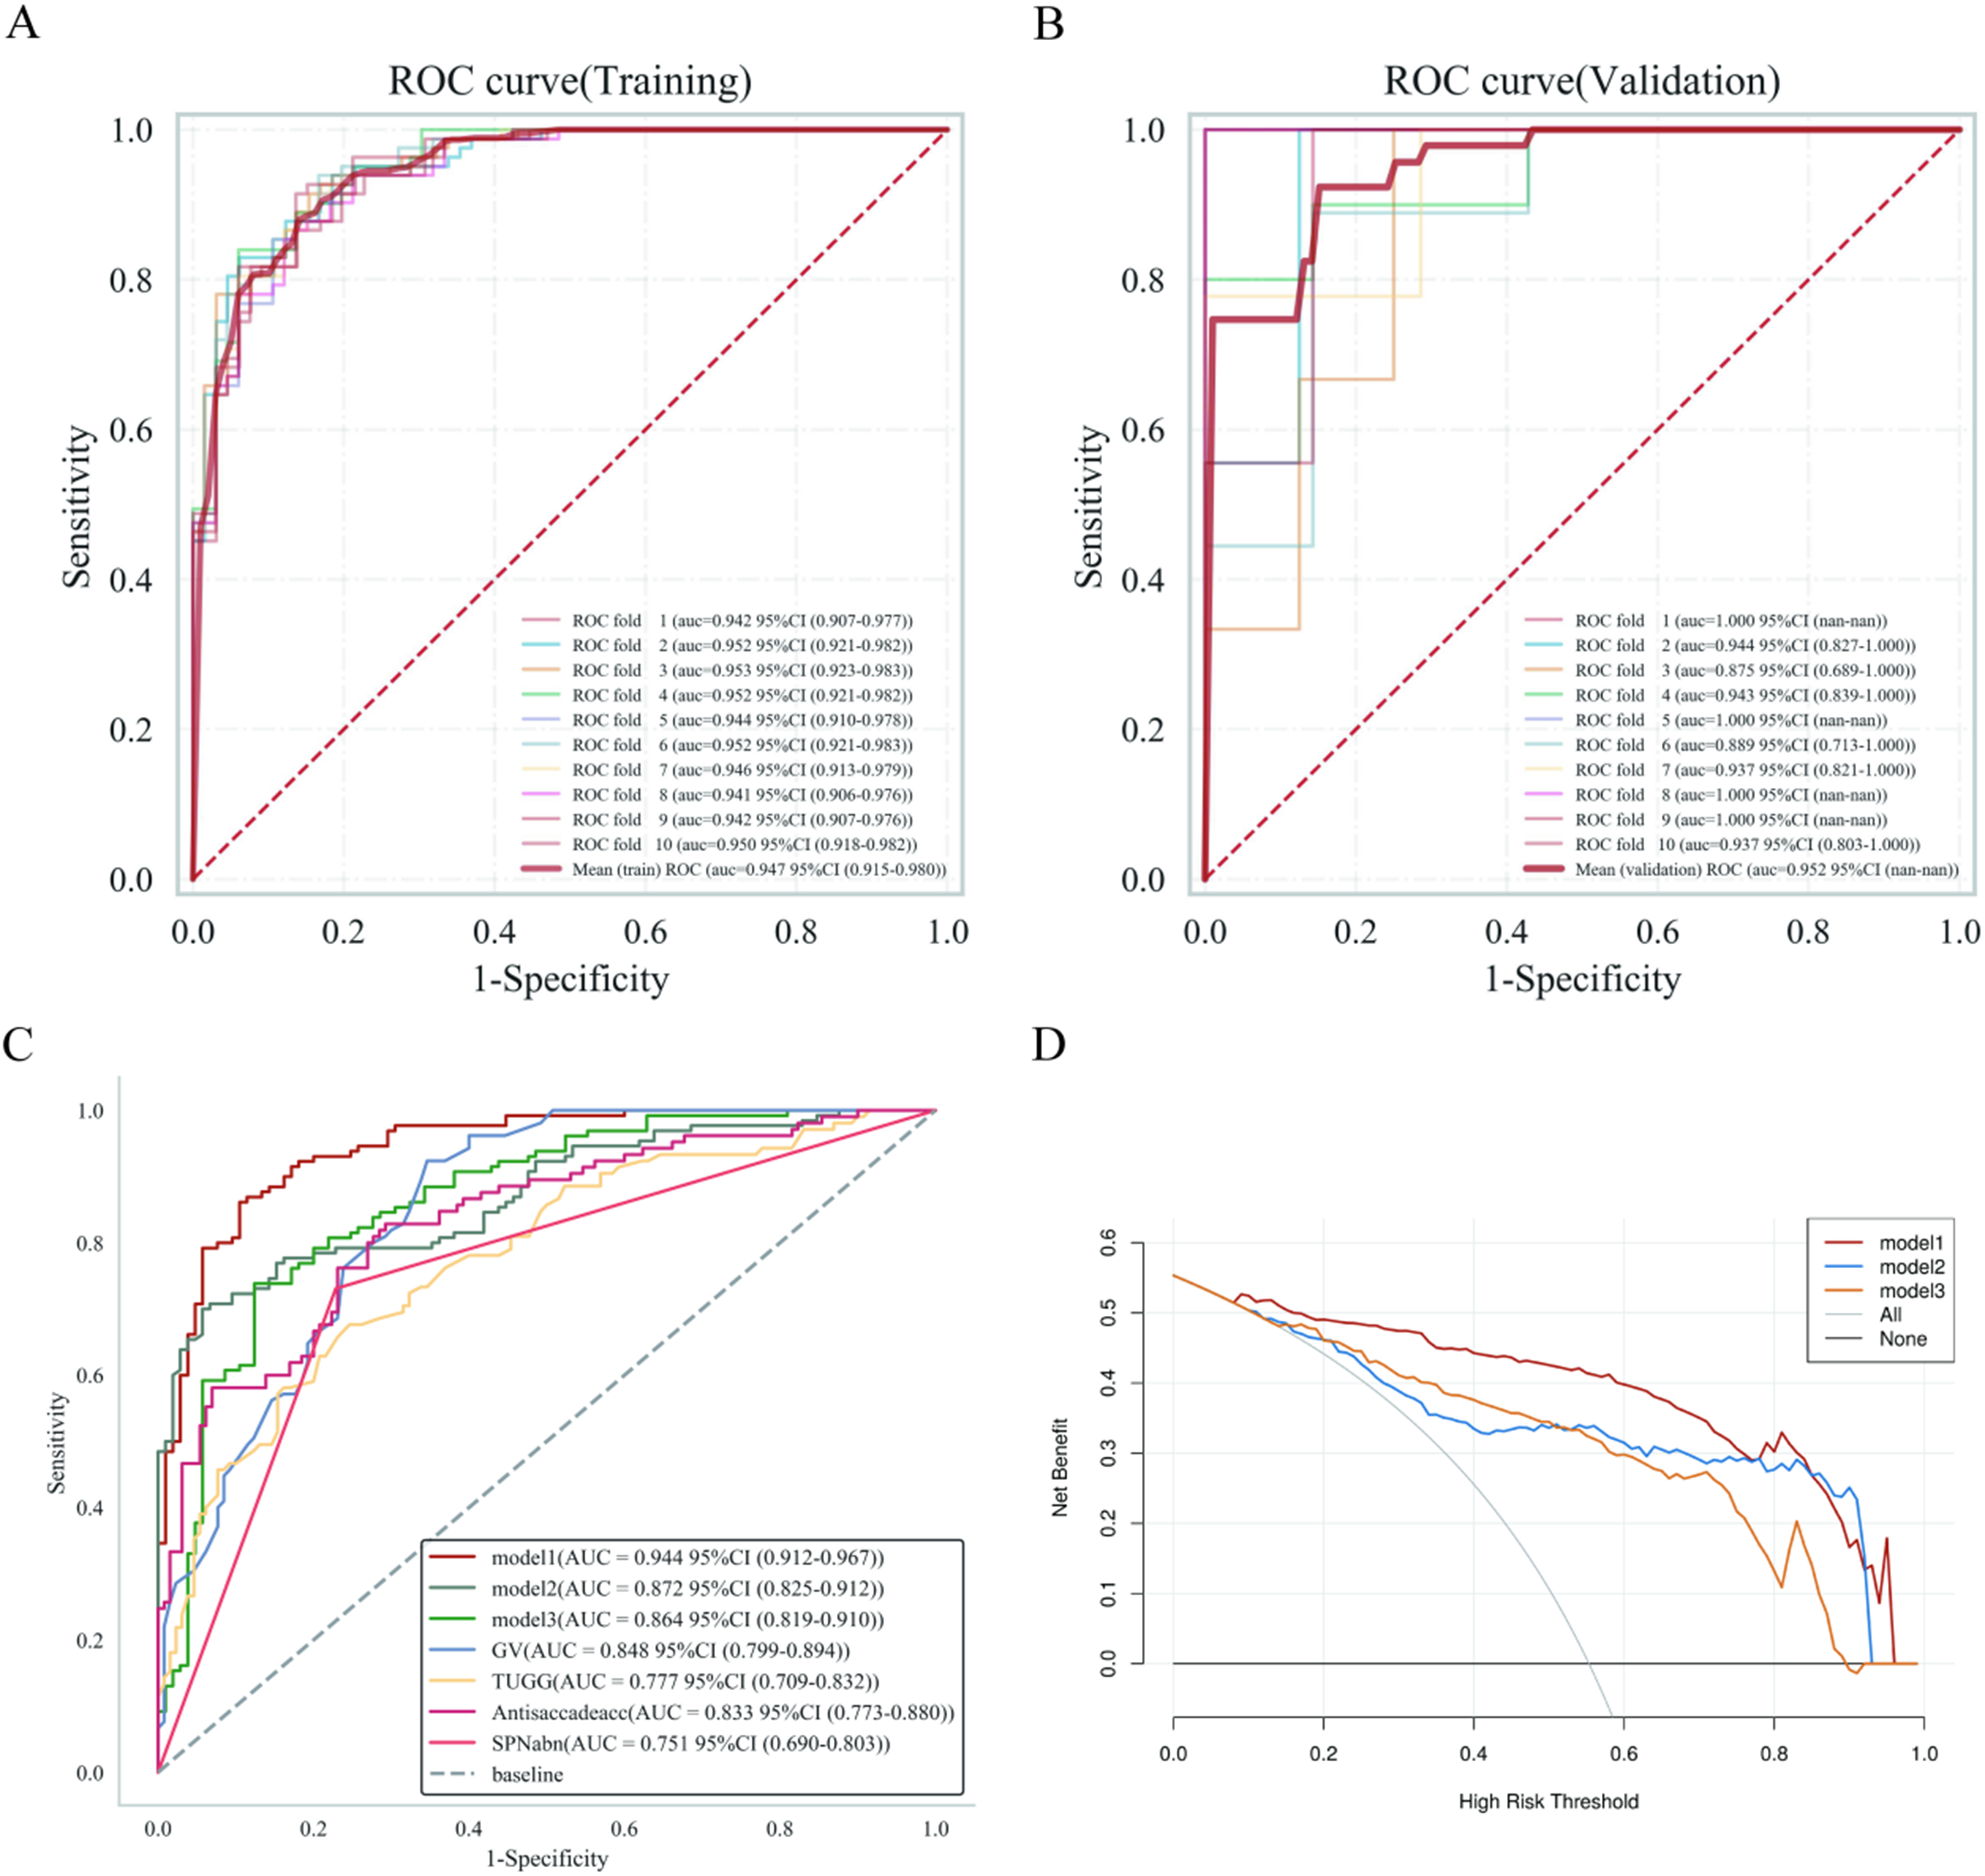
The process of training, validating, and testing the GBN model. (A) The ROC curve along with the AUC for the training dataset. (B) The ROC curve and AUC for the validation dataset, illustrating the training and cross-validation processes for patients (the solid lines in various colors indicate 10 unique outcomes). (C) Comparison of test set ROC curves and AUC values for various models. (D) Comparison of DCA curves for test set models. Model 1: Oculo-gait model, model 2: An oculo model combining Antisaccade and SPNabn, model 3: A gait model combining GV and TUGG, Gv stands for the serial 100-7 subtraction Gait velocity, Antisaccade represents the Anti-saccade task Accuracy, SPNabn denotes the SPN Abnormality Rate, and TUGG means the TUG Single task Ground reaction force.
Model interpretability
The contribution of crucial variables to the detection of MCI was elucidated by making use of the SHAP method. In our model, Figure 6A depicts the four most prominent features. Each point serves to indicate the risk contribution of an individual, where red stands for high risk and blue for low risk. Figure 6B shows the ranking of these risk factors, which is decided by mean absolute SHAP values. For the purpose of showing clinical practicality, two typical cases are given. One is about a patient who detected MCI and got a high SHAP prediction score of 0.90 (Figure 6C), while the other is about a patient who did not detect MCI and obtained a low score of 0.13 (Figure 6D). These instances illustrate the model's effectiveness in risk classification.
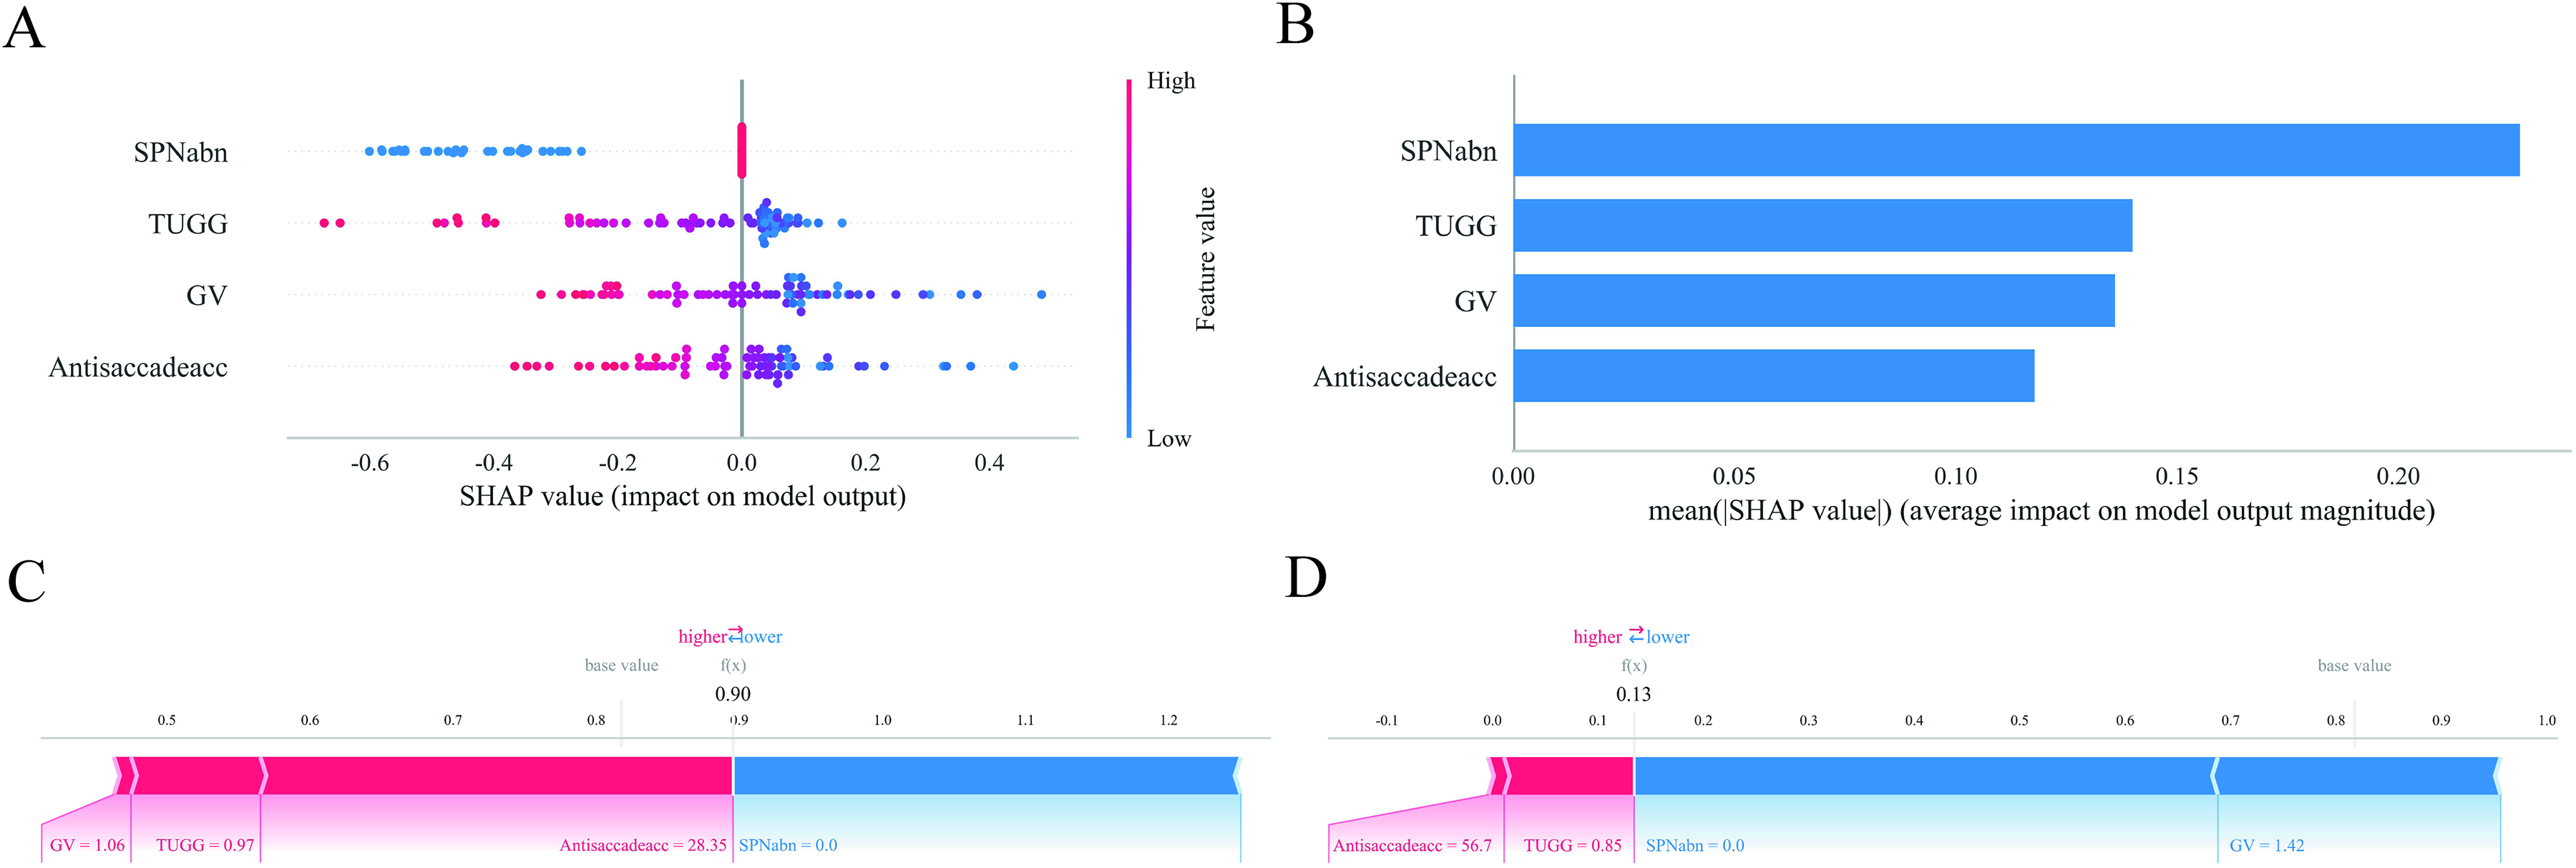
The predictive model was examined utilizing SHAP. (A) A summary visualization of SHAP is shown, illustrating the attributes of features. In this plot, features are listed in rows, while the horizontal axis conveys the SHAP values. High feature values are indicated by red dots, whereas blue dots indicate low feature values. (B) The SHAP-generated feature importance matrix emphasizes the significance of each covariate in the model. (C, D) Examination of the contributions made by individual features for patients with MCI and those without MCI. The influence of each feature on predictions is shown by SHAP values. The bold number indicates the predicted probability (f(x)), whereas the base value signifies the model's output without any features. F(x) is the log-odds ratio. Features in red enhance the risk of MCI, while those in blue reduce it. The length of the arrow indicates the strength of the contribution. Gv stands for the serial 100-7 subtraction Gait velocity, Antisaccade represents the Anti-saccade task Accuracy, SPNabn denotes the SPN Abnormality Rate, and TUGG means the TUG Single task Ground reaction force (Color figure available online).
Discussion
In a comprehensive investigation involving a substantial hospital-based cohort, this study systematically integrated gait and eye movement characteristics to facilitate the early detection of MCI, incorporating evaluations under multi-task conditions. The findings revealed that individuals with MCI exhibited significantly diminished gait speed and stride length, alongside reduced ground reaction forces, during dual-task walking particularly under the serial subtraction (100-7) condition and during the TUG single task. In tasks assessing eye movement, MCI patients demonstrated notable declines in both forward and antisaccade velocity and accuracy, as well as an increased rate of abnormalities in smooth pursuit. Key features identified through LASSO regression, such as dual-task gait speed, ground reaction force, antisaccade accuracy, and smooth pursuit abnormality rate, achieved optimal performance in a GNB model, yielding an AUC of 0.952 in the validation set and 0.944 in an independent test set, thus indicating excellent discriminatory power and generalizability. The SHAP interpretability analysis further corroborated the significance of these features in predicting MCI. Previous research employing analogous methodologies within neurodegenerative contexts has yielded promising results. For instance, a study conducted within a community-dwelling population aged over 65 demonstrated that incorporating gait and eye-tracking data effectively differentiated individuals with SCD from those without (AUC: 0.969). 27 A comprehensive community study, which also utilized dual-task gait and eye movement analysis to detect cognitive impairment, reported an AUC of 0.987. 28 Both studies utilized machine learning algorithms. Collectively, these findings illustrate the substantial promise of integrating gait and eye movement tracking as a non-invasive, objective, and complementary approach for the early detection of cognitive impairment.
Previous research suggests that gait control is not solely dependent on lower-level central pattern generators but also involves dynamic regulation by higher-order brain networks, including the frontal-parietal executive network, hippocampus, and basal ganglia.29–31 Dual-task gait performance is contingent upon executive control and attentional allocation facilitated by the prefrontal cortex, and it is intricately associated with hippocampal functions such as episodic memory—regions that are particularly susceptible to early pathological changes in MCI. 32 The literature frequently employs gait metrics for MCI identification, including single- and dual-task gait speed, stride length, step time, double support time, gait variability, and alterations in these parameters under various dual-task conditions (e.g., serial subtraction, animal verbal fluency). 7 Meta-analyses and large-scale studies consistently underscore the high sensitivity of dual-task gait speed and stride length for the early detection of MCI. Dual-task walking requires the allocation of resources between motor control and cognitive tasks by the frontal cortex, a mechanism that is compromised early in MCI due to declines in executive function. 7 Our findings align closely with existing literature on the association between dual-task gait and cognitive function. Notably, our model highlighted the greater significance of the TUG single-task ground reaction force compared to certain dual-task parameters, which slightly diverges from some studies that emphasize the predominance of dual-task measures. Ground reaction force (GRF) serves as a quantitative measure of neuromuscular control and postural stability in individuals with cognitive impairment. 33 During the single-task Timed Up and Go test, deficiencies in central motor regulation result in distinct GRF anomalies, such as diminished peak magnitude and delayed timing. These anomalies are most pronounced in the second (push-off) peak. which relies on the coordinated contraction of the gastrocnemius muscle. 34 Even in single-task scenarios, deficits in attention allocation are reflected as deviations in the GRF curve, which prove to be more sensitive indicators than traditional parameters, such as gait speed, for detecting disruptions in motor-cognitive integration. Furthermore, GRF metrics demonstrate significant correlations with executive function and visuospatial ability (p < 0.05), highlighting their utility as sensitive biomechanical markers for early cognitive decline.33,34 In our dual-task gait paradigm, we selected three distinct cognitive tasks-serial subtraction (subtracting 7 from 100), verbal fluency (naming fruits), and word recall-based on a pre-established theoretical framework aimed at examining various cognitive domains and levels of cognitive load. 35 Specifically, word recall predominantly engages episodic memory processes mediated by the medial temporal lobe and hippocampus. In contrast, verbal fluency involves semantic retrieval processes associated with the temporal and frontal lobes. Serial subtraction, on the other hand, imposes a sustained, high cognitive load on working memory updating, internal attention allocation, and executive function. 36 Our machine learning model retained only the gait speed data during the serial subtraction task, excluding those from the naming and recall tasks. This outcome aligns with the capacity-sharing theory, which posits that gait speed regulation is dependent on prefrontal–basal ganglia networks. Consequently, serial subtraction competes with gait control for the same limited pool of executive resources, leading to significant cognitive–motor interference. Conversely, tasks characterized by a lower cognitive load or non-overlapping neural networks facilitate compensatory mechanisms that maintain gait speed. 37 Therefore, gait speed during serial subtraction tasks serves as a sensitive indicator of early executive dysfunction and impairment within the prefrontal network. Nevertheless, earlier machine learning models that relied exclusively on dual-task gait for the identification of MCI have demonstrated limited effectiveness, AUC values usually between 0.76 and 0.88.38–40
The precise regulation of eye movements, particularly volitional saccades such as antisaccades and memory-guided saccades, is critically reliant on cognitive control networks that encompass the prefrontal cortex, parietal lobes, and anterior cingulate cortex.41,42 The antisaccade task necessitates the inhibition of reflexive prosaccades toward a suddenly appearing stimulus and the execution of a voluntary eye movement in the opposite direction, thereby serving as a “gold standard” paradigm for evaluating inhibitory control and executive function.26,43 In contrast, smooth pursuit involves the coordinated activity of frontal and temporal regions, as well as the cerebellum, for dynamic visuomotor control, with abnormalities in this function being associated with dysfunction within the medial superior temporal area–frontal eye fields–cerebellar pathways.44,45 Metrics for identifying MCI through eye movement analysis include antisaccade accuracy and latency, prosaccade velocity and accuracy, smooth pursuit gain, and the frequency of corrective saccades. 46 Previous studies consistently indicate that antisaccade measures exhibit greater sensitivity than prosaccade measures. 47 Reduced antisaccade accuracy and increased latency are frequently regarded as early indicators of the MCI stage, indicative of initial deficits in inhibitory control and spatial vector transformation functions associated with MCI. Previous studies have predominantly concentrated on singular or limited eye movement paradigms. Notably, Oyama et al. 48 reported an AUC of 0.888 for a model based on eye movement features, while Lin et al. achieved an AUC of 0.931 using a dual-task model focused solely on eye movements. 28 In our research, antisaccade accuracy and the rate of smooth pursuit abnormality demonstrated strong performance within the eye-movement (gait) -only model, with the overall AUC increasing to a range of 0.944 when integrated with gait features. Additionally, the predominance of smooth pursuit abnormality rates over prosaccade velocity in diagnostic significance may be attributed to several mechanisms. 49 In the early stages of MCI, neurofibrillary tangles and inflammatory plaques are already present in the occipital cortex, accompanied by degenerative changes in key subcortical and cortical oculomotor structures, such as the superior colliculus, medial superior temporal area (MST), frontal eye fields (FEF), and supplementary eye fields (SEF). 49 Smooth pursuit eye movements depend on predictive compensation mechanisms that utilize efference copy and memory to mitigate visual processing delays. Individuals with MCI exhibit a diminished capacity to employ directional cues for initiating anticipatory tracking, which is evidenced by the absence or delay of the initial smooth pursuit component. Additionally, there is a reduced ability to maintain eye velocity during occlusion, reflecting deficits in velocity memory and predictive drive. Collectively, these observations elucidate why smooth pursuit metrics are more sensitive than prosaccade velocity in the detection of MCI. 49 These variations may arise from differences in task design (such as the assessment of eye movements under dual-task conditions in this study), sample characteristics (such as the influence of education level on verbal tasks), and analytical methods (such as the use of the LASSO and SHAP selection mechanisms, which prioritize features with high interactive contributions in the multimodal model).
This study illustrates that the integration of high-dimensional behavioral data, specifically gait and eye movements, with machine learning techniques not only improves the accuracy of early identification of MCI but also yields clinically traceable risk features through interpretable models. This methodology, achievable through low-cost, non-invasive assessments in community settings, shows promise for integration into routine screening protocols for older adults. It has the potential to supplement or partially replace traditional neuropsychological tests, which are often affected by educational level and cultural background. Furthermore, the findings offer novel evidence of behavioral markers that support the theoretical model of “cognitive-motor coupling” as an early intervention opportunity, thereby enhancing the translational potential of multimodal digital biomarkers in the context of neurodegenerative diseases.
The primary limitations of this study encompass its cross-sectional design, which restricts the ability to draw causal inferences, and the necessity for additional validation regarding the representativeness of the sample across multi-center populations. To assess the predictive potential of these behavioral markers for dementia, future research should involve longitudinal tracking. Additionally, efforts should be made to correlate these markers with neuroimaging and fluid biomarkers to enhance understanding of their neurobiological foundations.
Conclusions
In conclusion, this study presents robust evidence advocating for a paradigm shift in the screening of MCI. By incorporating a carefully selected set of gait and eye movement features into an interpretable machine learning model, we have developed a tool that exhibits high accuracy, clinical utility, and biological plausibility. This objective and non-invasive approach offers substantial potential for improving early community screening, facilitating timely interventions, and stratifying individuals for more comprehensive diagnostic evaluations.
Footnotes
Acknowledgements
Ethical considerations
The research protocol received ethical compliance approval from the Institutional Review Board of the Affiliated Hospital of Northwest University (code: SYXSLL-2019-030).
Consent to participate
All participants or their legally authorized representatives provided informed consent.
Consent for publication
Not applicable
Author contribution(s)
Funding
The authors disclosed receipt of the following financial support for the research, authorship, and/or publication of this article: The research was funded by the Xi'an Science and Technology Planning Project [grant number 24YXYJ0013], the National Natural Science Foundation of China [Grant No. 82202800], and the Xi'an Health Commission Research Project [grant number SZL202405].
Declaration of conflicting interests
The authors declared no potential conflicts of interest with respect to the research, authorship, and/or publication of this article.
Data availability statement
The datasets that were created and/or examined during the present study can be obtained from the corresponding author when a reasonable request is made.