
Abstract
Background
Alzheimer's disease (AD) is characterized by presence of extracellular amyloid plaques, intracellular tau tangles, and extensive neuronal cell death. In addition to neurons, astrocytes modulate neuronal network activity through tripartite synapses. Also, astrocytes are increasingly recognized for their involvement in AD pathology. Aberrant astrocytic calcium signaling has been implicated in AD pathological processes, including disrupted synaptic transmission, dysregulated glutamate homeostasis, and impaired vascular function via astrocytic endfeet. Previous investigations have assessed compartment-specific astrocytic calcium transients, yet most employed a restricted range of metrics. Thus, comprehensive analyses of calcium dynamics within individual astrocytic compartments in mouse models of amyloidosis are lacking.
Objective
To analyze spontaneous calcium transients within distinct astrocytic compartments in APP/PS1 mice.
Methods
Using in vivo multiphoton imaging of Yellow Cameleon 3.6, a genetically encoded calcium indicator targeted to astrocytes in APP/PS1 mice, we analyzed spontaneous calcium transients in cortical astrocytes at 4–6 months of age. We quantified event rate, activity duration, area under the curve (AUC), and peak amplitude across four compartments: soma, processes, microdomains, and endfeet. Correlation analyses were used to assess astrocyte synchrony and distance-dependent activity relationships.
Results
In APP/PS1 mice, somas exhibited increased activity duration and peak amplitude, while processes and microdomains showed reduced duration, AUC, and amplitude despite higher event rates. Endfeet showed reductions in all parameters. Correlation analyses revealed enhanced astrocyte synchrony in APP/PS1 mice, with distance-dependent correlation decay observed only in nontransgenic controls.
Conclusions
These findings highlight compartment-specific disruptions of astrocytic calcium activity caused by amyloidosis.
Introduction
Alzheimer's disease (AD) is the most common form of dementia.1,2 It is a neurological disorder 3 with pathological hallmarks of amyloid-β (Aβ) accumulations in the extracellular space and presence of intracellular neurofibrillary tau tangles.4,5 These pathological hallmarks can lead to neuronal dysfunction,6–8 synaptic loss,9,10 neuroinflammation,11–13 blood-brain barrier leakage,14,15 and eventual cell death.13,16,17
Converging evidence suggests that astrocytes might also contribute to neuronal network impairments associated with AD.18–21 Astrocytes actively modulate the neuronal network activity in healthy brains.22,23 Astrocytes form three-way synapses, tripartite synapses, with pre- and post-synaptic neurons.24,25 Astrocytes express ion channels, including K+, Na+, and Ca2+ channels, distinct from neurons. However, astrocytes do not fire action potentials. 26 Intracellular calcium signaling is fundamental to the physiological processes of astrocytes. 26 Astrocytes are activated by neuronal neurotransmitters and neuromodulators via metabotropic G-protein-coupled receptors and exhibit calcium transients. 27 Activated astrocytes release gliotransmitters that signal to neurons. Therefore, astrocytic calcium signaling plays a fundamental role in astrocyte-neuron communication. These astrocyte-dependent functions are disrupted in patients with AD 28 and in AD mouse models.29,30
Amyloidosis leads to astrocytic hyperactivity in anesthetized mice by activating metabotropic purinergic receptors in vivo.20,31 Additional reports suggest that astrocytes are hyperactive in the absence of sensory input, yet are hypoactive during sensory-evoked responses.32,33 These studies offer valuable insights into spontaneous and sensory-evoked calcium signaling in astrocytic somas. However, these studies do not provide detailed information on spontaneous calcium activity of various astrocytic compartments. Astrocytic somas are distinct from primary processes that are adjacent to somas, and microdomains that are adjacent to processes. 34 Astrocytic endfeet ensheathe the vasculature. Astrocytic primary processes and microdomains account for over 80% of the surface area involved in synapse formation, although all compartments, including the soma, could be synaptically connected to neurons. 34 Thus, structural tripartite synapse formation is mostly governed by primary processes and microdomains. While the somas primarily regulates gene expression, astrocytic endfeet are crucial for neurovascular coupling. 35 Therefore, different regions of the astrocytes play distinct roles in maintaining cellular function in a healthy brain. Calcium signaling, essential for cellular function, varies across astrocytic compartments, 36 and aberrations in calcium signaling within distinct astrocytic compartments could have differential effects on AD progression. However, the AD field lacks compartment-specific calcium analyses, particularly in mouse models of amyloidosis.
In this study, we utilized in vivo multiphoton imaging of Yellow Cameleon 3.6 (YC 3.6), a genetically encoded ratiometric calcium sensor, 37 in an anesthetized APP/PS1 mouse model of AD. YC 3.6 was targeted to astrocytes under the GFAP promoter and allowed monitoring spontaneous calcium transients in distinct astrocytic compartments: somas, processes, microdomains and endfeet. We utilized a moderately progressive amyloidosis model in which transgenic mice express a double mutation of human amyloid precursor protein (APP) and presenilin 1 (PS1). 38 Presence of both mutations accelerated disease progression evidenced by accumulations of soluble oligomeric Aβ as well as depositions of amyloid plaques, disruptions of astrocytic calcium transients20,21,33 and memory impairments.
Calcium transients are often classified in the literature simply as hyperactive or hypoactive, relying on limited binary metrics,39–41 that may overlook the nuanced dynamics of these signals. To conduct a comprehensive assessment of astrocytic calcium dynamics, we used five distinct metrics to analyze calcium transients: percentage of active compartments, event rate, activity duration, area under the curve (AUC), and peak amplitude. This approach allowed us to capture the shape and complexity of the calcium transients, rather than constraining their classification to binary states: hyperactive versus hypoactive. We applied the analysis using the five metrics to four distinct astrocytic compartments: somas, processes, microdomains and endfeet. We divided each astrocyte into four astrocytic compartments aimed to elucidate the differences in calcium dynamics between distinct compartments. Furthermore, we determined aberrations in compartment-specific astrocytic dynamics in APP/PS1 and nontransgenic (NTG) mice. This provided a comprehensive characterization of calcium dynamics across the entire astrocytes with high resolution in healthy mice and a mouse model of amyloidosis.
Methods
Experimental animals
This study utilized a transgenic mouse line expressing the Swedish mutation of the amyloid precursor protein and the deltaE9 mutation in presenilin 1 (APPswe/PS1dE9; APP/PS1 mice, stock #034829, The Jackson Laboratory) as well as age-matched nontransgenic littermate controls (NTG mice). 42 Animals were 4–6 months old and included both males and females. All procedures involving mice were performed with the approval of the Massachusetts General Hospital (MGH) Institutional Animal Care and Use Committees (IACUC, protocol # 2012N000085) and followed the relevant guidelines and regulations, including the ARRIVE guidelines. The mice were housed in a pathogen-free environment with four animals per cage and had access to food and water ad libitum. The facility lighting was maintained on an automated 12-h light/12-h dark cycle.
Stereotaxic injection of adeno-associated viral vectors (AAVs) targeting Yellow Cameleon 36
4–6-month-old APP/PS1 and NTG mice were used for astrocytic calcium activity measurements. The animals were anesthetized with isoflurane inhalation (5% induction, 1.75% maintenance), and each were placed into a stereotaxic instrument. The body temperature was maintained with a heating pad during injections. To prevent dryness, eye ointment was carefully applied to the eyes of the mice, and their fur was removed from the scalp using a trimmer. Liquid iodine was then applied to the exposed skin and wiped clean with 70% isopropyl alcohol swabs three times. An incision was made with sterile surgical scissors to expose the skull, and a small burr hole was drilled into the injection site with the following coordinates: anterior-posterior (AP) −1.5 mm, lateral-medial (ML) −1.5 mm, and dorsal-ventral (DV) −0.8 mm. The mice received intracortical viral injections of 3 µL of AAV2/5-gfa2-YC3.6, which specifically targeted Yellow Cameleon 3.6 (YC 3.6, titer=4 × 10¹² vg/ml) to astrocytes in the right somatosensory cortex. While 3 µL is relatively large for an intracortical injection, this volume was necessary to achieve sufficient astrocytic expression for in vivo imaging. The injections were performed using a 33-gauge metal needle and a 10 µl glass syringe controlled by a stereotaxic injector at a rate of 100 nl/min to minimize tissue damage. Following each intracortical injection, the scalp was sutured, and the mice were allowed to recover from anesthesia on a heating pad until they were awake and freely moving. The viral vector was allowed to express for at least four weeks prior to imaging, during which the mice were observed to behave with no observable behavioral abnormalities.
Cranial window installation and multiphoton imaging
After receiving an AAV2/5-gfa2-YC3.6 injection, APP/PS1 and NTG mice underwent cranial window implantation procedures over the injection sites in the right somatosensory cortices. These procedures allowed the monitoring of astrocytic calcium transients using multiphoton microscopy. The animals were anesthetized with isoflurane inhalation (5% induction, 1.75% maintenance), and a round ∼5 mm craniotomy was performed using a dental drill. A 5 mm glass coverslip was then placed over the cortex, and the coverslip was secured to the skull with a mixture of Krazy glue and dental cement. A mode-locked titanium/sapphire laser (Mai Tai; Spectra-Physics, Fremont, CA) was used to generate two-photon fluorescence with 860 nm excitation, and three photomultiplier tubes (Hamamatsu Photonics, Japan) were used to detect fluorescence emissions in the range of 380–480 nm, 500–540 nm, and 560–650 nm. A 2-photon microscope (Olympus) was used to image YC 3.6-expressing astrocytes with a 25X water immersion objective (NA = 1.05, Olympus). Time-lapse images were acquired immediately following craniotomy from the somatosensory cortex (layer II/III) at a resolution of 256 × 256 pixels and a sampling rate of 2 µs per pixel (2 frames per second). Fields of view (FOVs) were selected using a standardized protocol across all animals and groups, based on clear astrocytic labeling and signal quality, without prior knowledge of activity patterns. Regions with artifacts were excluded. The same number of FOVs per animal and identical imaging parameters were maintained, with spatial separation to avoid repeated sampling.
To minimize phototoxicity, the laser power was kept below 50 mW as measured at the back focal plane of the objective. 150 µl of Texas red dextran (70 kDa; 12.5 mg/ml in PBS; Invitrogen) was administered by retroorbital injections to label the vasculature and imaged using multiphoton microscopy through cranial windows. Mice were euthanized using CO2 inhalation after acquiring multiphoton images.
Image analysis
ImageJ/FIJI (NIH) was used to process timelapse images of compartment-specific YC 3.6-expression within cortical astrocytes. First, each timelapse (250 s long) was loaded into ImageJ and split into the YFP and CFP channels. Regions of interest (ROIs) containing either somas, processes, microdomains, or endfeet were selected manually. Astrocytic processes were identified as thin extensions emanating from the soma. Endfeet were specifically identified by their close apposition to blood vessels, which were visualized via intravascular labeling with Texas Red dextran, enabling unambiguous delineation of perivascular astrocytic structures. ROIs were manually segmented on time-averaged images to ensure structural clarity and consistency, with care taken to avoid overlap between compartments. The same criteria were applied uniformly across all animals and groups. The raw mean grey values for each ROI of the YFP and CFP channels were measured. The YC 3.6 ratios were calculated by dividing the emitted fluorescence intensity of YFP by CFP. A custom MATLAB script was used to generate calcium traces (plotted as ΔR/Ro over time) for each ROI. To determine the ΔR/Ro values, baseline ratio (Ro) was calculated using the asymmetric least-squares mean smoothing method,43,44 which allowed us to find a variable baseline Ro without requiring prior information about the peak areas of the signal. The ratio change over the baseline was calculated using the following equation: ΔR/Ro = (R − Ro)/Ro, where R is instantaneous ratio. Ca2+ transients were identified as changes in ΔR/R+ exceeding four times the standard deviation (σ) of noise band. Noise band was estimated from ΔR/Ro values within the 20th to 50th percentile range, 45 depending on compartment activity, to minimize contamination from transients. The resulting detection threshold was conservatively set at 4σ, typically corresponding to ∼0.2 ΔR/Ro. The active cell compartment was defined as having activity above this threshold. The AUC was calculated as the sum of the areas under all calcium transient events within each ROI over the recording period. Events were defined as ΔR/Ro signals exceeding a threshold. For each event, the AUC was computed by integrating the signal above this threshold from event onset to return below threshold, and total AUC per ROI was obtained by summing across all detected events. A similar approach was used to calculate activity duration, defined as the total time the signal remained above threshold. Peak amplitude values were calculated using MATLAB's findpeaks function, which returned the local maxima of the trace, and the number of detected peaks was defined as the event count. Calcium activity was analyzed continuously over the full 250-s recording as a timelapse and was not segmented into discrete intervals. Event counts were normalized to recording duration and expressed as event rate (events per 60 s). Similarly, AUC and cumulative activity durations were normalized to recording length by dividing by 250 s and scaling to a 60-s period (i.e., value ÷ 250 × 60). All quantitative analyses and statistical comparisons were performed on these per-ROI, time-normalized values, preserving the full temporal resolution of the recording and ensuring that reported timelapse statistics reflect overall activity throughout the recording. Pairwise correlations were calculated for each combination of somas within a timelapse using Pearson's Linear Correlation Coefficient and were compared between the two groups. To determine the distances between the somas, the centroids of the somas were exported from ImageJ to MATLAB script to calculate the Euclidean distance. Pairwise correlation values between somas were binned over a distance of 10 μm, and a relationship between pairwise correlation and distance was determined.
Statistical analyses
All statistical analyses were performed using MATLAB (version R2023a). The Shapiro-Wilk normality test was performed to assess the data distribution. Data sets comparing NTG and APP/PS1 were analyzed using a two-sample Student's t-test. Pearson's Linear Correlation Coefficient was used to measure the correlation between distance and pairwise correlations. The Kolmogorov-Smirnov (K-S) test was used to compare pairwise correlations between the groups. Statistical significance was set at p < 0.05. *p < 0.05, **p < 0.01, ***p < 0.001.
Results
Calcium transients in the astrocytic soma of APP/PS1 mice exhibited a longer activity duration and increased amplitude compared to those of NTG controls
We investigated whether cortical astrocytes exhibited altered spontaneous calcium activity in APP/PS1 mice compared to astrocytes in NTG littermate controls. Astrocytes were targeted with the ratiometric calcium indicator Yellow Cameleon 3.6 (YC 3.6) via the GFAP promoter in the somatosensory cortex. We assessed the expression of YC 3.6 and confirmed its presence in the somas, processes, microdomains, and endfeet of NTG and APP/PS1 mice (Figure 1A-C). Astrocytic calcium transients were visualized using multiphoton microscopy in anesthetized mice. Here we included both low frequency, high amplitude 20 and high frequency (limited to 1 Hz), low amplitude astrocytic calcium transients 21 in our analyses. The high frequency, low amplitude calcium transients within astrocytes are often dismissed as noise in the literature, however these calcium events have physiological relevance to sleep-dependent brain rhythms.21,46,47 Thus, high frequency, low amplitude calcium transients were included here.
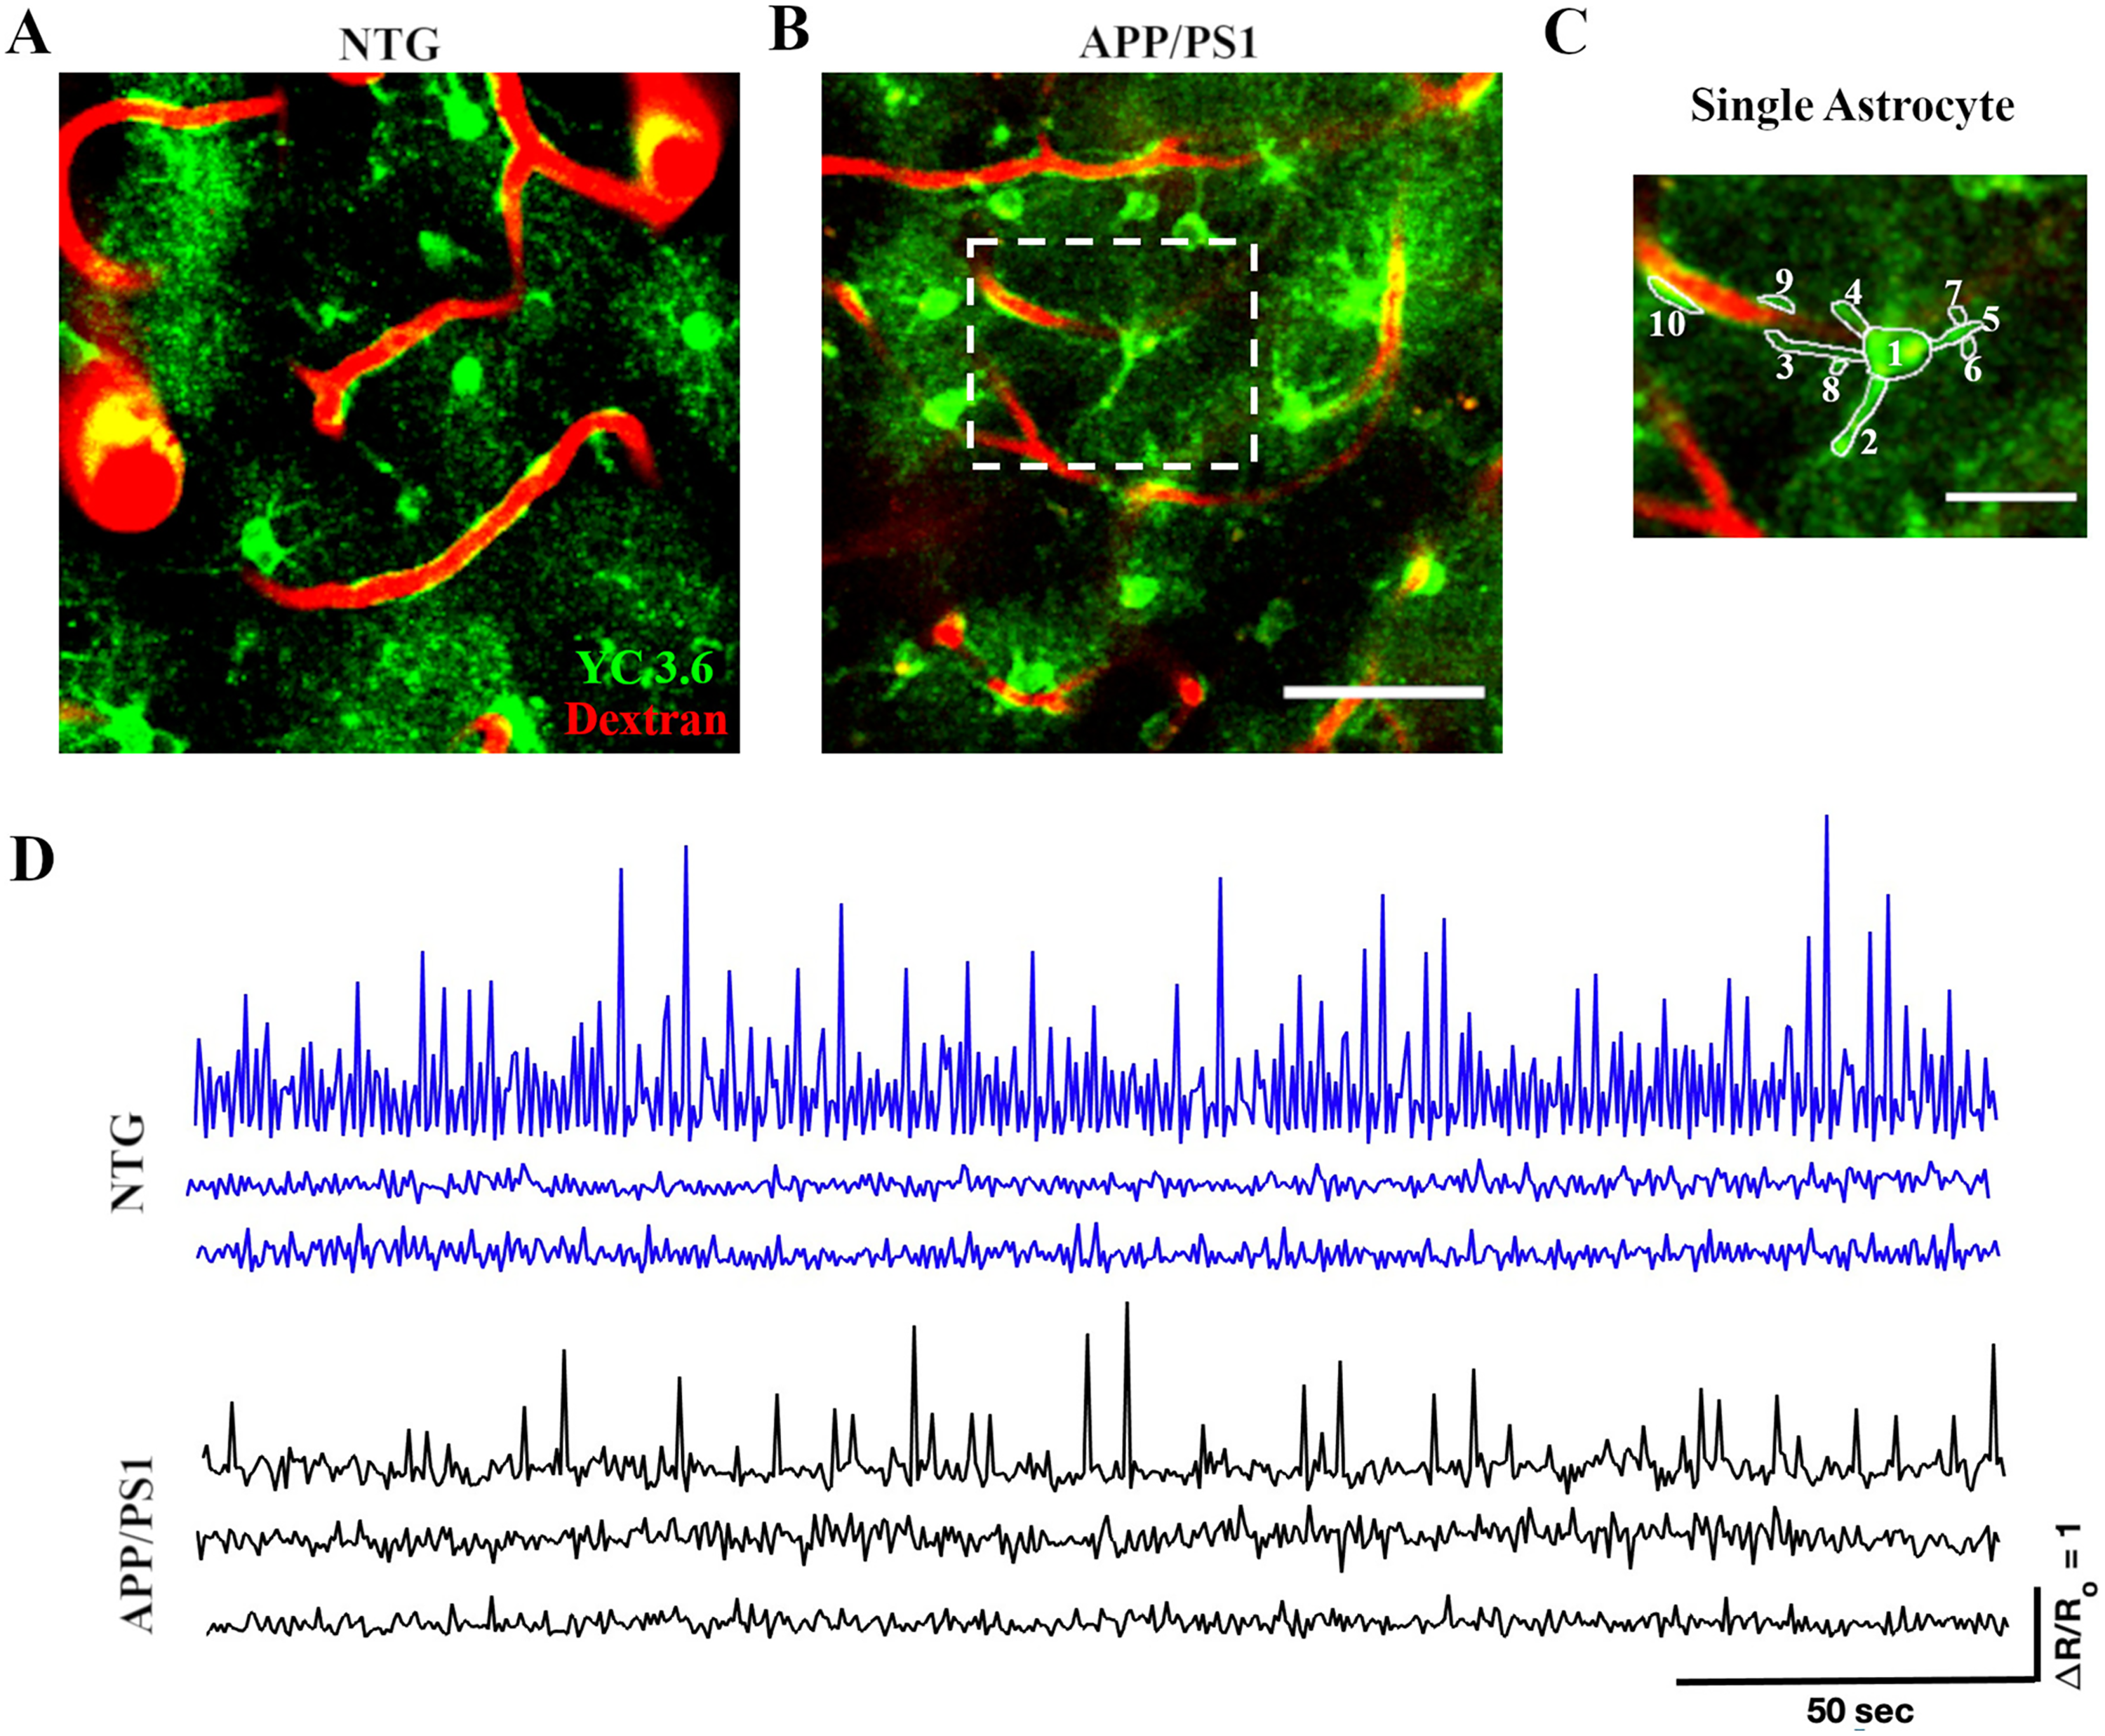
Yellow Cameleon 3.6 (YC 3.6) was expressed within different astrocytic compartments in nontransgenic (NTG) and APP/PS1 mice. (A) YC 3.6 expression (green) in astrocytic soma, processes, microdomains and endfeet in NTG mice. (B) YC 3.6 expression (green) in astrocytic soma, processes, microdomains and endfeet in APP/PS1 mice. Dextran red shows the blood vessels. Scale bar, 50 μm. (C) The higher magnification image of a single astrocyte shows the area bounded by dashed white box in (B). ROI 1 corresponds to the astrocyte soma; ROIs 2–5 capture processes; ROIs 6–8 represent microdomains; and ROIs 9–10 correspond to endfeet. Scale bar, 20 μm. (D) Representative calcium traces that include both high- and low-amplitude events analyzed in this study.
To develop a comprehensive understanding of calcium activity at subcellular resolution, we selected the ROIs pertaining to distinct astrocytic compartments, including somas, processes, microdomains, as well as endfeet (Figure 1C). Astrocytic calcium transients were analyzed separately in each compartment. Representative calcium traces (Figure 1D) show both high- and low-amplitude events, reflecting the detection of high-amplitude, low-frequency and low-amplitude, high-frequency astrocytic calcium activity. Supplemental Figure 1 illustrates the conversion of YFP/CFP ratios to ΔR/Ro and provides an example of the calculated detection threshold for a representative trace.
To monitor calcium transients in astrocytic somas, we manually selected the somas as ROIs (Figure 2A). A total of 480 somas were identified across 64 timelapses in seven APP/PS1 mice. 448 somas were identified across 64 timelapses in seven NTG mice. We generated astrocytic calcium activity traces, calcium transients, measured as ΔR/Ro over time for each ROI, where ΔR is the difference between the R ratio of YC 3.6 and Ro, while Ro is the baseline ratio (Figure 2B, C). ΔR/Ro traces for active (Figure 2B) and inactive somas (Figure 2C) were thresholded, and calcium transient analysis was performed (see Methods for more details). We determined percentages of active and inactive somas. We found that the percentages of active somas were comparable in NTG and APP/PS1 mice (64.38% active somas in NTG mice and 67.19% active somas in APP/PS1 mice, Chi-square (χ2) test, χ2= 0.83, p = 0.37) (Figure 2D). We also analyzed calcium events by calculating event rate, cumulative activity duration, cumulative area under the curve, and peak amplitude. The cumulative activity duration of astrocytic somas was significantly higher in APP/PS1 mice than the cumulative activity duration in NTG mice (42.37 [41.54, 43.24] seconds and 42.24 [41.41, 43.1] seconds, respectively, median [Q1 (1st Quartile), Q3 (3rd Quartile)], two-sample student's t-test p = 0.013) (Figure 2F). Similarly, the peak amplitude values of astrocytic somas in APP/PS1 mice were significantly higher than those in NTG mice (0.35 [0.3, 0.46] and 0.29 [0.23, 0.42] respectively, two-sample Student's t-test p = 0.035) (Figure 2H). In contrast, there was no significant difference in the event rate of astrocytic somas (1.44 [0, 9.48] transients/min and 1.68 [0, 9.6] transients/min, respectively, two-sample Student's t-test, p = 0.93) between APP/PS1 and NTG mice (Figure 2E). Furthermore, there was no significant difference in the cumulative area under the curve of astrocytic somas (0.03 [0, 0.3] s and 0.03 [0, 0.26] s, respectively, two-sample Student's t-test, p = 0.06) between APP/PS1 and NTG mice (Figure 2G). Based on these results, we concluded that astrocytic soma in APP/PS1 mice displayed calcium signals with extended duration and heightened magnitude when compared to those in NTG counterparts (Figure 2B).
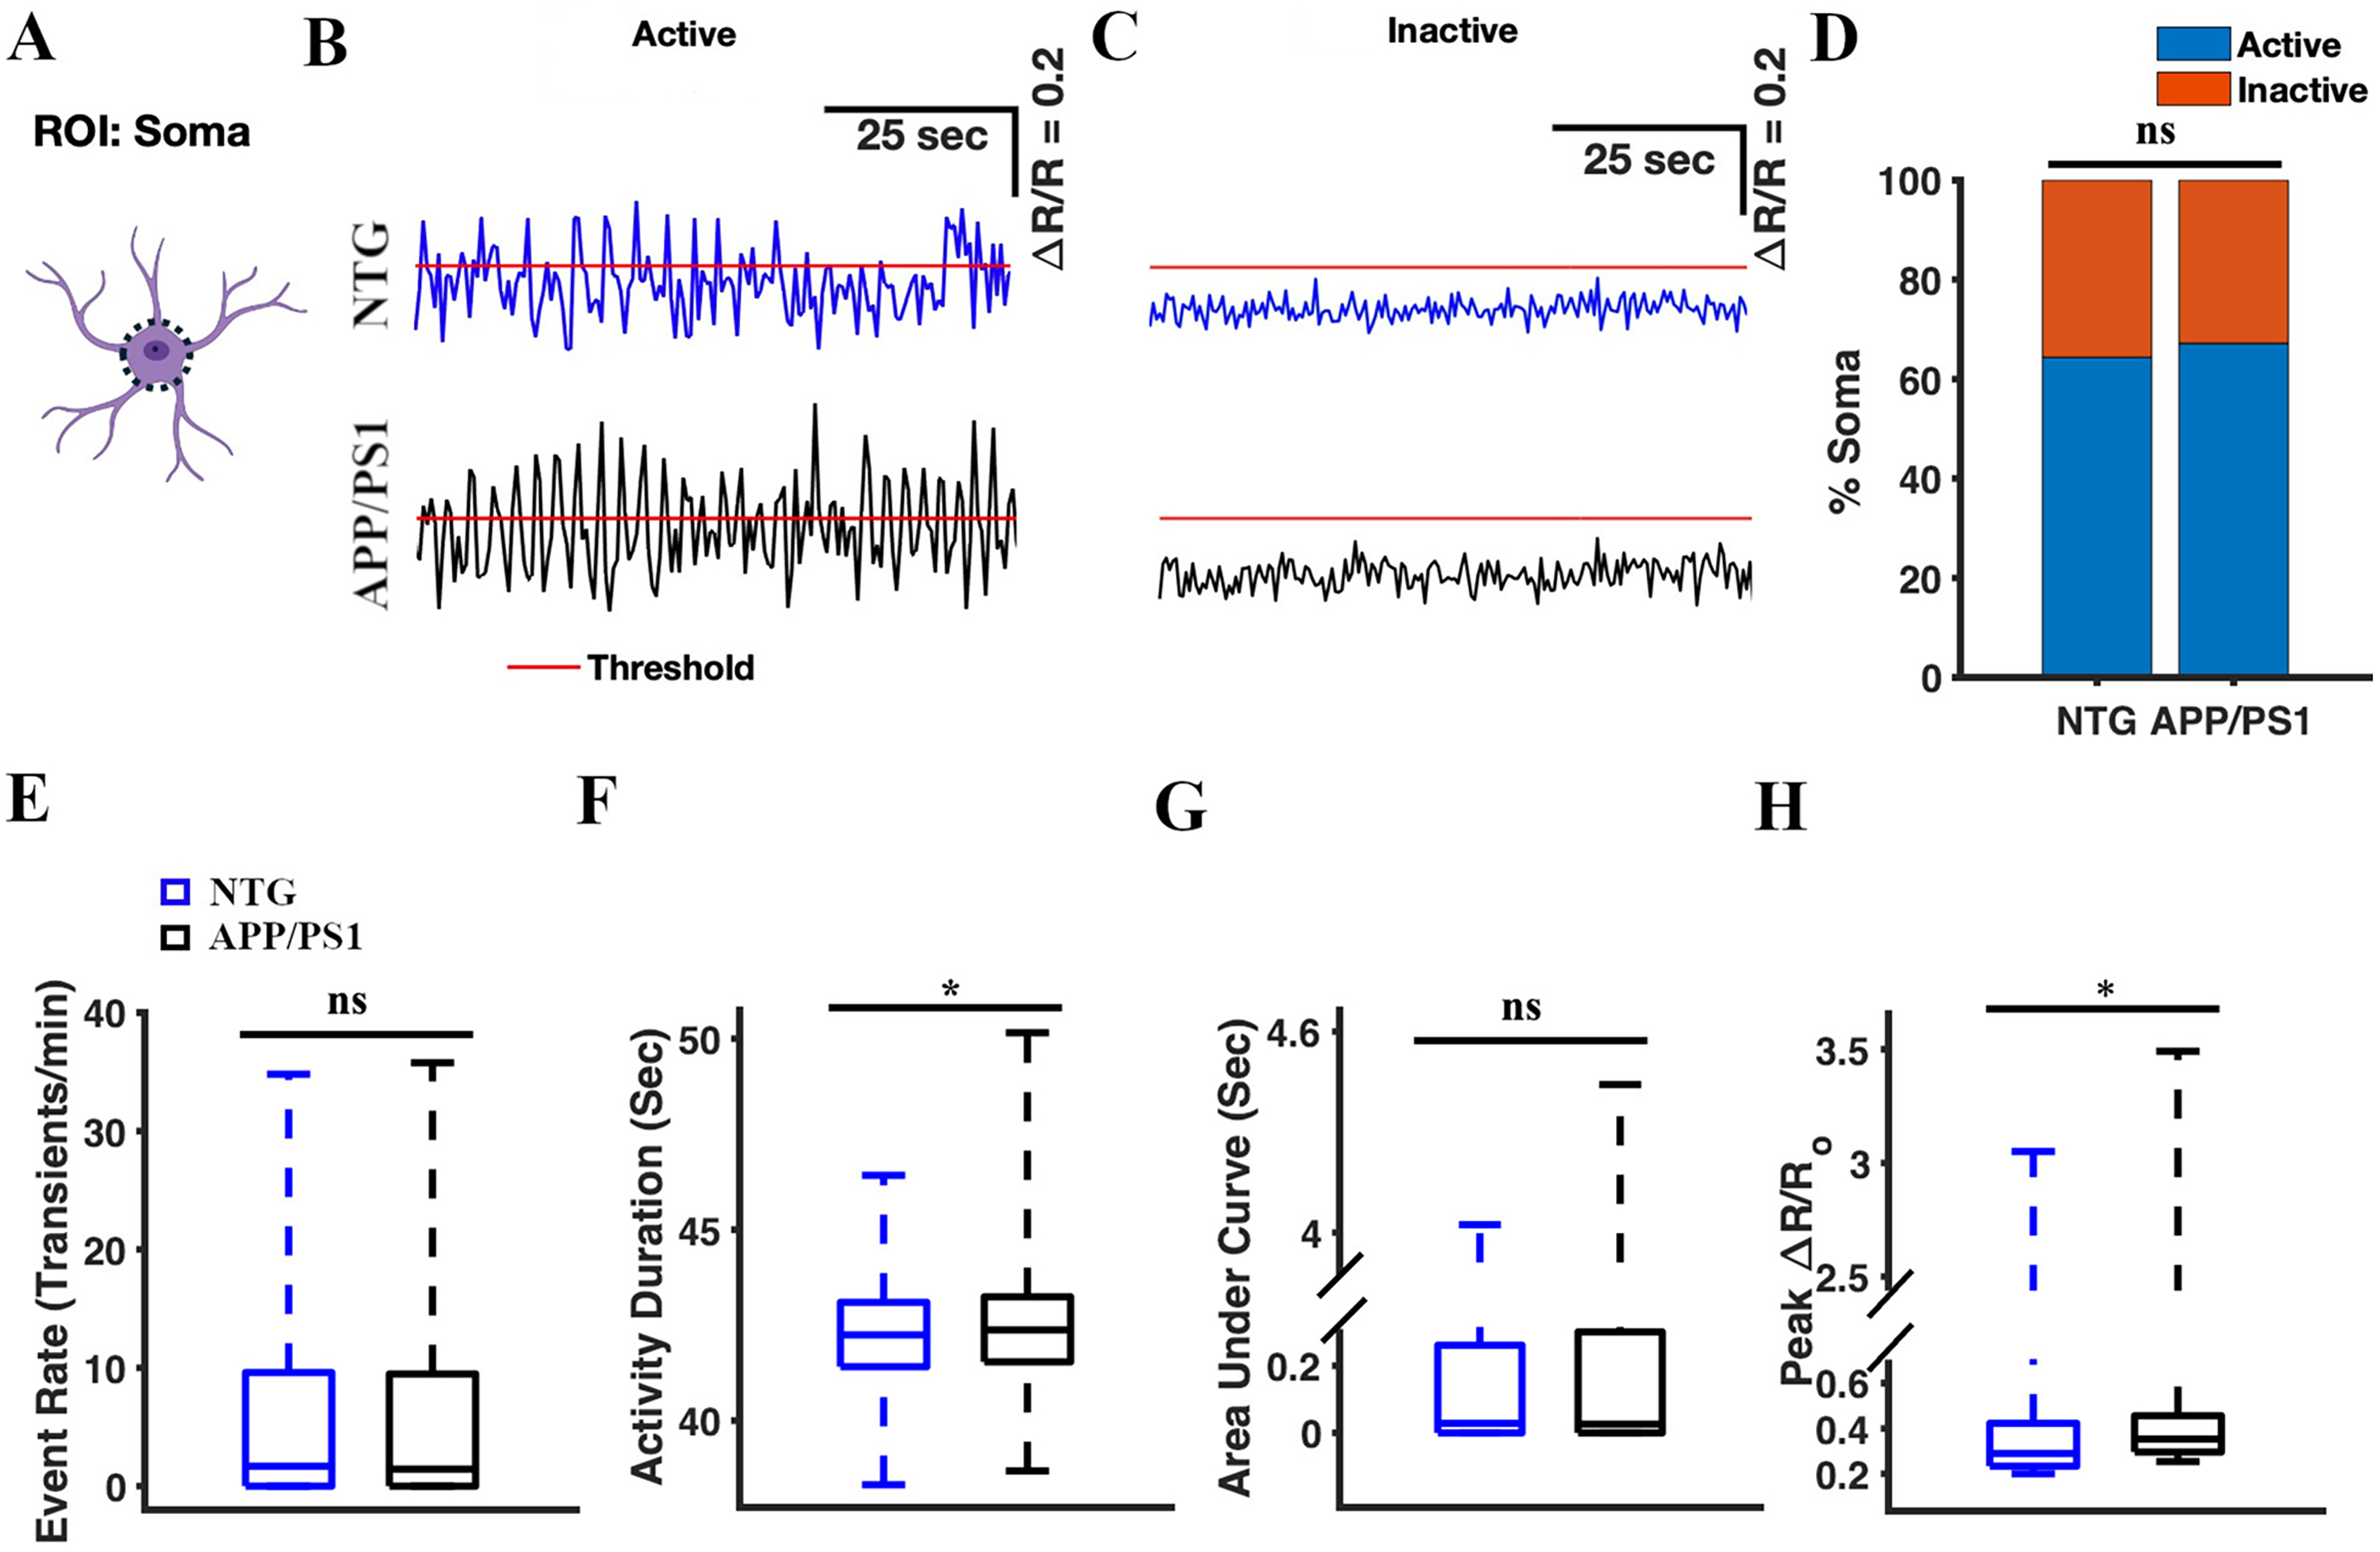
Astrocytic calcium activity in the soma of APP/PS1 mice showed elevated activity duration and higher amplitude of calcium events compared to NTG controls. (A) Astrocyte schematic outlining the region of interest (ROI: soma) where activity was measured. Representative active (B) and inactive (C) traces of astrocytic Ca2+ activity in the soma of the NTG (blue) and APP/PS1 (black) mice. Red line represents threshold. Traces above the threshold are considered active, while those below are considered inactive. (D) Percentage of active somas in NTG control and APP/PS1 mice. The chi-square test was used to measure statistical significance. (E) Box plot of the event rate of astrocytic Ca2+ activity in the soma. The event rates were calculated using a ΔR/R threshold of 0.2 (see materials and methods). (F) Box plot of the cumulative duration of astrocytic Ca2+ activity in the somas. (G) Box plot of the area under the curve of astrocytic Ca2+ activity in somas. (H) Box plot of ΔR/R peak values from astrocytic Ca2+ activity in somas. Statistical significance for panels E–H was assessed using a two-sample Student's t-test, *p < 0.05, ***p < 0.001, n.s, not significant.
Calcium transients in the astrocytic processes of APP/PS1 mice exhibited a higher frequency, shorter activity duration, decreased intensity (AUC), and reduced amplitude compared to those of NTG controls
We analyzed spontaneous calcium transients in the astrocytic processes (Figure 3). We confirmed the YC 3.6 expression in the astrocytic processes (Figure 1) and manually selected the processes as ROIs (Figure 3A). We identified 423 processes across 64 timelapses in seven NTG mice, and 257 processes across 64 timeplases in seven APP/PS1 mice. We analyzed the calcium traces (ΔR/Ro) for active and inactive process ROIs (Figure 3B, C). The percentages of active processes were high and comparable in NTG and APP/PS1 mice (99.05% active in NTG mice and 97.67% processes active in APP/PS1 mice, Chi-square test, χ2 = 2.13, p = 0.14) (Figure 3D). The cumulative activity duration in astrocytic processes was significantly lower in APP/PS1 mice than that in NTG mice (7.5 [3.41, 13.57] seconds and 12.65 [5.0, 19.71] seconds, respectively, two-sample student's t-test p = 3.27 × 10⁻⁹) (Figure 3F). Similarly, the cumulative area under the curve was significantly lower in APP/PS1 mice than in NTG controls (1.04 [0.37, 2.52] s and 0.25 [0.32, 0.42] s, respectively, two-sample Student's t-test p = 1.87 × 10⁻⁸) (Figure 3G). The peak amplitude values of astrocytic processes in APP/PS1 mice were significantly lower than those in NTG mice (0.29 [0.24, 0.37] and 0.25 [0.32, 0.42], respectively, two-sample student's t-test p = 8.09 × 10⁻⁵) (Figure 3H). However, the event rate of astrocytic processes was significantly higher in APP/PS1 mice than that in NTG mice (27.36 [19.74, 29.16] transients/min and 19.68 [13.26, 24.63] transients/min, respectively, two-sample Student's t-test p = 8.09 × 10⁻⁵) (Figure 3E). These findings suggested that calcium transients in astrocytic processes of APP/PS1 mice exhibited increased frequency, shorter duration, lower intensity (AUC), and smaller amplitude compared to astrocytic calcium transients in NTG controls (Figure 3B).
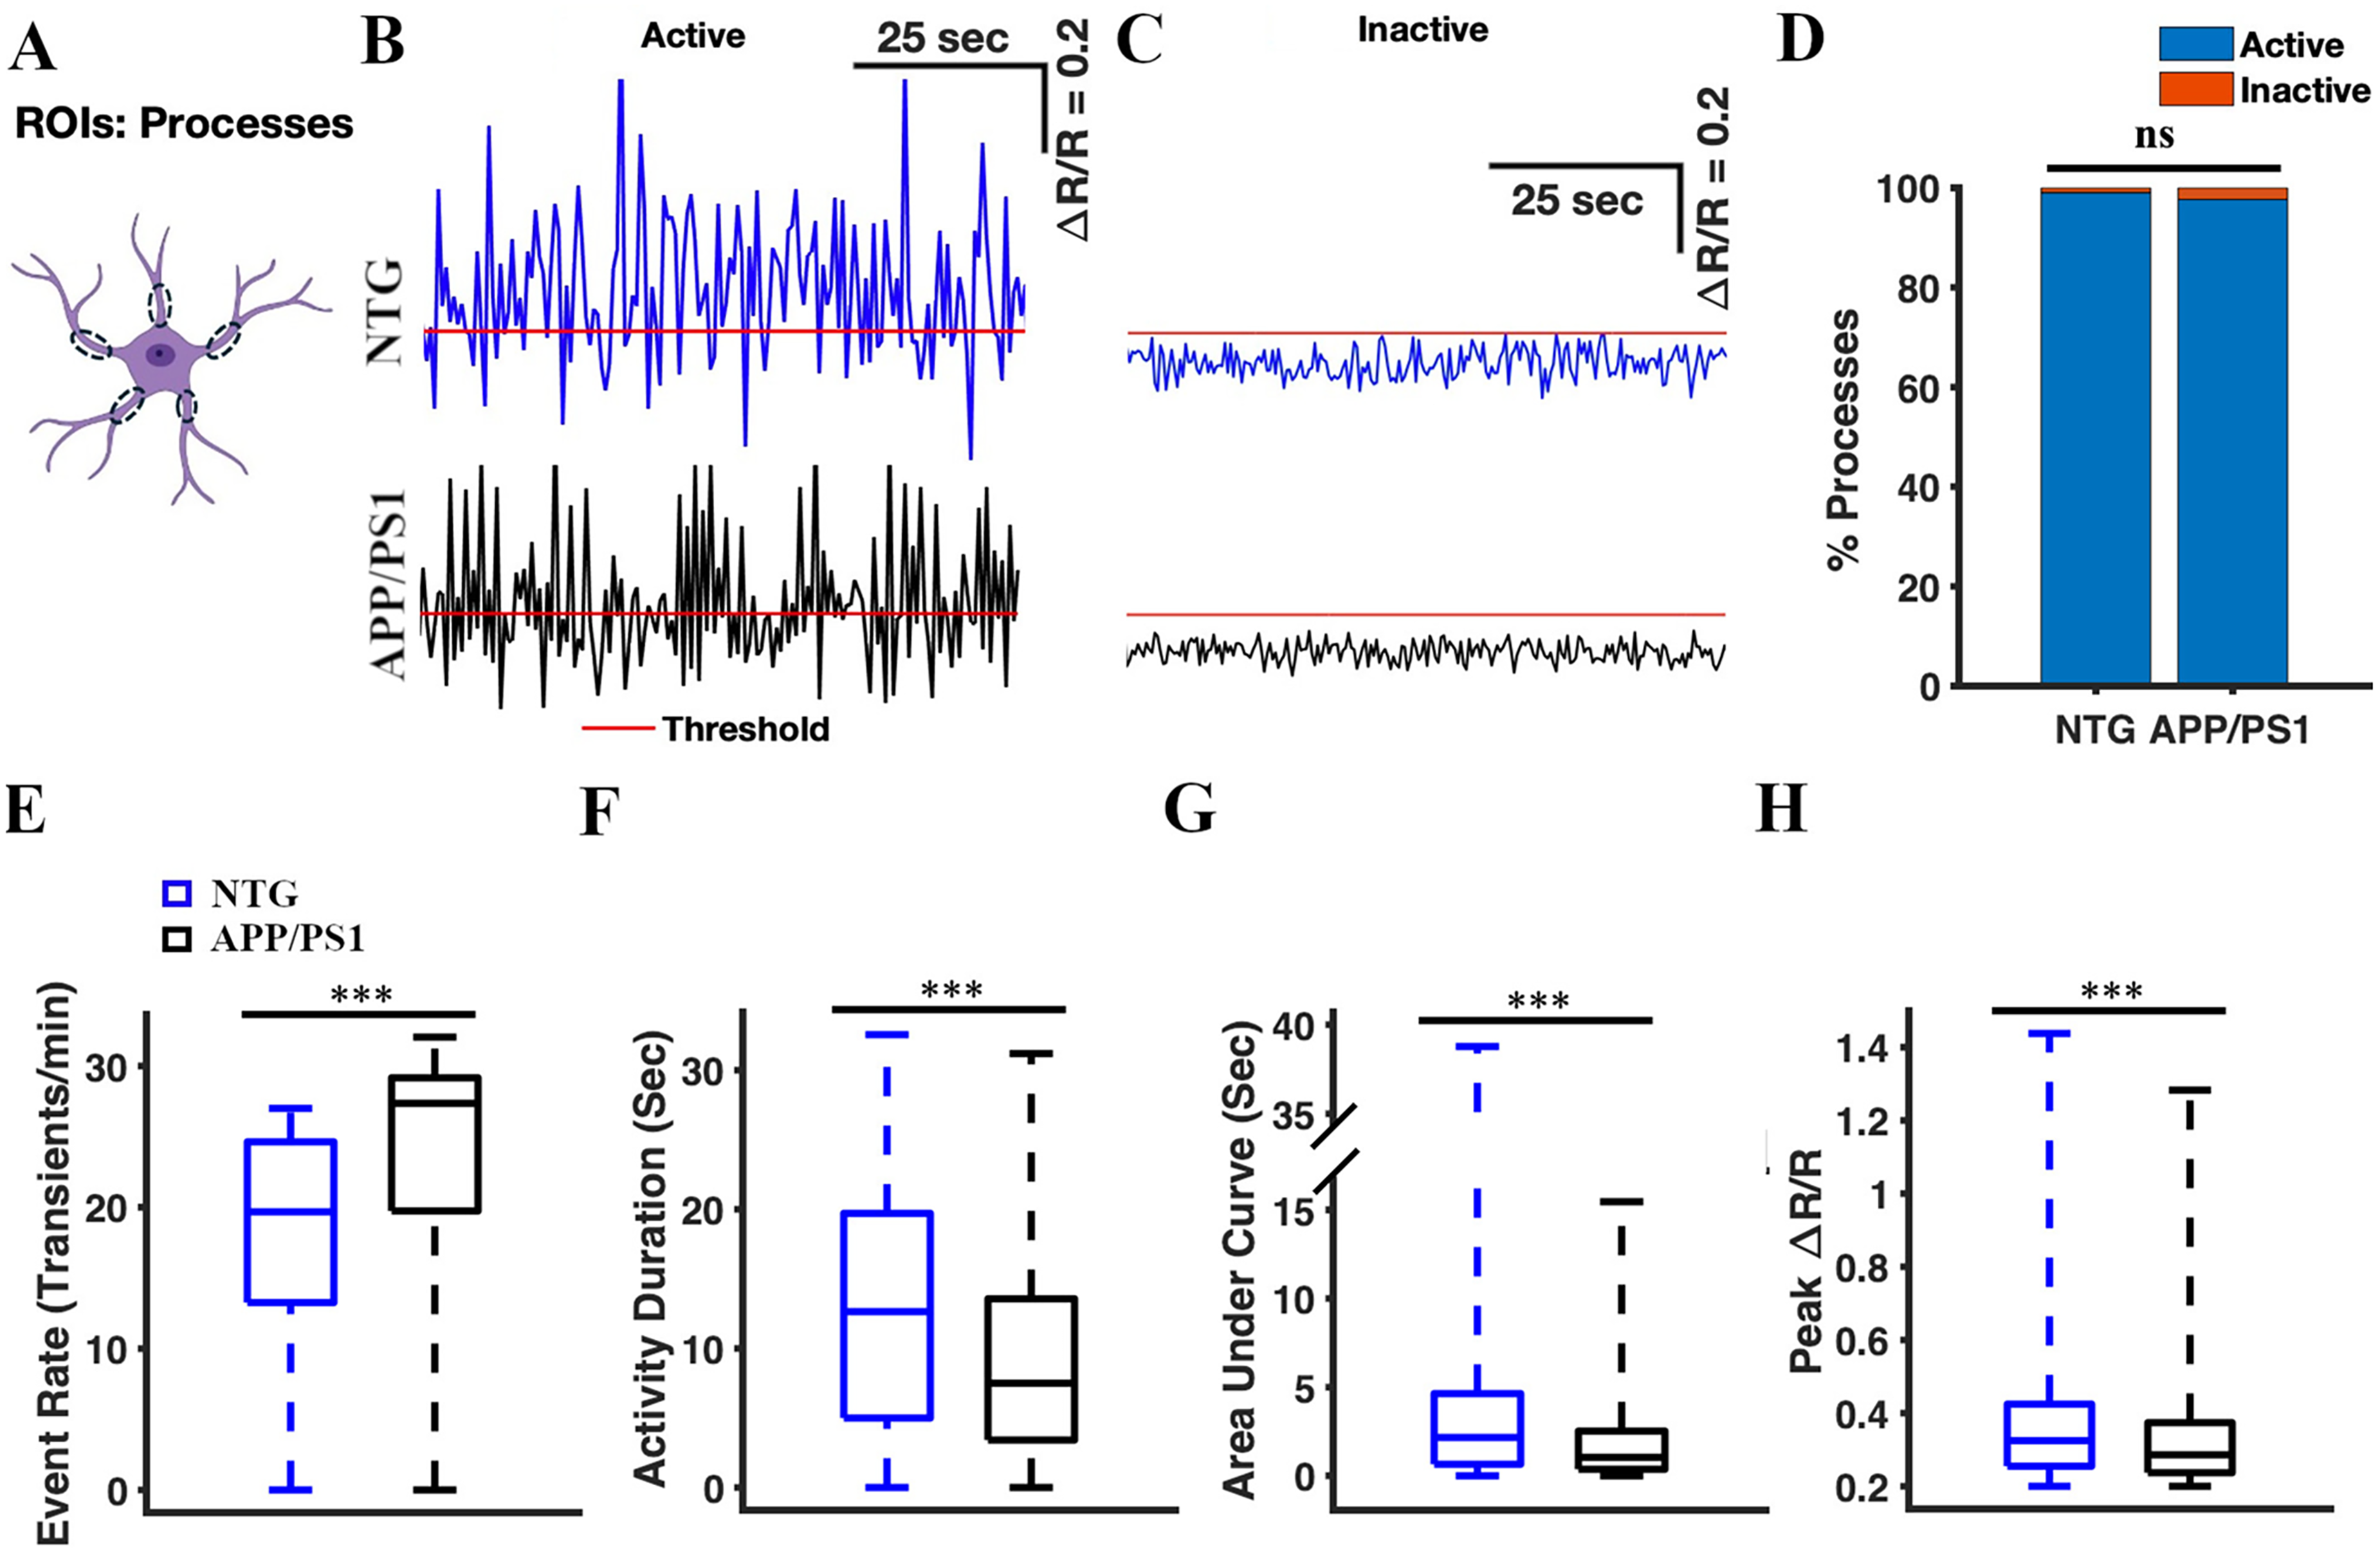
Calcium transients in astrocytic processes of APP/PS1 mice display a higher frequency, shorter duration, lower intensity (AUC), and reduced amplitude compared to those in NTG controls. (A) Astrocyte schematic outlining the regions of interest (processes) where the activity was measured. Representative active (B) and inactive (C) traces of astrocytic Ca2+ activity in the processes from NTG (blue) and APP/PS1 (black) mice. Red line represents threshold. (D) The percentage of active processes in NTG controls and APP/PS1 mice. The chi-square test was used to measure statistical significance. (E) Box plot of the event rate based on astrocytic Ca2+ activity. The event rates were calculated using a ΔR/R threshold of 0.2. (F) Box plot of the cumulative activity duration from astrocytic Ca2+ activity in the processes. (G) Box plot of the area under the curve from astrocytic Ca2+ activity in the processes. (H) Box plot of ΔR/R peak values from astrocytic Ca2+ activity in the processes. Statistical significance for panels E–H was assessed using a two-sample Student's t-test, ***p < 0.001, n.s, not significant.
Calcium transients in the astrocytic microdomains of APP/PS1 mice exhibited higher frequency, shorter activity duration, decreased intensity, and reduced amplitude compared to those of NTG controls
We analyzed spontaneous calcium transients in the astrocytic microdomains (Figure 4). First, we confirmed that YC 3.6 expression was present in the astrocytic microdomains (Figure 1), and manually selected the microdomains as ROIs (Figure 4A). We identified 799 microdomains across 64 timelapses in seven NTG mice, and 276 microdomains across 64 timelapses in seven APP/PS1 mice. We analyzed the calcium traces (ΔR/R) for each microdomain ROI (Figure 4B). We found that all or nearly all microdomains were active in NTG and APP/PS1 mice (100% active in NTG mice and 99.64% active in APP/PS1 mice) (Figure 4C). The percentage of active microdomains did not differ significantly between NTG and APP/PS1 mice (Chi-square test, χ2 = 2.90, p = 0.09) (Figure 4C). The cumulative activity duration in astrocytic microdomains was significantly lower in APP/PS1 mice than in NTG mice (11.41 [6.87, 17.03] s and 23.72 [17.75, 27.62] s, respectively, two-sample Student's t-test p = 2.97 × 10−66) (Figure 4E). Similarly, the cumulative area under the curve was significantly lower in APP/PS1 mice than that in NTG controls (1.62 [0.8, 3.51] s and 7.94 [4.32, 12.9] s, respectively; two-sample Student's t-test, p = 2.49 × 10−43) (Figure 4F). The peak amplitude values of astrocytic microdomains in APP/PS1 mice were significantly lower than those in NTG mice (0.33 [0.26, 0.44] and 0.46 [0.33, 0.66], respectively, two-sample student's t-test p = 8.83 × 10−246) (Figure 4G). In contrast, the event rate of astrocytic microdomains was significantly higher in APP/PS1 mice than that in NTG mice (27 [24.86, 28.56] transients/min and 20.28 [17.76, 22.08] transients/min, respectively; two-sample Student's t-test p = 0.004) (Figure 4D). Taken together, these results indicated that calcium transients in astrocytic microdomains occurred more frequently, had shorter durations, lower intensity (AUC), and smaller amplitude in APP/PS1 mice compared to astrocytic calcium transients in NTG controls (Figure 4B).
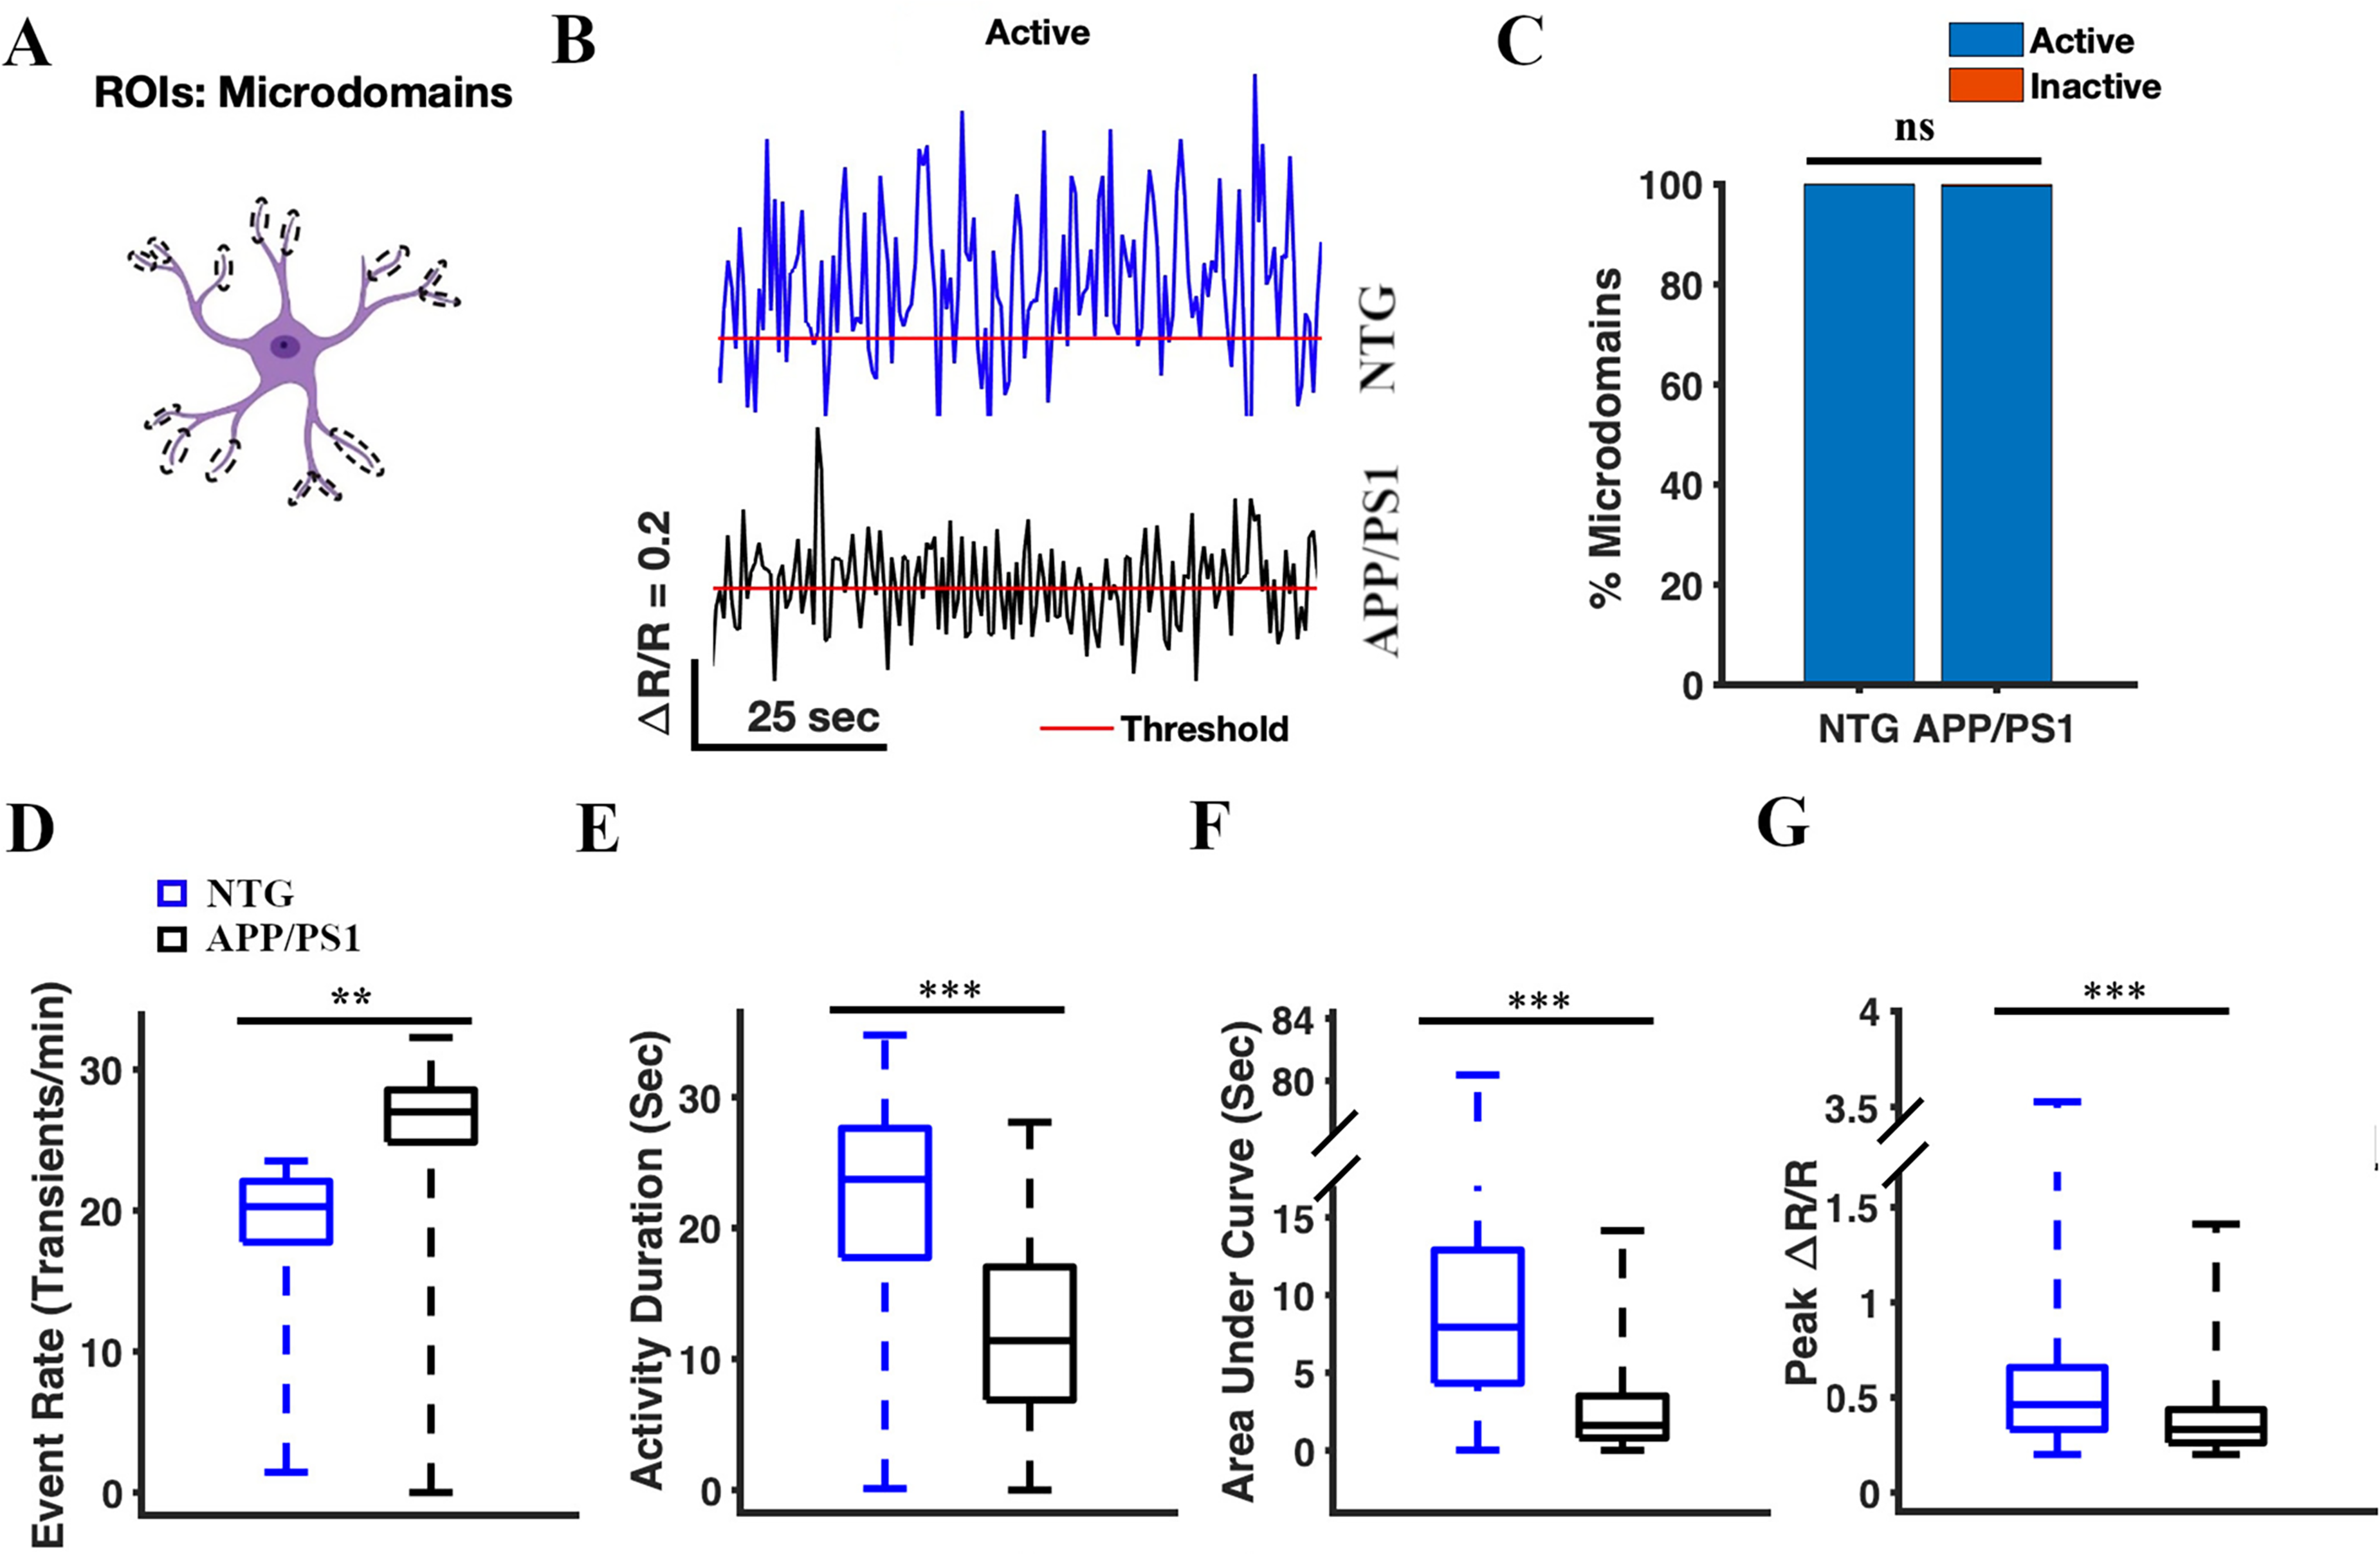
Calcium transients in astrocytic microdomains of APP/PS1 mice, occur more frequently, with shorter duration, lower intensity (AUC), and diminished amplitude compared to those in NTG controls. (A) Astrocyte schematic outlining the region of interest (microdomains) where activity was measured. (B) Representative active traces of astrocytic Ca2+ activity in the processes from NTG (blue) and APP/PS1 (black) mice. Red line represents threshold. (C) The percentage of active microdomains in NTG and APP/PS1 mice. The chi-square test was used to measure statistical significance. (D) Box plot of the event rate from astrocytic Ca2+ activity in microdomains. The event rates were calculated using a ΔR/R threshold of 0.2. (E) Box plot of the cumulative activity duration from astrocytic Ca2+ activity in the microdomains. (F) Box plot of the area under the curve of astrocytic Ca2+ activity in microdomains. (G) Box plot of ΔR/R peak values from astrocytic Ca2+ activity in microdomains. Statistical significance for panels E–G was assessed using a two-sample Student's t-test, **p < 0.01, ***p < 0.001, n.s, not significant.
Calcium transients in the astrocytic endfeet of APP/PS1 mice exhibited lower frequency, shorter activity duration, decreased intensity (AUC), and reduced amplitude compared to those of NTG controls
Next, we analyzed spontaneous calcium transients in astrocytic endfeet (Figure 5) in an analogous manner. First, we confirmed YC 3.6 expression in astrocytic endfeet (Figure 1), and manually selected the endfeet as ROIs (Figure 5A). We identified 210 endfeet across 64 timelapses in seven NTG mice. 212 endfeet across 64 timelapses were identified in seven APP/PS1 mice. We analyzed the calcium traces (ΔR/R) for active and inactive endfoot ROIs (Figure 5B, C). The percentages of active endfeet were comparable in NTG and APP/PS1 mice (89.52% active endfeet in NTG mice and 84.43% active endfeet in APP/PS1 mice, Chi-square test, χ2= 2.41, p = 0.12) (Figure 5D). The event rate of calcium transients in astrocytic endfeet of APP/PS1 mice was significantly lower than that in NTG mice (8.28 [0.96, 21.24] transients/min and 13.08 [2.16, 25.14] transients/min, respectively, two-sample Student's t-test p = 0.013 (Figure 5E). The cumulative activity duration in astrocytic endfeet was also significantly lower in APP/PS1 mice than that in NTG mice (1.31 [0.08, 7.41] s and 3.06 [0.31, 9.96] s, respectively; two-sample Student's t-test, p = 0.003) (Figure 5F). Similarly, the cumulative area under the curve was significantly lower in APP/PS1 mice than in NTG controls (0.15 [0.01, 1.01] s and 0.4 [0.04, 1.53] s, respectively; two-sample Student's t-test, p = 0.005) (Figure 5G). Finally, the peak amplitude values of astrocytic endfeet in APP/PS1 mice were significantly lower than those in NTG mice (0.27 [0.23, 0.34] and 0.28 [0.24, 0.38], respectively; two-sample Student's t-test p = 0.02) (Figure 5H). Based on these findings, we concluded that calcium transients in astrocytic endfeet of APP/PS1 mice occurred less frequently, had shorter durations, lower intensity (AUC), and smaller peak amplitude compared to those in NTG controls (Figure 5B).
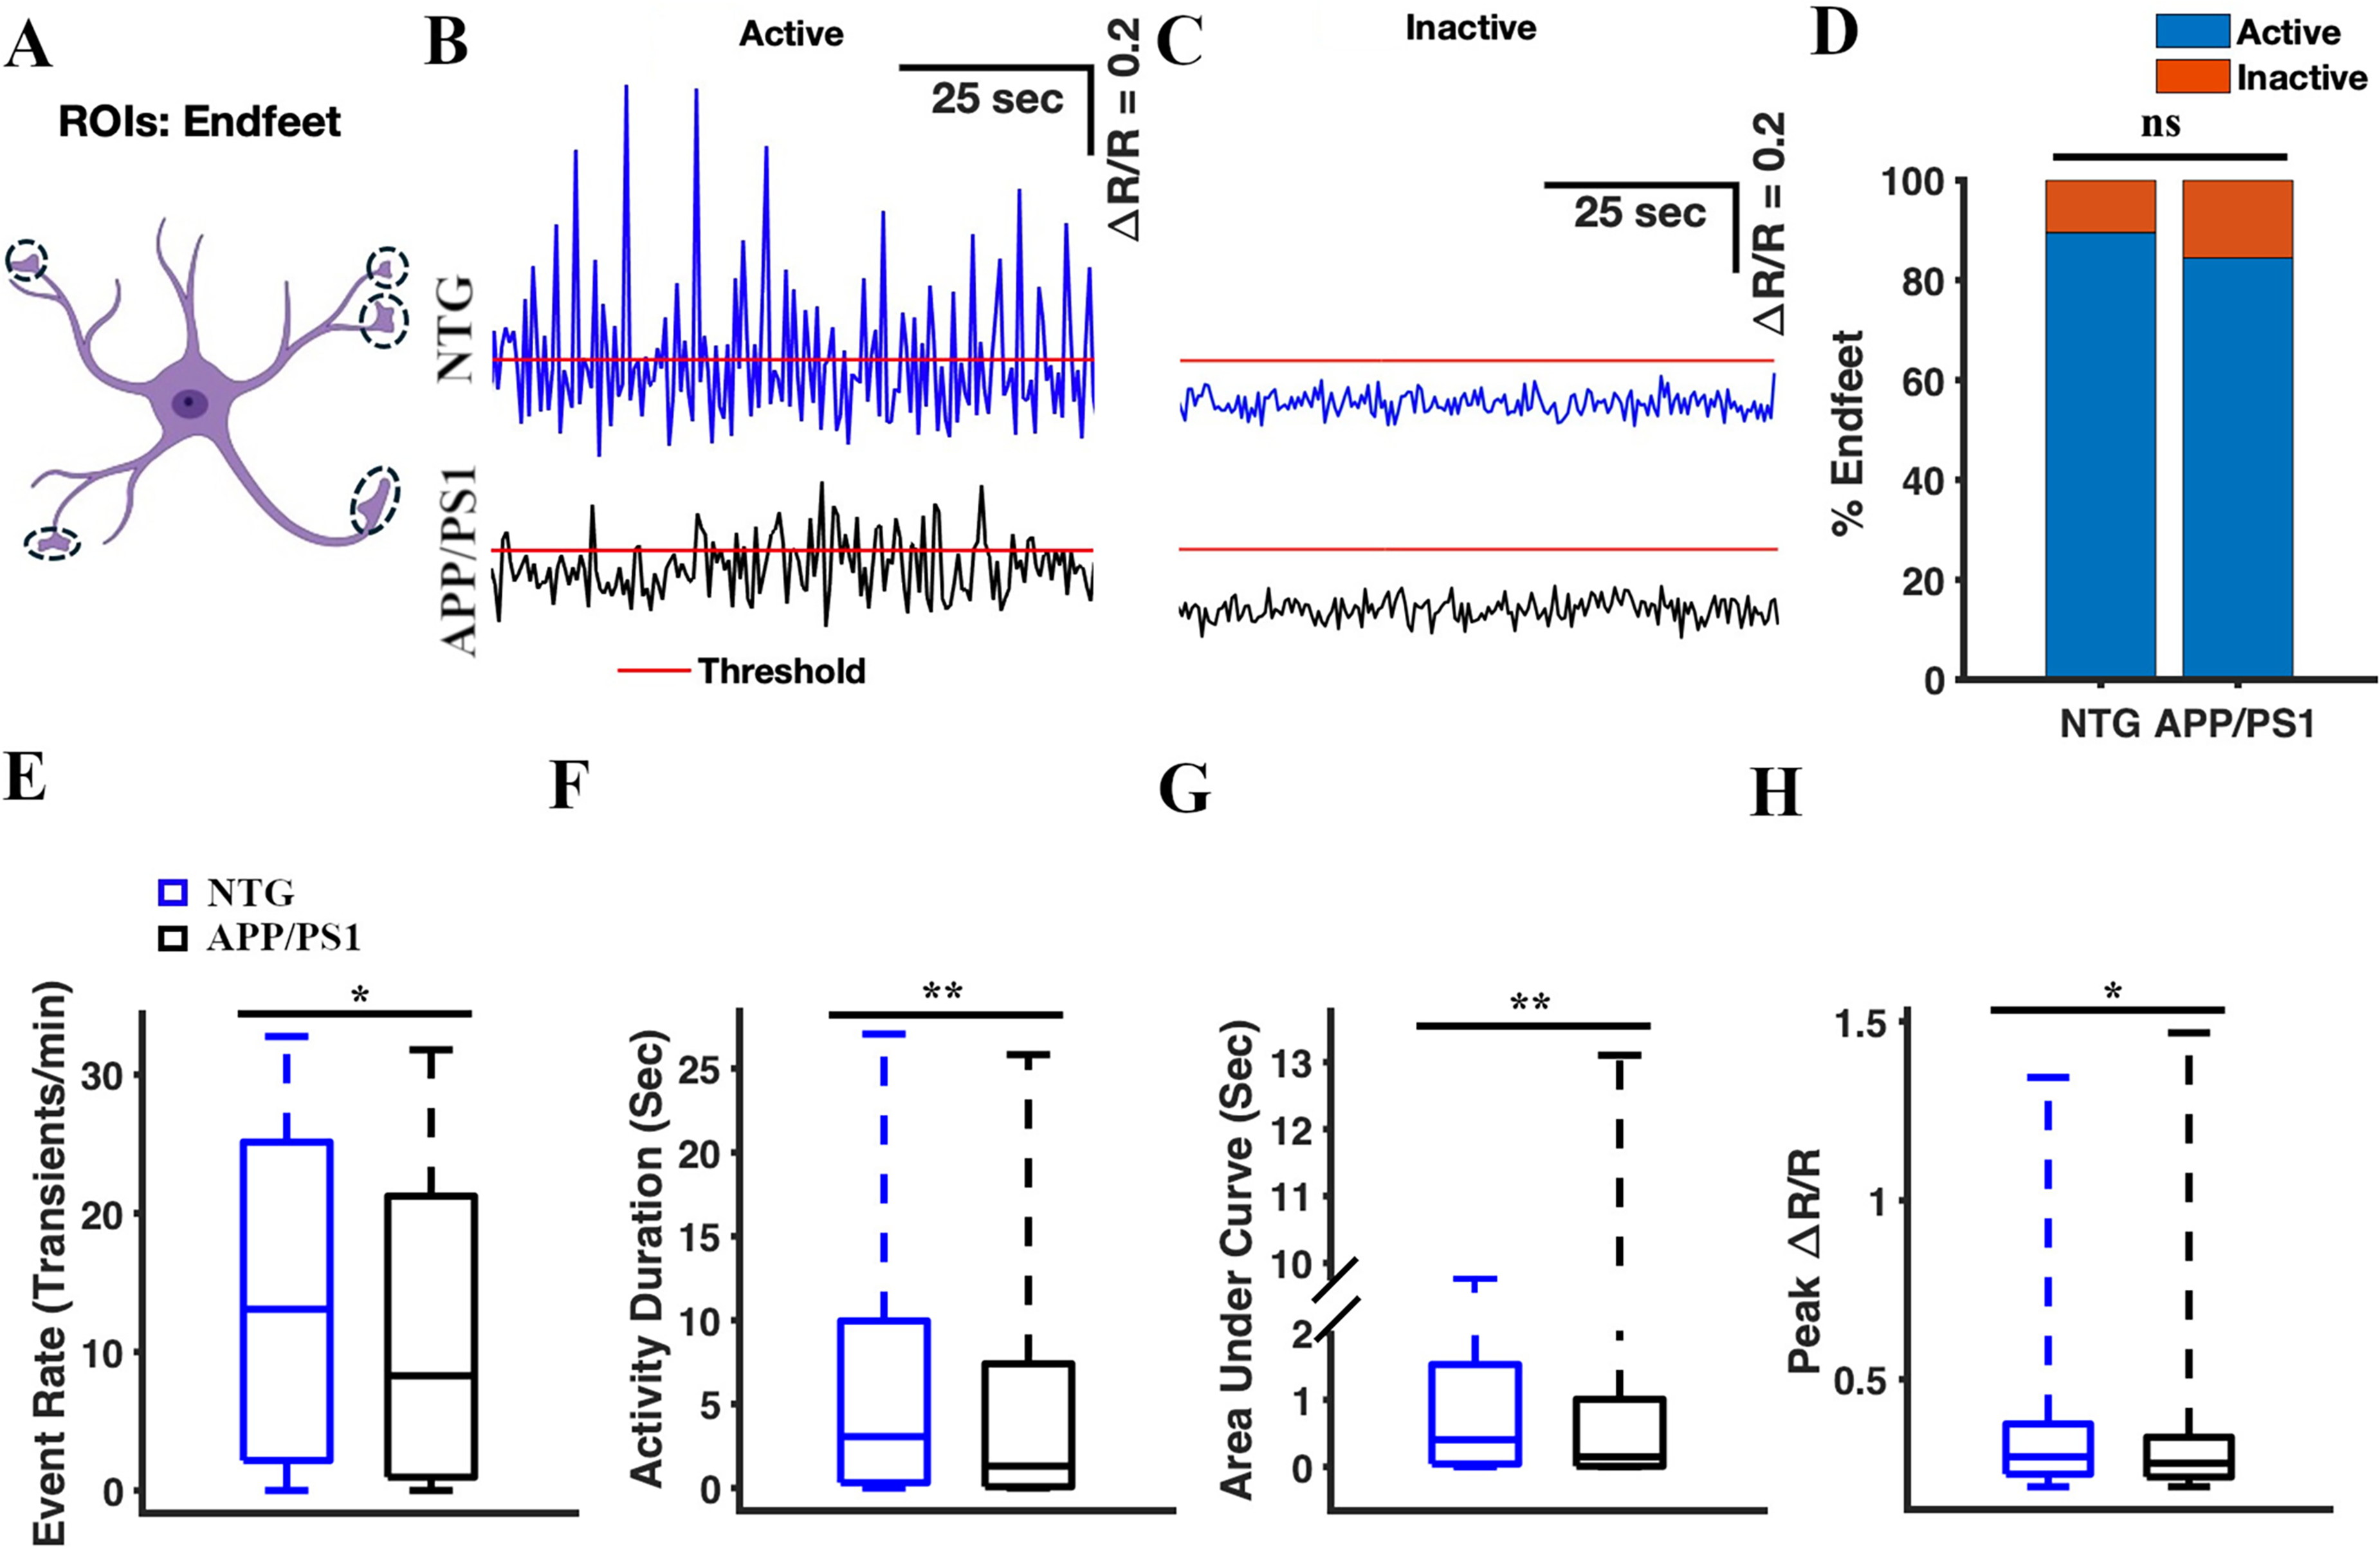
Calcium transients in the astrocytic endfeet of APP/PS1 mice, show a lower frequency, reduced duration, decreased intensity (AUC), and smaller amplitude compared to NTG controls. (A) Astrocyte schematic outlining the region of interest (endfeet) where activity was measured. Representative active (B) and inactive (C) traces of astrocytic Ca2+ activity in the endfeet of NTG (blue) and APP/PS1 (black) mice. Red line represents threshold. (D) The percentage of active microdomains in NTG and APP/PS1 mice. The chi-square test was used to measure statistical significance. (E) Box plot of the event rate from astrocytic Ca2+ activity in the endfeet. The event rates were calculated using a ΔR/R threshold of 0.2. (F) Box plot of the cumulative activity duration from astrocytic Ca2+ activity in the endfeet. (G) Box plot of the area under the curve of astrocytic Ca2+ activity in the endfeet. (H) Box plot of ΔR/R peak values from astrocytic Ca2+ activity in the endfeet. Statistical significance for panels E–H was assessed using a two-sample Student's t-test, *p < 0.05, **p < 0.01, n.s, not significant.
The inverse relationship between pairwise correlation of astrocytic activity and astrocyte-to-astrocyte distance was impaired in APP/PS1 mice
Finally, we investigated the degree of synchronization in calcium activity of astrocytic somas in NTG and APP/PS1 mice. We calculated pairwise correlations as a measure of somal pair synchronization for each of the 64 timelapses (n = 2808 soma pairs in seven NTG mice; n = 2613 soma pairs in seven APP/PS1 mice). The pairwise correlations between soma pairs were significantly higher in APP/PS1 mice than those in NTG mice (1.2 [0.29, 3.8] × 10−3 and 1.07 [0.2, 3.12] × 10−3, the Kolmogorov Smirnov (K-S) test, p = 0.002) (Figure 6A). Thus, astrocytic somas were more synchronized in APP/PS1 mice (Figure 6A, B). Notably, when determining the effect of distances between two somas on their pairwise correlations, we found that NTG mice followed an inverse relationship between cell-to-cell distances and pairwise correlations. This indicated that as the distance between two somas increased, their pairwise correlation decreased (Pearson's Linear Correlation Coefficient, R2 = 0.36, p = 0.001 in NTG controls.) (Figure 6B). However, this relationship was absent in APP/PS1 mice (Pearson's Linear Correlation Coefficient, R2 = 0.06, p = 0.25) (Figure 6B). This loss of statistical significance indicated that the effect of distance on the pairwise correlation of astrocytes was impaired in APP/PS1 mice.
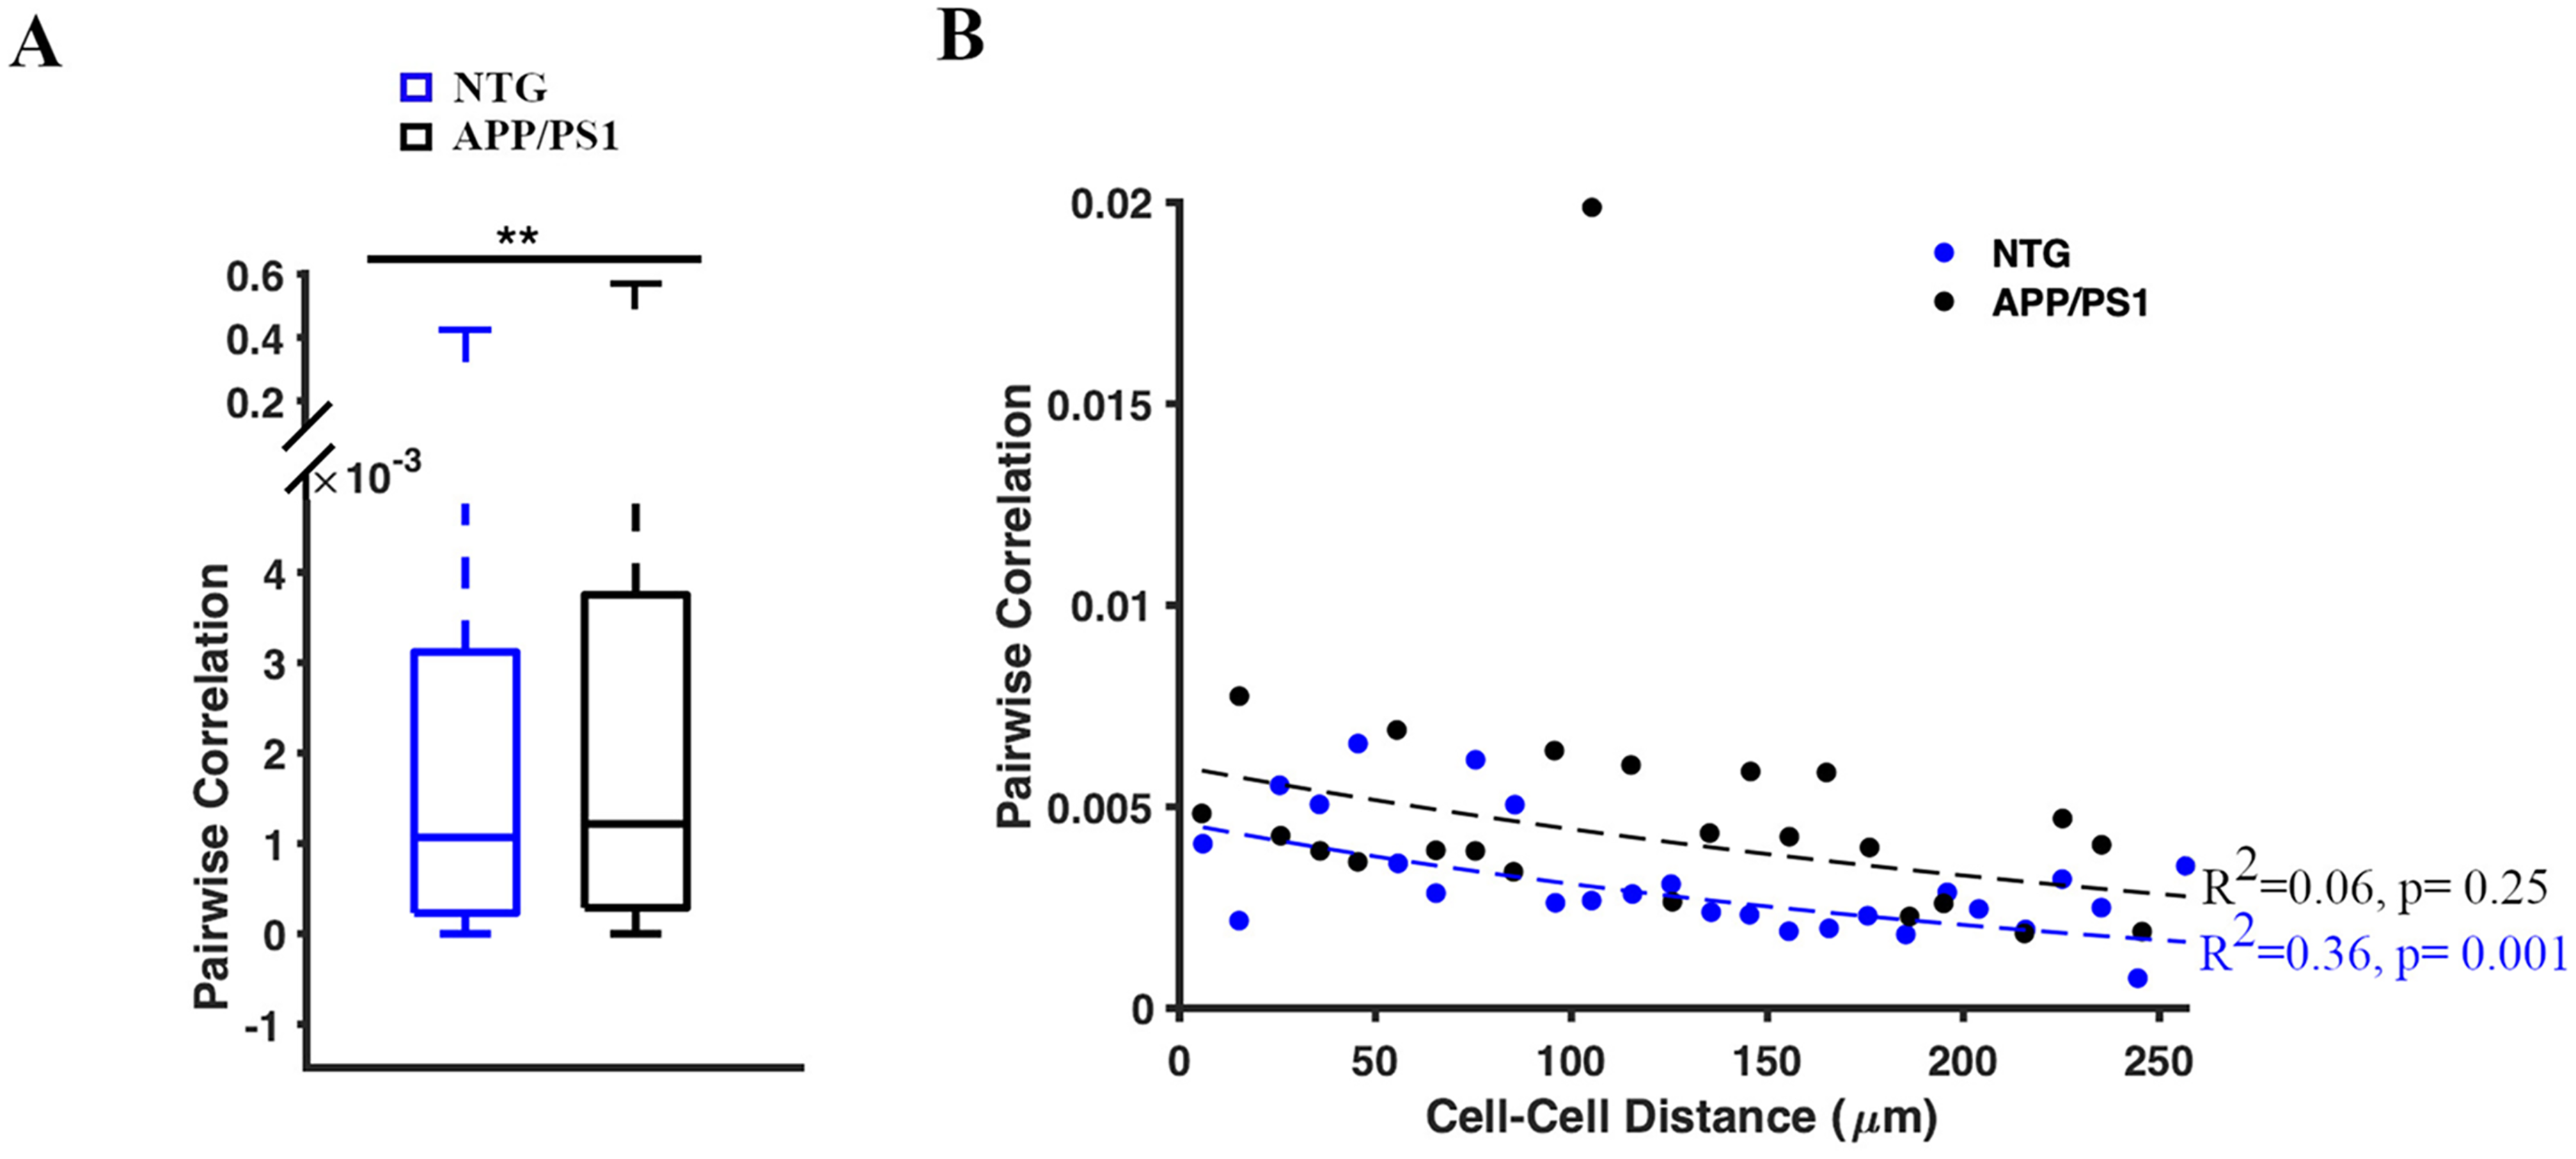
Pairwise correlation of astrocytic Ca2+ activity in somas. (A) Box plot of pairwise correlations (rho-values) between each pair of somas. The Kolmogorov–Smirnov (K-S) test was used to measure statistical significance, **p < 0.01. (B) Scatter plot representing the relationship between the distance between two somas and their pairwise correlation in NTG (blue) and APP/PS1 (black) mice. Dashed lines show the linear regression of the pairwise correlation between soma pairs. Pearson's Linear Correlation Coefficient was used to measure statistical significance.
Discussion
Astrocytic calcium activity plays an essential role in brain function and behavior, making it a key area of research in AD field in recent years.18,48–50 Astrocytic calcium signaling allows astrocytes to communicate with neurons and effectively regulate synaptic transmission.27,48 Astrocytic endfeet wrap around blood vessels to regulate vascular coupling. 30 Astrocytic calcium transients can arise spontaneously without neuronal activity or be induced by neurotransmitters released during synaptic activity.51,52 Genetically encoded calcium indicators can be targeted to astrocytes specifically. High-resolution imaging techniques allow imaging astrocytes to study their calcium activity in vivo. Using the ratiometric calcium indicator YC 3.6 and in vivo multiphoton imaging, we were able to elucidate astrocytic calcium dynamics within distinct compartments in APP/PS1 mice. We categorized the astrocytic compartments in accordance with the larger body of literature.20,39,40,53,54 We believe this approach allows clear comparison with established datasets. However, we do acknowledge that finer distinctions such as branches, branchlets, and leaflets are indeed informative 55 and could be explored in future studies. Compartment-specific astrocytic calcium transients were analyzed using five distinct analysis metrics: percentage of active compartments, the event rate, AUC, activity duration, and peak amplitude. We reported that astrocytic calcium signaling showed distinct compartment-specific aberrations in APP/PS1 mice compared to those in NTG controls (Figure 7). Calcium transients in the astrocytic soma of APP/PS1 mice lasted longer and had increased amplitude (Figure 7). Astrocytic microdomains and processes exhibited increased frequency but shortened activity duration, reduced intensity, and amplitude (Figure 7). Astrocytic endfeet exhibited lower-frequency calcium transients with shorter activity duration, reduced intensity (AUC), and lower amplitude (Figure 7). Additionally, an inverse relationship between astrocytic activity correlations and cell-to-cell distance seen in NTG controls was absent in APP/PS1 mice, suggesting disrupted spatial activity patterns.
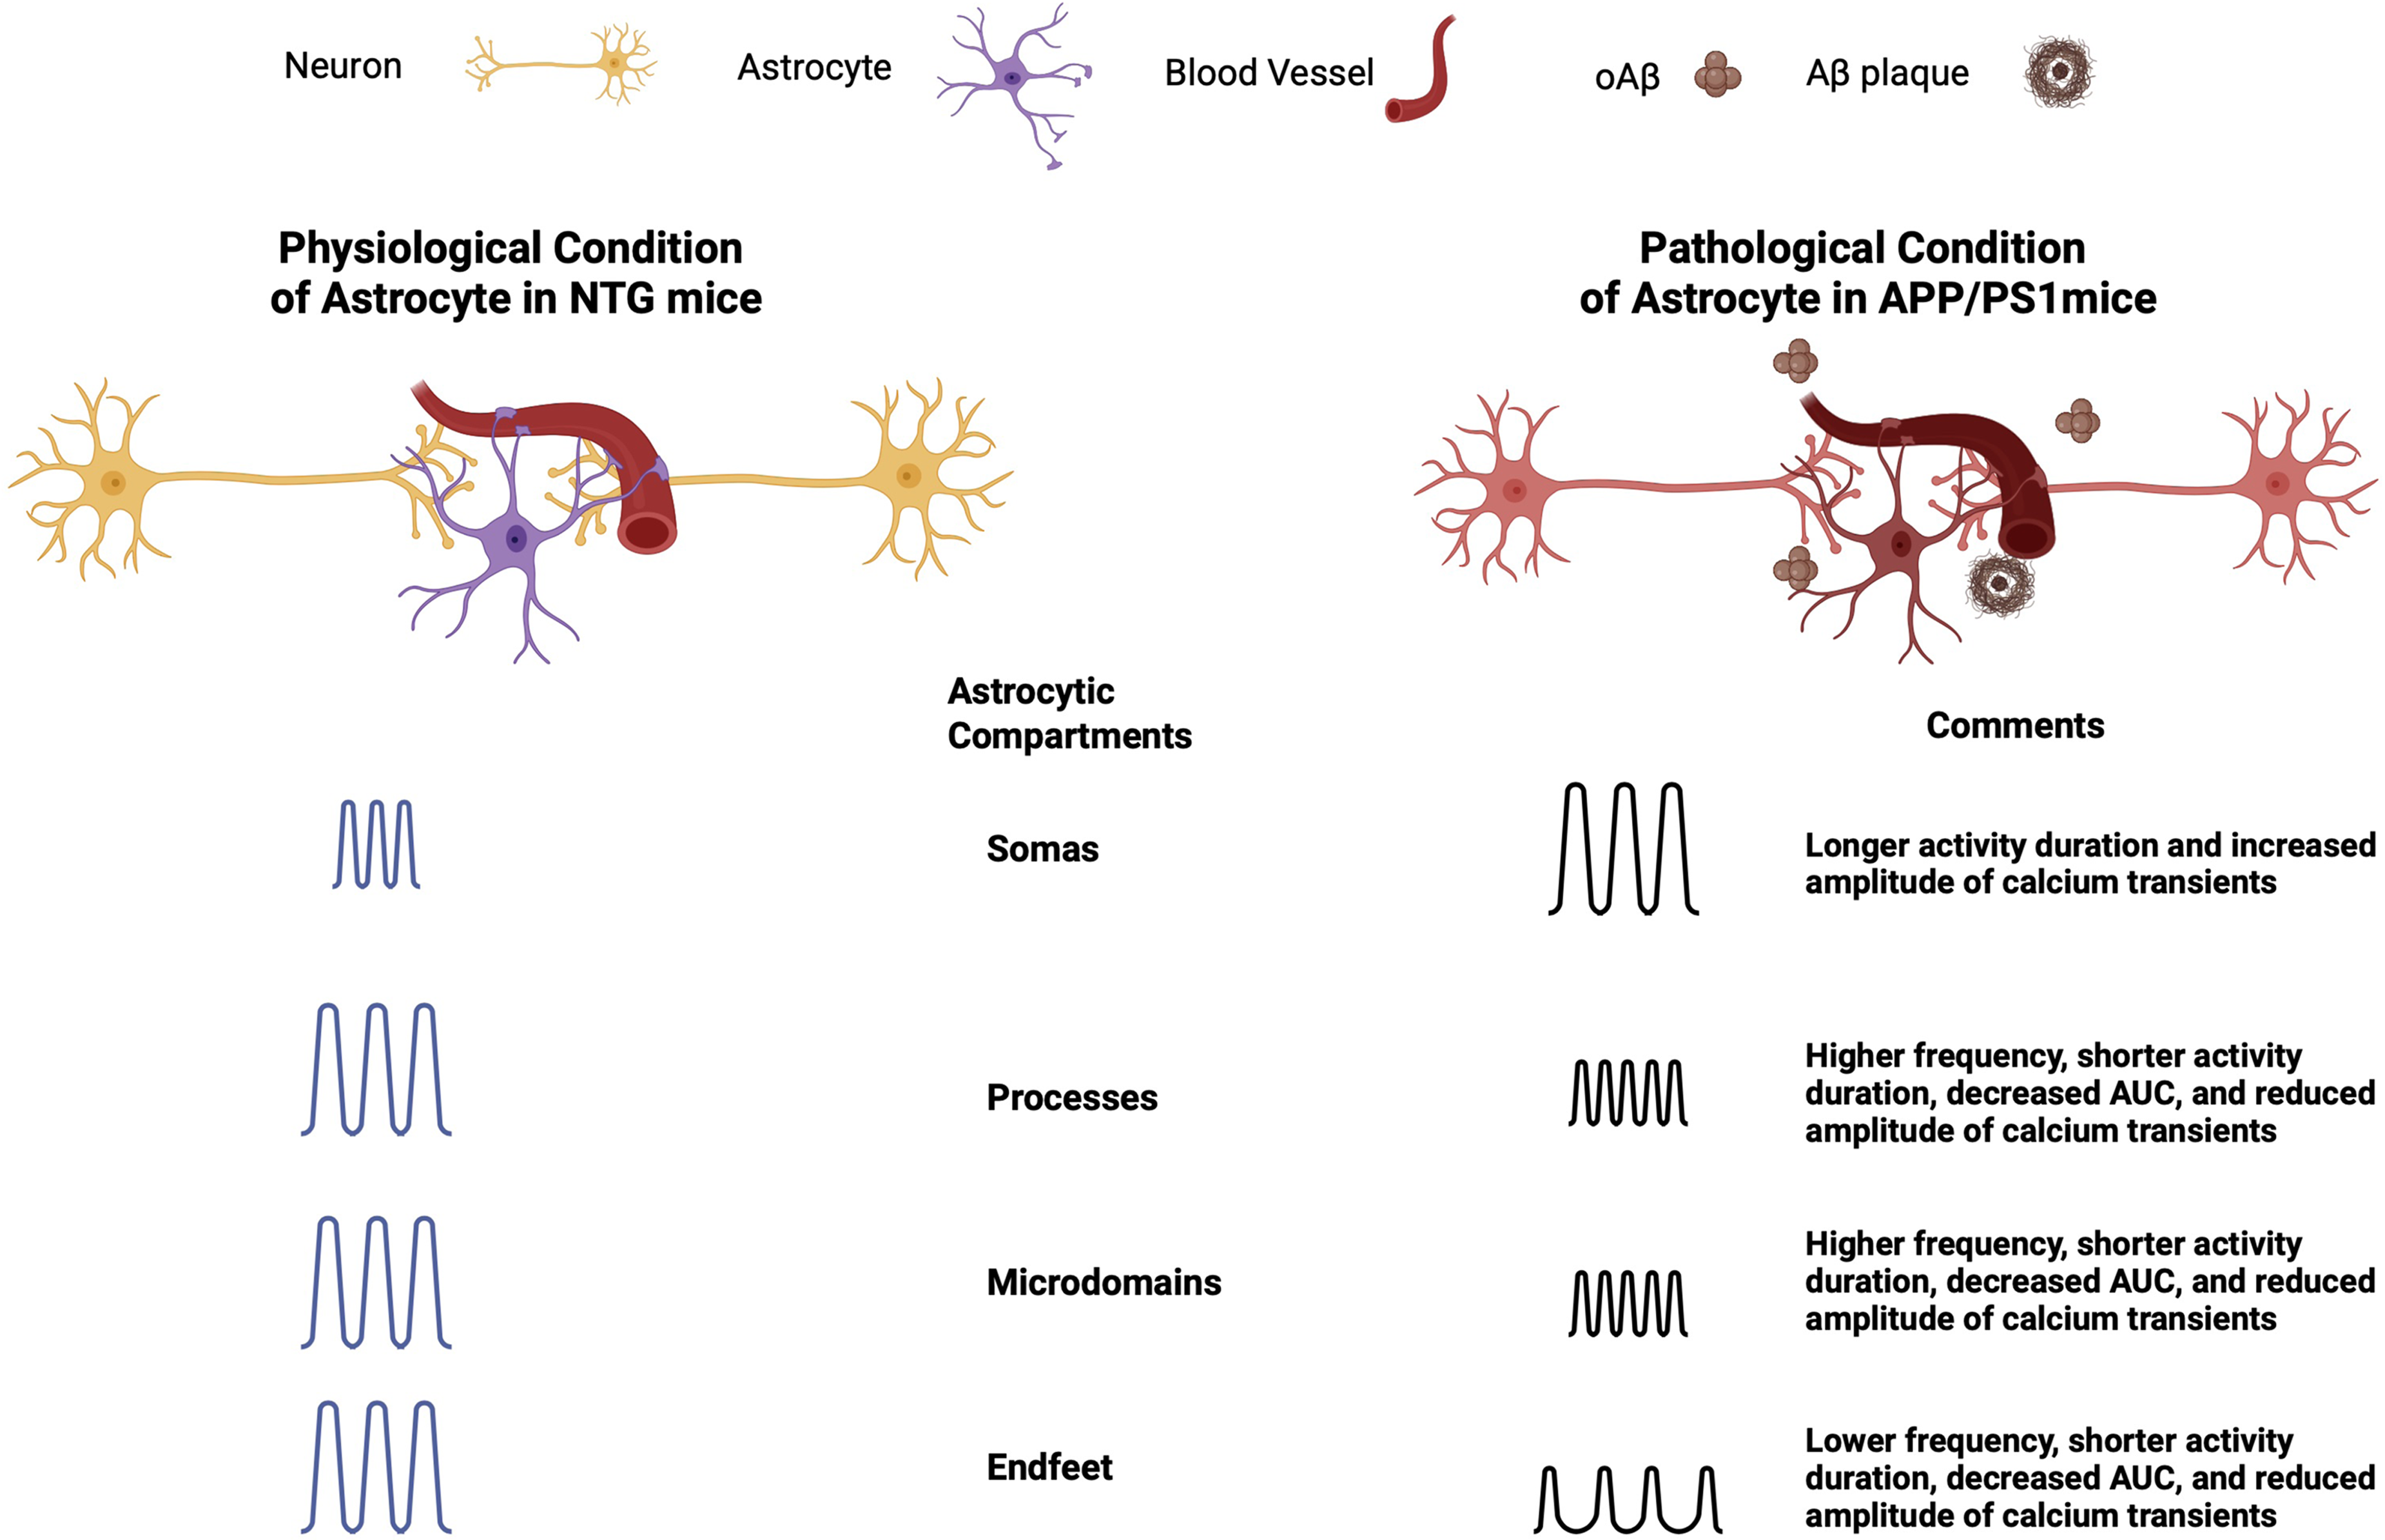
Graphical summary of key findings from calcium transient analysis in NTG and APP/PS1 mice.
Prior literature reported astrocytic somas exhibiting higher calcium event frequencies in 6–9-month-old APP/PS1 mice expressing GCaMP7 compared to those in NTG littermate controls. 33 Similarly, imaging of the small-molecule calcium chelator Oregon Green BAPTA-1 showed elevated spontaneous calcium activity in 6–8-month-old APP/PS1 mice compared to rare events in NTG controls. 20 However, astrocytic somas in our 4–6-month-old APP/PS1 mice did not exhibit significant increases in event rate as shown in present study, likely due to younger age of mice, since older mice with higher plaque burden might experience greater disruptions in astrocytic calcium transients. Consistent with previous findings, 20 we observed higher calcium transient amplitudes in astrocytic somas of APP/PS1 mice. We further demonstrated that astrocytic somas exhibited prolonged calcium durations in APP/PS1 mice compared to those in NTG controls. Somal proximity to plaques is not expected to affect the results, because previous studies showed that Aβ-plaque proximity did not have a direct effect on either the frequency or the duration of astrocytic calcium transients. 56 The cell-wide astrocytic calcium dysregulation was not directly related to amyloid plaque proximity. 39
Astrocytic processes and microdomains were reported to exhibit increased calcium event frequencies in 6–9-month-old APP/PS1 mice expressing GCaMP7. 20 Similarly, our 4–6-month-old APP/PS1 mice showed a marked increase in event rates within these astrocytic compartments. Despite increased event frequency, astrocytic processes and microdomains displayed reduced calcium activity duration, intensity (AUC), and amplitude in young APP/PS1 mice compared to those measures in NTG controls.
We also observed that astrocytic endfeet exhibited reduced calcium event frequency, shorter activity durations, lower intensity (AUC), and diminished amplitude in anesthetized APP/PS1 mice at 4–6 months. All imaging was performed under anesthesia, which alters neuronal and astrocytic activity, induces full vasodilation, and preserves some slow oscillations.21,46,57,58 Consequently, observed endfoot activity reflects the unconscious state and cannot be directly extrapolated to awake animals. Endfoot activity may also be influenced by vessel dynamics in awake mice.59,60
We also reported an inverse relationship between astrocyte distance and pairwise correlation in NTG mice that was impaired in APP/PS1 mice. This could be due to astrocytes being further apart in the presence of plaques and/or presence of oligomeric Aβ. 61 We acknowledge that distance measurements of this study are based on 2D projections within the imaged plane, and thus represent lateral (x–y) distances rather than true Euclidean 3D distances. While this approach may underestimate the actual distances between some astrocyte pairs, it provides a consistent and reproducible metric for comparing relative spatial organization across experiments. Our data is consistent with prior literature confirming that astrocytes showed stronger correlation in activity in APP/PS1 mice compared to astrocytes in NTG mice. 20 However, we acknowledge that YC 3.6 virus targets a limited number of astrocytes in proximity to the injection cite. Therefore, YC 3.6 expression may influence cell spacing and signaling correlations. Furthermore, general anesthesia has been shown to alter astrocytic calcium transients, including their synchronized activity. 62 Thus, future investigations will aim to assess the extent to which anesthesia may have influenced the observed differences.
Recent work reported that astrocytic soma and primary processes are hyperactive, whereas microdomains and astrocytic endfeet are hypoactive in plaque-bearing, non-anesthetized APP/PS1 mice. 39 These studies tended to report dysregulation of astrocytic calcium transients in the context of AD by analyzing low-frequency, high-amplitude astrocytic calcium transients using limited metrics in discrete compartments. Thus, our comprehensive compartment-specific analysis expands upon these findings.
The observed reduction in calcium activity across several metrics within astrocytic processes, microdomains, and endfeet adds complexity to the established narrative of astrocytic calcium hyperactivity in amyloidosis mouse models. This nuanced pattern suggests that, while soma may exhibit elevated calcium signaling, other astrocytic compartments show diminished activity, indicating a more intricate and compartment-specific alteration in astrocytic function in AD mice. Elevated somatic calcium signaling can dysregulate gene expression by activating calcium-dependent transcription factors such as Nuclear factor of activated T cells (NFAT), cyclic adenosine monophosphate response element binding protein (CREB), and Nuclear factor kappa B (NF-κB). Each of these molecular players has a role in neuroinflammation and cellular stress responses as part of AD progression.63–66 This dysregulation can promote the expression of genes linked to neuroinflammation, astrogliosis, and oxidative stress, exacerbating AD pathology.66,67 Elevated calcium in soma may also impair astrocytic functions, such as synaptic support and metabolic regulation, further contributing to disease progression. 68 From an epigenetic perspective, aberrant calcium signaling in astrocytic soma can influence histone modifications and DNA methylation patterns, which may lead to the persistent activation of inflammatory pathways and altered gene expression profiles in AD. For example, elevated calcium can activate the NF-κB pathway, which in turn may lead to changes in histone acetylation and methylation that promote the expression of pro-inflammatory genes, contributing to chronic neuroinflammation in AD.69,70 Additionally, disrupted astrocytic calcium signaling in soma can impact the epigenetic regulation of genes involved in synaptic plasticity and neuroprotection, potentially impairing the brain's ability to cope with of Aβ accumulations. 71 These epigenetic modifications could play a crucial role in the long-term dysregulation of astrocyte function, contributing to the progressive nature of AD. 72
Reduced calcium signaling in astrocytic processes and microdomains could disrupt neuronal network function via tripartite synapses.34,73 Astrocytes play an important role in regulating synaptic activity, neurotransmitter uptake, and gliotransmission through calcium signaling. 74 Impaired astrocytic calcium dynamics could lead to decreased synaptic plasticity, excitotoxicity, and neuronal loss in AD.41,68 Consistent with this idea, reduced calcium signaling in astrocytic microdomains impaired glutamate uptake, exacerbating excitotoxic damage. 68 Additionally, diminished calcium activity might reduce gliotransmitter release, disrupting synaptic coordination and cognitive function. 52
Reduced calcium signaling in astrocytic endfeet was shown to disrupt neurovascular coupling, impairing the regulation of blood flow in response to neuronal activity.75,76 Astrocytic endfeet normally release vasoactive molecules to regulate blood vessel dilation, but in AD, Aβ accumulation and inflammation hindered this function, leading to cerebral hypoperfusion and inadequate nutrient delivery to neurons. 77 This dysfunction contributed to cognitive decline by disrupting the proper vascular response and accumulating metabolic waste products.78,79 Astrocytic calcium signaling played a prominent role in coordinating neurovascular responses and supporting astrocyte-neuron interactions, which were essential for regulating blood flow and maintaining vascular health.74,80 Texas Red dextran was used in our studies solely for visualization of the vasculature in angiograms. Time-lapse imaging of blood flow was not conducted, and future studies will be necessary to incorporate dynamic imaging of blood flow. Beyond its role in neurovascular coupling, astrocytic endfoot dysfunction could also compromise glymphatic clearance, a perivascular waste removal system essential for brain homeostasis. 81 Aquaporin-4 (AQP4), primarily localized to astrocytic endfeet, facilitates interstitial fluid flow along perivascular routes, aiding in the clearance of Aβ and other neurotoxic metabolites. 82 AQP4 is also important for downstream calcium signaling. 83 In AD, AQP4 mislocalization or dysfunction disrupts glymphatic flow, leading to impaired Aβ clearance, heightened neuroinflammation, and progressive cognitive decline.84,85 This underscores the key role of astrocytic calcium signaling in regulating vascular function and in supporting waste clearance pathways vital for maintaining brain health.
In conclusion, our study revealed compartment-specific alterations in astrocytic calcium signaling in APP/PS1 mice, highlighting a complex pattern of aberrant activity across different astrocytic regions. While somatic calcium signaling was elevated; processes, microdomains, and endfeet mostly exhibited reduced activity, suggesting a nuanced compartment specific disruption of astrocytic function in AD. These changes in calcium dynamics may contribute to the dysregulation of neuronal networks, synaptic function, and neurovascular coupling, ultimately exacerbating disease pathology. Our findings underscored the importance of a detailed, compartment-specific analysis of astrocytic calcium signaling in AD and provided new insights into how these disruptions may contribute to disease progression, offering potential targets for therapeutic intervention.
Supplemental Material
sj-docx-1-alz-10.1177_13872877261464208 - Supplemental material for Compartment-specific analysis reveals disrupted astrocytic calcium transients in anesthetized Alzheimer's disease mice
Supplemental material, sj-docx-1-alz-10.1177_13872877261464208 for Compartment-specific analysis reveals disrupted astrocytic calcium transients in anesthetized Alzheimer's disease mice by Md Joynal Abedin, Yee Fun Lee, Melinda Zhang, Alyssa N Russ, Dmitry Gerashchenko, Brian J. Bacskai and Ksenia V. Kastanenka in Journal of Alzheimer's Disease
Footnotes
Acknowledgements
Not applicable.
Ethical considerations
All procedures involving mice were performed with the approval of the Massachusetts General Hospital (MGH) Institutional Animal Care and Use Committees (IACUC, protocol # 2012N000085) and followed the relevant guidelines and regulations, including the ARRIVE guidelines.
Consent to participate
Not applicable.
Consent for publication
Not applicable.
Author contribution(s)
Funding
The authors disclosed receipt of the following financial support for the research, authorship, and/or publication of this article: This work was supported by the BrightFocus Foundation Grant A2020833S and A2024010F, the Alzheimer's Association Grant AARG-18-52336, and National Institutes of Health Grant R01AG066171, R01AG081809, RF1AG098887.
Declaration of conflicting interests
The authors declared no potential conflicts of interest with respect to the research, authorship, and/or publication of this article.
Data availability statement
The data that were either generated or analyzed during this study can be found in this published article. All datasets that are not included are available from the corresponding author upon request.
Supplemental material
Supplemental material for this article is available online.
References
Supplementary Material
Please find the following supplemental material available below.
For Open Access articles published under a Creative Commons License, all supplemental material carries the same license as the article it is associated with.
For non-Open Access articles published, all supplemental material carries a non-exclusive license, and permission requests for re-use of supplemental material or any part of supplemental material shall be sent directly to the copyright owner as specified in the copyright notice associated with the article.