
Abstract
Background
Among aging individuals, some develop Alzheimer's disease (AD) while others remain cognitively stable. Understanding how structural and functional brain changes interact, could clarify this heterogeneity particularly among individuals at increased risk for AD.
Objective
This study aims to explore how structure-function connectivity changes relate to subsequent long-term cognitive trajectories in older adults with SMC and varying amyloid burden.
Methods
We analyzed data from the INSIGHT-preAD cohort, which includes older individuals with subjective cognitive complaints followed neuropsychologically over five years. Multiplex connectome integrating resting-state EEG functional connectivity and diffusion-weighted imaging-based structural connectivity was used to characterize brain network organization. We computed the multiplex participation coefficient (PC) as an index of structure-function similarity and examined its association with individual cognitive trajectories across the follow-up period.
Results
Significant differences in multiplex connectivity were observed among amyloid positive participants who later progressed to AD compared to amyloid positive stable (e.g., non-progressors) and amyloid negative controls. Specifically, higher PC values in the delta band were observed in amyloid positive individuals who later developed AD. This pattern, particularly within the default mode network, was associated with subsequent cognitive decline suggesting that delta band structure-function similarity may represent a potential candidate marker of cognitive vulnerability and progression in AD.
Conclusions
Most studies investigating AD have primarily examined functional or structural connectivity separately. By integrating both modalities using a multiplex approach, our study provides interesting preliminary evidence that structure-function connectivity may capture network-level changes associated with cognitive trajectories along AD continuum.
Keywords
Introduction
Among aging individuals, some develop Alzheimer's disease (AD), 1 the most common form of dementia, 2 while others exhibit only mild or no cognitive impairment despite advanced age. 3 Although cognitive functions tend to decrease with age 3 even in the absence of a neurodegenerative disorder, the extend and pattern of this decline vary significantly across individuals. 4 Understanding how brain networks reorganize at both structural and functional levels could therefore provide crucial insights into this heterogeneity. In the present study, we used a multilayer network approach combining resting-state electroencephalography (EEG) and diffusion-weighted imaging (DWI) to examine the relationship between brain network changes and long-term cognitive trajectories in older adults.
Despite major progress in identifying AD biomarkers, accurately predicting which individuals in the preclinical or prodromal stages will progress to AD remains a major challenge. Previous functional magnetic resonance imaging (fMRI) studies have consistently reported that the default mode network (DMN) shows early functional disconnection in AD.5,6 Impaired structural connectivity (SC) within the same network (i.e., DMN) has also been reported in the early stages of AD, 7 and the regions of this network are the primary sites of both amyloid-β and tau deposition.8,9 Together, these findings suggest that disruptions in connectivity dynamics within the DMN could serve as early indicators of the disease. 6
Electrophysiological studies provide complementary information on the temporal dynamics of DMN alterations. In particular, EEG and magnetoencephalography (MEG) studies have shown promising results in providing early and sensitive markers of AD progression.10,11 In fact, these studies have shown that early AD is characterized by increased power and synchronization in lower frequency bands, especially in the delta frequency band (0.5–4 Hz).12–14 The delta frequency band is implicated in regulating information processing and overall neural excitability. 15 Its abnormal enhancement in AD has been linked to cholinergic dysfunction and reduced neural efficiency. 16 Recent work has demonstrated increased delta band functional connectivity (FC) within the DMN in individuals with subjective cognitive decline (SCI), suggesting that delta band network changes may precede overt impairment. 14
However, functional alterations cannot be interpreted independently of the brain's anatomical structure. 5 The degree to which FC follows or deviates from the underlying white matter structure, known as structure-function coupling, provides key understanding into the brain's capacity for flexible communication.17,18 Notably, multilayer network approaches combining SC derived from DWI and FC have been developed to further explore this association. 19 By applying a two-layer multiplex network model integrating white matter tract integrity (from DWI) and MEG phase synchrony, Jauny et al. 20 found that lower structure-function similarity in parietal and temporal regions of the DMN was associated with better cognitive performance, potentially reflecting a compensatory mechanism with greater flexibility in FC patterns. Specifically, in healthy brains, structure-function coupling is frequency dependent. It is stronger for slower frequency bands such as delta which relies on long range structural connections and weaker for higher frequency bands that support more flexible local processing.21,22 Therefore, moderate coupling supports efficient communication and dynamic recruitment of alternative pathways, while excessive hyper-coupling indicates that functional dynamics have become overly constrained by anatomical wiring and has been associated with cognitive impairment and reduced adaptability in aging and early AD.18,21,23–25
To our knowledge, this is one of the first studies to quantify delta band structure-function coupling using a multiplex network approach in older adults along the AD continuum in the context of preclinical AD study. The present study aims to quantify how multilayer connectivity relates to longitudinal cognitive trajectories in older adults at risk for AD. To this end, we defined a two-layer multiplex model integrating a functional layer (EEG phase synchrony) and a structural layer (DWI white matter tract integrity) to assess brain network organization and dynamics over time. We hypothesized that individuals who later progress to AD would exhibit abnormally high similarity between these two modalities, particularly within the delta frequency band and the DMN, which may probably reflect early network constrain or rigidity that would be associated with disease progression and poorer cognitive performance.8,12
Methods
Participants
The INSIGHT-preAD cohort (INveStiGation of Alzheimer's PredicTors in subjective memory) is a longitudinal, multidisciplinary study conducted at the Pitié-Salpêtrière Hospital in Paris (France) between 2013 and 2020. 318 native French-speaking participants or participants who had learned French during childhood, aged 70–85 years with subjective memory complaints (SMC) for at least six months at the screening visit, 26 were included and followed-up for five years.27,28 Among the inclusion criteria, participants were required to have unimpaired cognition (Mini-Mental State Examination [MMSE] score ≥27/30; Clinical Dementia Rating [CDR] score = 0; and Free and Cue Selective Reminding Test Total Recall [FCSRT_TR] score ≥44/48). Participants were excluded from the study if they were under guardianship or in a retirement home, had a pre-symptomatic AD or other neurodegenerative disorder diagnosis, had a stroke on the three months prior to the beginning of the study, were illiterate, opposed or unable to undergo the MRI scanning.
Informed consent was obtained after the nature of the study was explained. Amyloid positivity was determined using 18F-florbetapir PET as a global cortical standardized uptake value ratio (SUVR) > 0.79 calculated as the mean SUVR across predefined cortical regions of interest following the INSIGHT-preAD protocol. 29 AD diagnosis was determined by an independent and specialized committee in cases of cognitive decline across two consecutive neuropsychological assessments and persistent Asymmetrical Hippocampal Segmentation (AHS). 29 In line with previous INSIGHT-preAD investigations using this cohort, 30 a subsample of the cohort that completed all initial neuropsychological tests was selected for this study. This sample included 34 participants without any
Amyloid-β burden (Aβ-/controls); 19 amyloid-β positive non-progressors to prodromal AD (Aβ+/stable) and 13 amyloid-β positive progressors to prodromal AD (Aβ+/progressors). Just like the participants in the Aβ-/controls group, the participants in the Aβ+/stable and Aβ+/progressors groups were cognitively normal at baseline, consistent with the INSIGHT-preAD inclusion criteria.
Amyloid PET acquisition and positivity threshold
Amyloid PET scans were acquired on a 3D PET/CT scanner 50 min after injection of 370 MBq (10 mCi) 18F-florbetapir. The images were processed using the in-house RACHEL (Région d’Analyse pour la Characterisation En Ligne; Region of Analysis for Online Characterization) software pipeline developed by the Centre d’Acquisition et Traitement des Images (CATI; http://cati-neuroimaging.com) where the SUVRs were calculated by averaging the mean activity of cortical regions of interest most affected by amyloid pathology: left and right precuneus, cingulum posterior, cingulum anterior, and parietal, temporal and orbitofrontal cortices. The SUVR threshold of 0.7918 was extracted by linear correlation of results from CAEN (IMAP study) and AVID's SUVR values, 31 and validated through its use in the first study by Dubois et al., 2018. 28
Behavioral measures: neuropsychological assessment
The participants’ cognitive abilities were assessed using the following neuropsychological tests: the MMSE to assess global cognitive function; the FCSRT, 32 and the Rey-Osterrieth Complex Figure to assess episodic memory; the Delayed Matching to Sample 48 (DMS48) to assess visual recognition memory; the Digit Span and Visuospatial Span to assess working memory; the Frontal Assessment Battery (FAB) and the Trail Making Test (TMT) to assess executive functions (for a detailed description of the behavioral measures). 26 Clinical follow-ups were carried out throughout the study: every six months for psycho-behavioral assessments, every twelve months for neuropsychological assessments and EEG recordings, and every two years for fMRI and PET imaging (Figure 1A).
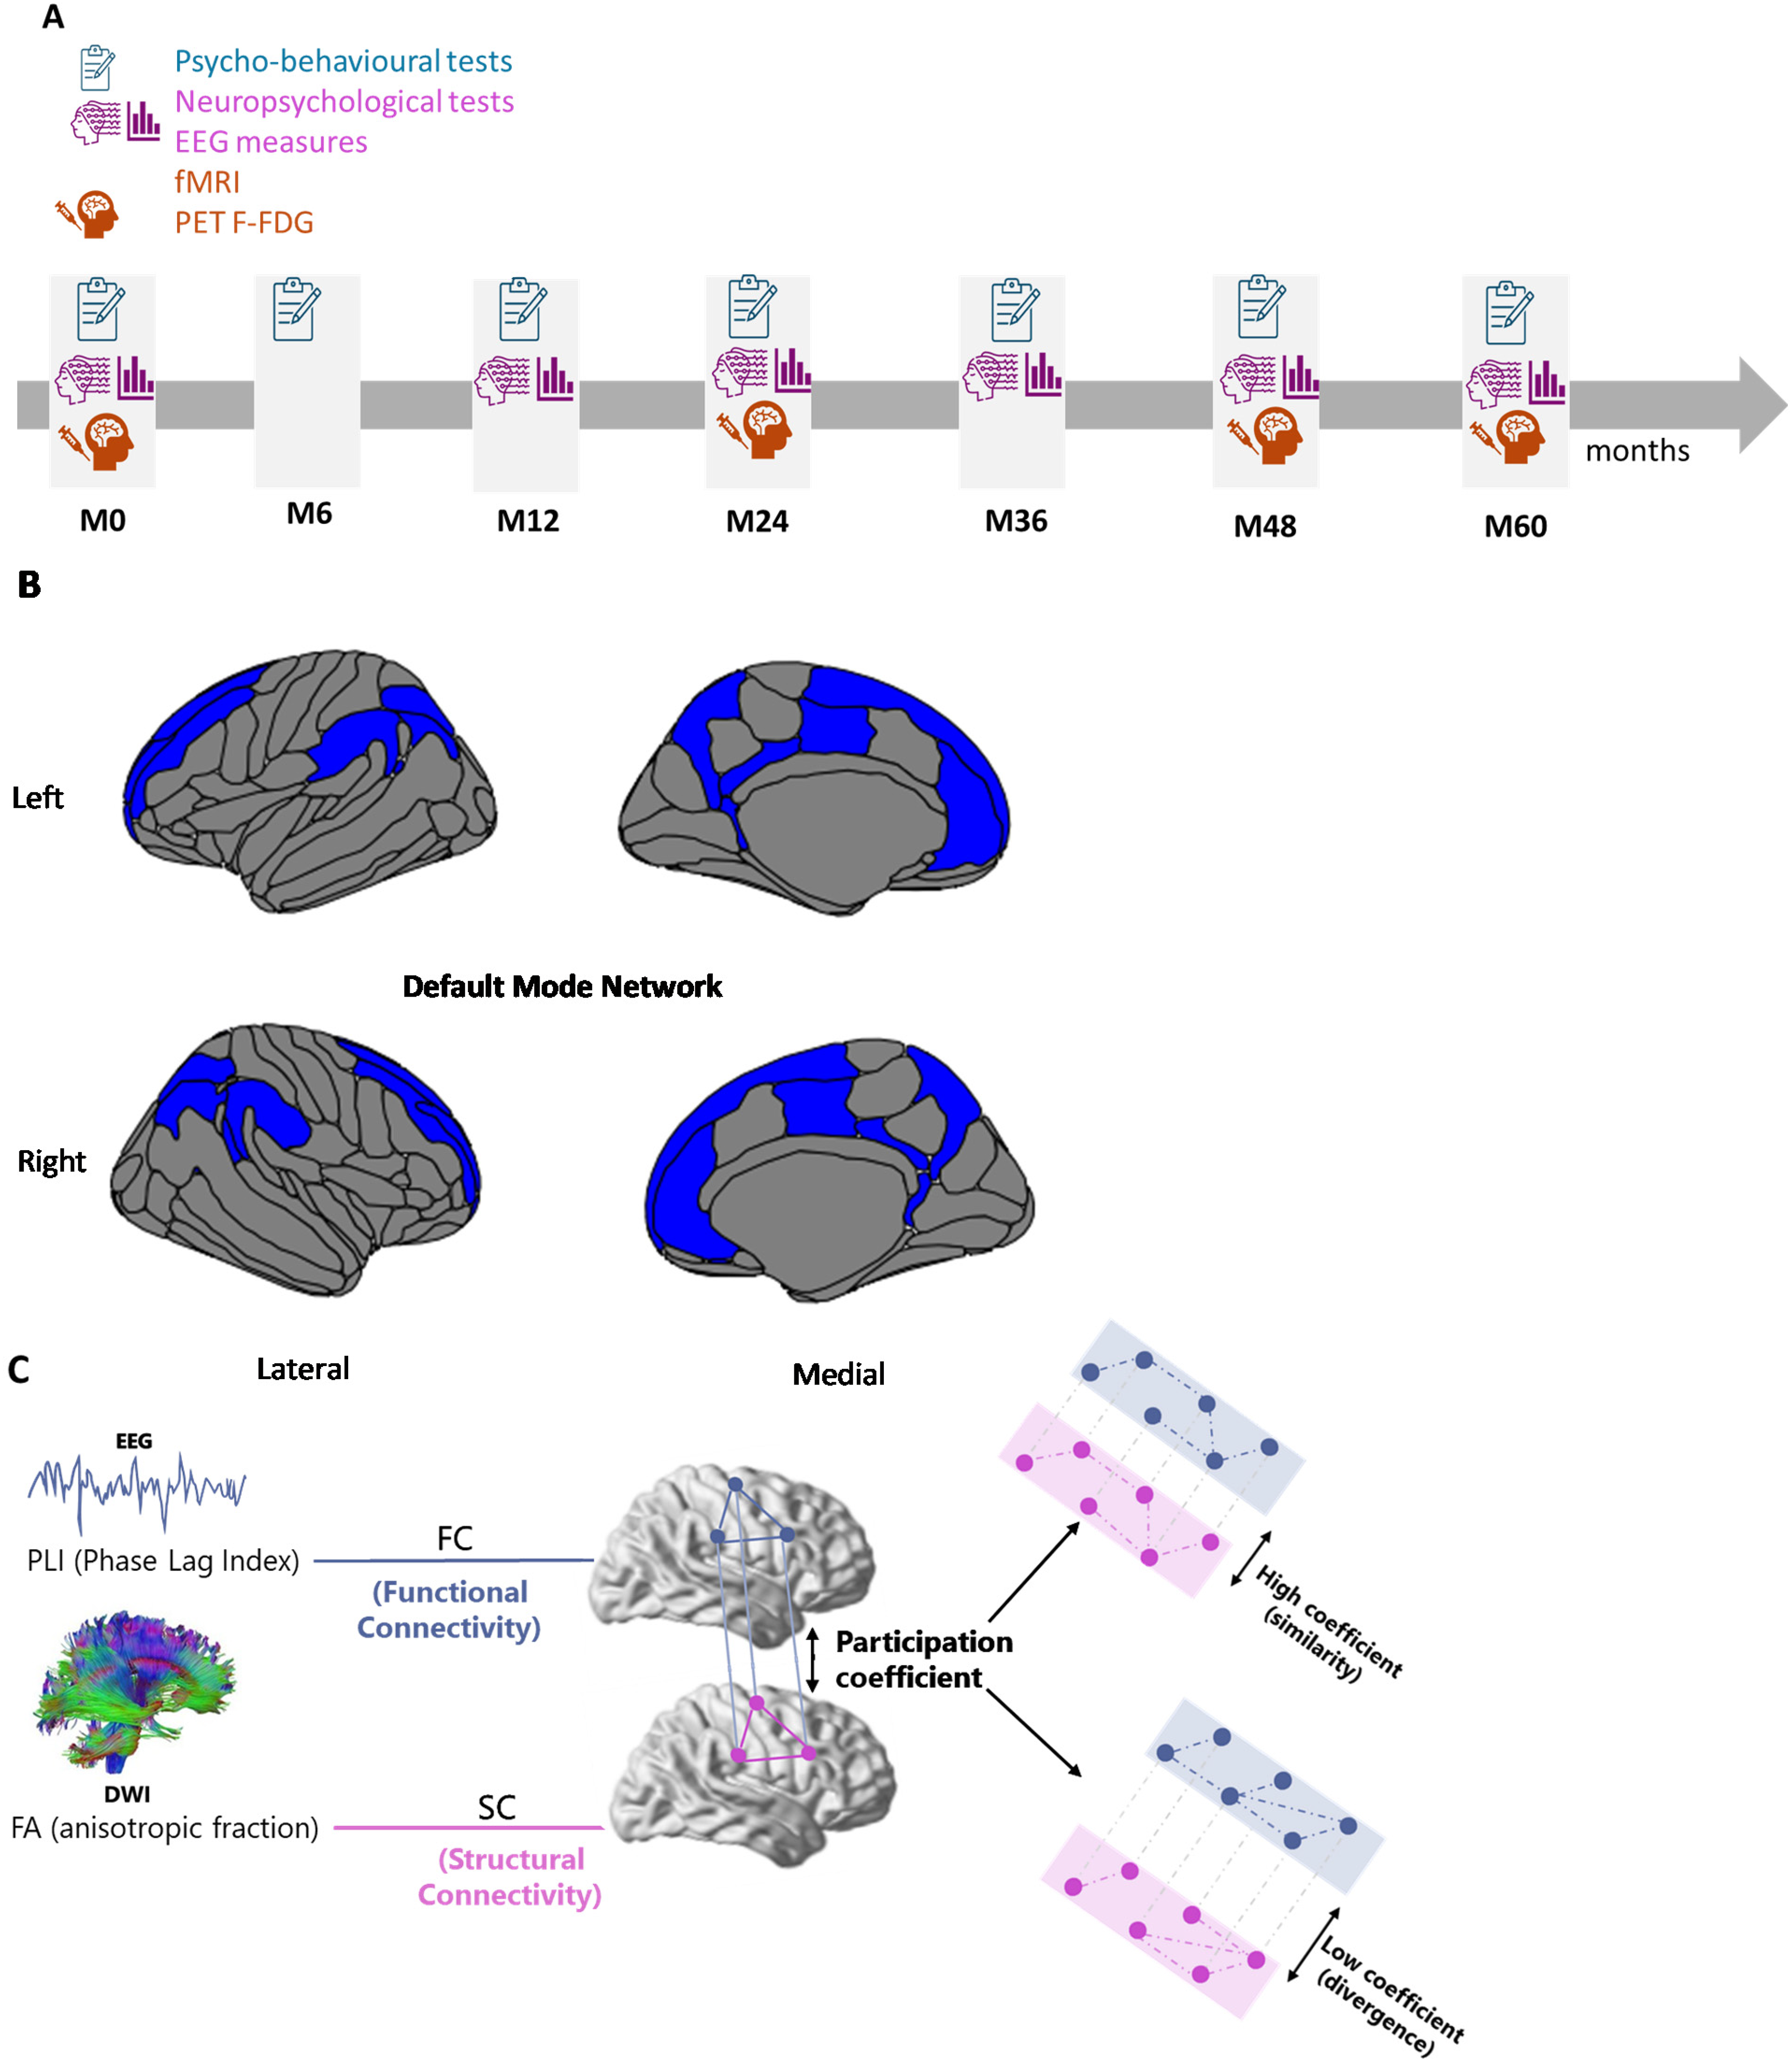
Schematic overview of the default mode network (DMN), experimental design and multilayer network construction combining EEG and DWI data. A) Design of the experimental protocol detailing the sequence of behavioral sessions (all used for longitudinal analyses), and neuroimaging assessments (M0 EEG data only used, red rectangle); B) Illustration of the DMN visualized using R-Studio scripts according to the Destrieux Atlas; C) Construction of the multilayer network, combining two layers: functional connectivity (FC) derived from EEG data using Phase Lag Index (PLI), and structural connectivity (SC) derived from DWI data using Fractional Anisotropy (FA). EEG: electroencephalography; DWI: diffusion weighted imaging.
MRI and DWI data acquisition
T1-weighted MRI data for each participant were acquired at baseline (M0) on MRI scan 3 T Magnetom VERIO system (Siemens Medical Solutions Erlangen, Germany) over a 1 h period. A 3D MPRAGE sequence was acquired for the anatomical study (sagittal orientation; repetition time 2300 ms; echo time 2.98 ms; inversion time 900 ms; flip angle 9°; 176 slices; slice thickness 1 mm; field of view 256*240 mm; matrix 256*240; bandwidth 240 Hz/Px. 28 DWI data were obtained with the following parameters: repetition time (TR) = 14000 ms; echo time (TE) = 93 ms; field of view (FOV) = 2304 mm×2304 mm; 70 axial slices; voxel size = 2 mm isotropic. The diffusion weighting scheme comprised one non-diffusion-weighted volume (B0 = 0 s/mm2) and 15 diffusion-weighted volumes acquired at B1 = 1500 s/mm2.
Neuroimaging DWI data pre-processing
Pre-processing of the diffusion data was performed using ExploreDTI (version 4.8.6), 33 and included the following steps: (a) images were corrected for eddy current distortions and participant motion; (b) a non-linear least squares method was applied for diffusion tensor estimation, and (c) deterministic DWI tractography was applied using the following parameters: uniform resolution of 2 mm, fractional anisotropy (FA) threshold of 0.2 (limit: 1), angle threshold of 45°, and fiber length range of 50–500 mm. Diffusion tensor imaging (DTI) data were motion corrected during pre-processing. A global motion index was used for quality control and the mean motion across the final sample remained below 0.4 mm. The network analysis tools in ExploreDTI were used to quantify the FA value of the fibers connecting the regions of the Destrieux atlas to obtain matrices comparable to the EEG data, 34 using FreeSurfer's individual cortical parcellation (FreeSurfer/5.3.0). This approach yielded 148*148 SC matrices covering major DMN regions (Figure 1B) such as the precuneus, posterior cingulate gyrus and sulcus, the medial prefrontal cortex, angular gyrus, temporal pole and middle temporal gyrus. A Kruskal-Wallis analysis to control DTI data quality did not reveal any difference among groups (Kruskal-Wallis, p > 0.05).
Neuroimaging EEG data acquisition
High density resting-state EEG (rsEEG) data were acquired at M0 with a 256-channel whole-head cap at 250 Hz and amplified by the EGI NetAmp300. Two separate rsEEG runs, lasting two minutes each with four 30 s sessions alternating between eyes closed (EC) and eyes opened (EO), were acquired at approximately 25 min intervals. An audio cue (low or high frequency tone) indicated the change between EC and EO.
Neuroimaging EEG data pre-processing
Pre-processing was performed using Brainstorm (version 3.221117 Nov 2022). 35 First, the electrodes were re-referenced to consider the 257th electrode (i.e., Cz) as the reference. The data from the other 256 electrodes were then filtered (0.5–40 Hz bandpass; harmonic filters at 50 Hz, 100 Hz, 150 Hz, 200 Hz, 250 Hz, 300 Hz). Only the electrodes that covered the scalp were used in the analyses (electrodes outside the scalp were removed), thus only 169 electrodes were considered. Bad channels were detected and rejected using power spectral density (PSD).11,35,36 Because all subsequent analyses were performed in source space, bad channels were excluded and not reconstructed. 37 Physiological artefacts (blinks, saccades and cardiac artefacts) were identified and removed by independent component analysis (ICA) as implemented in Brainstorm and muscle artefacts were identified and discarded after visual inspection of ICA components. 38 Four epochs of 30 s each, alternating between eyes closed and eyes opened (EC, EO), were extracted. EO epochs were used to normalize the activity measured during the EC (e.g., (EC-EO)/EO for each subject and in each band, at each grid point, using the EO condition as a subject specific physiological baseline). 39 This ensures that the reported connectivity and power values reflect state-specific neural dynamics. 40 This normalization was applied at the level of PSD, prior to connectivity computation. The EEG head model was obtained using a symmetric boundary element method. 41 The Phase Lag Index (PLI) was computed in source space, after source reconstruction with a Boundary Element Model (BEM) and cortically constrained sLORETA inverse solution procedure to estimate the cortical origin of scalp EEG signals, 42 using individual T1-weighted anatomical MRI priorly processed using FreeSurfer. 43 For each region of interest (ROI), a representative time series was extracted using principal component analysis of all source vertices within that ROI, as implemented in Brainstorm. This approach captures the dominant temporal dynamics of each cortical region and reduces the influence of local noise and spatial leakage.
The individual alpha-peak frequency (IAF) measured as the average of peaks detected between 7–13 Hz over occipital electrodes was used to define the delta band for each participant (between IAF minus 8 Hz and IAF minus 6 Hz).3,13,44 The PLI was computed as implemented in Brainstorm, 45 and was used to assess the functional synchrony between ROI defined using the Destrieux atlas brain parcellation.
Multiplex network segmentation and construction
Following Jauny et al.,
20
we used BRAPH software 1.0.0 (http://braph.org/)46 to construct a two-layer multiplex network for each subject: a “structural” layer with DWI tract FA data and a “functional” layer with PLI EEG data. This framework allows direct assessment of cross-modal integration while preserving the topological correspondence between anatomical and functional networks.46,47 A multiplex network is a multilayer framework in which several types of connectivity (i.e., structural and functional) are represented as distinct but interconnected layers. Each layer encodes a specific type of interaction between the same set of nodes. In this case, the cortical regions defined by the Destrieux atlas share identical nodes across layers (i.e., the same ROIs across layers) (Figure 1C). Therefore, each brain region (e.g., the precuneus, the medial prefrontal cortex and the posterior cingulate cortex) appears once in each layer, and the edges connecting these nodes represent modality-specific interactions. Considering the prominent changes in healthy and pathological aging,3,8 the association of connectivity in the delta frequency band with the structural layer was specifically investigated. For each participant, a binary multiplex matrix was calculated from the individual matrices of DWI and EEG data. To ensure comparable network density across modalities and participants, both structural and functional connectivity matrices were binarized using a subject independent threshold. Matrices were binarized according to the minimum density of 1.9% observed for DTI across all participants. Specifically, the minimum non zero (1.9%) tract density value observed across all participants in the DWI matrices was used as common threshold. The density or number of connections for all matrices was the same across layers. Connections with values above this threshold were assigned a weight of 1, and all others were set to zero. This procedure ensures that all multiplex networks share the same edge density, facilitating across layer comparisons. We chose the minimum non-zero tract density as the binarization threshold as it was the number observed for DTI data across all participant,
48
in order to preserve all structural connections detected by deterministic tractography in any participant, on the basis that a connection is considered present whenever at least one streamline is reconstructed between two regions. Fixed percentage thresholds such as retaining the top 10% of connections can introduce participant dependent variability by including weak connections in some individuals while excluding potentially genuine ones in others, thereby affecting topology in a non-uniform way. This approach is also consistent with previous work from our group.
20
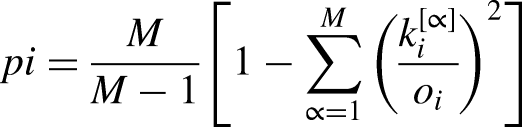
Since the nodes are identical across layers, it is possible to quantify how similar the connectivity pattern of each region is between modalities, for example by computing the multiplex participation coefficient (PC),
47
which reflects the degree of structure-function similarity for a given node. The PC was investigated, allowing the quantification of the connectivity similarity of a node across the different layers. The multiplex PC of a node i is defined as:
Statistics
To assess EEG data quality, the number of rejected ICA components and bad channels were recorded for each participant. Group comparisons on these quality metrics were performed using the Kruskal-Wallis to verify that data quality did not differ systematically across groups. Descriptive statistics were calculated for each neuropsychological measure and are reported as median values with interquartile range (IQR). These descriptive values are presented in Table 1. The normality and homogeneity of variance of each dependent variable were verified using respectively Q-Q plot visualization and Levene's test. The individual mean of subjective memory complaints was first computed for each participant across all available visits. Group level descriptive statistics (mean ± standard deviation) were then computed from these individual means separately for the three amyloid groups. Between-group comparisons were performed using ANOVA despite unequal group sizes (n = 34, n = 19 and n = 13 respectively). Consistent with previous reports from the INSIGHT pre-AD cohort all participants were cognitively normal at inclusion and showed comparable neuropsychological performance at baseline (M0) independently of amyloid burden.28,30,50 The analyses therefore focused on longitudinal trajectories rather than baseline group difference. To assess the five-year longitudinal cognitive trajectory for each participant's neuropsychological test, variation rates were calculated as a percentage change, defined as the difference between the score at the participant's last follow-up session (e.g., M48 or M60) and their baseline (i.e., M0). This difference was then divided by the score at M0 and multiplied by 100. (e.g., (MMSE M60–MMSE M0)/MMSE M0) * 100). The variation rates normalize change relative to the initial score, enabling a direct comparison across participants with different baseline levels. However, because this approach captures the total magnitude of change between two time points rather than the rate of change per unit time, they do not account for differences in the duration of follow-up across participants.
Neuropsychological performance at the initial session and after 5 years of follow-up (last session) for the three groups’ cognitive scores showing significant results.
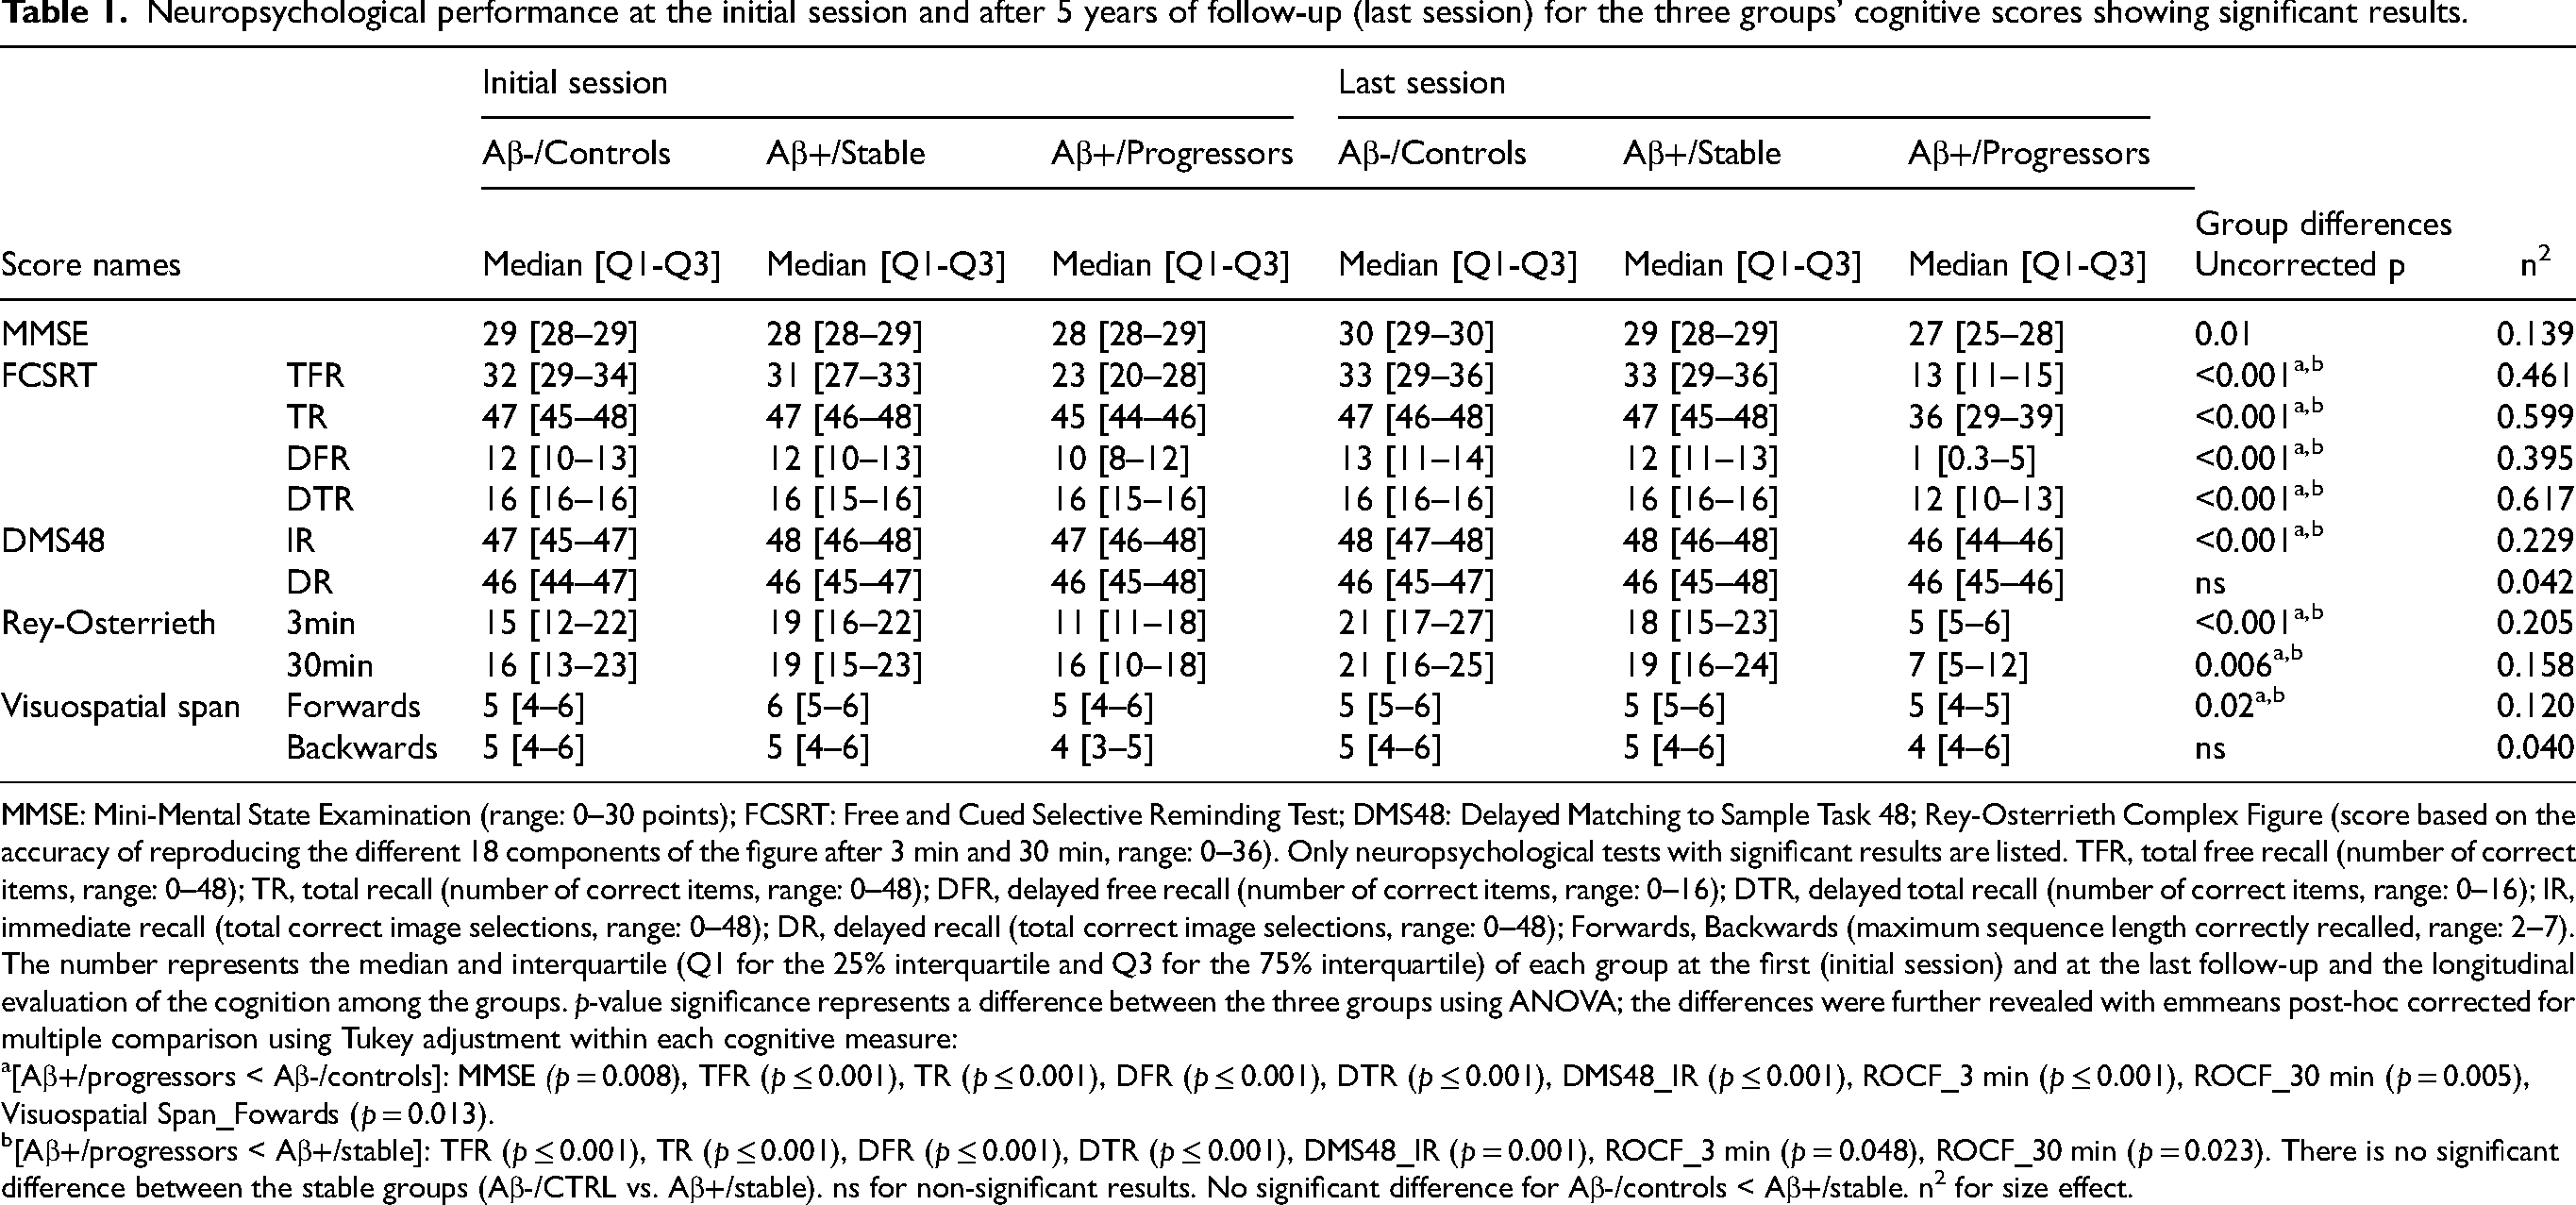
MMSE: Mini-Mental State Examination (range: 0–30 points); FCSRT: Free and Cued Selective Reminding Test; DMS48: Delayed Matching to Sample Task 48; Rey-Osterrieth Complex Figure (score based on the accuracy of reproducing the different 18 components of the figure after 3 min and 30 min, range: 0–36). Only neuropsychological tests with significant results are listed. TFR, total free recall (number of correct items, range: 0–48); TR, total recall (number of correct items, range: 0–48); DFR, delayed free recall (number of correct items, range: 0–16); DTR, delayed total recall (number of correct items, range: 0–16); IR, immediate recall (total correct image selections, range: 0–48); DR, delayed recall (total correct image selections, range: 0–48); Forwards, Backwards (maximum sequence length correctly recalled, range: 2–7). The number represents the median and interquartile (Q1 for the 25% interquartile and Q3 for the 75% interquartile) of each group at the first (initial session) and at the last follow-up and the longitudinal evaluation of the cognition among the groups. p-value significance represents a difference between the three groups using ANOVA; the differences were further revealed with emmeans post-hoc corrected for multiple comparison using Tukey adjustment within each cognitive measure:
[Aβ+/progressors < Aβ-/controls]: MMSE (p = 0.008), TFR (p ≤ 0.001), TR (p ≤ 0.001), DFR (p ≤ 0.001), DTR (p ≤ 0.001), DMS48_IR (p ≤ 0.001), ROCF_3 min (p ≤ 0.001), ROCF_30 min (p = 0.005), Visuospatial Span_Fowards (p = 0.013).
[Aβ+/progressors < Aβ+/stable]: TFR (p ≤ 0.001), TR (p ≤ 0.001), DFR (p ≤ 0.001), DTR (p ≤ 0.001), DMS48_IR (p = 0.001), ROCF_3 min (p = 0.048), ROCF_30 min (p = 0.023). There is no significant difference between the stable groups (Aβ-/CTRL vs. Aβ+/stable). ns for non-significant results. No significant difference for Aβ-/controls < Aβ+/stable. n2 for size effect.
Group-based analyses were conducted at two levels: (i) a whole-brain level using the average PC across all cortical regions from the Destrieux atlas, and (ii) a network-specific level restricted to regions of the DMN, defined a priori based on anatomical labels and prior literature. 20 To investigate the specificity of reported results, additional control analyses were conducted in the alpha band (IAF minus 2/IAF plus 2) and in the Salience network (SN) (composed of the insula, the anterior cingulate cortex, the ventral striatum, the thalamus, the amygdala).
To assess group differences in the PC, one-way analyses of variance (ANOVA) were conducted, followed by pairwise post hoc comparisons using Tukey's test which is more appropriate than Bonferroni because of the unequal group size to explore specific group effects. Age, level of education and sex were included as covariates in these analyses to control for potential confounding effects. Association between the PC (global and local) and alpha peak frequency were conducted through Pearson's correlation. The relationship between the PC and cognitive variation rates was assessed using partial Pearson correlations, controlling for age, sex and level of education. Partial correlations were computed to isolate the unique association between the PC and each cognitive outcome while removing the shared variance attributable to these demographic covariates. These analyses were conducted both across all participants and separately within each group. An FDR correction was applied to the p-values derived from the partial correlation analyses to control for false positives. Educational level was characterized using the estimated number of years of formal education, with 12 years corresponding to a high school diploma. All statistical tests were conducted using JASP software (https://jasp-stats.org/ ; version 0.17.2.1). The networks specific analyses were FDR corrected for multiple comparisons. 51 To assess the internal consistency of the results across EEG recordings, a 2 (Group)×2 (Run) mixed ANOVA was performed. In addition to correlation analyses, additional exploratory hierarchical clustering analyses were performed to determine whether group differences in longitudinal cognitive trajectories could be identified based on the structure/function coupling profile, independently of their a priori amyloid-based group assignment. Hierarchical cluster analyses were performed using the between-groups linkage method of clustering (with squared Euclidean distance). The squared Euclidean distances were computed between each subject and subjects with the smallest distance were classified together in a cluster. The range of number of clusters started at 2 and stopped at 4, but only clusters that would divide the group in subgroups with sufficient number of subjects per subgroup (N > 15) were selected for statistical analyses.
Results
Demographic and clinical characterization of the groups of interest
Participants were assigned to three groups according to their amyloid status and clinical progression over time: Aβ-/controls, Aβ+/stable and Aβ+/progressors.30,50 Demographic characteristics (i.e., age, sex, level of education) and the assessment of the subjective memory complaint of the sample are presented in Tables 2 and 3, respectively. Among the 66 participants initially included in the study, 21.2% (n = 14) did not complete the full five-years follow-up (M60). The mean follow-up duration was 4.70 years (± 0.72). Consistent with previous INSIGHT pre-AD studies,28,30,50 the groups did not differ in global cognitive performance at baseline (M0) as measured by the MMSE (p = 0.46), confirming that cognitive functioning was comparable among groups at study entry, as per protocol design.
Demographics characteristics of the groups of interest: Aβ-/controls, Aβ+/stable, Aβ+/progressors.
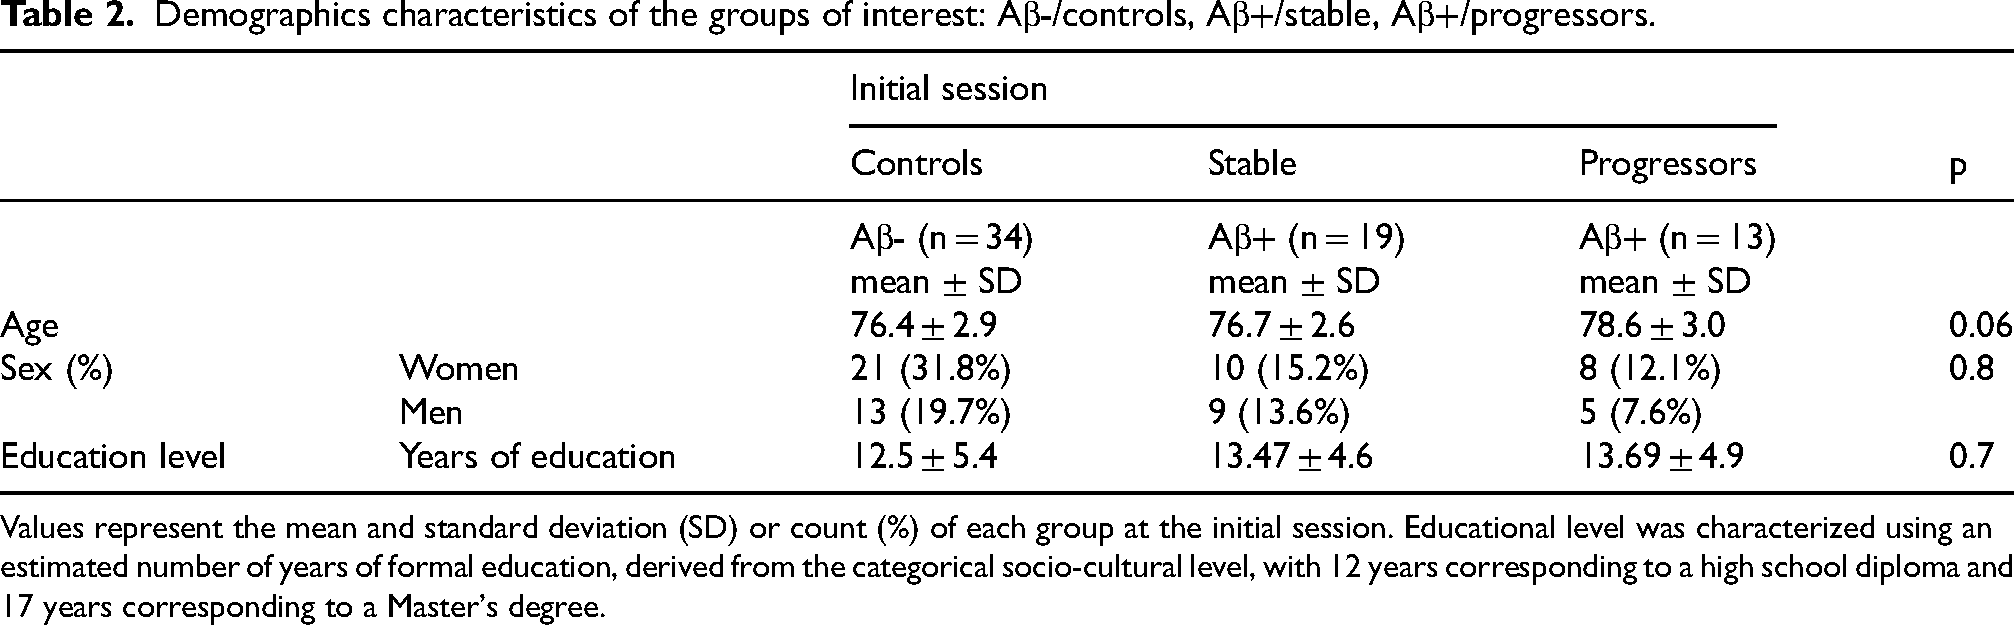
Values represent the mean and standard deviation (SD) or count (%) of each group at the initial session. Educational level was characterized using an estimated number of years of formal education, derived from the categorical socio-cultural level, with 12 years corresponding to a high school diploma and 17 years corresponding to a Master's degree.
Subjective feelings about memory and cognition.
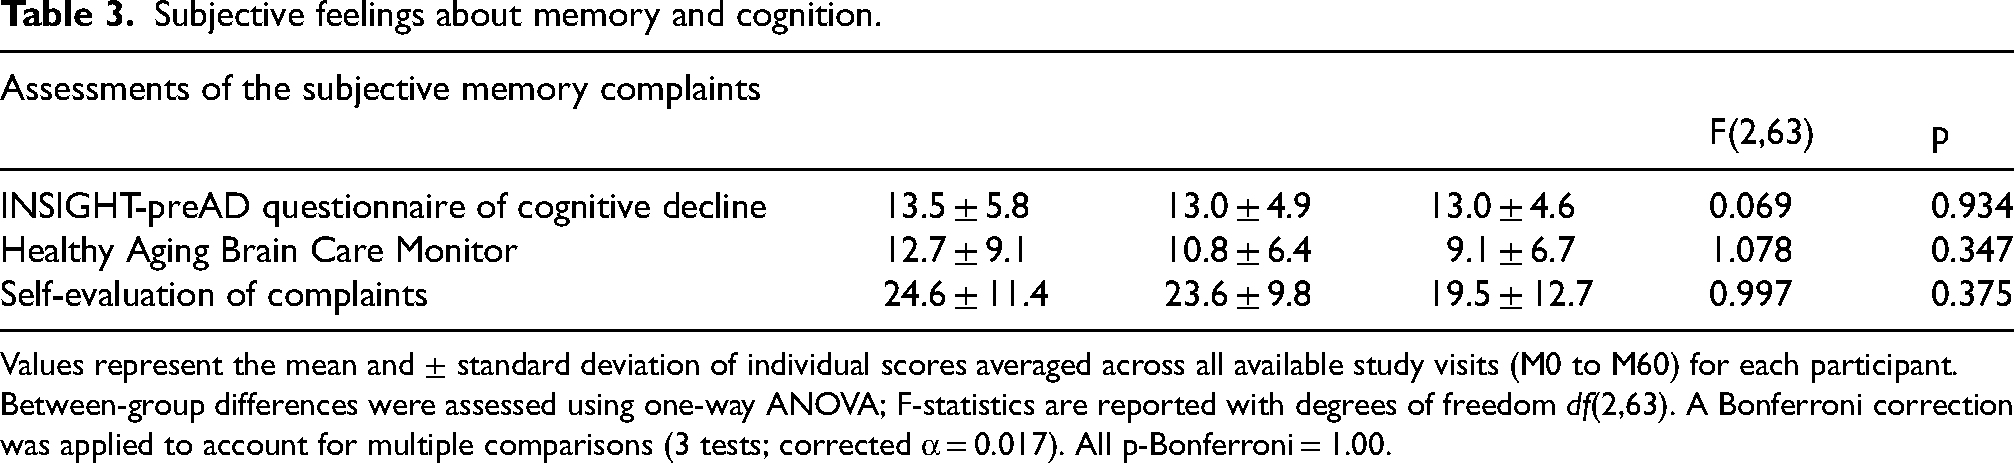
Values represent the mean and ± standard deviation of individual scores averaged across all available study visits (M0 to M60) for each participant. Between-group differences were assessed using one-way ANOVA; F-statistics are reported with degrees of freedom df(2,63). A Bonferroni correction was applied to account for multiple comparisons (3 tests; corrected α = 0.017). All p-Bonferroni = 1.00.
A clear divergence in cognitive trajectories emerged over time. After the five years follow-up, Aβ+/progressors showed significantly reduced performance in global cognition (MMSE) and episodic memory (FCSRT, DMS48 and Rey-Osterrieth) compared to both Aβ-/controls and Aβ+/stable as shown in Table 1. In contrast, Aβ+/stable and the Aβ-/controls groups remained globally stable across the follow-up period. This distinct longitudinal pattern highlights the emergence of cognitive decline specifically in the Aβ+/progressors group, despite comparable baseline performance.
Longitudinally, for global cognition, Aβ+/progressors have reduced MMSE scores compared to the Aβ-/controls (ptukey = 0.008, ±1.688) but non statistically different compare to Aβ+/stable (ptukey = 0.062, ±1.854) groups while Aβ-/controls did not differ from Aβ+/stable groups (ptukey = 1, ±1.440) (see Table 3 for main group effects). A similar pattern was observed for memory performance, with lower FCSRT_TR total recall in Aβ+/progressors compared with Aβ-/controls and Aβ+/stable groups respectively (ptukey<0.001, ±2.080) and (ptukey<0.001, ±2.284), but no difference on performance between Aβ-/controls and Aβ+/stable (ptukey = 0.755, ±1.774).
Reduced performance was also observed in Aβ+/progressors for DMS48 immediate recognition compared with Aβ-/controls (ptukey<0.001, ±1.544) and Aβ+/stable (ptukey = 0.001, ±1.713). For the Rey-Osterrieth 3-min recall, Aβ+/progressors showed a slower performance compared to Aβ-/controls (ptukey<0.001, ±13.861) but a slightly slower performance compared Aβ+/stable (ptukey = 0.048, ±15.169) with no difference between Aβ-/controls and Aβ+/stable (ptukey = 0.303, ±12.206). Finally, for the Rey-Osterrieth 30minutes recall, the Aβ+/progressors showed a stronger decline compared to the Aβ-/controls (ptukey = 0.005, ±15.129) and Aβ+/stable (ptukey = 0.023, ±16.481), while the Aβ-/controls groups and the Aβ+/stable did not differ (ptukey = 0.9336 ± 13.341), see Supplemental Table 1 for more information on size effect and bootstrapping 95%CI.
EEG functional connectivity PLI analyses
EEG data quality was comparable across the three groups. The number of rejected ICA components was minimal across participants ranging from 0 to 7 (median = 1) and did not differ significantly (Kruskal-Wallis: H(2) = 5.52, p = 0.063) between Aβ-/controls, Aβ+/stable and Aβ+/progressors groups. Exploratory pairwise comparisons with Bonferonni correction (Mann-Whitney tests, α = 0.017) did not identify any significant differences between specific groups pairs (all corrected p > 0.017). Similarly, the number of bad channels did not differ across groups (Kruskal-Wallis, p > 0.05), confirming that group differences in EEG connectivity measures were not attributable to systematic differences in data quality. The one-way ANOVA performed on delta band PLI values within the DMN revealed no significant group effect (F(2,63) = 1.65, p = 0.20, η2 = 0.049). While mean PLI values were lower in Aβ+/progressors compared to the others two groups, these differences were not statistically significant. However, when examining the association between delta band within the DMN and FCSRT (Total Free Recall), a significant (after FDR correction) and positive partial correlation was observed (r = 0.262, p = 0.033). No significant results were found for the SN or in the alpha frequency (p > 0.1). Overall, participants with higher delta synchrony within the DMN showed better recall performance, suggesting that delta within the DMN supports episodic memory efficiency.
Multiplex participation coefficient analyses
A global multiplex ANOVA analysis to assess the PC in the entire brain was conducted for the delta band. No group differences for the delta frequency band (F(2,63) = 0.218, p = 0.805, η2 = 0.007) or the alpha band frequency (F(2,63) = 0.953, p = 0.391, η2 = 0.029). Then, a local network multiplex analysis was conducted to assess whether a difference in the PC was notable in the DMN for the delta band among our participants (F(2,63) = 4.363, p = 0.017, η2 = 0.122). Post Hoc results of Tukey showed an increased PC for Aβ+/progressors compared to Aβ-/controls (ptukey = 0.018, ±0.025) and Aβ+/progressors compared to Aβ+/stable (ptukey = 0.035, ±0.028; see Figure 2). No significant differences were found between Aβ+/controls and Aβ+/stable groups (ptukey = 1, ±0.022).
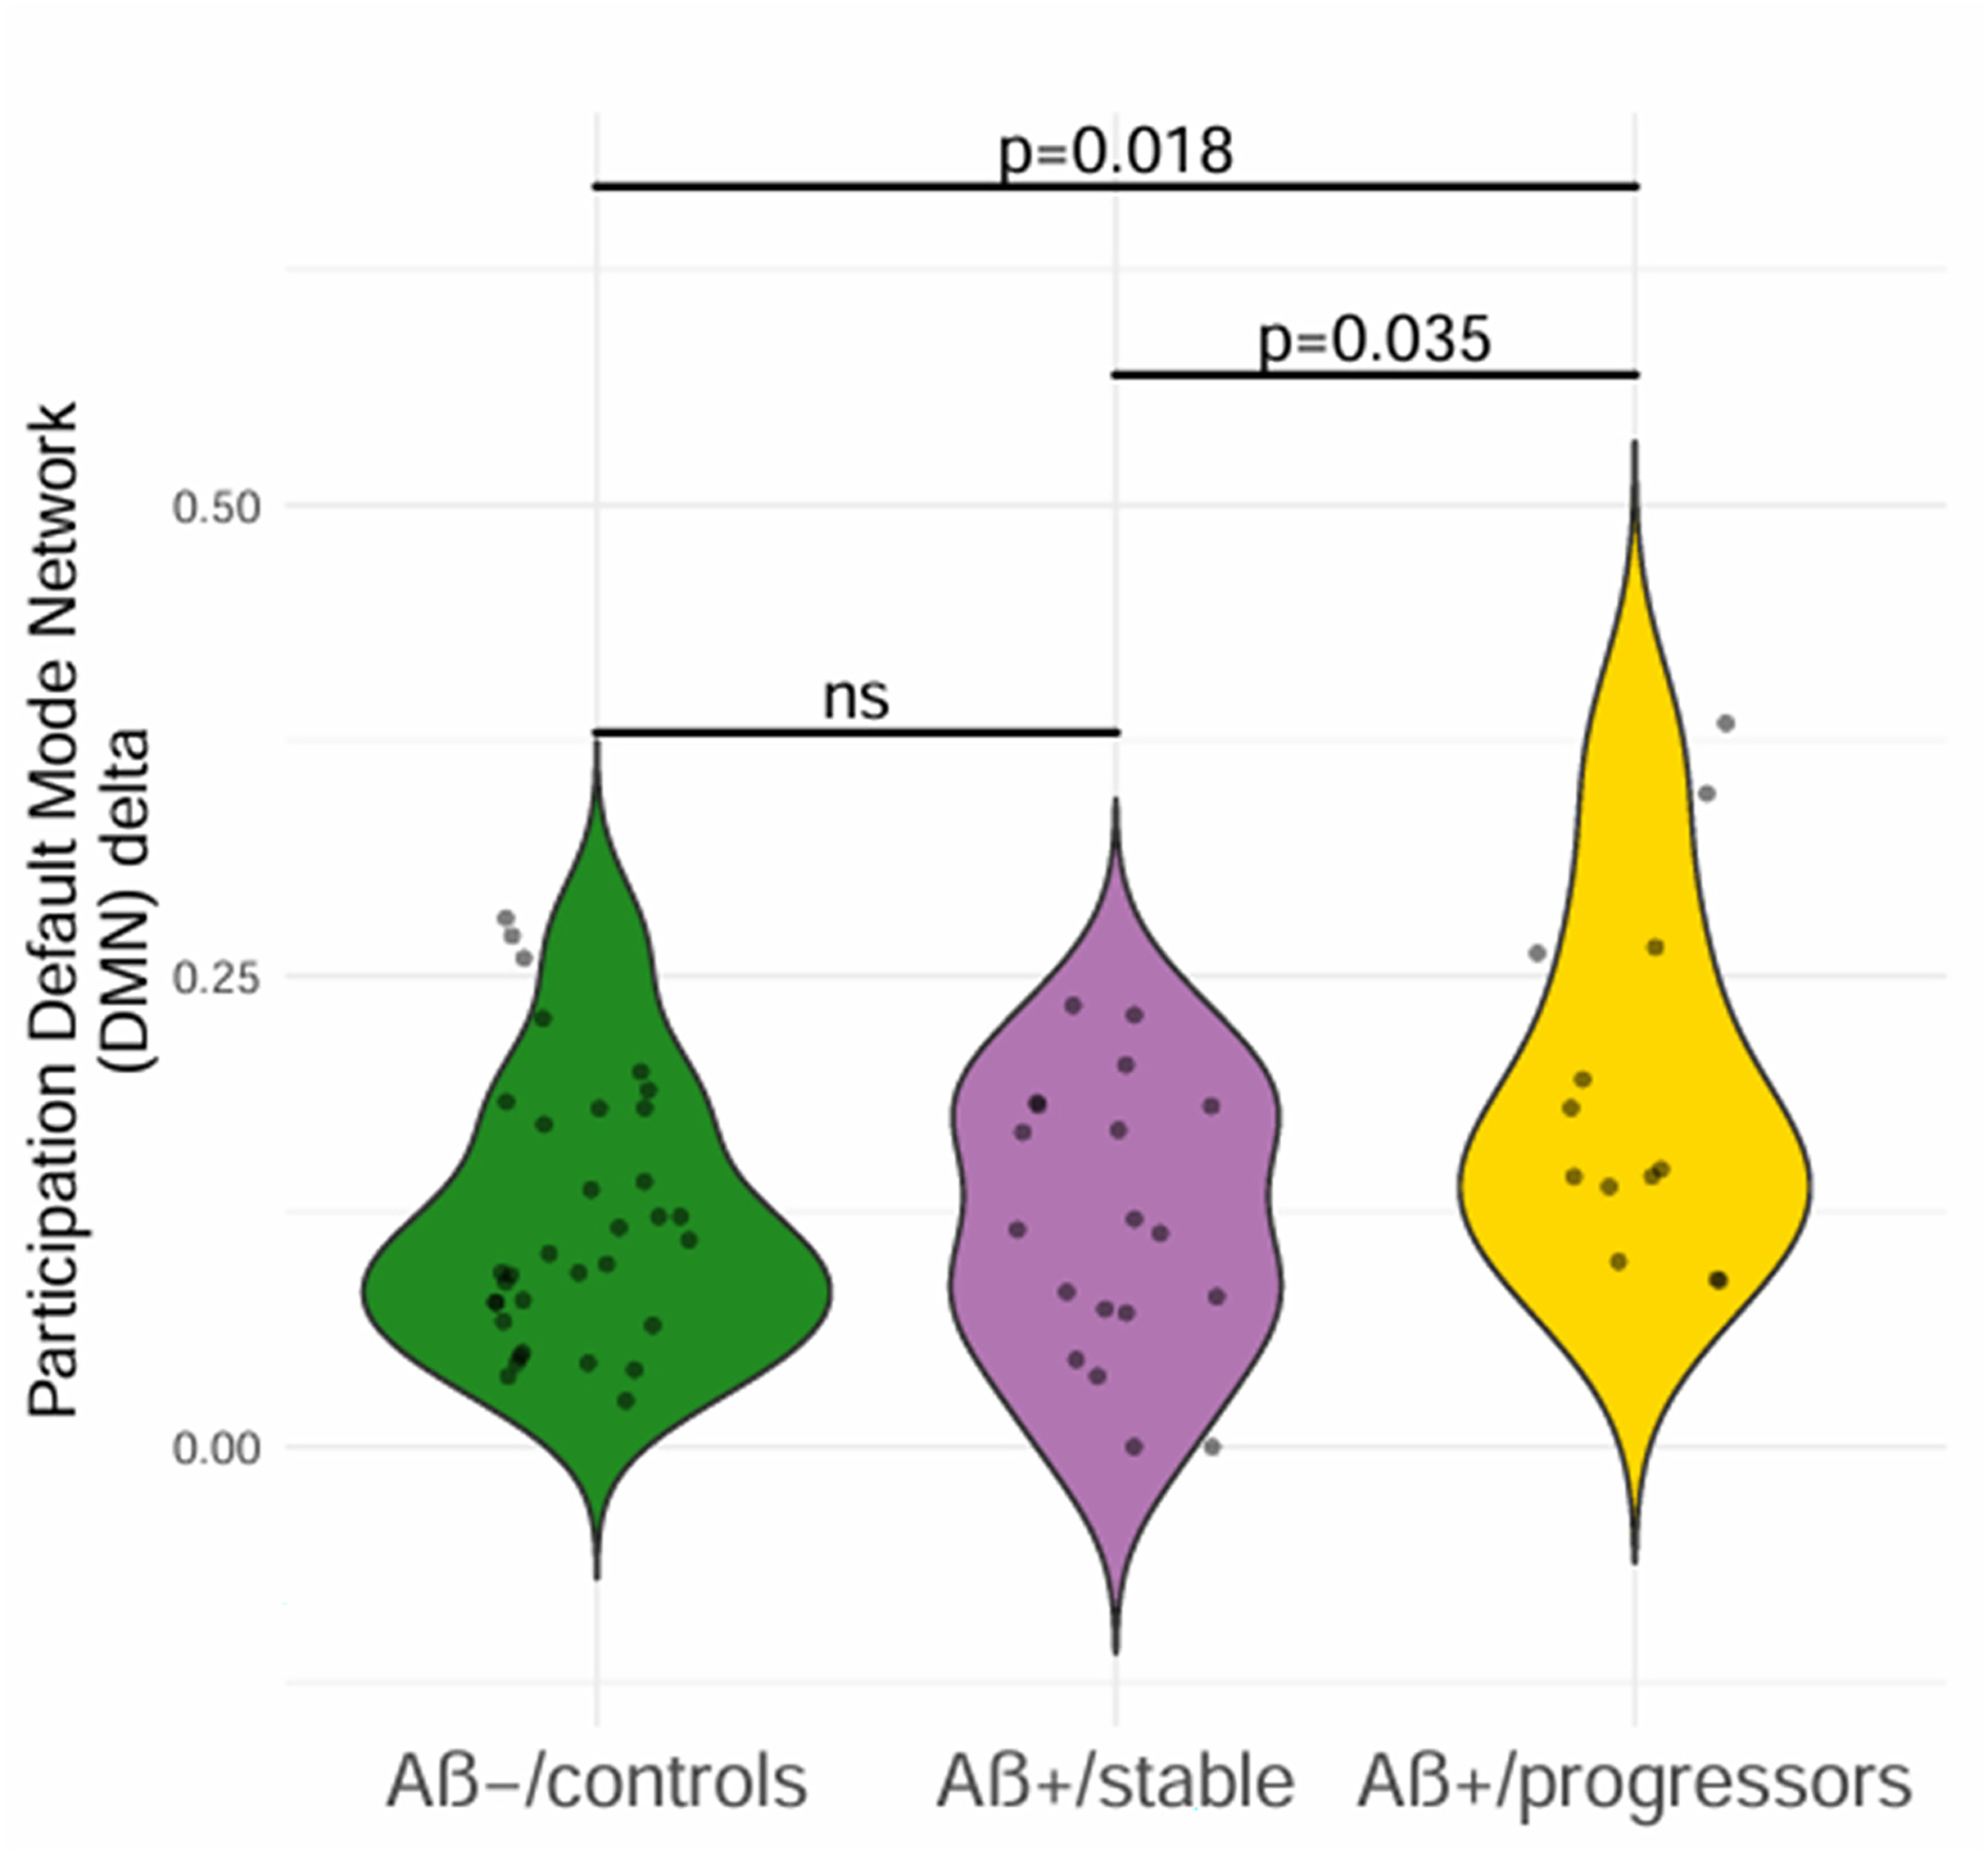
Level of the multiplex participation coefficient in the DMN as a function of group. Higher and statistically significant PC in Aβ+/progressors participants compared to Aβ+/stable and Aβ-/controls. F(2,63) = 4.363, p = 0.017, η2 = 0.122); significant p after post-hoc of Tukey, ns: non-significant
No correlation was observed between global or local multiplex PC and the individual alpha peak frequency (ps > 0.40). To assess frequency and network specificity, the same multilayer connectivity analyses (e.g., additional ANOVA analyses) were conducted in alpha frequency band and the SN reported in AD.8,52 No significant findings were observed. Furthermore, a 2(Group)×2(Run) mixed-design ANOVA including both rsEEG recordings (first and second rsEEG sessions; see Methods) was conducted to examine the robustness and internal replicability of the reported results. 53 The results revealed no main effect of Run and no Group×Run interaction (ps > 0.16) indicating that the group effects remained stable across both recordings with no influence of the timing of the EEG acquisition, meaning the PC values remains stable across sessions.
Negative association between cognitive performance and multiplex participation coefficient
To further determine the impact of network changes on cognitive performance, partial correlation analyses were conducted between the PC and the scores of the neuropsychological measures listed in Table 1. p-values were adjusted for multiple comparisons using FDR across the eleven cognitive outcomes tested.
The correlation analyses revealed a significant negative association between global brain multiplex PC and FCSRT total recall variation rate within the delta band frequency with higher network similarity associated with larger episodic memory decline (r = -0.371, p_uncorrected = 0.0082, p_FDR = 0.016; Figure 3A). A similar negative association was observed when restricting the PC correlation to the DMN regions (r = -0.358, p_uncorrected = 0.003, p_FDR = 0.033; Figure 3B). Notably, among individual DMN areas, only the left dorsal PCC showed a significant correlation with the FCSRT_TR. The correlation also highlighted that this relationship was mainly driven by the stronger decline in Aβ+/progressors participants relative to the other groups. No other significant results were observed for other neuropsychological measures after FDR correction.
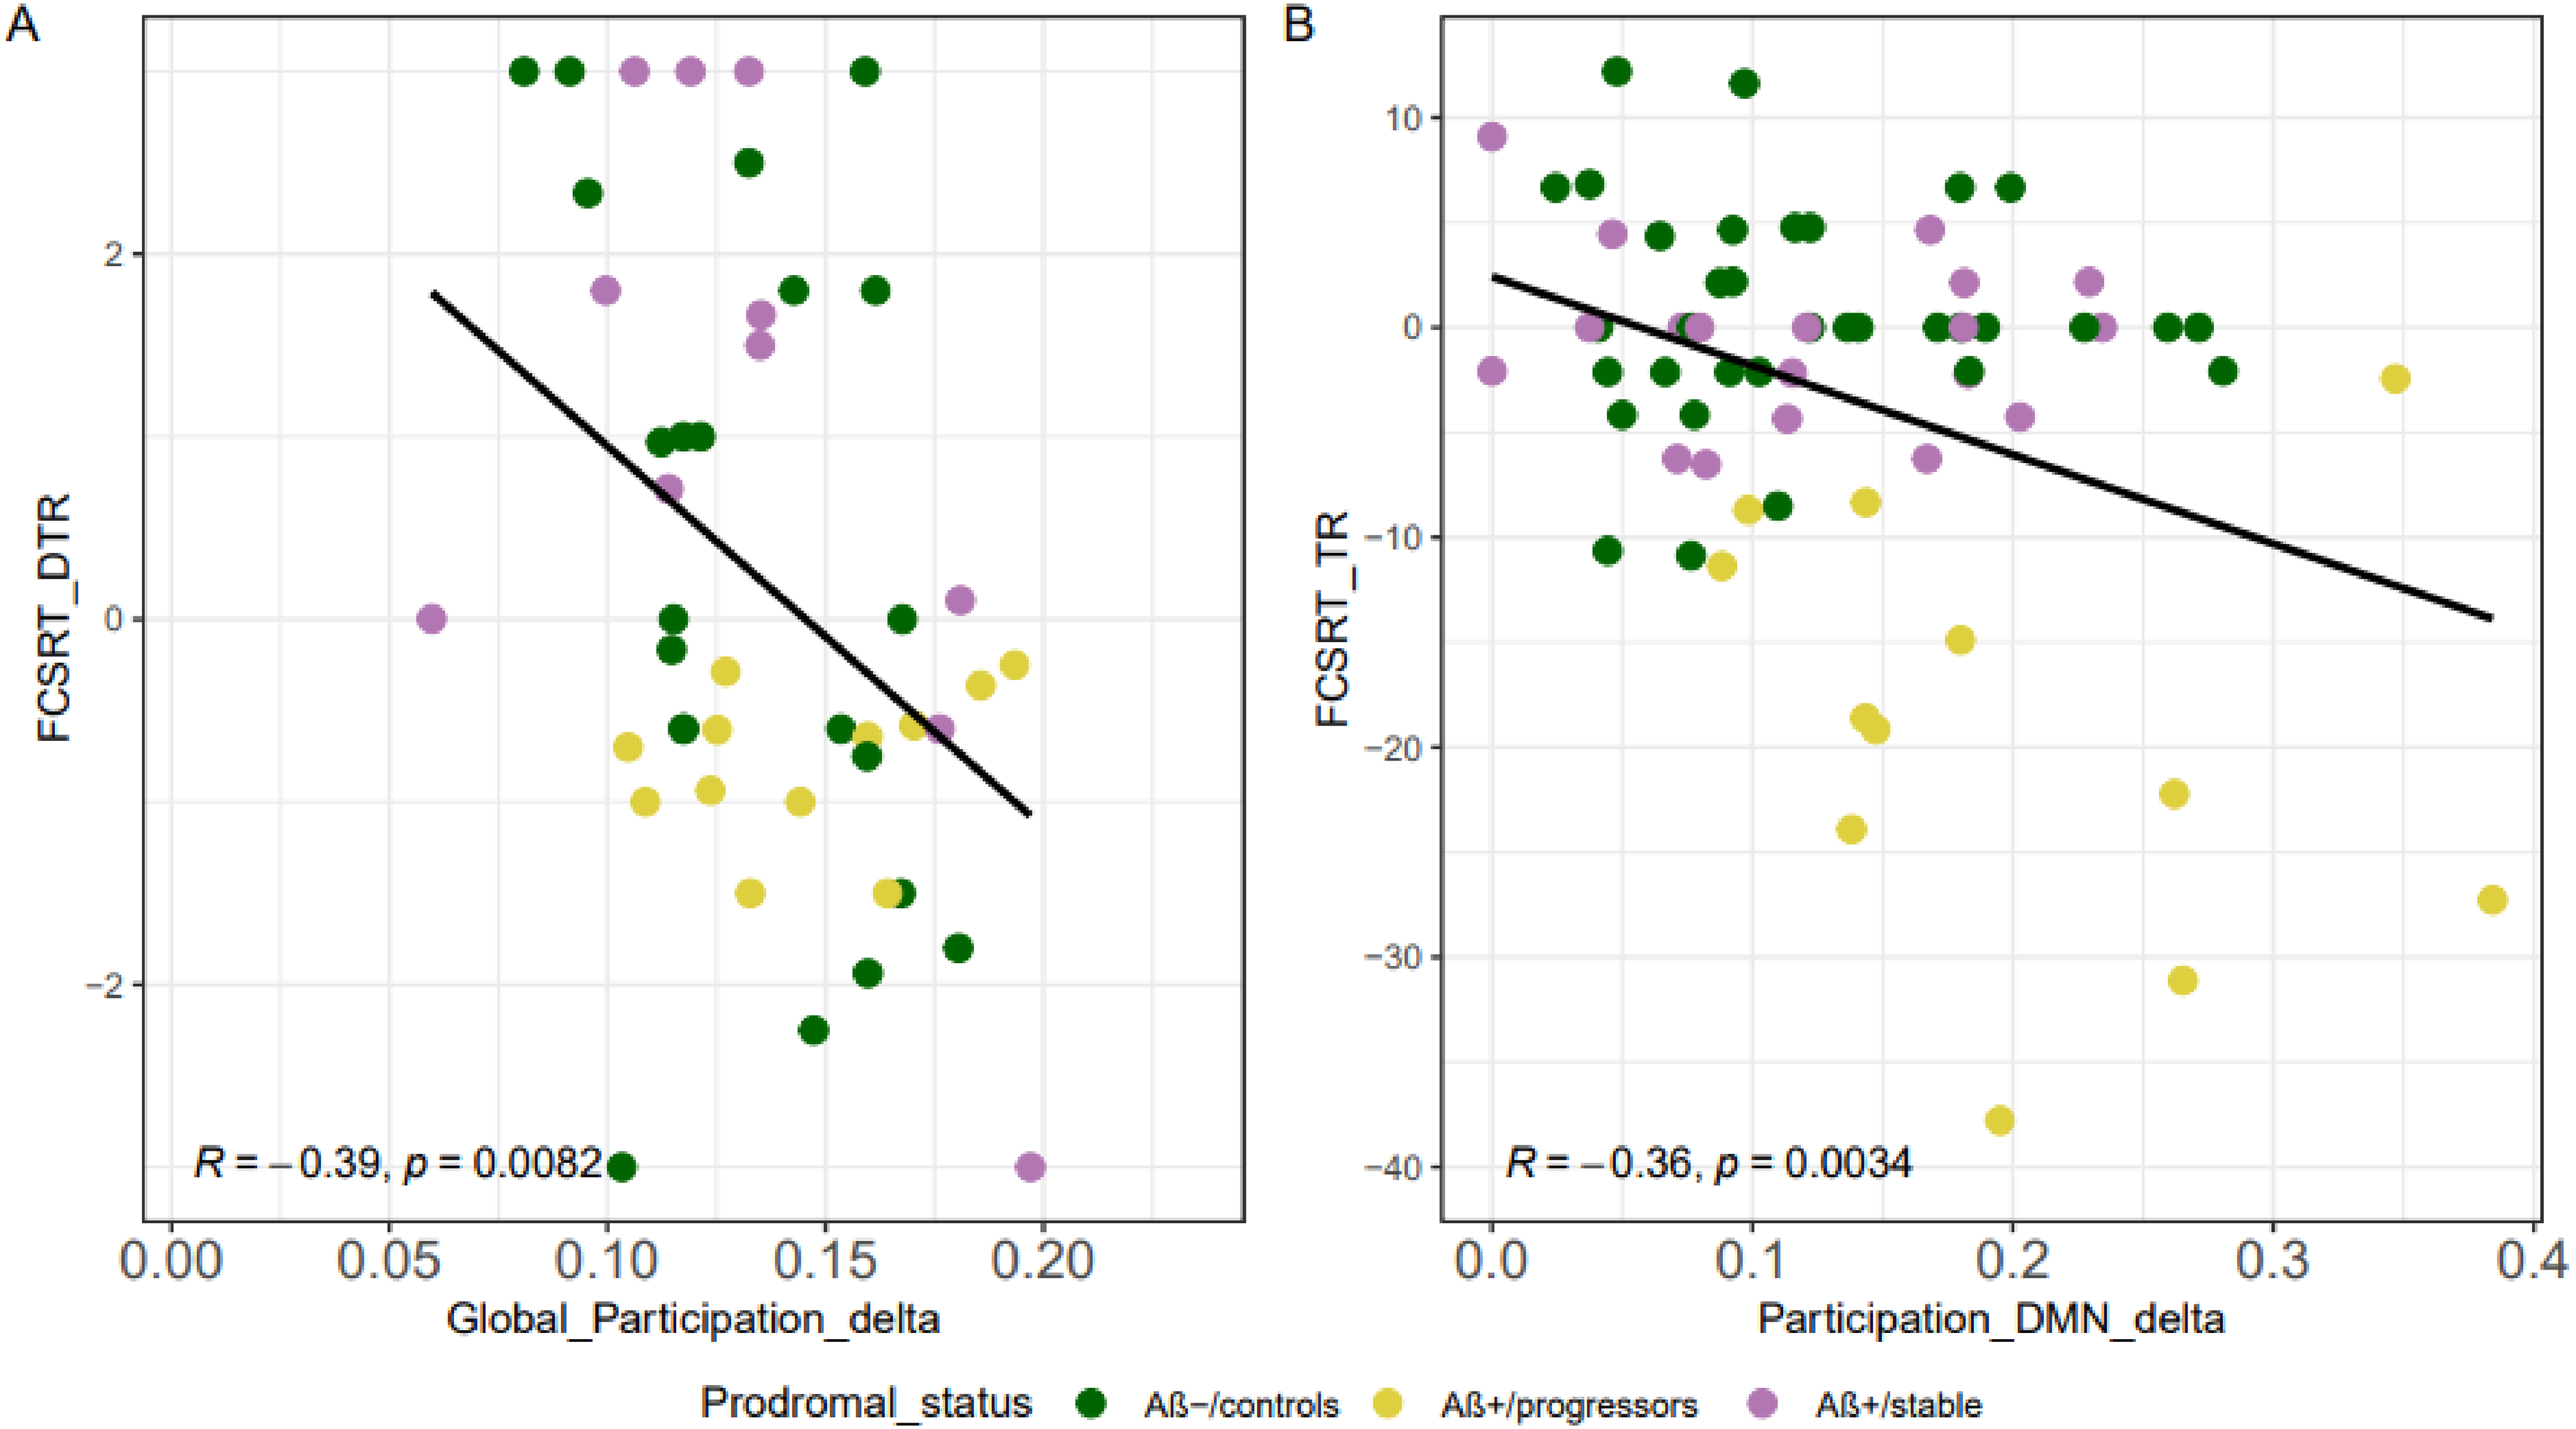
Negative association of the multiplex participation coefficient with the FCSRT variation rate. A) A higher PC for the DMN within the delta band frequency is associated with lower cognitive function mostly for the Aβ+/progressors as shown by the FCSRT test, B) a higher PC in the whole-brain within the delta band frequency associated with lower cognitive function as revealed by the FCSRT.
Individual within-group correlations (performed separately for each group) did not yield significant associations, indicating that the global brain effect was driven by between group variability rather than within group variance. Additionally, to examine whether the PC tracks amyloid burden along AD continuum, partial correlations were computed between global cortical SUVR and the delta-band DMN PC, controlling for age, sex and education. No significant positive association was observed across the full sample nor within the amyloid positive participant suggesting that the relationship is primarily categorical rather than linear across the continuum of amyloid burden (see Supplemental Figures 1 and 2).
Hierarchical clustering analyses
Finally, as an additional data driven analysis, hierarchical clustering analyses based on PC within the DMN for the delta identified two distinct subgroups: 47 individuals with high PC and 17 individuals with low PC (p < 0.001). Importantly, the high PC subgroup included the majority of Aβ+/progressors (12 out of 13) whereas the low PC subgroup consisted predominantly of Aβ-/controls individuals (12 out of 17). Notably, individuals in high PC group exhibited a significantly greater cognitive decline in FCSRT scores compared to those in low PC (p = 0.003). This analysis does not constitute an independent validation of the group classification but it provides converging evidence for interindividual variability in delta band structure-function coupling, suggesting that PC meaningfully distributes individuals along a continuum of network rigidity that aligns with both amyloid status and cognitive trajectory.
Overall, the results showed that a high similarity between the structure-function coupling in the delta band frequency whether assessed in the DMN or at the whole-brain level is associated with greater cognitive decline, especially those who subsequently progress to AD. These findings support the relevance of multiplex coupling as a potential marker of progression along AD continuum within amyloid positive group based solely on connectivity features (Figure 3).
Discussion
The main goal of our study was to examine the relationship between structural and functional connectivity and its association with the longitudinal cognitive trajectories of individuals with subjective cognitive complaints. Analyses were conducted using data from the INSIGHT-preAD cohort, which includes older individuals with subjective memory complaints at risk of developing AD. We assessed the multiplex network PC as a measure of the similarity between FC and SC. We generated the network's functional layer using the PLI derived from rsEEG, and the structural layer using FA from DWI data.
Our main finding was that amyloid positive individuals who progressed to prodromal AD exhibited significantly higher multiplex connectivity PC in the delta frequency band within the DMN compared to Aβ-/controls and Aβ+/stable individuals over the follow-up period. This increase in structure-function similarity in the DMN was associated with subsequent memory decline, as measured by the FCSRT performance. Notably, this effect within the DMN was driven primarily by the left dorsal PCC, which emerged as the only DMN regions with a significant association to episodic memory decline. In contrast, no significant differences in delta band FC as shown by the results of PLI alone were observed across groups. These results suggest that it is the coupling of structural-functional network rather than network synchrony alone that distinguishes amyloid positive individuals who progress to AD from those who remain stable and from amyloid negative controls. The lack of association between our multiplex results and the individual alpha peak frequency suggests that these findings are at least partially distinct from the overall oscillatory slowing reported with aging and dementia. 3
The delta frequency band has been linked to large scale neural synchronization across the cortex and global cortical excitability. 54 Previous studies have reported that increases in delta activity correlate with cognitive decline and early AD8,55 and that delta activity can reflect both compensatory, 56 and pathological processes depending on the disease stage.57,58 Notably, delta band FC has been shown to be more tightly constrained by underlying SC than higher frequency bands, 59 suggesting that structure-function in this band may be particularly sensitive to structural network changes. In our study, a higher PC in the delta band may be interpreted as suggesting a more constrained structure-function coupling, potentially reflecting reduced flexibility in functional network dynamics, associated with disease progression rather than successful compensation. This finding aligns with the broader literature on network flexibility in aging and AD. Network flexibility refers to the brain's capacity to reconfigure its functional connections in responses to cognitive demands.60,61 Previous studies have shown that this flexibility decreases with age and is associated with worse cognitive performance. 62 We propose that our delta band structure-function measure may capture a comparable phenomenon such as when FC patterns closely mirror the underlying structural scaffold, the brain has less flexibility to recruit alternative functional pathways. This interpretation however remains inferential as flexibility was not directly measured. Therefore, we consider increased structure-function as a potential marker of constrained network dynamics rather that direct evidence of network rigidity. The specificity of this effect to the delta band and the DMN rather than the whole brain, is consistent with evidence that structure-function coupling varies across frequency bands,63,64 and may constrain the diversity of functional states available to the brain. This emphasizes the importance of the delta band as an early marker of pathological changes, making it particularly relevant when examining the similarity between functional dynamics and underlying SC.
The DMN is particularly relevant as it encompasses regions implicated in early AD-related network disruptions, such as the precuneus and the PCC which are vulnerable to amyloid-β and tau pathology.8,9 The connectivity within the DMN changes with aging, and is further altered by AD progression, affects both the functional and structural levels.
65
In light of these findings, our study suggests that alterations in DMN especially in the delta band structure-function coupling of the PCC connectivity are associated with subsequent decline and AD progression at group level. Notably, among each DMN regions, only the left dorsal PCC showed a significant association with episodic memory decline. The PCC is a central hub of the DMN and is among the earliest sites of amyloid deposition.49,66 Its role in episodic memory consolidation, self-referential processing and conscious recollection makes it particularly vulnerable to early network disruption.67,68 The left lateralization of this effect is consistent with reports of asymmetric PCC involvement in early memory impairment,69,70 and with the established left-hemisphere dominance for verbal episodic memory71,72 given that the primary outcome measure (FCSRT total recall) involves verbal free recall. Our finding of increased structure-function similarity in the left dorsal PCC may therefore point to a potential early and memory-relevant alteration in the network architecture of Aβ+/progressors
Considering their roles in AD-related changes, additional control analyses were performed for the alpha band and the SN. 52 These analyses yielded no significant results, supporting the idea that structure-function association was specific to the delta band within the DMN. This highlights the unique role of delta band DMN coupling in characterizing network changes associated with AD progression. These results suggest that the pattern of structure-function similarity in the delta band within the DMN may index subsequent cognitive trajectories, rather than an age-related changes common to all participants.
In cognitively healthy older adults Jauny et al., 20 found that lower structure-function similarity particularly in the alpha band was associated with better cognitive performance, consistent with the hypothesis that preserved functional flexibility supports efficient neural communication. This lower coupling may reflect a beneficial decoupling of functional networks from their structural constraints, enabling dynamic and adaptive processing. In contrast, the elevated delta-band PC observed in Aβ+/progressors in the present study does not reflect a similar compensatory mechanism. Rather, FC in the delta band may appear to be overly constrained by white matter architecture, reducing the network's capacity for flexible recruitment of alternative pathways, a pattern that is associated with cognitive deterioration rather than protective against it. The absence of elevated delta PC in the Aβ+/stable compared to Aβ+/progressors is also interesting but was somehow expected because the Aβ+/progressors were older with more participants APOE ε4 allele carriers. 28 That means, the Aβ+/stable may still have efficient neurobiological resilience factors (e.g., cognitive reserve) that buffer against amyloid induced probable network rigidity. Their coupling pattern may reflect a dynamic equilibrium, meaning that amyloid may be present but not yet sufficient in regional distribution or cortical extent to constrain delta band structure-function coupling within the DMN. Another hypothesis is that these individuals may retain compensatory structural network plasticity that prevents the functional network from becoming constrained by the underlying structure. Our null results in the alpha band further support the specificity of this potentially constrained coupling pattern to the delta band in this population. This distinction reinforces the hypothesis that delta band structure-function coupling may capture network changes associated with disease progression in a population at risk of AD whereas alpha band structure function adjustments may reflect successful compensation in healthy aging.
Our study highlights the importance of a multimodal approach to distinguishing between healthy and pathological aging. Combining EEG and DWI to examine multiplayer brain networks provides valuable insight into early network level changes that precede clinical symptoms. The specificity of this approach to the DMN, which is associated with cognition, may point to a core vulnerability pathway associated with AD progression within amyloid positive people. The present findings might be considered as a potential marker of progression to prodromal AD along AD continuum. In fact, the PC may appear as an index of AD stage differences within the amyloid positive group, between those who progress and those who remain stable.65,73
Additionally, our results demonstrated that Aβ+/progressors, those with the highest structure-function similarity exhibited the strongest episodic memory decline, particularly with regard to consolidation when structure-function similarity is high, in both the DMN and the global brain. The FCSRT is a widely used tool for accessing episodic memory in AD research, 30 and deficits in episodic memory are among the earliest cognitive impairments. 66 The observed group-level differences and longitudinal correlations with cognitive decline highlight an important potential network-level mechanism that is associated with pathological aging. This was further supported by additional hierarchical clustering analyses. In fact, the individuals with both high delta band PC within the DMN and amyloid pathology clustered together and showed the greatest memory decline over time. These findings provide converging evidence that the PC could probably capture meaningful interindividual variability in structure-function coupling during pathological aging rather than an independent predictive. Notably, only the FCSRT exhibited significant associations with structure-function relationship after FDR correction across numerous neuropsychological measures. While a significant partial correlation was observed across all participants, this effect was not present within individual group. The null correlation primarily may reflect differences between progressors and controls rather than indicating a predictive relationship at the individual level, but also might be due to insufficient statistical power. Despite the overlap in group variance in the results, our findings highlight a clear link between alterations in network structure-function coupling and longitudinal memory outcome. However, it should be interpreted with caution given the multiple comparisons performed and the probability of at least one false positive discovery. This information is invaluable for guiding future clinical research and therapeutic development. This nuanced interpretation emphasizes the translational relevance of network-based biomarkers, which could capture the complex progression of AD in a way that isolated cognitive testing would reveal.
Our study has several strengths, including a multimodal investigation of brain networks associated with longitudinal clinical follow-up, which provides valuable insights into AD-related changes.8,12 The present work focused on the delta and the DMN mainly as they have been documented in early stages of AD. To confirm the specificity of our findings for the delta DMN coupling, we conducted analyses in alpha band and other networks. To ensure the robustness of our findings, we assessed the internal replicability of our findings by analyzing the second rsEEG recording obtained 25 min after the initial session 53 ; results were consistent, confirming higher PC in the delta band among Aβ+/progressors compared to Aβ-/controls. To avoid redundancy with structural indices, the study did not include FDG-PET imaging analyses. The decision to conduct analyses using the PLI alone and the combined EEG-DWI multilayer networks was made for both conceptual and methodological reasons. Firstly, the FC disruptions may arise before degeneration of white matter tract is apparent on DWI. Secondly, the DWI offers important insights into SC. For these reasons, the analyses focus on the functional and structural layers in a multiplex connectome approach to evaluate the added value of structure-function coupling rather than on structural metrics alone. However, our study also has limitations. Data were collected in a clinical setting without a Faraday cage to minimize noise. The sample size, particularly for the Aβ+/progressors limits statistical power, but the key results were replicated across recordings and showed minimal overlap between group (DMN delta, Figure 3B). The use of variation rates rather than linear mixed-effects models or latent growth curve models is a limitation and should be apply in future studies. Furthermore, multilayer analyses adjust for the density of the structural layer, which may limit the number of associations considered and focuses on direct connectivity between brain regions. While the amyloid positivity threshold (SUVR > 0.79) was defined according to the INSIGHT-preAD protocol, 29 we acknowledge that other studies have applied slightly different cut-offs. We acknowledge that binarization of the SC matrix discards information about connection strength which may limit sensitivity to grade differences in white matter integrity and a fixed node correspondence across layers (e.g., multiplex framework) may not perfectly capture interindividual variability in the spatial alignment between DWI tractography and EEG source reconstruction. APOE ε4 status and continuous amyloid burden measures could modulates network organization and will be integrated in future analyses for futures papers. Even though we focused our analyses within the networks and frequency bands mainly documented in AD (i.e., DMN, SN, delta, alpha), analyses in other frequency bands (theta, beta, gamma) and networks (attention) would be valuable to delimit whether the observed patterns of structure-function coupling are observed beyond the DMN. Taken together, these findings support the idea that informative and clinically relevant differences can emerge within this subgroup, even in the context of limited sample sizes. Our present results, particularly those involving correlations with cognitive performance and internal replication, are consistent with this line of evidence.
In summary, previous studies have explored the relationship between structural and functional connectivity, demonstrating that although there is a general correspondence between the two modalities, this relationship is regionally variable and modulated by age, cognitive function and pathology. While these studies typically assessed structure-function relationship using correlational approaches or predictive models, the multilayer network framework can directly quantify structure-function similarity using the PC. Crucially, we identify high structure-function similarity in the delta band, specifically within the DMN as strongly associated with subsequent cognitive decline across five years. This approach enables a finer assessment of how individual brain regions simultaneously contribute to both structural and functional networks. Furthermore, by linking these multilayer metrics to longitudinal cognitive trajectories, our study sheds new light on how network-specific structure-function patterns, particularly in the delta band within the DMN, might signal disease stage differences along AD continuum.
Supplemental Material
sj-docx-1-alz-10.1177_13872877261464453 - Supplemental material for Multilayer brain connectivity and long-term cognitive changes in individuals at risk for Alzheimer's disease
Supplemental material, sj-docx-1-alz-10.1177_13872877261464453 for Multilayer brain connectivity and long-term cognitive changes in individuals at risk for Alzheimer's disease by Rebecca Kpetou, Filipa Raposo Pereira, Shailendra Segobin, Valentina La Corte, Nicolas Villain, Mathilde Groussard, Gwendolyn Jauny, Hervé Platel, Thomas Hinault and in Journal of Alzheimer's Disease
Footnotes
Acknowledgements
We sincerely thank all the actors and staff at the Institut du Cerveau (ICM), at the Institute of memory and Alzheimer's disease (IM2A) who collected all the data from the 318 INSIGHT preAD participants and shared them with us as well as the 318 participants. We would like to thank Nathalie George for her insights and guide during our monthly meetings. We also thank Marion Houot for her availability and time during our exchanges.
Ethical considerations
The study was conducted in accordance with the Declaration of Helsinki. The study was approved by the ethics review board of the Pitié-Salpêtrière Hospital (IDRCB: 2012-A01731-42) and the INSIGHT-preAD Scientific Committee.
Consent to participate
All participants provided written informed consent prior to participation
Consent for publication
Not applicable
Author contribution(s)
Funding
The authors disclosed receipt of the following financial support for the research, authorship, and/or publication of this article: This work was supported by INSERM in collaboration with ICM, Instituts Hospitalo-Universitaires à ICM, and Pfizer and has received support within the “Investissement d'Avenir” (grant numbers ANR-10-AIHU-06 and ANR-19-P3IA-0001) programs. The study was promoted in collaboration with the “CHU de Bordeaux” (coordination CIC EC7), the promoter of Memento cohort, funded by the Foundation Plan-Alzheimer. The study was further supported by AVID/Lilly. The funding sources had no role in the study design, data collection, data analysis, or data interpretation. The first author MsC Rebecca Kpetou has received funds from the “Fondation Alzheimer” and the Normandy Region.
Declaration of conflicting interests
The authors declared no potential conflicts of interest with respect to the research, authorship, and/or publication of this article.
Data availability statement
Data will be made available on reasonable request.
Supplemental material
Supplemental material for this article is available online.
References
Supplementary Material
Please find the following supplemental material available below.
For Open Access articles published under a Creative Commons License, all supplemental material carries the same license as the article it is associated with.
For non-Open Access articles published, all supplemental material carries a non-exclusive license, and permission requests for re-use of supplemental material or any part of supplemental material shall be sent directly to the copyright owner as specified in the copyright notice associated with the article.