






Abstract
Background
Across the Alzheimer's disease spectrum (ADS), spanning subjective cognitive decline (SCD), mild cognitive impairment (MCI), and Alzheimer's disease (AD) dementia, the interplay between alterations in diffusion tensor imaging (DTI) analysis along the perivascular space (ALPS), brain functional connectivity, and cognitive impairment (CI) remains poorly understood.
Objective
To evaluate DTI-ALPS index and brain network across clinical stages of ADS and assess whether brain network disruptions mediates the association between DTI-ALPS index and CI.
Methods
A total of 188 ADS patients and 77 healthy controls (HC) were recruited. The DTI-ALPS index, dynamic functional connectivity (dFC) and network topology were estimated from MRI. Group differences were assessed using analysis of covariance. Mediation analyses examined whether disruptions in dFC or topology mediated the association between the DTI-ALPS index and CI.
Results
Compared with HC, SCD patients showed significantly reduced ALPS index in the left hemisphere, whereas MCI and AD patients showed significantly reduced ALPS index in both hemispheres. While topology showed no significant differences across ADS, dFC analysis revealed stage-specific alterations, with abnormalities in higher-order cognitive systems in the early stage and in primary processing systems in later stages. Mediation analysis indicated that dFC disruption, but not topology abnormalities, mediated the association between reduced DTI-ALPS index and CI in ADS patients.
Conclusions
Decreased DTI-ALPS index and abnormalities in higher-order cognitive systems emerged as early as the SCD stage and exhibited stage-dependent differences across disease severity. Importantly, dFC disruption mediated the association between reduced DTI-ALPS index and CI, suggesting a potential underlying pathological mechanism.
Keywords
Introduction
Alzheimer's disease (AD) is a neurodegenerative disorder primarily characterized by progressive cognitive impairment (CI) and represents the most prevalent form of dementia in the elderly population. 1 Its core pathological features include the deposition of amyloid-β (Aβ) plaques and the formation of neurofibrillary tangles resulting from the abnormal aggregation of tau protein. 1 According to the 2018 criteria established by the National Institute on Aging and the Alzheimer's Association (NIA-AA), the Alzheimer's disease spectrum (ADS) encompasses a continuum of clinical stages ranging from the preclinical phase to severe dementia. 2 This disease spectrum commences with subjective cognitive decline (SCD), may subsequently progress to mild cognitive impairment (MCI), and ultimately evolves into AD dementia. 3
Diffusion tensor imaging (DTI) analysis along the perivascular space (ALPS) was originally proposed to assess diffusion properties along the perivascular space, and has since emerged as a popular MRI method to evaluate glymphatic function. 4 However, it is difficult to sperate the microstructural effects from glymphatic flow directly using in vivo MRI. Based on recent evidence, DTI-ALPS should not be interpreted as a direct measure of glymphatic function; rather, it is more appropriately regarded as an imaging measure of microstructure properties.5,6 Nevertheless, prior research has indicated that reduced DTI-ALPS index, is detectable as early as the stage of SCD. 7 Huang et al. 8 also demonstrated that a lower ALPS index in AD patients correlates with greater CI during follow-up and may precede Aβ deposition. Hsu et al. 9 further revealed a positive correlation between the ALPS index and cognitive function, identifying its mediating effect between Aβ/tau protein deposition and CI. Moreover, previous study has reported that ALPS index demonstrates excellent classification performance for SCD and normal controls across both East Asian and Western populations. 7 Taken together, these findings indicated that, although not a direct measure of glymphatic system, ALPS index may still serve as an early imaging marker and an indirect biomarker of glymphatic dysfunction associated with ADS.
In recent years, functional connectivity (FC) revealed by resting-state functional magnetic resonance imaging (MRI) has demonstrated significant potential in predicting the current disease progression and future evolution of AD. 10 However, traditional static FC (sFC) analysis treats the entire scanning period as a single unit, overlooking the dynamic changes over time, which may obscure critical neuroregulatory information. In contrast, dynamic FC (dFC) examines changes in connectivity patterns between brain regions within short-time windows of time-series data, allowing for a more precise characterization of the time-varying features of functional connectivity. 11 Across different stages of the ADS, abnormalities in dFC exhibited stage-specific characteristics. In individuals with SCD, 12 increased variability in dFC between the anterior hippocampus and the caudate nucleus was negatively correlated with CI. At the stage of MCI, elevated dynamic variability in intrinsic neural activity was observed across multiple brain regions, 13 accompanied by a reduction in coordination between different brain activity indicators. In AD, Zhao et al. 14 observed a widespread reduction in temporal variability across multiple systems, including the sensorimotor network (SMN), control network, default mode network (DMN), and visual network (VN). Longitudinal studies further revealed dynamic changes throughout the entire ADS, such as strengthening intra-connectivity within the middle frontal gyrus and weakening connectivity in the inferior parietal lobule, 15 both of which were significantly associated with CI.
Despite growing evidence of the association between altered brain network dynamics and CI, the relationships among the DTI-ALPS index, CI and disrupted brain network connectivity in ADS remains unclear. Song et al. 16 demonstrated that the ALPS index correlates with topological metrics such as network efficiency, suggesting that efficient information transfer in brain networks relies on the structural integrity of white matter tracts. Damage to white matter microstructure can lead to disruption of FC within these networks. Notably, oligodendrocytes, which form the myelin sheath of the central nervous system and wrap around neuronal axons, are particularly sensitive to the accumulation of metabolic waste. 17 Consequently, impaired cerebrospinal fluid clearance can directly damage oligodendrocytes, leading to demyelination, 18 which in turn disrupts the efficiency of information transfer in brain networks. A recent study by Xiong et al. 19 on patients with obstructive sleep apnea hypopnea syndrome further suggested that the decrease in the DTI-ALPS index may influence cognitive function through modulation of dFC. Furthermore, research by Boot et al. 20 indicated that CI associated with cerebral small vessel disease (CSVD) may be mediated by a decline in global efficiency (Eg). However, within the entire ADS, the specific pathway linking the DTI-ALPS index to CI remains underexplored. It remains unclear whether dFC or brain network topology play a mediating role between the DTI-ALPS index and CI.
This study aimed to elucidate the relationships among the DTI-ALPS index, disruptions in brain network connectivity, and CI across the ADS. We utilized mediation analysis to determine whether this effect is predominantly mediated by alterations in dFC or by disruptions in brain network topology. Understanding these interrelationships may help us to identify potential underlying pathological mechanisms of ADS.
Methods
The study protocol received approval from the Tongji Hospital, Tongji Medical College, Huazhong University of Science and Technology Ethics Committee (TJ-IRB202401097) in accordance with the Declaration of Helsinki. Written informed consent was obtained from all participants.
Participants
Demographic characteristics, including age, sex, educational background, hypertension and diabetes status, and history of neurological disorders, were collected from all participants. Each individual completed standardized neuropsychological assessments administered by memory specialists, comprising the Mini-Mental State Examination (MMSE), the clock drawing test (CDT), Trail Making Test Parts A (TMT-A) and B (TMT-B).
Participants were classified into four groups: healthy controls (HC, n = 77), SCD (n = 96), MCI (n = 60) and AD (n = 32). HC participants exhibited no cognitive deficits or clinical abnormalities. SCD diagnoses adhered to the Jessen et al. (2014) SCD-plus clinical framework 3 ; MCI cases were identified using Petersen's 2004 criteria 21 ; AD classification followed the “probable AD” standards from the 2011 National Institute on Aging-Alzheimer's Association (NIA-AA) guidelines. 22 Exclusion criteria comprised: (1) other neurodegenerative dementias (e.g., vascular, Lewy body, or frontotemporal dementia); (2) medication- or psychiatric disorder-induced cognitive impairment; (3) major DSM-5-diagnosed psychiatric conditions (including major depressive disorder and schizophrenia). All participants were right-handed.
MRI acquisition
Resting-state functional MRI (rs-fMRI), DTI and structural MRI were performed using a 3.0-Tesla MRI scanner (Discovery 750, GE Healthcare, Chicago, IL, USA). The subject was positioned in a standard supine position, with the scanning range extending from the top of the head to the base of the skull. During rs-fMRI scanning, all participants were instructed to remain awake without engaging in any specific thoughts.
We acquired rs-fMRI data using a gradient-echo echo-planar imaging (EPI) sequence. The parameters were as follows: repetition time (TR)/echo time (TE) = 2000/30 ms, matrix size 64 × 64, field of view (FOV) 220 × 220 mm, slice thickness 3 mm, flip angle 90°, with 36 continuous axial slices and 185 time points collected.
DTI data were also collected using an EPI sequence with the following parameters: TR/TE = 6000/63.2 ms, b-value = 0 and 1000 s/mm2, number of diffusion directions = 64, FOV = 256 × 256 mm, matrix size = 256 × 128, number of slices = 50, slice thickness = 3 mm.
Structural MRI was performed using a three-dimensional (3D) T1 Brain Volume (BRAVO) sequence with the following parameters: TR/TE = 7.1/2.7 ms, FOV = 256 × 256 mm, acquisition matrix = 256 × 256, number of excitations (NEX) = 1, slice thickness = 1 mm.
Post processing of MRI data
DTI-ALPS index processing
DTI data processing began with conversion of raw DICOM files into NIFTI format using the MRIcroGL graphical user interface. Next, an automated analysis pipeline based on FSL and MRtrix3 was used to calculate the ALPS index. 23 The key steps in this process include: generating diffusion metrics, such as color-coded fractional anisotropy (FA) maps and diffusion rate maps, followed by spatial normalization of the FA map to the JHU-ICBM standard FA template. Diffusion rate maps were aligned using the resulting transformation matrix, and the superior corona radiata (SCR) and superior longitudinal fasciculus (SLF) fiber tracts were identified using the JHU-ICBM-DTI-81 white matter atlas.
Spherical regions of interest (ROIs) with a 5 mm diameter were placed bilaterally in the body of the lateral ventricles at the level of SCR/SLF. From these ROIs, the mean diffusion rates along the x and y axes for projection fibers (Dxproj and Dyproj) and along the x and z axes for association fibers (Dxassoc and Dzassoc) were extracted.
4
Finally, the ALPS index was calculated using the following formula:

Resting-state functional MRI data preprocessing
Functional imaging data were preprocessed and analyzed using CONN v22 software, following its standard pipeline. 24 The first 5 time points were discarded to allow for magnetic field stabilization, resulting in 180 time points retained for subsequent analysis. Preprocessing steps comprised slice timing correction, motion correction, normalization, and spatial smoothing. Specifically, these procedures included: (1) 12 motion regressors (three translational and three rotational parameters, along with their first-order temporal derivatives) for head motion regression; (2) identified outlier time points via a scrubbing procedure, where motion censoring was applied based on a framewise displacement (FD) threshold of 0.9 mm and a threshold of 5 standard deviations for global BOLD signal changes 24 ; and (3) the WM and CSF signals were accounted for physiological noise. The mean FD across all participants was 0.137 mm ± 0.062 mm, and the average proportion of scrubbed volumes was 3.238% ± 4.234%. Functional images were co-registered to the corresponding 3D-T1 BRAVO structural images, which were spatially normalized to Montreal Neurological Institute (MNI) space and segmented into gray matter (GM), white matter (WM), and cerebrospinal fluid (CSF). A 6 mm full-width at half-maximum (FWHM) Gaussian kernel was used for spatial smoothing. Finally, denoising was performed by incorporating multiple types of confounding regressors in a linear regression framework, combined with temporal band-pass filtering (0.01–0.1 Hz).
Dynamic independent component analysis
The cleaned BOLD time series were subsequently used for Dynamic Independent Component Analysis (Dyn-ICA), which was employed to extract time components using CONN v22 software. 24 ROIs were defined according to the default network atlas implemented in CONN, which comprises 32 ROIs grouped into eight functional networks. After excluding the two cerebellar ROIs, 30 ROIs from both hemispheres belonging to seven major functional networks were retained for further analyses. These seven networks included the Language Network (LN), Salience Network (SN), Dorsal Attention Network (DAN), Frontal-Parietal Network (FPN), VN, DMN, and SMN.25,26 Previous research has shown that window lengths ranging from 30 to 60 s can successfully capture fluctuations in dFC. 27 In the present study, a temporal modulation kernel width of 30 s was used as input, analogous to the window length in the sliding-window approach, to constrain the estimated temporal modulation factors to the desired low-frequency range. The number of factors was set to 12, indicating that 12 distinct dynamic connectivity states (or modulatory circuits) were estimated across the group. This is consistent with recent empirical precedents investigating large-scale cognitive network dynamics. 28
Dyn-ICA matrices including frequency and variability were then evaluated for each factor in each subject. Frequency identifies the recurrence of modulatory circuits, while variability accounts for the standard deviation in bivariate, multivariate, or semipartial correlation or regression measures between two ROIs, computed using weighted Least Squares (WLS) within a discrete set of temporal sliding windows. Between-group differences in individual-level frequency and variability metrics were tested using a General Linear Model (GLM), with covariates including age, sex, years of education, and hypertension. Statistical significance was thresholded at False Discovery Rate (FDR)-corrected p < 0.05.
Graph theory analysis
The topological properties of brain networks were analyzed using the GRETNA toolbox (https://github.com/sandywang/GRETNA). To minimize the influence of spurious correlations on topological architecture, we constructed binary undirected networks by thresholding the functional connectivity matrices over a predefined sparsity range (0.10 ≤ S ≤ 0.50, step = 0.05). Within this range, we first verified whether the networks exhibited typical “small-world” properties, defined by a normalized clustering coefficient γ > 1 and a normalized characteristic path length λ≈1, which yields a small-worldness scalar of σ = γ/λ>1. Subsequently, we systematically evaluated the network topology across two dimensions: (1) Global network metrics, including global efficiency (Eg) and local efficiency (Eloc); and (2) Nodal metrics, specifically clustering coefficient (CC), and betweenness centrality (BC), which served as key indicators for assessing regional functional importance. Between-group comparisons were conducted using a GLM, adjusting for age, sex, years of education, and hypertension. Statistical significance for global network metrics was set at p < 0.05, whereas for nodal metrics, FDR-corrected threshold of p < 0.05 was applied.
Statistical analyses
Demographic data were analyzed using SPSS 25.0 software (IBM Corporation, Armonk, NY, USA). The normality of the data was assessed with the Shapiro-Wilk test, and homogeneity of variance was evaluated using Levene's test. Since the continuous variables (age, education, MMSE, CDT, TMT-A, TMT-B) did not meet the normality assumption, the Kruskal-Wallis test was employed for all continuous variables in this study, instead of one-way analysis of variance (ANOVA). Categorical variables (sex, hypertension, diabetes) were compared using the Chi-square test. Group differences in the ALPS index were assessed using a GLM with age, sex, hypertension, diabetes and years of education as covariates, with statistical significance determined by FDR correction at p < 0.05.
Partial correlation analysis (controlling for age, sex, years of education, hypertension, diabetes, as well as each participant's FD and scrubbed volume proportion) was used to explore the correlations between DTI-ALPS, cognitive scores and functional metrics, followed by a mediation analysis to determine whether dFC or topological properties serve as a mediator in the relationship between the DTI-ALPS and CI, which was conducted using the “mediation” R package. In the mediation models, age, sex, hypertension, diabetes, years of education, and each participant's FD and scrubbed volume proportion were included as covariates. A bootstrapping approach was utilized to evaluate the significance of the mediation effects. The 95% confidence interval for the indirect effects were calculated based on 5000 bias-corrected bootstrap samples. The mediation effect was considered statistically significant if the 95% confidence interval did not include zero. Statistical significance determined by FDR correction at p < 0.05. Figure 1 outlines the work design and the overall analytical approach.
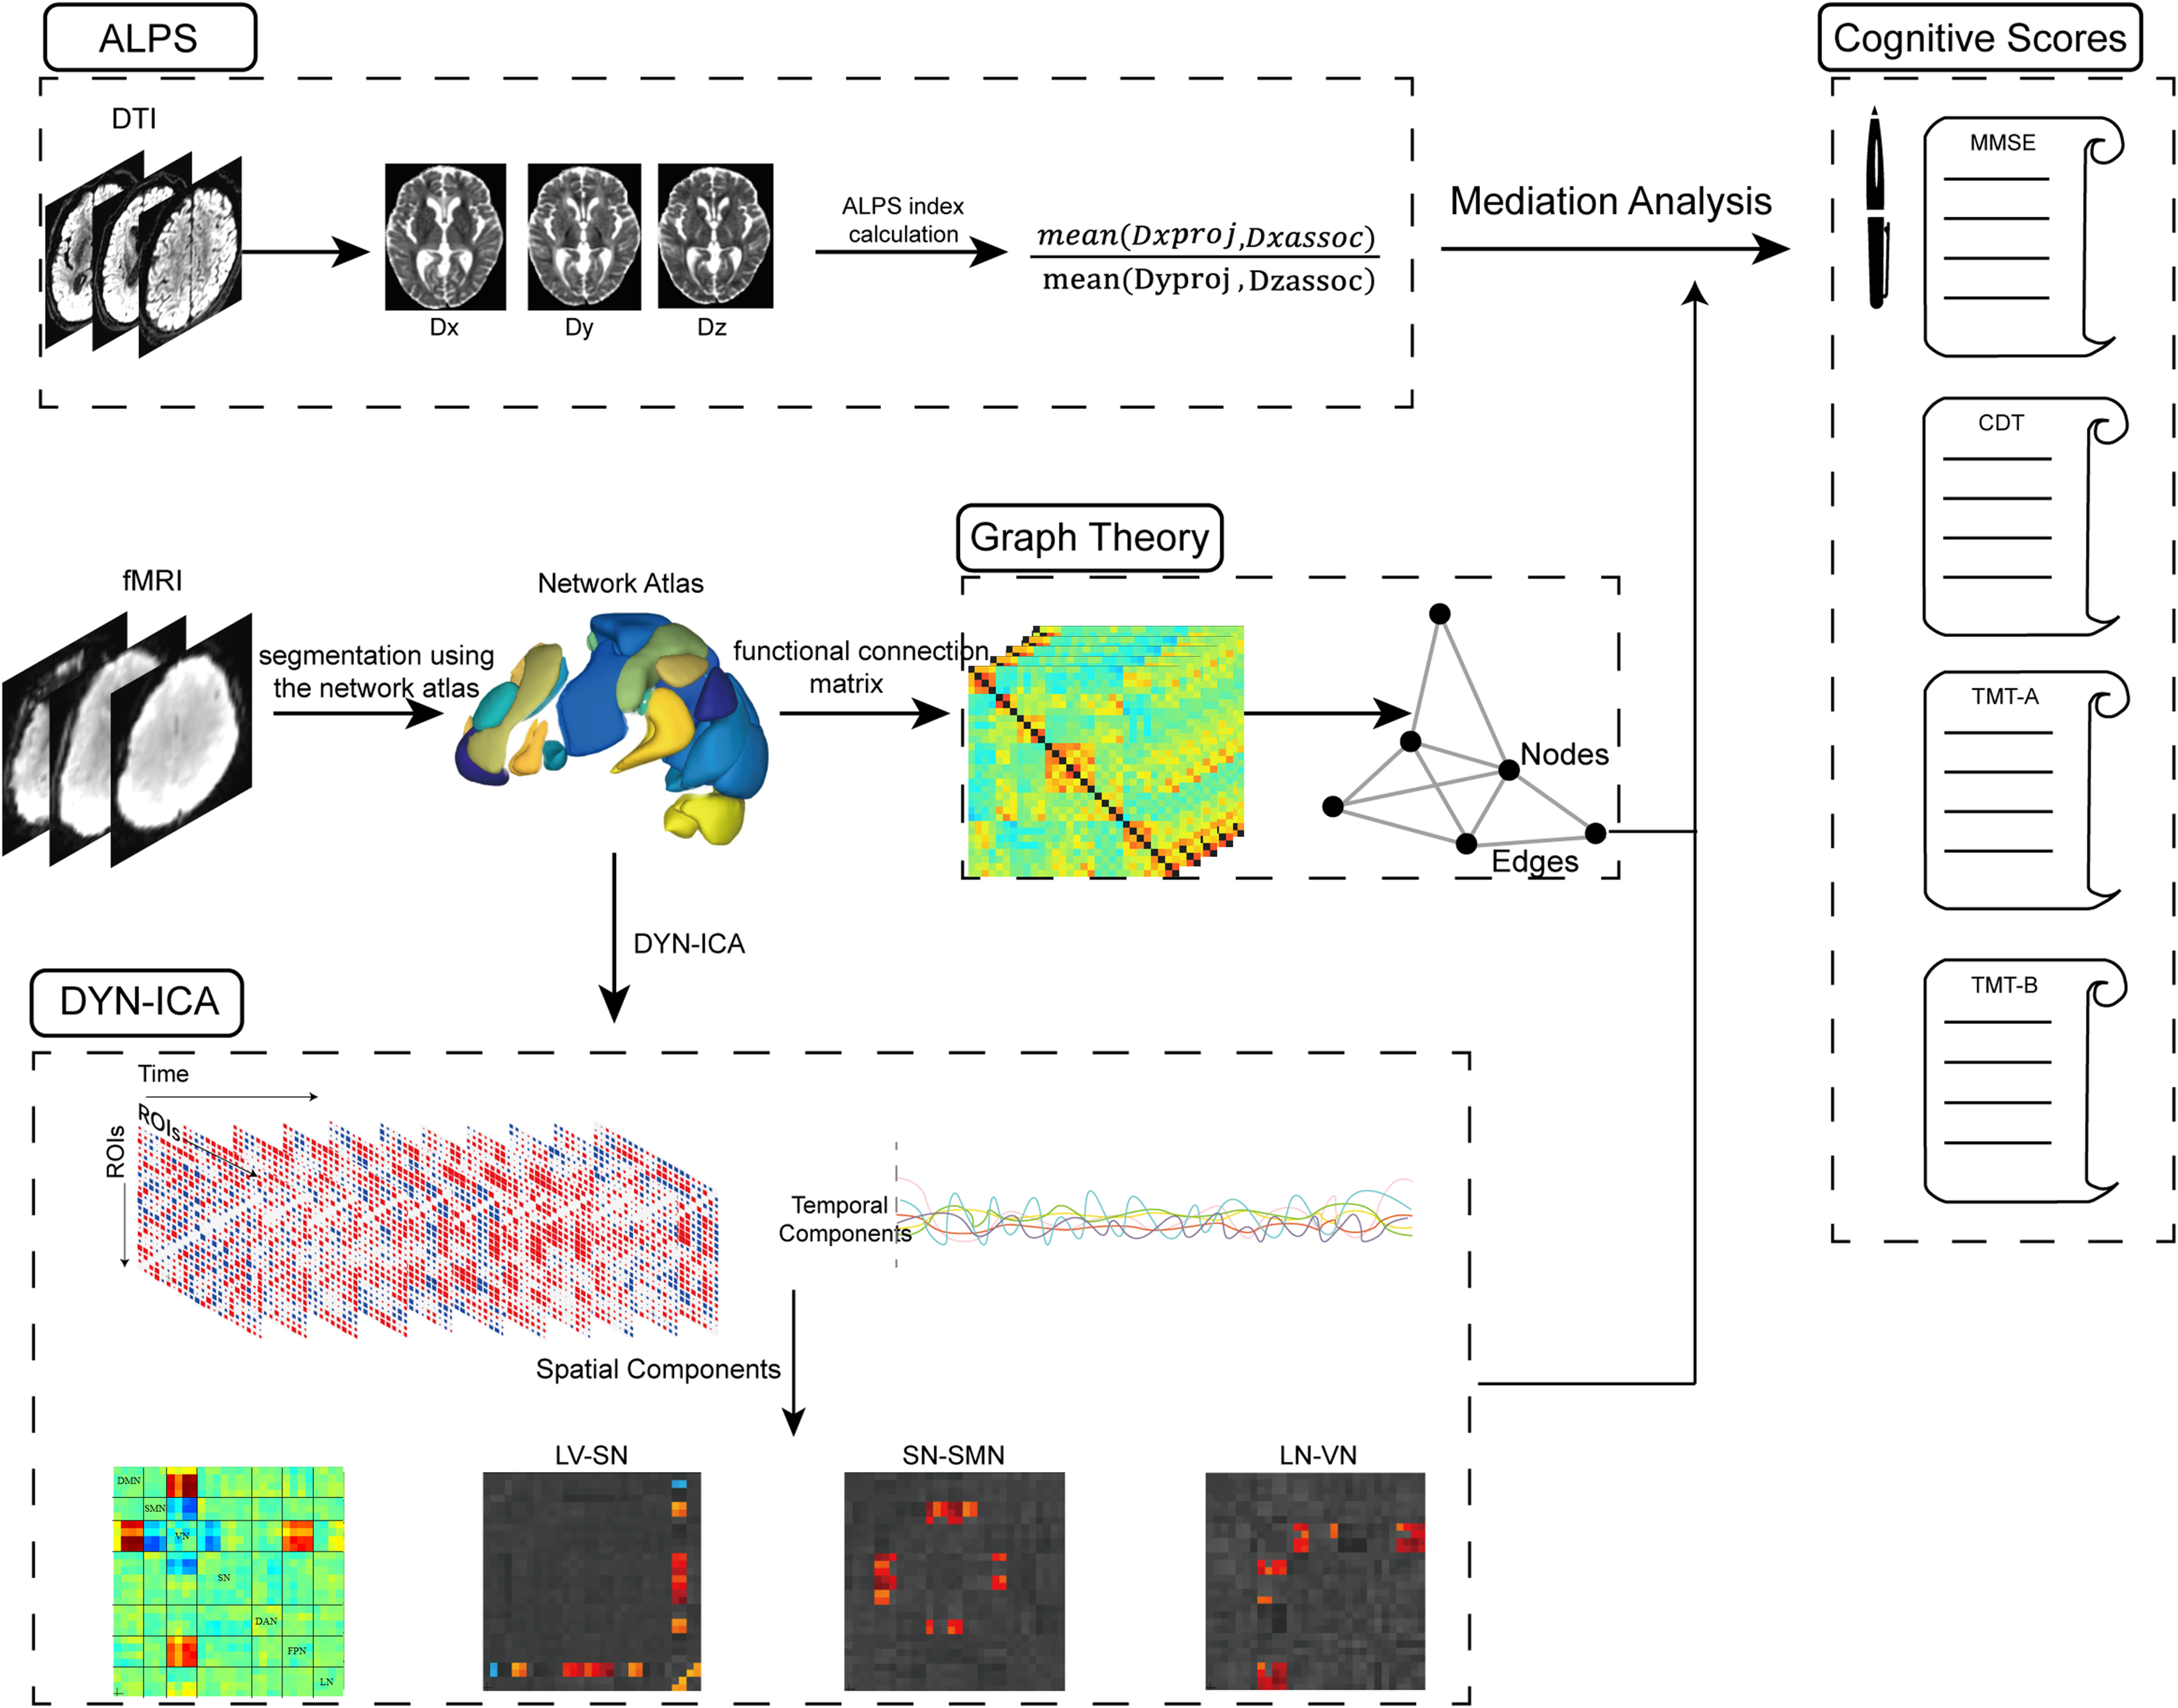
Study design and analytical workflow. First, DTI images were processed using an automated pipeline based on FSL and MRtrix3 to calculate the ALPS index. Subsequently, resting-state fMRI data were analyzed using DYN-ICA and graph theory based on the default Network atlas implemented in CONN software. Finally, mediation analysis was conducted to determine whether dFC or disruptions in brain network topology mediates the association between ALPS index and cognition. Notes: DTI, Diffusion tensor imaging; ALPS, Analysis Along the Perivascular Space; fMRI, functional magnetic resonance imaging; DYN-ICA, dynamic independent component analysis; SN, Salience Network; VN, Visual Network; LN, Language Network; SMN, sensorimotor cortex; DAN, Dorsal Attention Network; DMN, Default Mode Network; FPN, Frontoparietal network; MMSE, Mini-Mental State Examination; CDT, clock drawing test; TMT-A, Trail Making Test Parts A; TMT-B, Trail Making Test Parts B.
Results
Demographic characteristics
Demographic and neuropsychological characteristics of the HC, SCD, MCI, and AD groups are summarized in Table 1. The median age (P25, P75) for the HC, SCD, MCI, and AD groups were 66.0 (62.8, 69.5), 67.0 (63.0, 70.0), 66.0 (62.0, 72. 8), and 66.5 (63.0, 69.3) years, respectively. The median years of education were 12.0 (10.8, 15.3), 15.0 (12.0, 16.0), 12.0 (9.0, 12.0), and 12.0 (9.8, 14.3) years, respectively. In terms of sex composition, the male-to-female ratios were 50:27 in the HC group, 29:67 in the SCD group, 27:33 in the MCI group, and 19:13 in the AD group. No significant differences were observed among the four groups in age or diabetes prevalence (p > 0.05). However, statistically significant differences were found in hypertension prevalence (p = 0.001), sex distribution (p < 0.001), and education level (p < 0.001). All administered neuropsychological assessments, including the MMSE, CDT, TMT-A, and TMT-B, showed significant intergroup differences (all p < 0.001).
Demographic and behavioral characteristics of the participants.
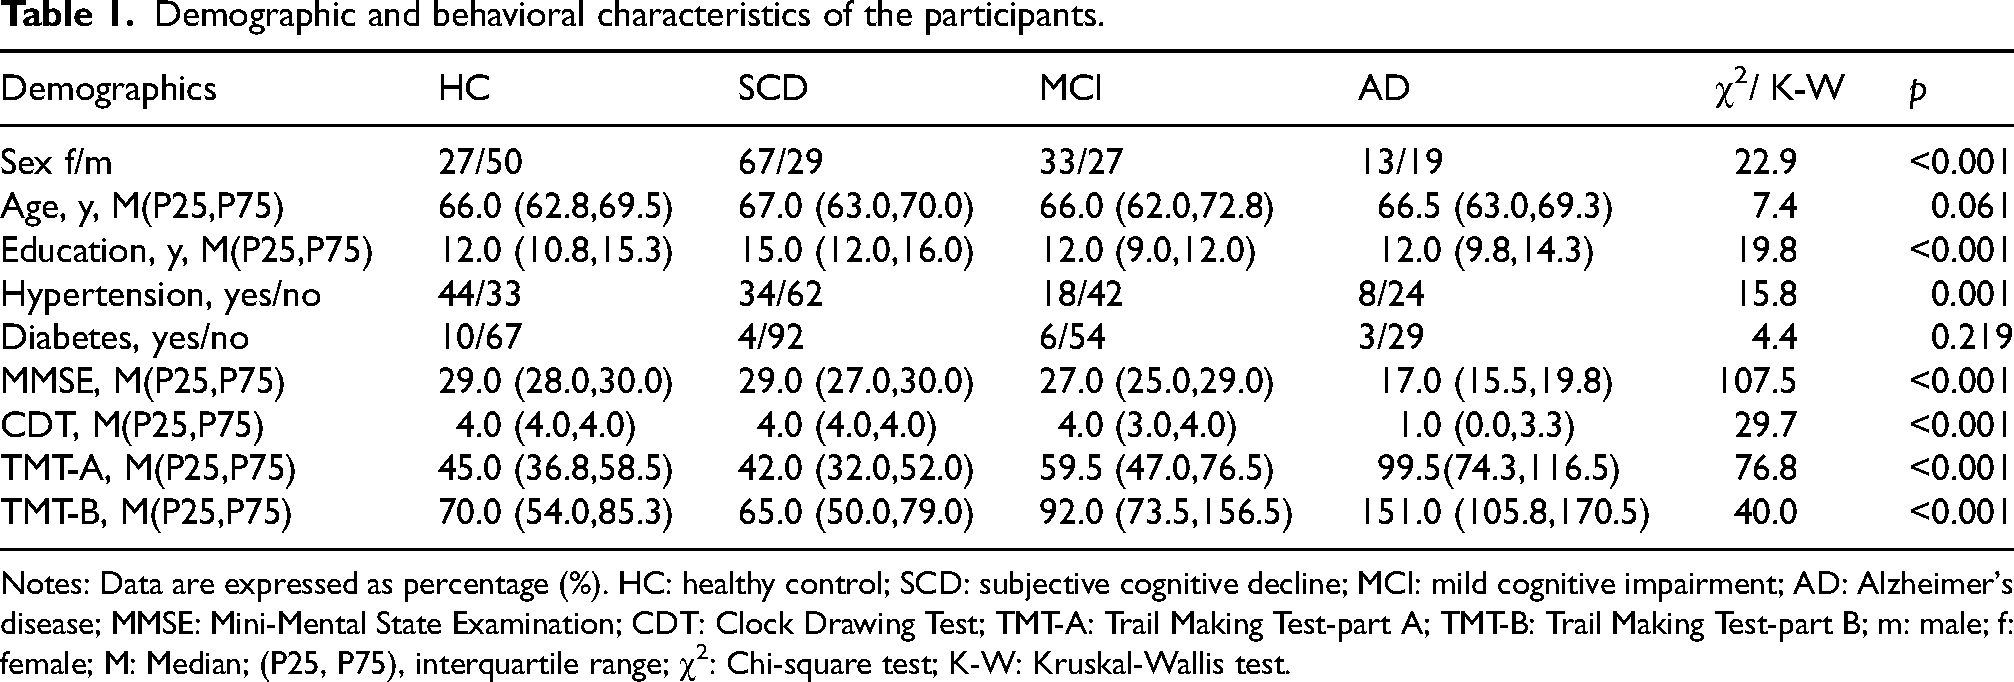
Notes: Data are expressed as percentage (%). HC: healthy control; SCD: subjective cognitive decline; MCI: mild cognitive impairment; AD: Alzheimer's disease; MMSE: Mini-Mental State Examination; CDT: Clock Drawing Test; TMT-A: Trail Making Test-part A; TMT-B: Trail Making Test-part B; m: male; f: female; M: Median; (P25, P75), interquartile range; χ2: Chi-square test; K-W: Kruskal-Wallis test.
Group comparisons of ALPS-index
Compared with the HC group, SCD patients demonstrated a significantly reduced DTI-ALPS index in the left hemisphere (β = 0.178, PFDR = 0.03), while MCI (left: β = 0.222, PFDR = 0.017; right: β = 0.190, PFDR = 0.033) and AD patients (left: β = 0.274, PFDR = 0.009; right: β = 0.288, PFDR = 0.006) exhibited significantly reduced ALPS-index values in both cerebral hemispheres (Figure 2).
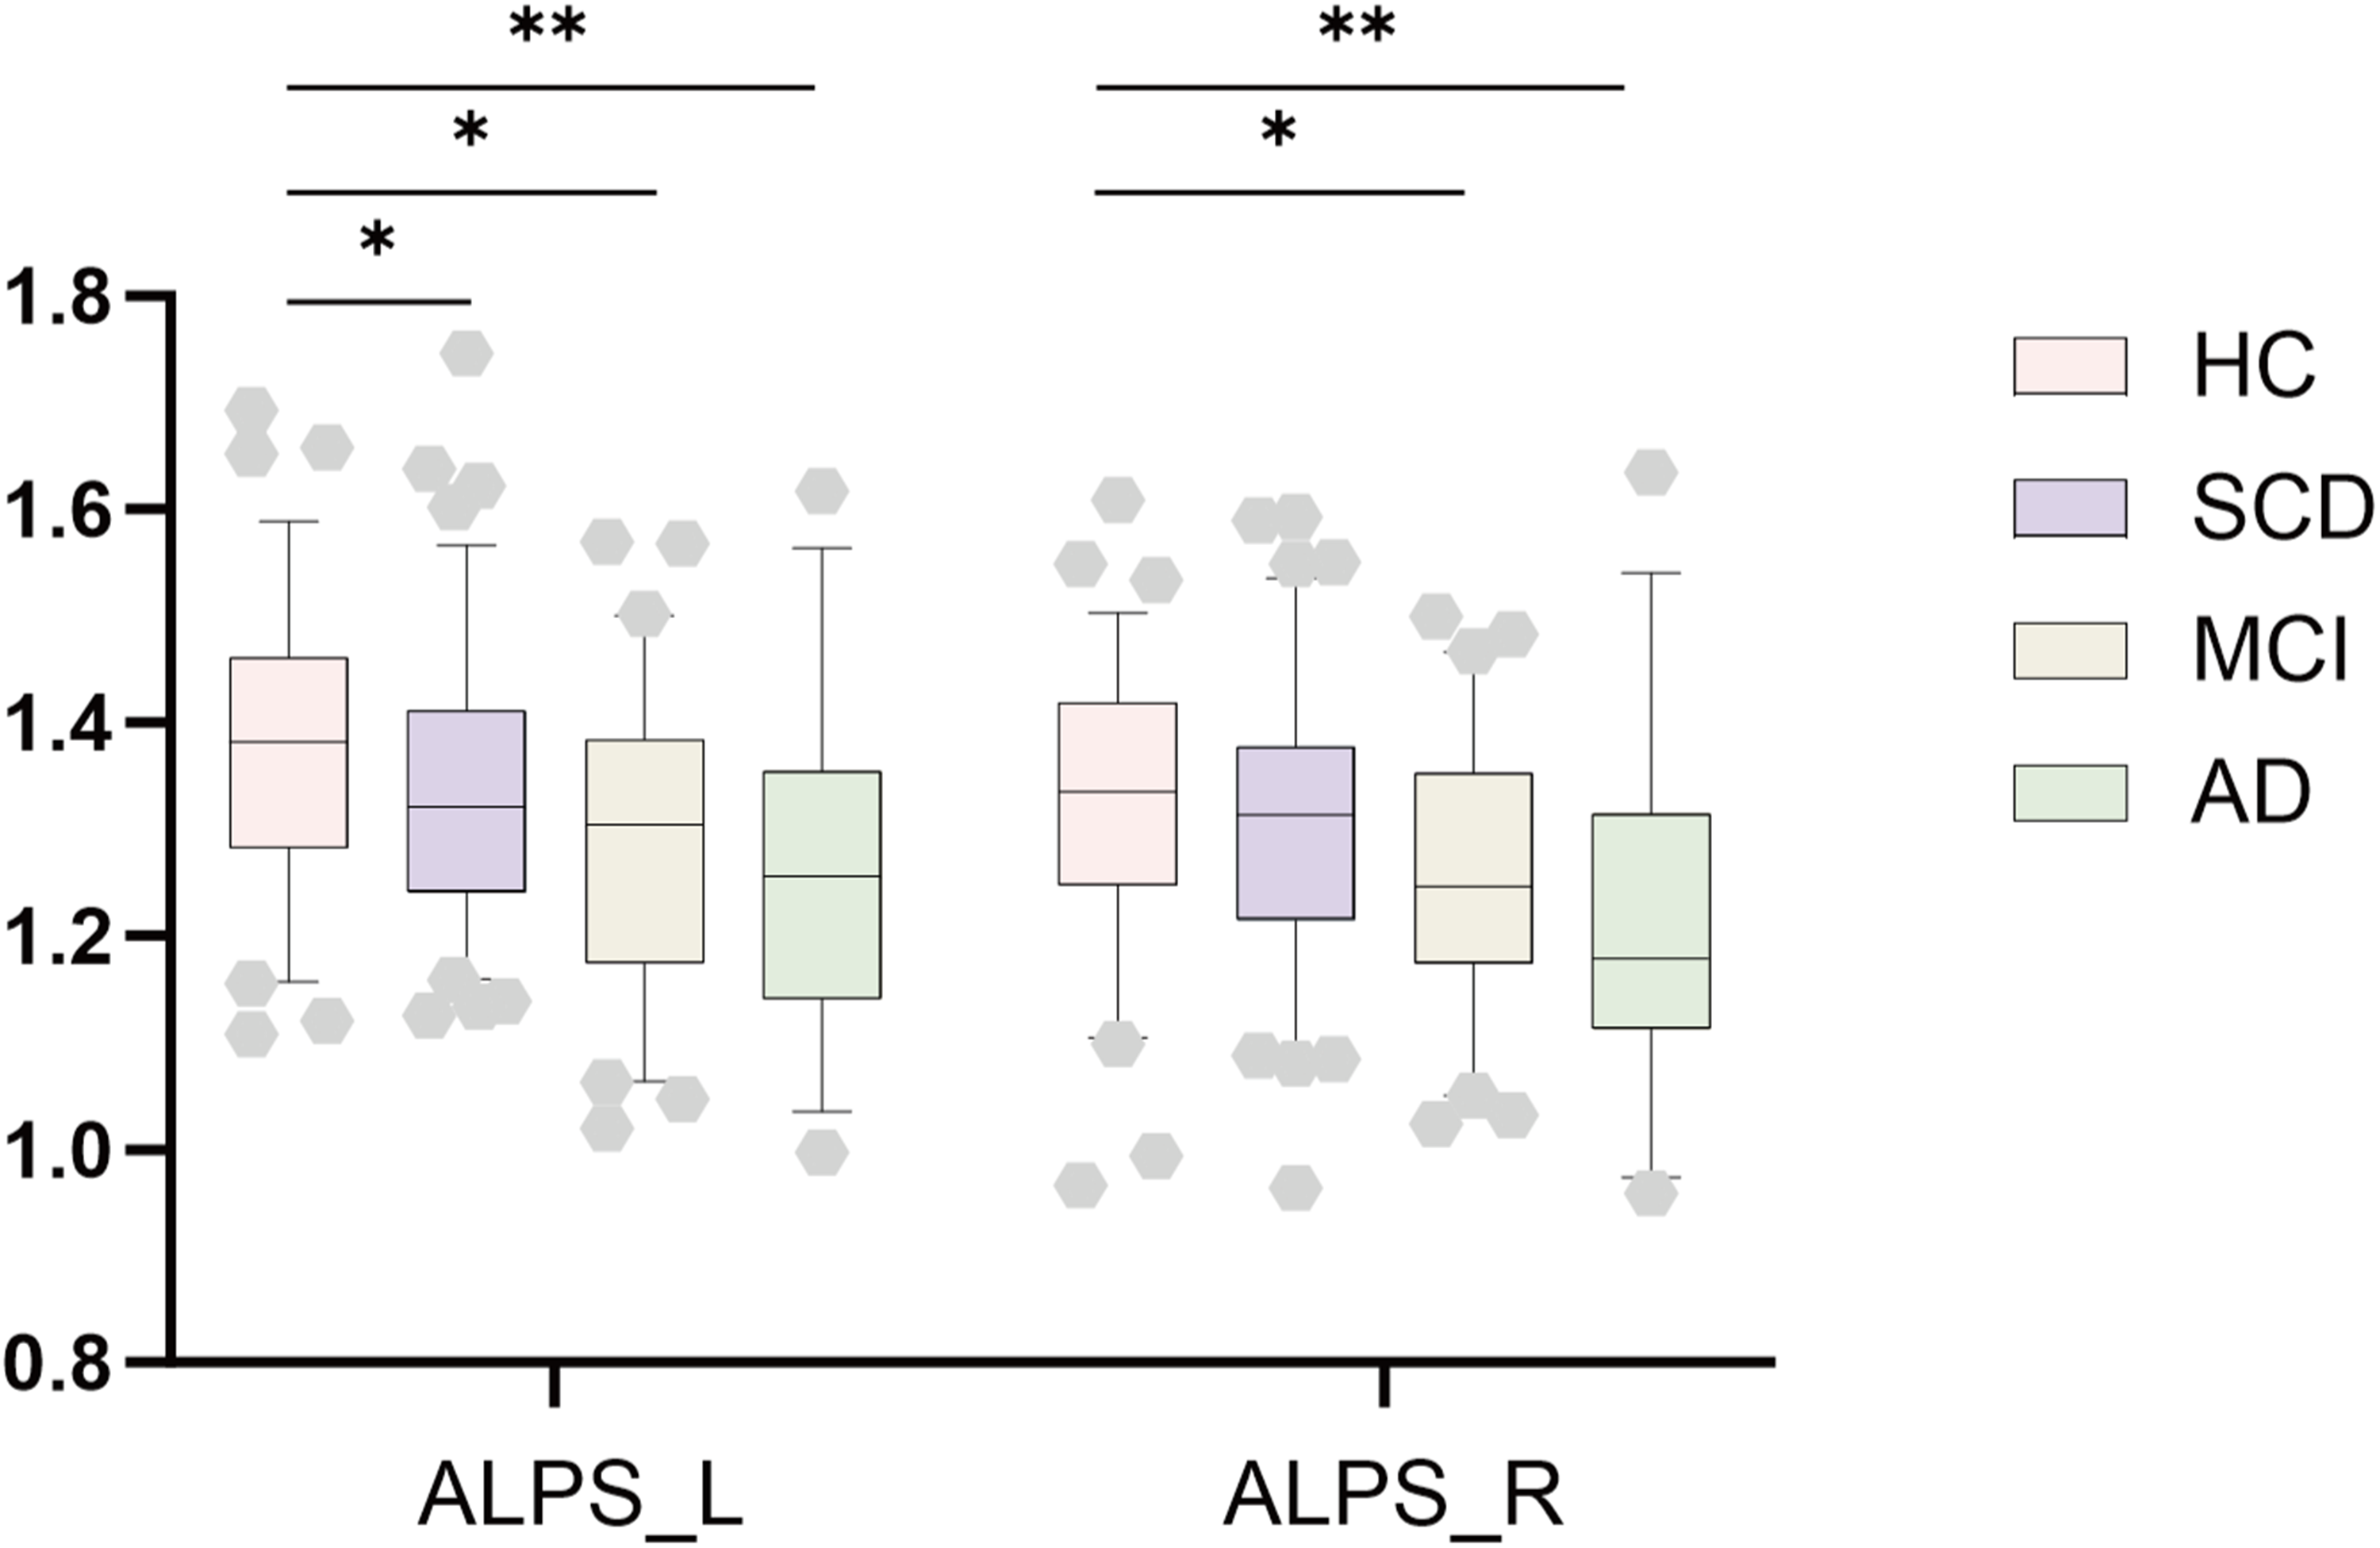
Between group comparisons of the ALPS-index. This bar chart illustrated differences in the ALPS index of bilateral brain hemisphere between patients with SCD, MCI, and AD versus HC. Notes: ALPS, Analysis Along the Perivascular Space; HC, Healthy Controls; SCD, Subjective Cognitive Decline; MCI, Mild Cognitive Impairment; AD, Alzheimer's Disease. * indicates p < 0.05, ** indicates p < 0.01, *** indicates p < 0.001.
Dynamic functional connectivity
For DYN-ICA, a total of 12 dynamic factors were identified across the entire study sample, with each factor representing a specific pattern of inter-network connectivity. Two factors captured the language and salience networks (LN-SN) interactions. The remaining ten factors were characterized by single interaction patterns between the following network pairs: dorsal attention network and frontoparietal network (DAN-FPN), visual network and default mode network (VN-DMN), visual network and salience network (VN-SN), salience network and sensorimotor network (SN-SMN), dorsal attention network and visual network (DAN-VN), language network and frontoparietal network (LN-FPN), dorsal attention network and salience network (DAN-SN), language network and visual network (LN-VN), sensorimotor network and frontoparietal network (SMN-FPN), and default mode network and salience network (DMN-SN) (Supplemental Figure 1).
Compared to HC, all patient groups exhibited significant reductions in dFC variability, with the affected network patterns changing across different stages of the disease. In SCD patients, the reduced variability primarily involved the LN-SN (factor1: β = 0.0063, pFDR < 0.001) and SMN-FPN (factor11: β = 0.0043, pFDR = 0.023) connections (Figure 3A). In MCI patients, the variability decrease was mainly seen in LN-SN (factor1: β = 0.0061, pFDR < 0.001), SN- SMN (factor5: 0.0056, pFDR = 0.012) and SMN-FPN (factor11: β = 0.0047, pFDR = 0.023) connections (Figure 3B). In patients with AD, decreased variability was observed in LN-SN (factor1: β = 0.008, pFDR < 0.001) and SN- SMN (factor5: β = 0.0071, pFDR = 0.012) connections, along with increased LN-VN (factor10: β = −0.0052, pFDR = 0.046) connection (Figure 3C). However, after FDR correction, no significant differences were observed in dFC frequency of all factors among the SCD, MCI, and AD groups. Moreover, topological properties (Eg, Eloc, CC, and BC) exhibited no significant differences among the HC, SCD, MCI, and AD groups.
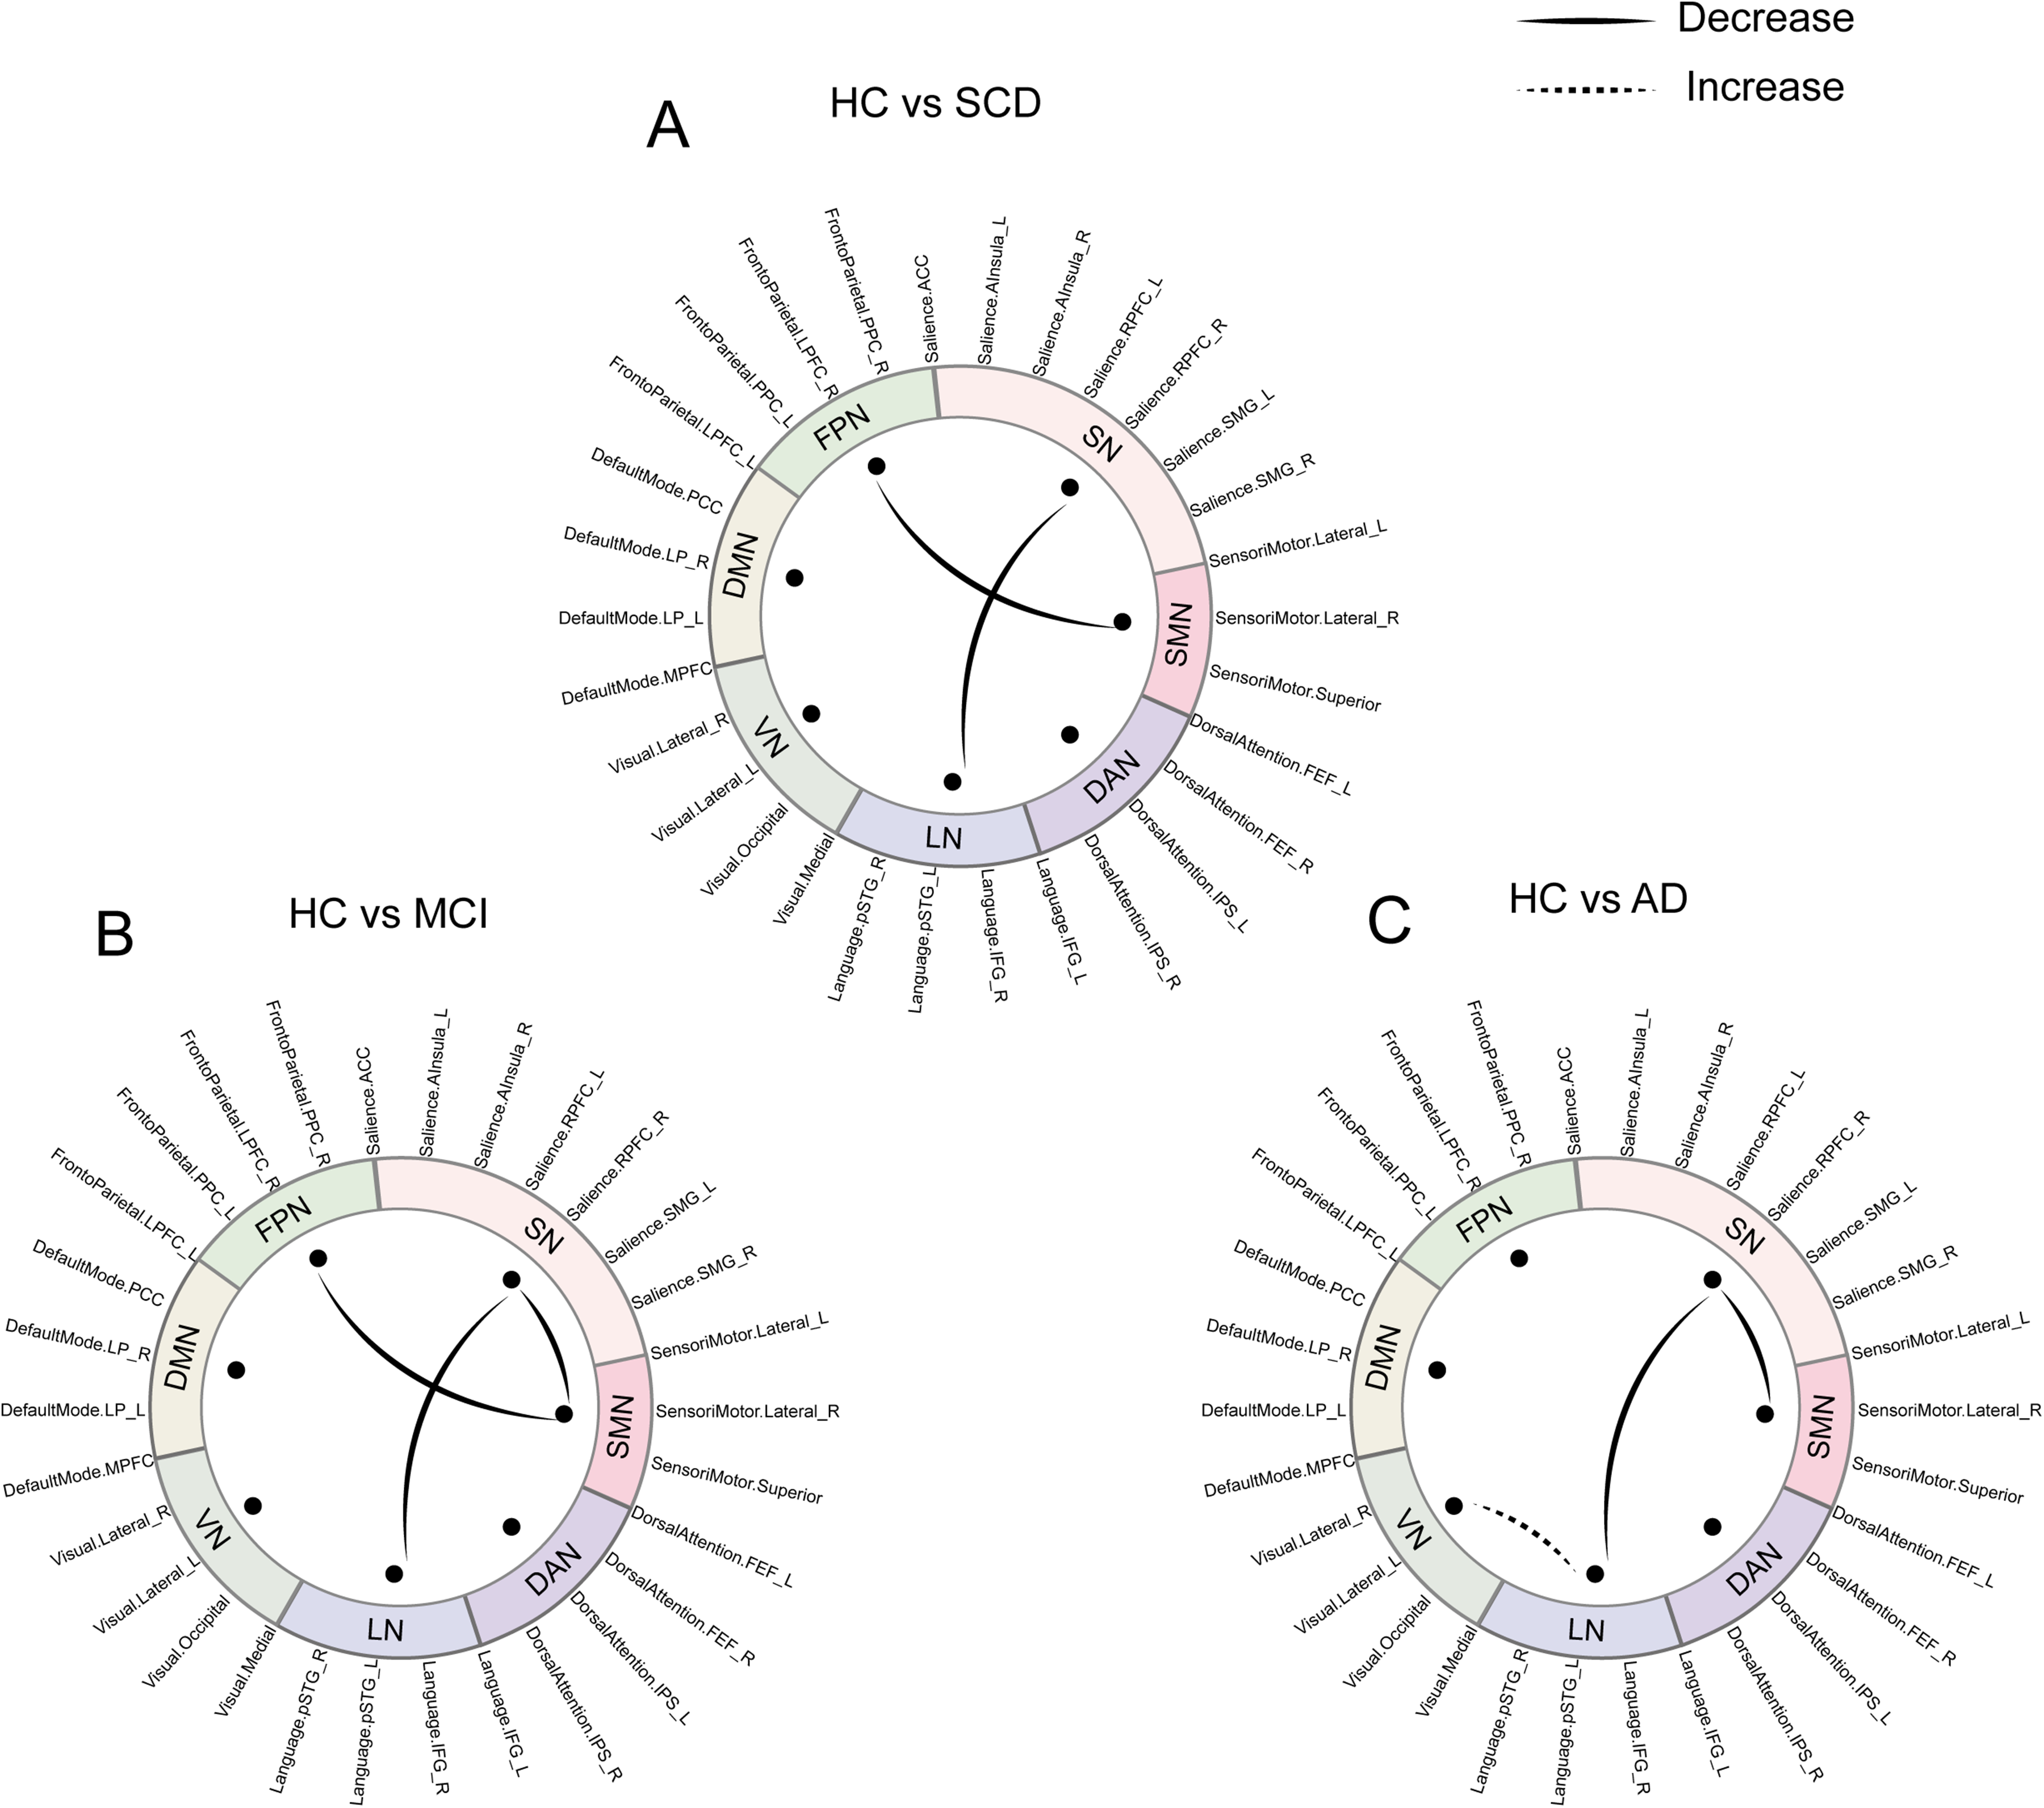
Group differences in dynamic independent component analysis. A. Compared to HC, SCD showed reduced variability mainly involved in LN-SN (factor1: β = 0.0063, PFDR < 0.001) and SMN-FPN (factor11: β = 0.0043, PFDR = 0.023) connections. B. Compared to HC, decreases were observed in LN-SN (factor1: β = 0.0061, PFDR < 0.001), SN-SMN (factor5: β = 0.0056, PFDR = 0.012) and SMN-FPN (factor11: β = 0.0047, PFDR = 0.023) connections in MCI group. C. In AD group, decreased variability was noted in LN-SN (factor1: β = 0.008, PFDR < 0.001) and SN-SMN (factor5: β = 0.0071, PFDR = 0.012) connections, along with increased variability in LN-VN (factor10: β = −0.0052, PFDR = 0.046) connection relative to HC. No significant intergroup differences in dFC frequency of all factors were noted after FDR correction. Notes: HC, Healthy Controls; SCD, Subjective Cognitive Decline; MCI, Mild Cognitive Impairment; AD, Alzheimer's Disease; LN, Language Network, VN, Visual Network; DMN, Default Mode Network; FPN, Frontal-Parietal Network; SN, Salience Network; SMN, Sensory Motor Network; DAN, Dorsal Attention Network; FDR, False Discovery Rate.
To verify the robustness of our findings, we adjusted analytical parameters and re-performed the Dyn-ICA. Specifically, when the temporal modulation kernel/window length was adjusted to 40 s, or the number of factors was set to 20, we observed patterns of inter-group differences that were highly consistent with the main analysis (Supplemental Figures 2–5).
Correlation and mediation analysis
Based on the above findings, factors 1, 5, 10, and 11 were used to explore association with ALPS and cognitive scores. In the ADS cohort, correlation analyses revealed that the ALPS index had significant positive correlations with the dFC variability of factor 5 (β = 0.162, p = 0.018) (Figure 4A) and a significant negative correlation with Eg (β = −0.136, p = 0.044) (Figure 4B). The dFC variability of factor 5 was also positively correlated with MMSE scores (β = 0.206, p = 0.01) (Figure 4C). Eg was positively correlated with TMT-B scores (β = 0.147, p = 0.039) (Figure 4D). Correlation analyses of other cognitive measures and brain functional connectivity metrics are presented in Supplemental Figures 6 and 7.
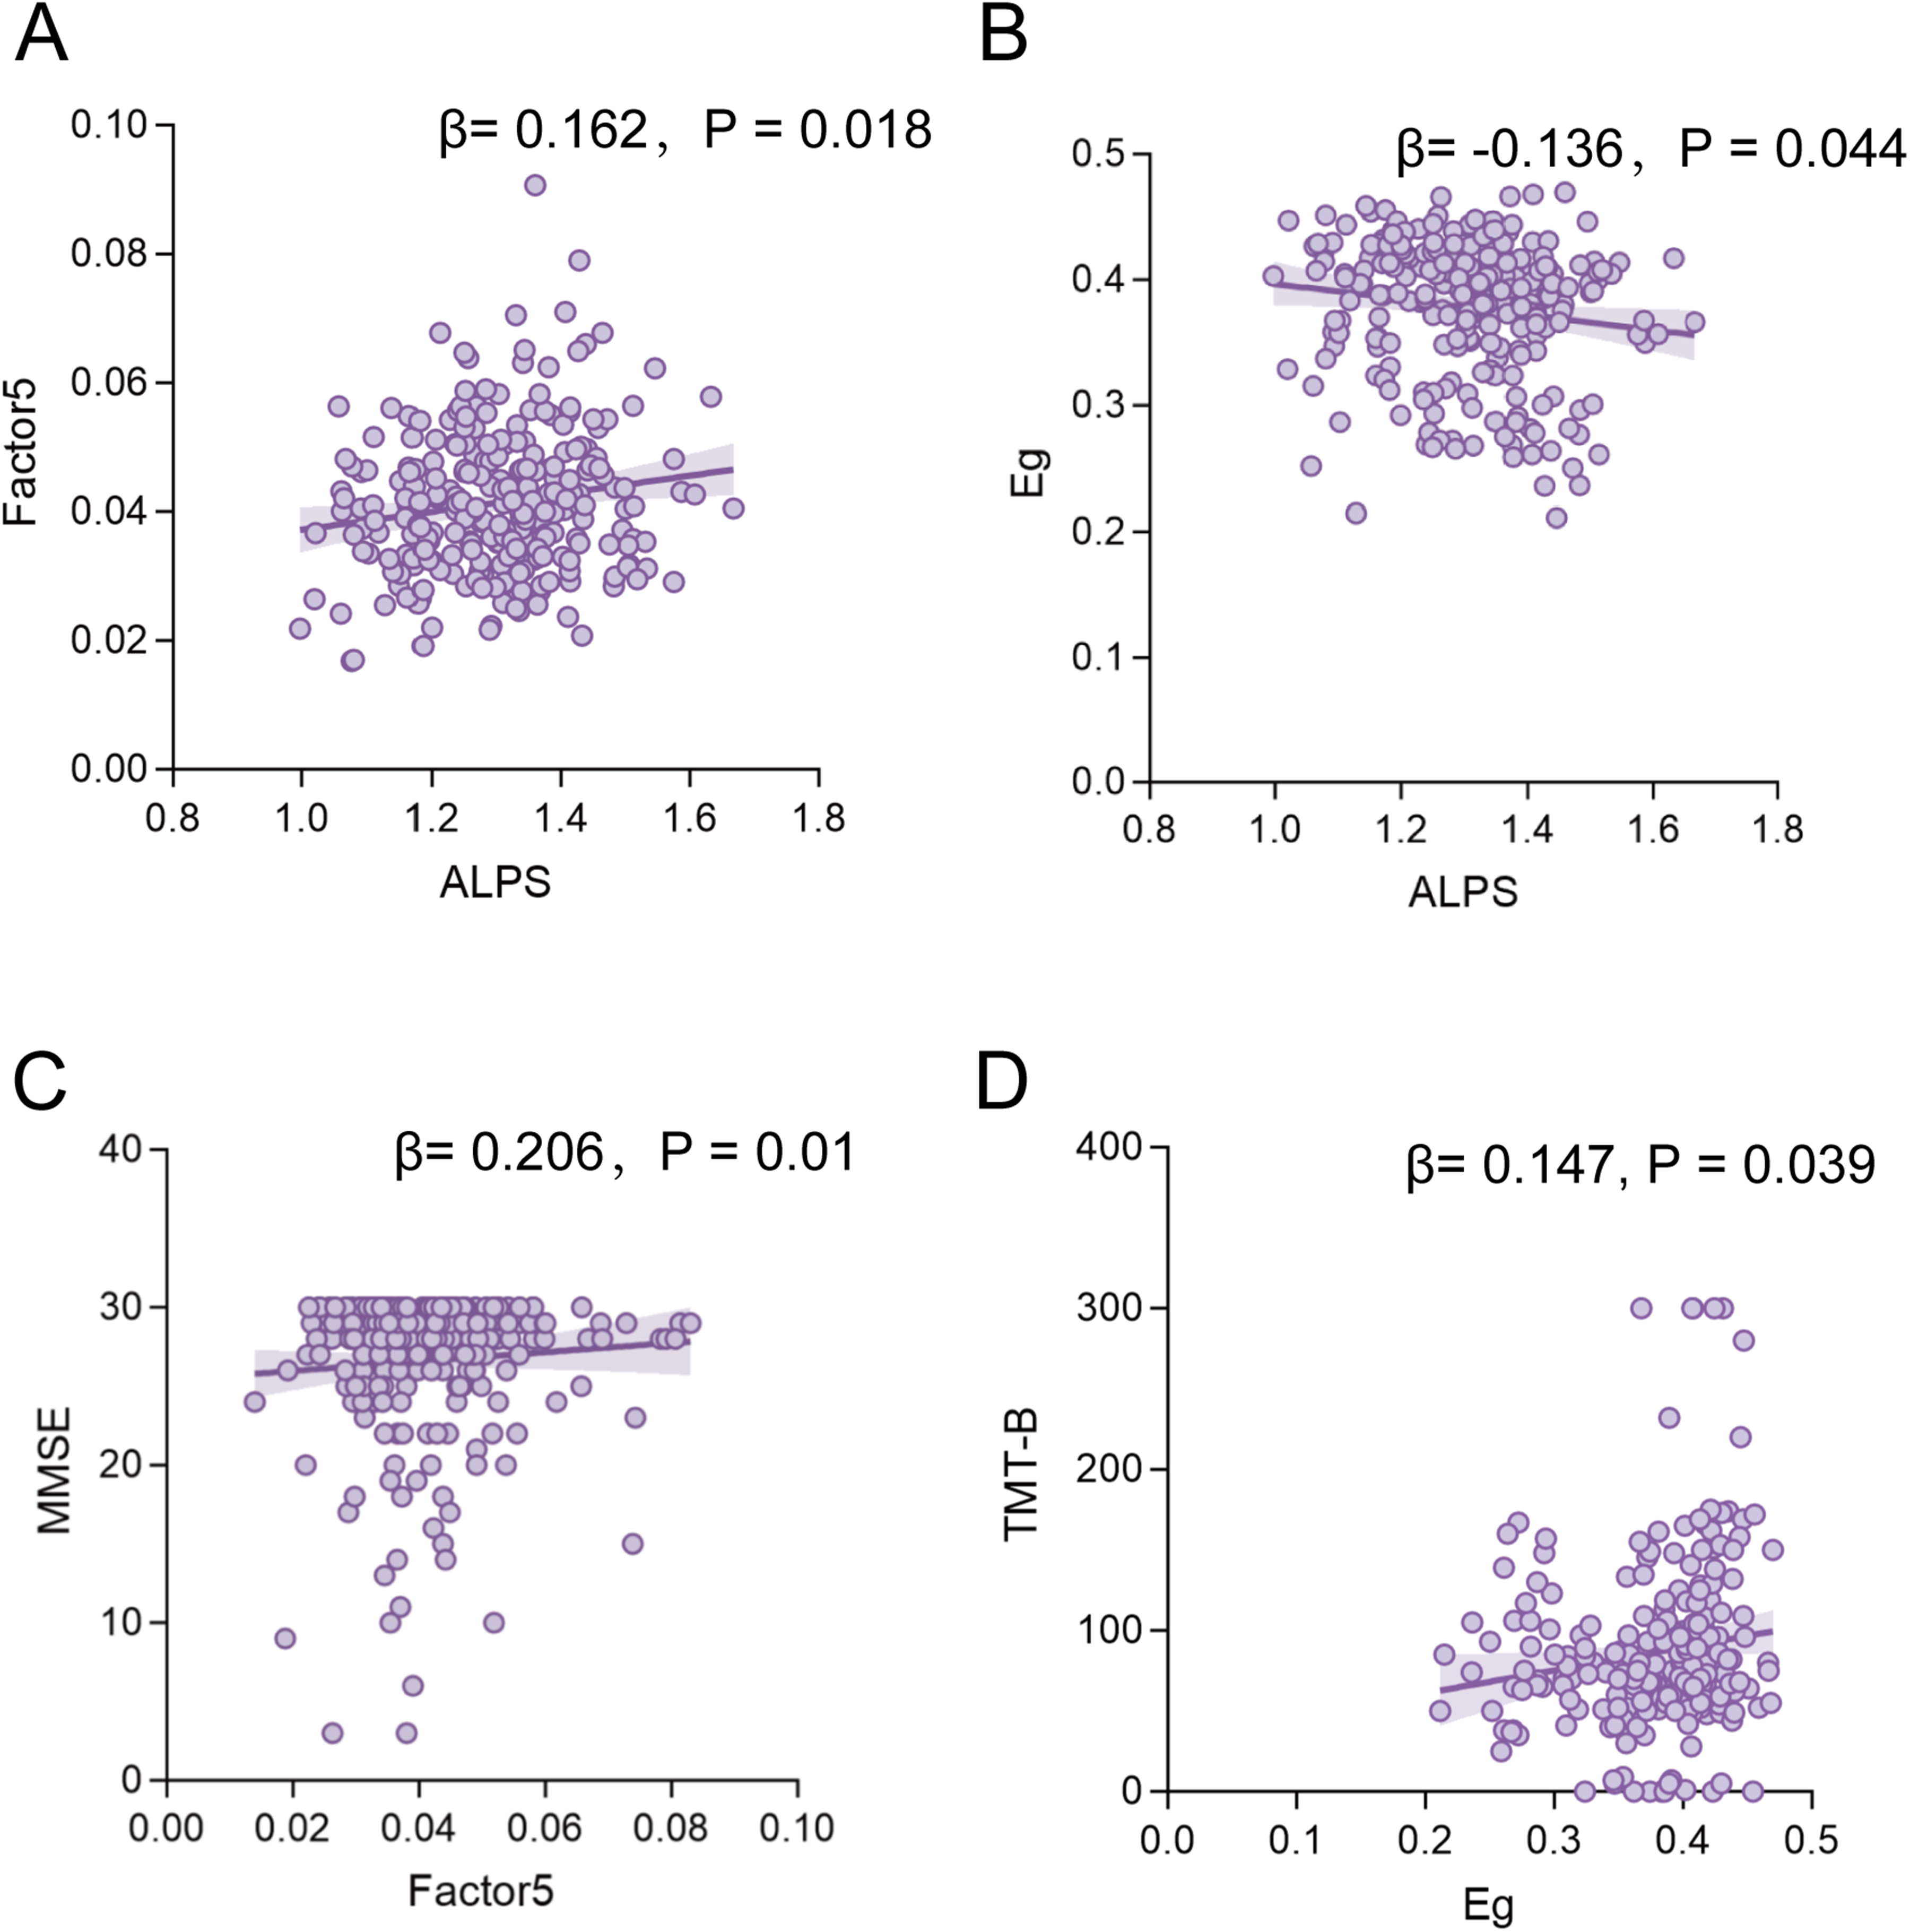
Correlation analyses of functional metrics with the ALPS Index and cognitive scores. Associations of the ALPS index with dFC variability of factor 5 (A), Eg (B) in ADS patients. Associations of the dFC variability of factor 5 with MMSE score (C). Associations of the Eg with TMT-B score (C). Notes: ALPS, Analysis Along the Perivascular Space; ADS, Alzheimer's disease spectrum; MMSE, Mini-Mental State Examination; TMT-B, Trail Making Test Parts B; Eg, Global Efficiency; dFC, Dynamic Functional Connectivity.
Mediation analysis showed that dFC variability of factor 5 (SN- SMN) played a significant partial mediating role in the relationship between the ALPS index and MMSE scores, the average causal mediation effect (ACME) was 1.515 (pFDR = 0.012), accounting for 20.493% of the total effect (Figure 5A). However, Eg did not play a significant mediating role in the relationship between the ALPS index and TMT-B scores. (Figure 5B).
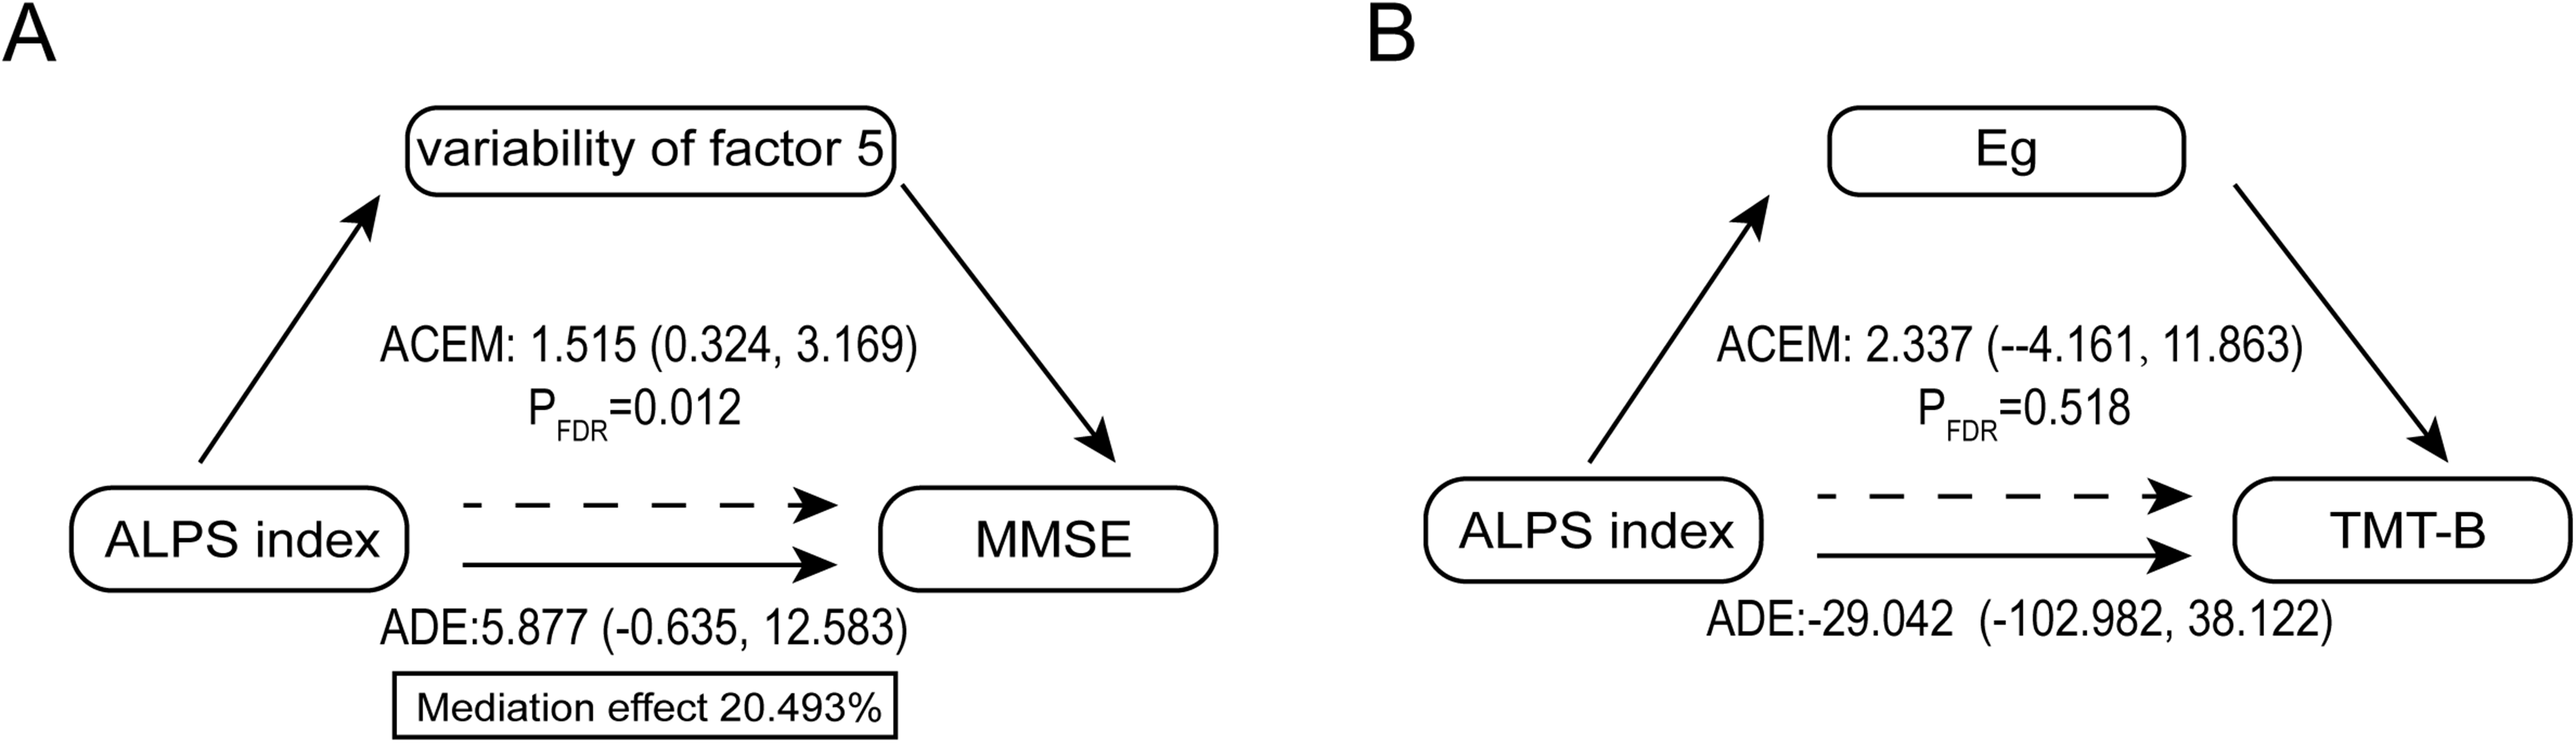
Mediating analysis between the ALPS Index and cognitive scores. A. The dFC Variability of factor 5 partially mediated the relationship between ALPS index and MMSE scores in ADS patients. B. Eg did not play a significant mediating role in the relationship between the ALPS index and TMT-B scores. Notes: ADS, Alzheimer's disease spectrum; dFC, Dynamic Functional Connectivity; ALPS, Analysis Along the Perivascular Space; MMSE, Mini-Mental State Examination; TMT-B, Trail Making Test Parts B; Eg, Global Efficiency; ACME, Average Causal Mediation Effect; ADE, Average Direct Effects.
Discussion
Our study demonstrated that the decrease of the DTI-ALPS index, emerged as early as the SCD stage of ADS, initially presenting in an asymmetric, left-hemispheric pattern. The dFC analysis revealed stage-specific alterations in inter-network temporal variability, characterized by abnormalities in the LN-SN networks at the SCD stage, followed by anomalies in the SMN-VN in later stages. In contrast, topological properties (Eg, Eloc, CC, and BC) exhibited no significant differences across groups. Notably, mediation analysis indicated that the abnormal dFC showed a significant mediating effect between the DTI-ALPS index and CI.
Previous studies have shown a significant reduction in the ALPS index in both hemispheres in patients with AD and MCI,8,9 consistent with our findings. Our study further demonstrated that the ALPS index is already decreased at the earlier SCD stage, with this reduction predominantly observed in the left hemisphere. This suggested that the decrease in DTI-ALPS index may occur in the early stages of AD, with its initial manifestation being asymmetrical. As the disease progresses, the dysfunction gradually involves the entire brain, leading to an overall decrease in the ALPS index. These findings were in line with previous studies: Wang et al. 29 reported that Aβ deposition in SCD individuals was primarily located in the left middle temporal gyrus, and other studies have shown left-hemisphere predominance in cerebral metabolism and cortical thickness changes in SCD patients.30,31 In contrast, MCI and AD patients exhibit diffuse Aβ accumulation throughout the entire brain.32,33
Using a whole-brain network partitioning scheme, DYN-ICA revealed that ADS patients exhibited significant dFC abnormalities across multiple brain networks, including the SN, LN, SMN, VN, and FPN. A common abnormal pattern was identified across all stages of ADS: a significant reduction in the dynamic variability of dFC between the LN and SN. This finding aligned with previous reports, such as Schaeverbeke et al., 34 who noted that AD leads to progressive language impairment due to degeneration in the basal nucleus of Meynert, a region associated with the LN. In the SCD stage, reduced dFC variability was mainly concentrated in the LN and SN, consistent with findings by Um et al., 35 who observed reduced SN connectivity in preclinical AD patients. Wolfsgruber et al. 36 found that patients with SCD, despite maintaining normal cognitive performance, already exhibited subtle language deficits. Moreover, Tang et al. 37 also found weakened FC in the angular gyrus in individuals with SCD.
At the MCI stage, the reduction in dFC variability exhibited a broader pattern of involvement than in the SCD group, further affecting the SN-SMN connection, which is in line with the study by Zendehrouh et al.. 38 At the AD stage, abnormalities of dFC between brain networks involves the VN. Interestingly, our study revealed a significant increase in temporal variability of LN-VN connection in AD patients, which contrasts with the prevailing view that brain network complexity is generally reduced in AD. 39 Additionally, Sheng et al. 40 demonstrated that patients with AD exhibit abnormal FC within the VN, which is considered a key predictor of CI. Studies using AD mouse models further support this finding, showing that AD pathology causes significant impairment to the visual system, primarily through disruption of visual cortical circuits and ultimately leading to visual deficits. 41 Graph-theoretical analysis revealed no significant differences among the HC, SCD, MCI, and AD groups, corroborating findings by Jin et al., 42 who also reported no significant differences in graph-theoretical metrics between AD patients and HC. This suggests that dFC metrics capture subtle time-varying alterations in ADS that may not be reflected by topological properties.
Importantly, our study indicated that the abnormality of dFC plays an important mediating role in the relationship between the DTI-ALPS index and CI in ADS patient. Research on vascular CI and obstructive sleep apnea hypopnea syndrome has also shown that the decrease in the DTI-ALPS index can negatively affect cognitive function by impairing FC.16,19 Previous studies have demonstrated that Aβ deposition is a critical marker of neuronal damage, capable of inducing mitochondrial damage in neurons, disrupting the homeostasis of the nervous system, and leading to synaptic dysfunction, thereby affecting FC between neurons. 43 Berron et al. 44 found that compared to cognitively intact Aβ-negative counterparts, Aβ-positive individuals exhibit significant decreases in brain network FC, particularly in the DMN. This evidence provides a potential pathological context for our findings and strengthens the relationship between the DTI-ALPS index, dFC, and cognitive function. Furthermore, this mediation effect was only significant for the global cognitive assessment, but failed to reach significance in tests assessing specific cognitive subdomains, such as attention and executive/visuospatial function.45,46 This suggested that alterations in dFC may primarily affect broad cognitive functions that require the integrated coordination of multiple domains, with a more limited impact on isolated cognitive subdomains.
Furthermore, a significant negative correlation was observed between the ALPS index and Eg, suggesting that the decrease in the DTI-ALPS is accompanied by an aberrant increase in Eg. This phenomenon may reflect a pathological reorganization of the AD brain network, shifting from an efficient ‘small-world’ network to a ‘random’ network. 47 However, mediation analysis did not confirm a significant mediating role for Eg in the relationship between the decrease in the DTI-ALPS index and CI. This may be attributed to the fact that static network metrics are derived by averaging connectivity over the entire scan duration. As a result, Eg only reflects the average topological structure over the entire scanning period, thereby masking transient instability in the temporal dimension. 48 Consequently, the statistical association between the decrease in the DTI-ALPS index and CI is primarily mediated by altered dFC variability rather than the topology of brain networks.
Limitations and perspectives
The main strength of this study lies in its comprehensive coverage of multiple clinical stages of the ADS and the integration of multimodal neuroimaging techniques. This approach systematically reveals the patterns of the decrease in DTI-ALPS index and brain network dynamics across different stages of the disease, as well as their relationship with cognitive function. However, several limitations should be noted. First, although we provide preliminary evidence for the relationships between the decrease in DTI-ALPS index, brain network abnormalities and CI, the cross-sectional design limits causal inference. Future studies should incorporate longitudinal data from multiple time points to better clarify disease progression and underlying mechanisms. Second, mediation analyses yielded significant effects solely for global cognition but not for specific cognitive subdomains. Third, the diagnosis of AD in this study was based on the clinical NIA-AA 2011 criteria without the inclusion of positron emission tomography (PET) or CSF biomarkers. While the newest diagnostic frameworks emphasize a biological definition, their widespread adoption in routine clinical practice remains constrained by high costs and limited accessibility.
A recent study has demonstrated that the association between the DTI-ALPS index and contrast enhanced MRI-derived waste clearance appears to be limited. 49 Intrathecal contrast-enhanced MRI (glymphatic MRI, gMRI) may more directly reflect perivascular clearance in the human brain. 50 Future studies incorporating gMRI may help to clarify the relationships among glymphatic function, cognition, and brain functional networks more directly; however, its clinical applicability may be limited by its invasive nature.
Conclusion
In summary, our findings revealed that the decrease in the DTI-ALPS index begins at the stage of SCD, initially presenting as asymmetric abnormalities in the left hemisphere, and subsequently as whole-brain involvement in the MCI and AD groups. Concurrently, across the ADS, the abnormality in dFC variability manifests as localized alterations in early stages and widespread changes in advanced stages. However, topological properties exhibited no significant differences across groups. Furthermore, mediation analysis suggested that the abnormality of dFC plays an important mediating role in the relationship between the DTI-ALPS index and CI. These findings deepen our understanding of the pathophysiological mechanisms underlying ADS and may inform future therapeutic approaches.
Supplemental Material
sj-docx-1-alz-10.1177_13872877261465700 - Supplemental material for Disruptions of the diffusion tensor image analysis along the perivascular space index and dynamic functional connectivity across the Alzheimer's disease spectrum: Implications for cognitive impairment
Supplemental material, sj-docx-1-alz-10.1177_13872877261465700 for Disruptions of the diffusion tensor image analysis along the perivascular space index and dynamic functional connectivity across the Alzheimer's disease spectrum: Implications for cognitive impairment by Yan Shi, Renpuchi Ci, Chenyang Geng, Xiaoxiao Zhang, Ning Zheng and Yuanyuan Qin in Journal of Alzheimer's Disease
Footnotes
Acknowledgements
We are grateful to all the participants in this study.

Ethical considerations
The study protocol received approval from the Tongji Hospital, Tongji Medical College, Huazhong University of Science and Technology Ethics Committee (TJ-IRB202401097) in accordance with the Declaration of Helsinki.
Consent to participate
All participants provided written informed consent or assent as appropriate.
Consent for publication
Not applicable
Author contribution(s)
Funding
The authors disclosed receipt of the following financial support for the research, authorship, and/or publication of this article: This work was supported by National Natural Science Foundation of China (81873890).
Declaration of conflicting interests
The authors declared no potential conflicts of interest with respect to the research, authorship, and/or publication of this article.
Data availability statement
The data supporting the findings of this study are available on request from the corresponding author. The data are not publicly available due to privacy or ethical restrictions.
Supplemental material
Supplemental material for this article is available online.
References
Supplementary Material
Please find the following supplemental material available below.
For Open Access articles published under a Creative Commons License, all supplemental material carries the same license as the article it is associated with.
For non-Open Access articles published, all supplemental material carries a non-exclusive license, and permission requests for re-use of supplemental material or any part of supplemental material shall be sent directly to the copyright owner as specified in the copyright notice associated with the article.
