






Abstract
Dynamic light scattering (DLS) spectroscopy measures the Brownian movement of particles. Fifteen patients underwent DLS measurement and positron emission tomography amyloid imaging. The DLS measurement is noninvasive, quantitative, and inexpensive, with immediate results. We report a significant correlation between DLS measurements and Centiloid values.
Keywords
Introduction
Alzheimer's disease is the most common form of dementia, affecting about 1 in 9 people ages 65 and older in the United States. The incidence of Alzheimer's disease is projected to increase. 1 The pathophysiology is characterized by the extracellular accumulation of amyloid-β plaques and the intracellular accumulation of hyperphosphorylated tau protein in the brain. 2
Radiological imaging such as computed tomography (CT), magnetic resonance imaging (MRI), and positron emission tomography (PET) aid in the diagnosis of neurodegenerative disease. The role of structural imaging modalities including CT and standard MRI is to identify patterns of brain atrophy in the relevant brain structures, while molecular imaging with 18F-FDG PET identifies functional brain deficits. These modalities do not visualize the amyloid-β plaques and neurofibrillary tangles described in Alzheimer's disease.
Amyloid and tau PET utilize lipophilic radiotracers that cross the blood-brain barrier and bind with high affinity to amyloid and tau, respectively. The radiotracer is tagged to a positron emitter and allows for the visualization of amyloid-β plaques and neurofibrillary tangles by PET-CT. This differentiates amyloid and tau PET from other imaging modalities, and it is currently being used to aid in diagnosing Alzheimer's disease. 3
All brain amyloid PET results are binary, either positive or negative, based on the intensity and distribution of radiotracer activity, both qualitatively and quantitatively. Positive results indicate a higher level of amyloid plaque deposition and suggest a diagnosis of Alzheimer's disease in conjunction with the clinical picture. 4
Standardized uptake value (SUV) is a measurement obtained in PET imaging to quantify radiotracer uptake in a region of interest. The SUV ratio is a ratio of SUV in a region of interest scaled by the SUV in a reference region that has little to no amyloid plaque in healthy individuals. This ratio is used to calculate a Centiloid score which is a quantifiable measure of amyloid plaque burden developed to quantitate and standardize amyloid PET imaging, allowing comparisons between different nuclide tracers and methods. The Centiloid scale ranges between 0 and 100, with 0 observed in young, healthy controls and 100 in patients with mild to moderate Alzheimer's disease. The scoring may be less than 0 or more than 100, as 0 and 100 are median values.5–17 While amyloid PET imaging is a promising modality in the diagnosis of Alzheimer's disease, a more rapid and inexpensive approach may better facilitate routine population screening.
Dynamic light scattering (DLS) spectroscopy, which measures the Brownian movement of particles, may offer such a possibility.18,19 Two small studies have previously been performed.20,21 In the first, DLS identified 4 patients who were ultimately diagnosed with Alzheimer's disease up to 2 years later, and in the second, DLS testing correctly identified all 10/16 (100%) of patients that had positive PET amyloid imaging, and 5/6 (83%) of patients that had negative amyloid PET imaging. The one (1/6) patient who was negative for amyloid demonstrated DLS measurements consistent with Alzheimer's disease; their clinical course should be followed to determine whether a diagnosis of Alzheimer's disease is made in the future.
The ganglion cell body is affected early in the Alzheimer's disease process. There is a 46–56% reduction in the number of ganglion cells in mild cognitive impairment (MCI) and Alzheimer's disease patients as compared to normal controls. 22 We hypothesize that DLS is measuring changes in the Brownian movement of the ganglion cell body.
Methods
A total of 15 patients with MCI referred for amyloid PET testing also underwent DLS testing in an IRB approved study.
Amyloid PET imaging was performed using the radiotracer 18F-florbetapir (Amyvid). A Centiloid score was calculated for each amyloid PET scan.
The DLS test is simple to perform. The patient places their head on a standard ophthalmic device chinrest. A microwatt laser light is focused on the retina and the backscattered light analyzed. The quantitative results are immediately displayed on a computer monitor. The prototype instrument used in this study required mydriasis and the testing duration was 5 s. The lifespan of the laser diode is 50,000 h making each individual test inexpensive.
Our study first examined the relationship between the Centiloid score and DLS measurement. To evaluate the statistical association between the DLS and Centiloid measurements, two related statistical methods were used. (In our chart, the DLS values were multiplied by 100 to normalize the results compared to the Centiloid score in the amyloid PET positive patients. Our analysis used the unadjusted DLS values.)
Second, we examined the relationship between positive/ negative PET amyloid imaging and the DLS measurement using logistic regression. We evaluate the accuracy by plotting an ROC curve and calculating the area under the curve.
Statistical analysis was performed using the Stata 19 software package.
Results
Of the 15 patients, 9/15 (60%) patients were amyloid PET positive and 6/15 (40%) were negative. Our results demonstrate an agreement between the DLS measurement and the Centiloid value. Figure 1 plots the adjusted DLS measurement and Centiloid values for positive PET amyloid imaging while Figure 2 plots the adjusted DLS measurement and Centiloid values for negative PET amyloid imaging.
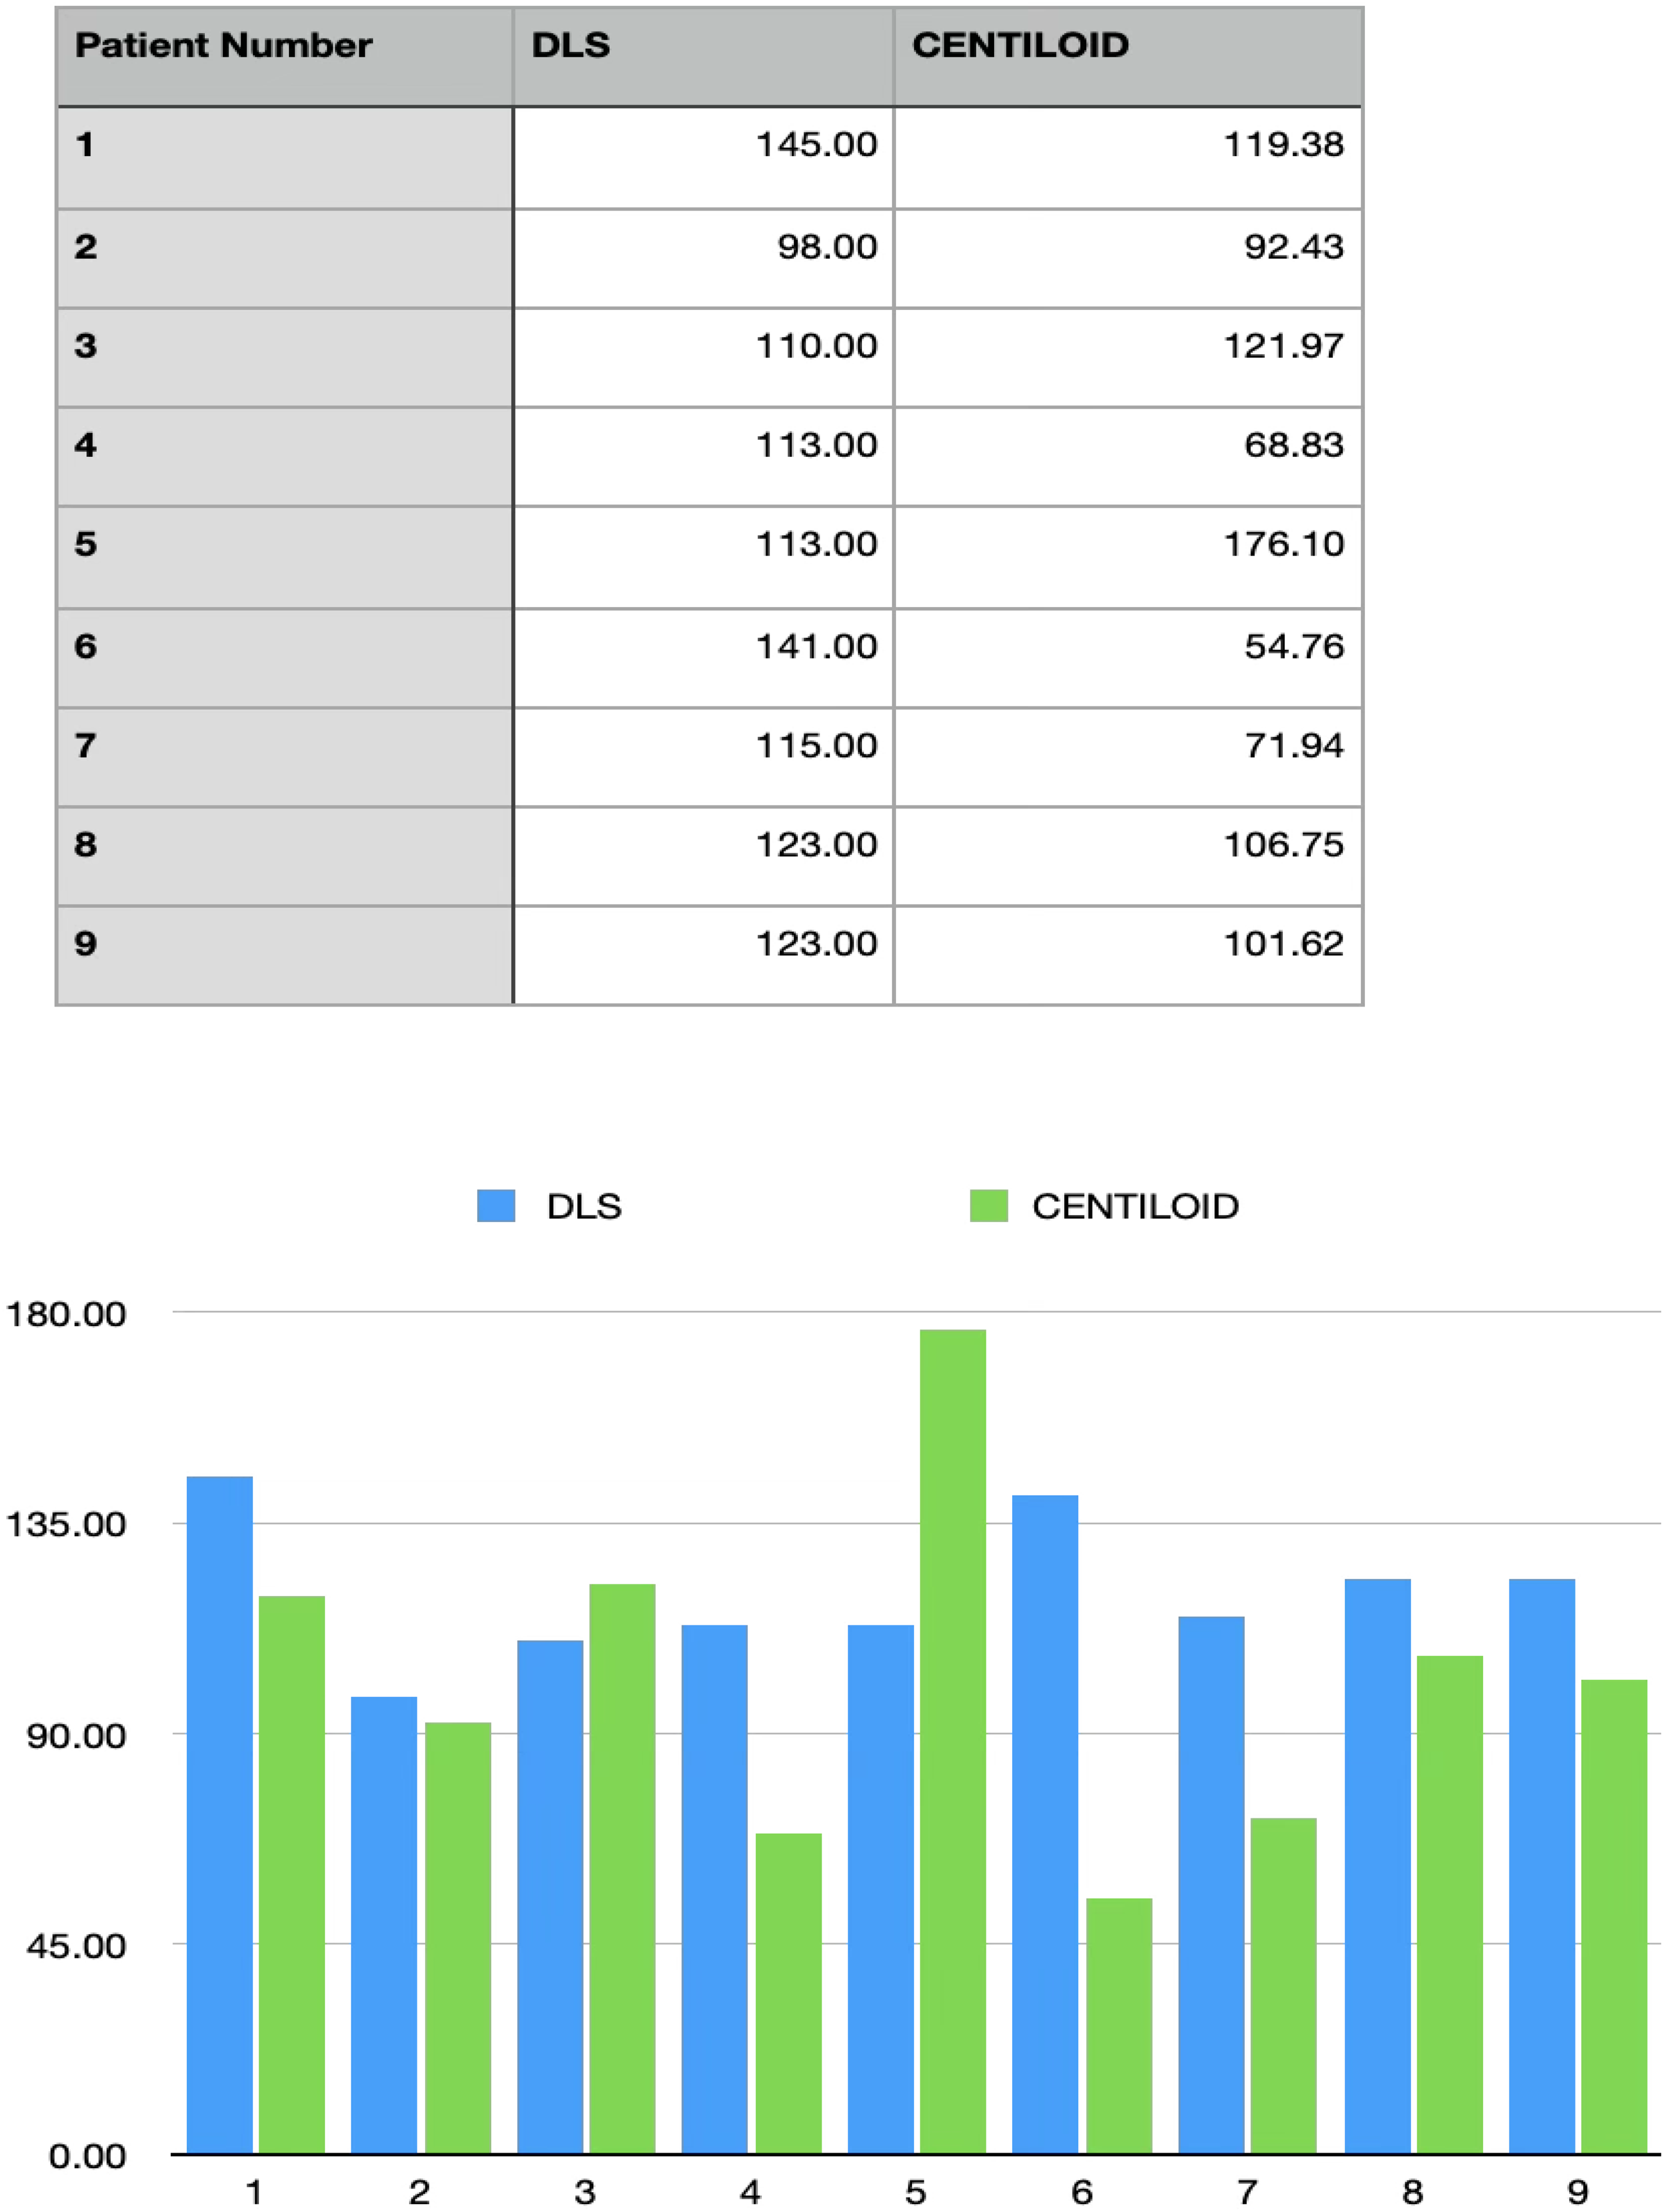
Positive amyloid PET patients. DLS measurement compared to Centiloid value. The DLS values were multiplied by 100 to normalize the results compared to the Centiloid score. Raw DLS values were used in the statistical analysis.
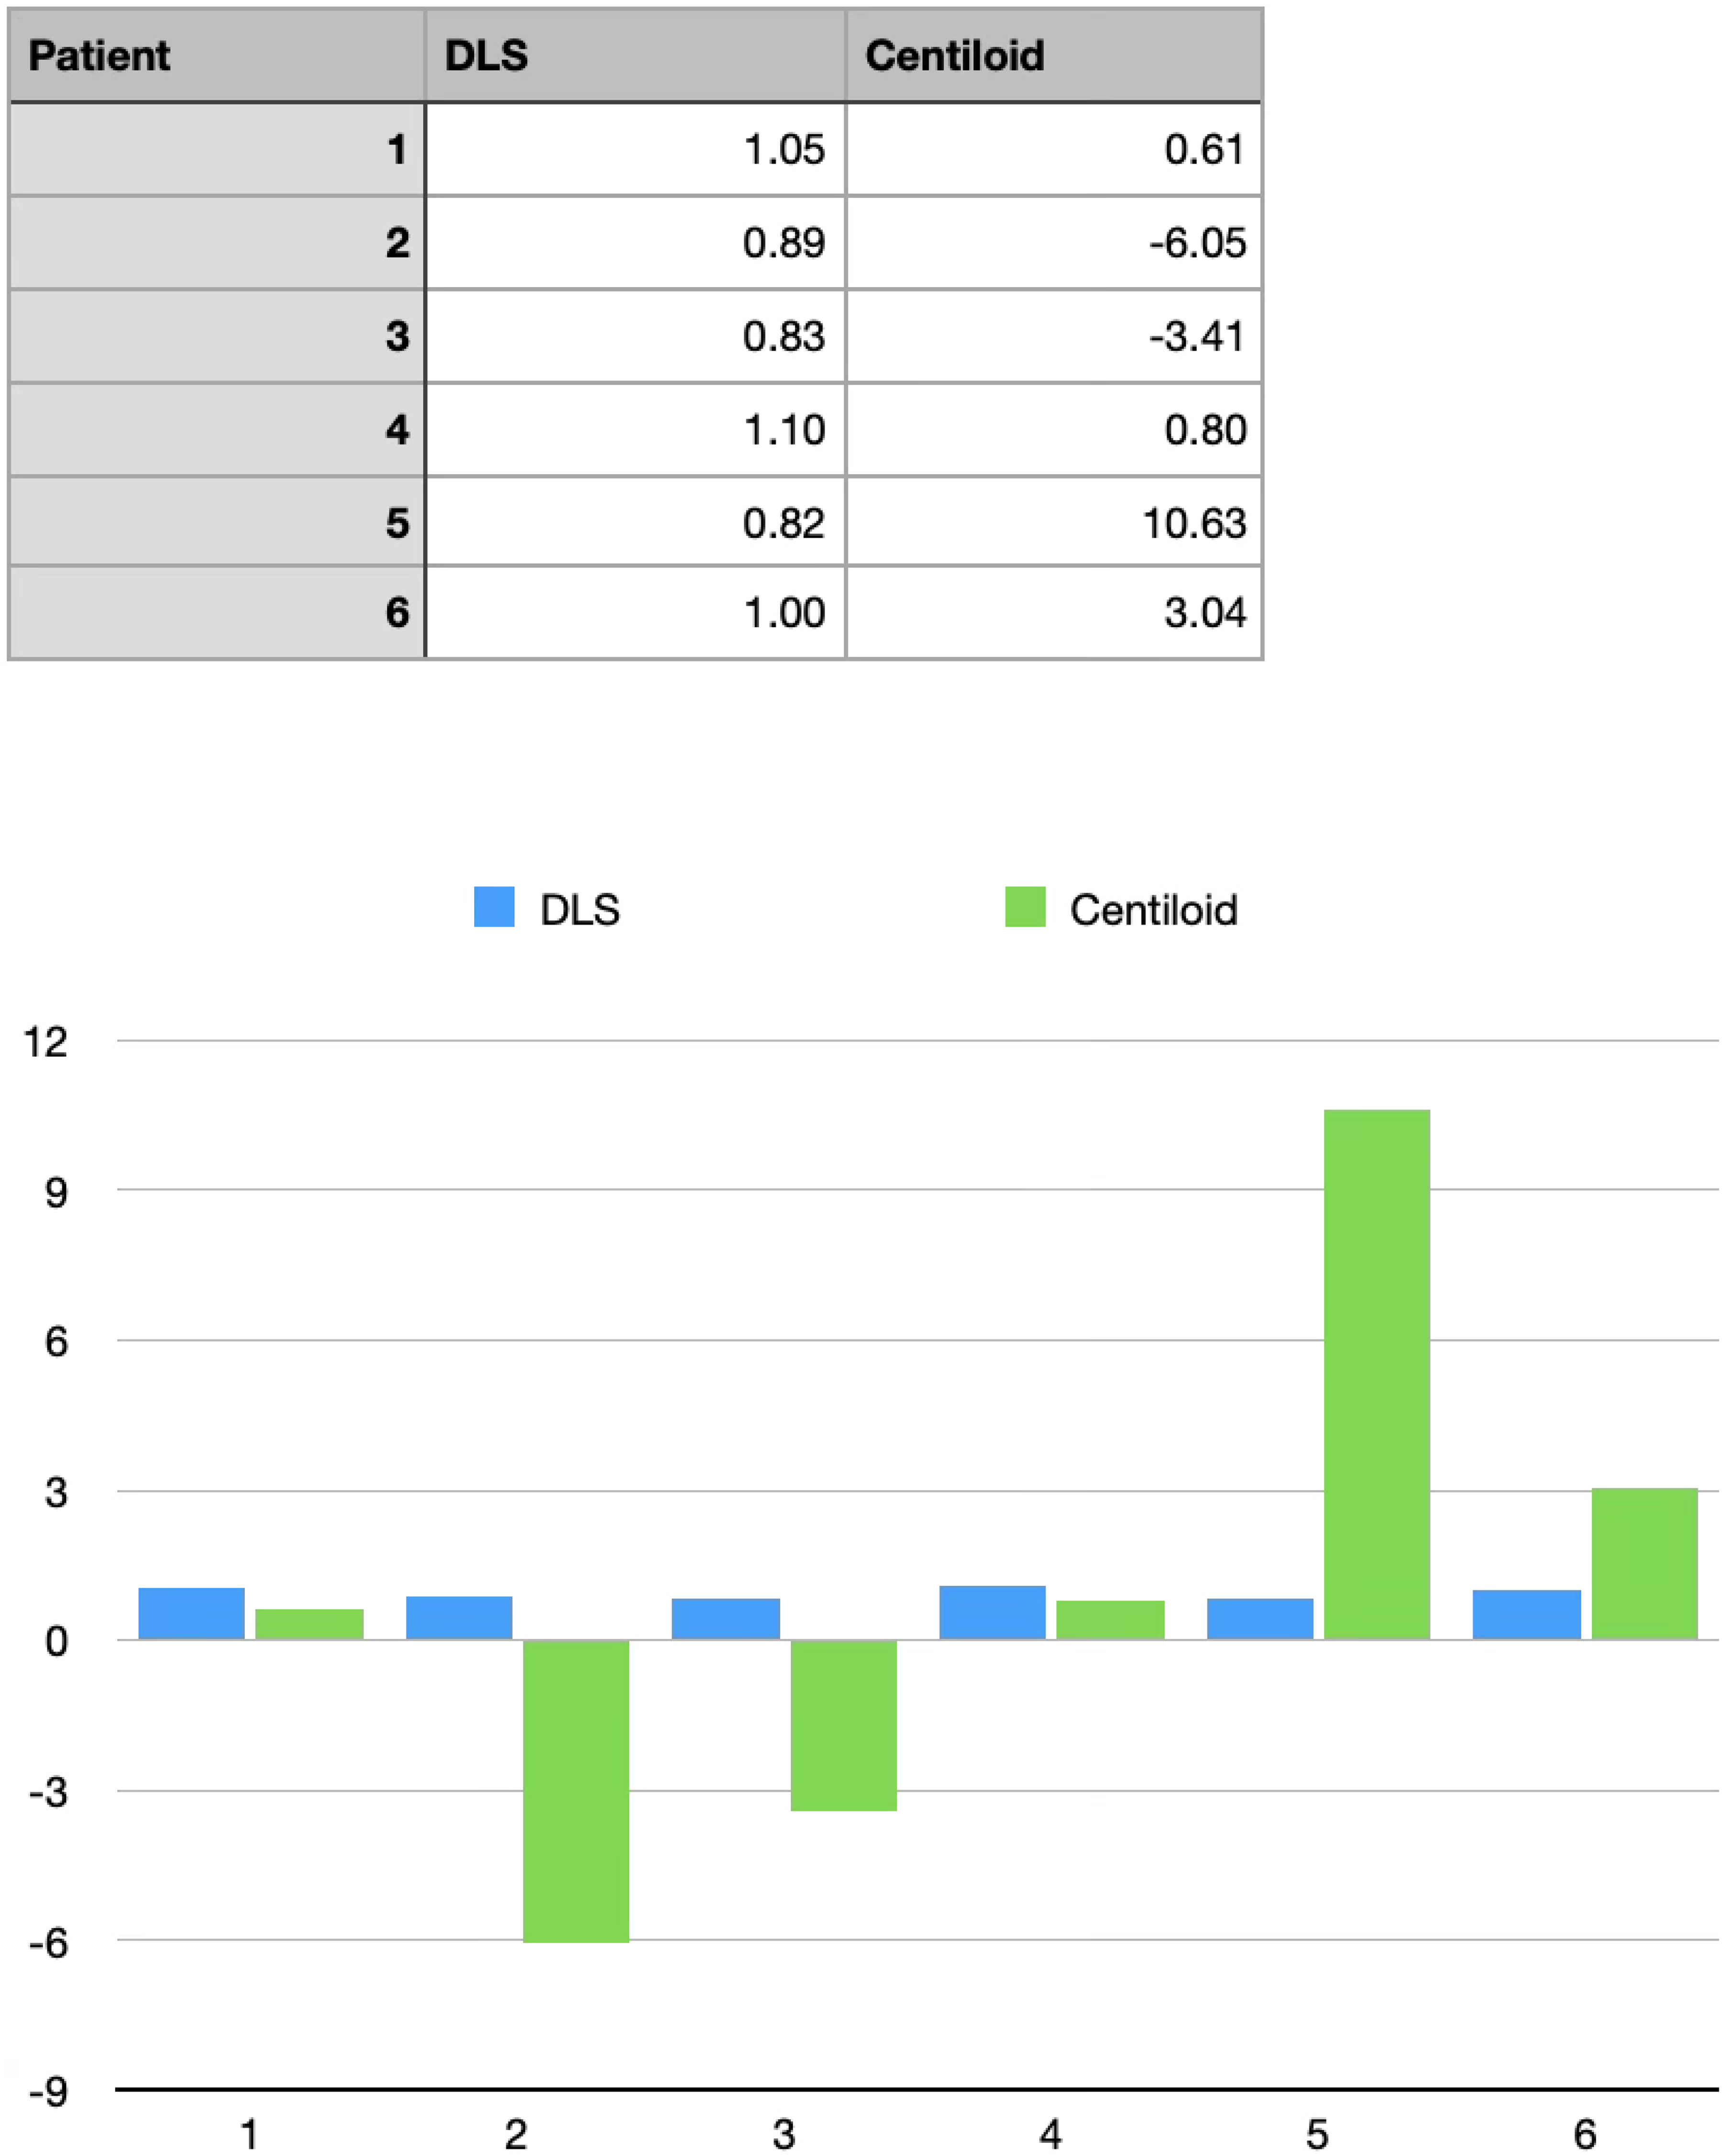
Negative amyloid PET patients. DLS measurement compared to Centiloid value.
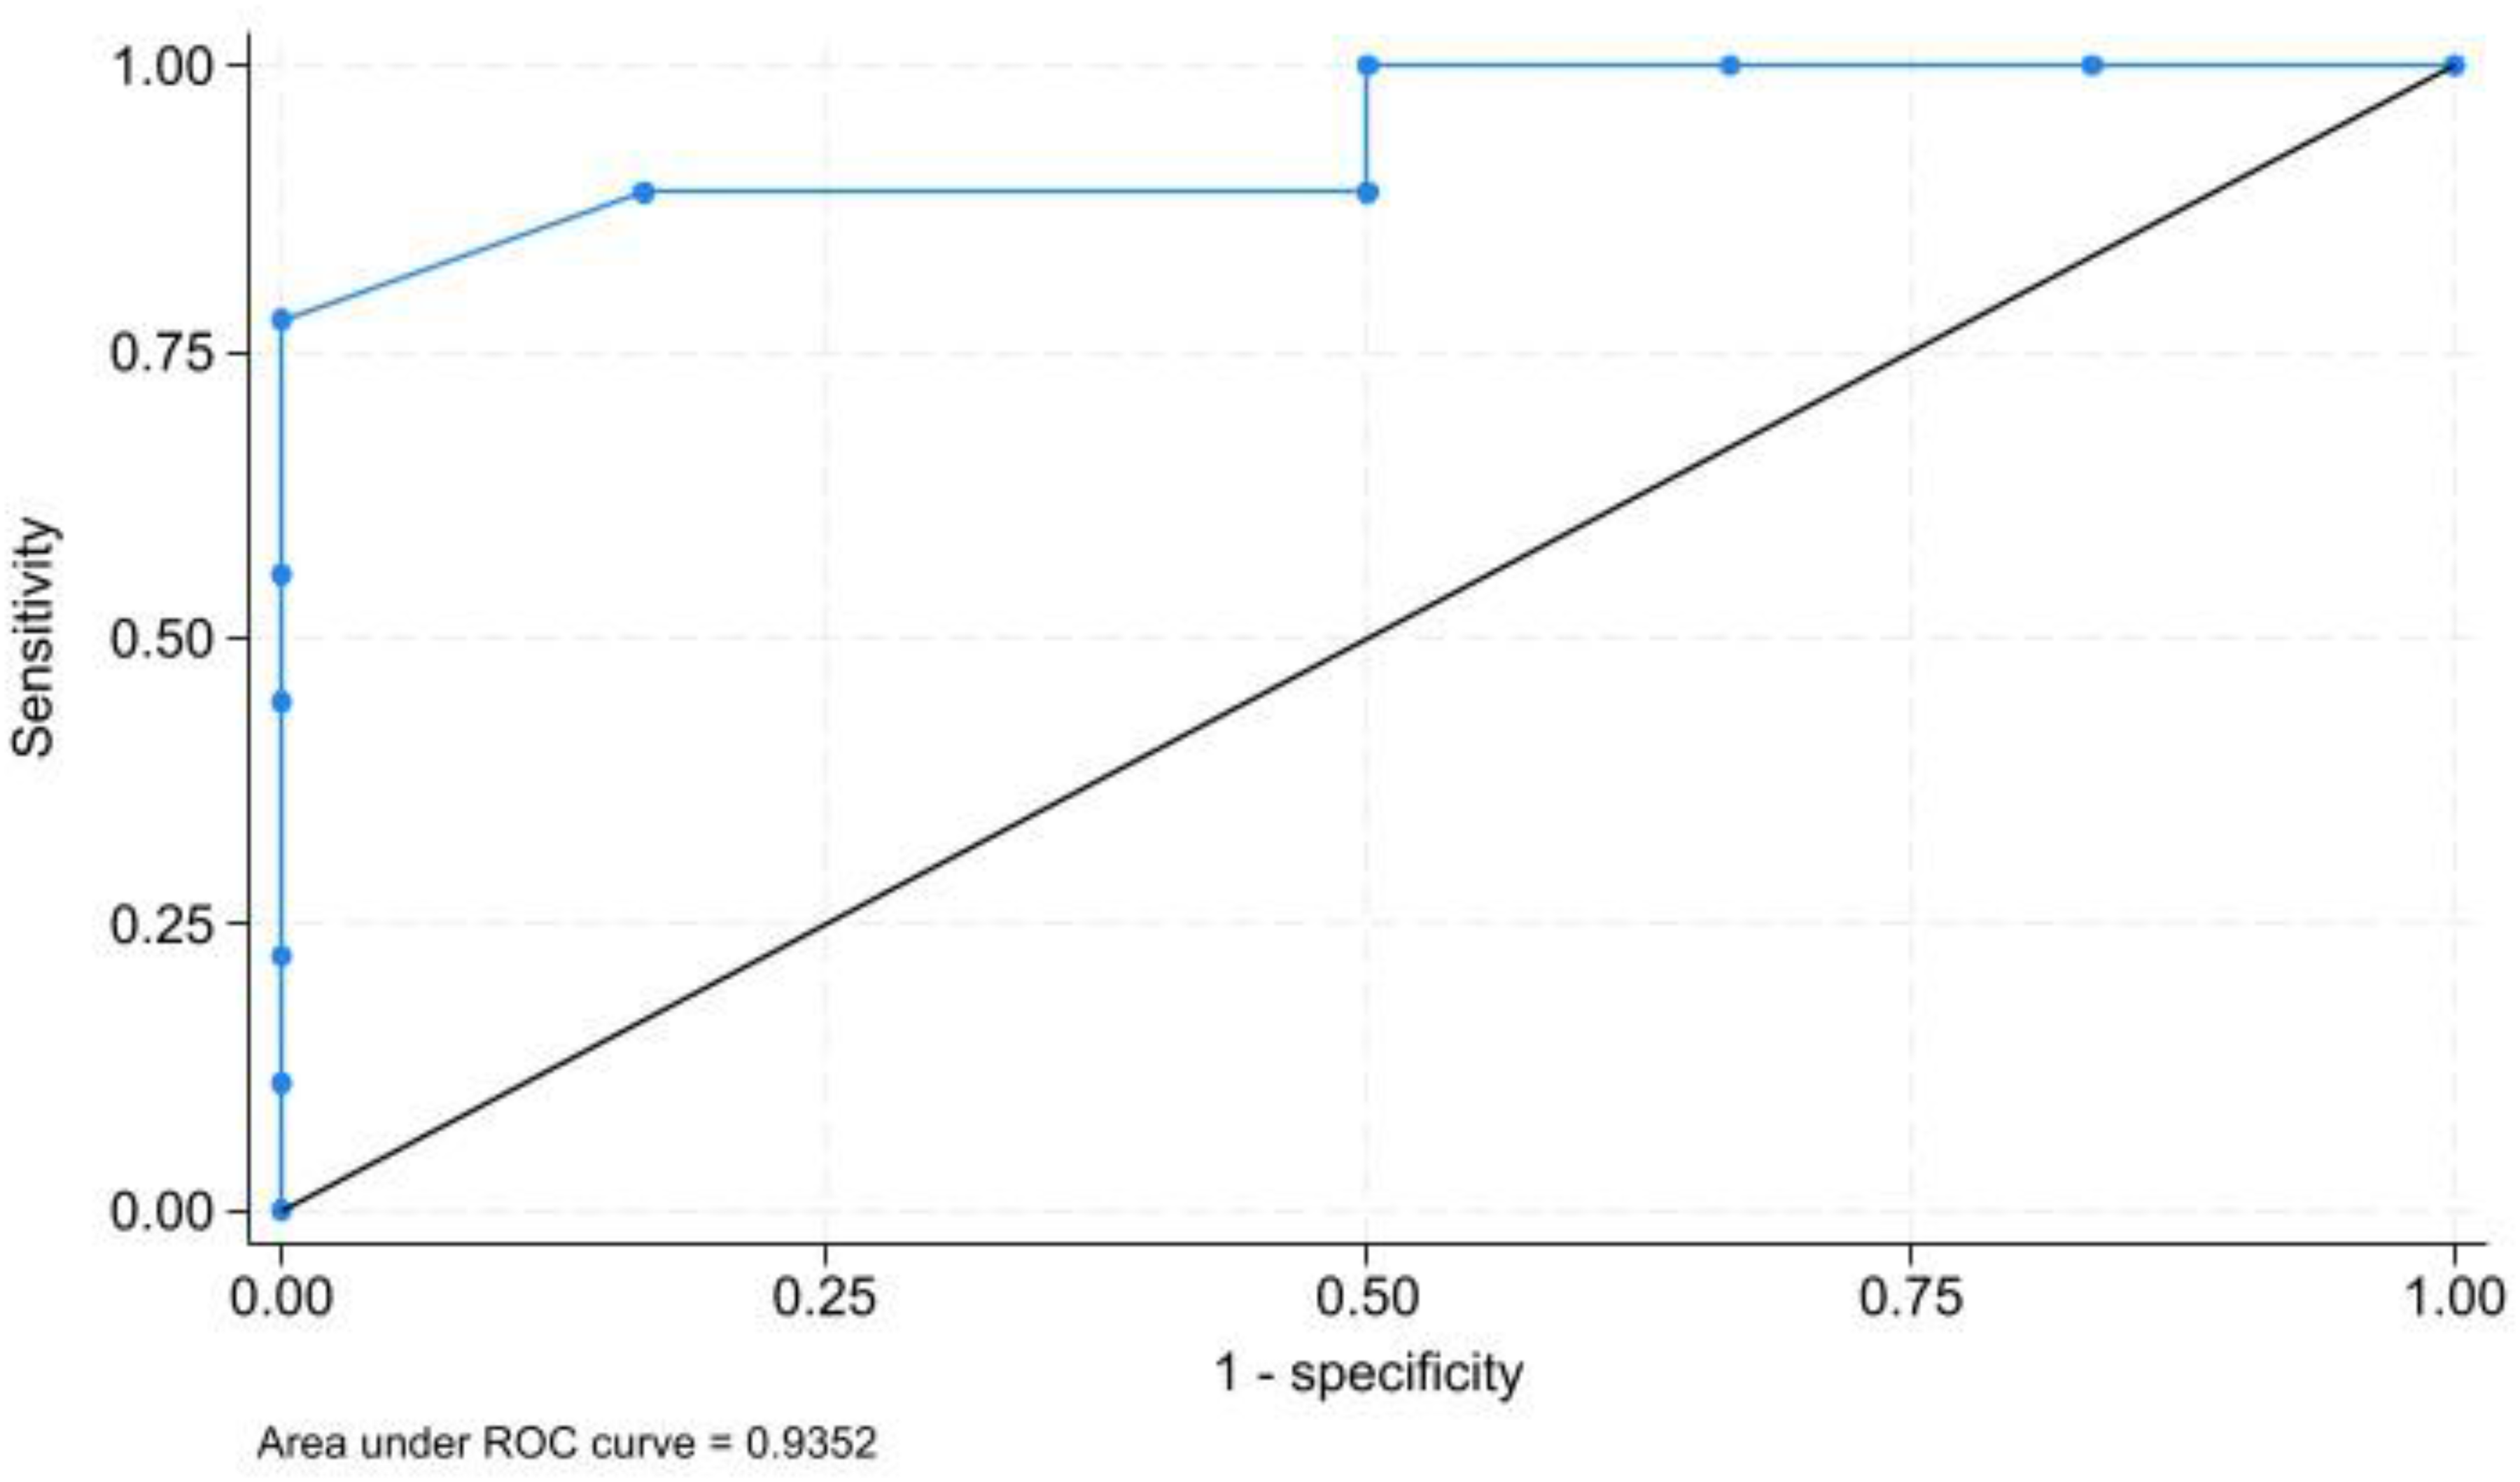
ROC curve and AUC (in sample).
Correlation analysis
The Pearson product-moment correlation statistic yielded a highly significant and positive correlation coefficient of 0.579 between the raw DLS measurement and the Centiloid value.
OLS regression analysis
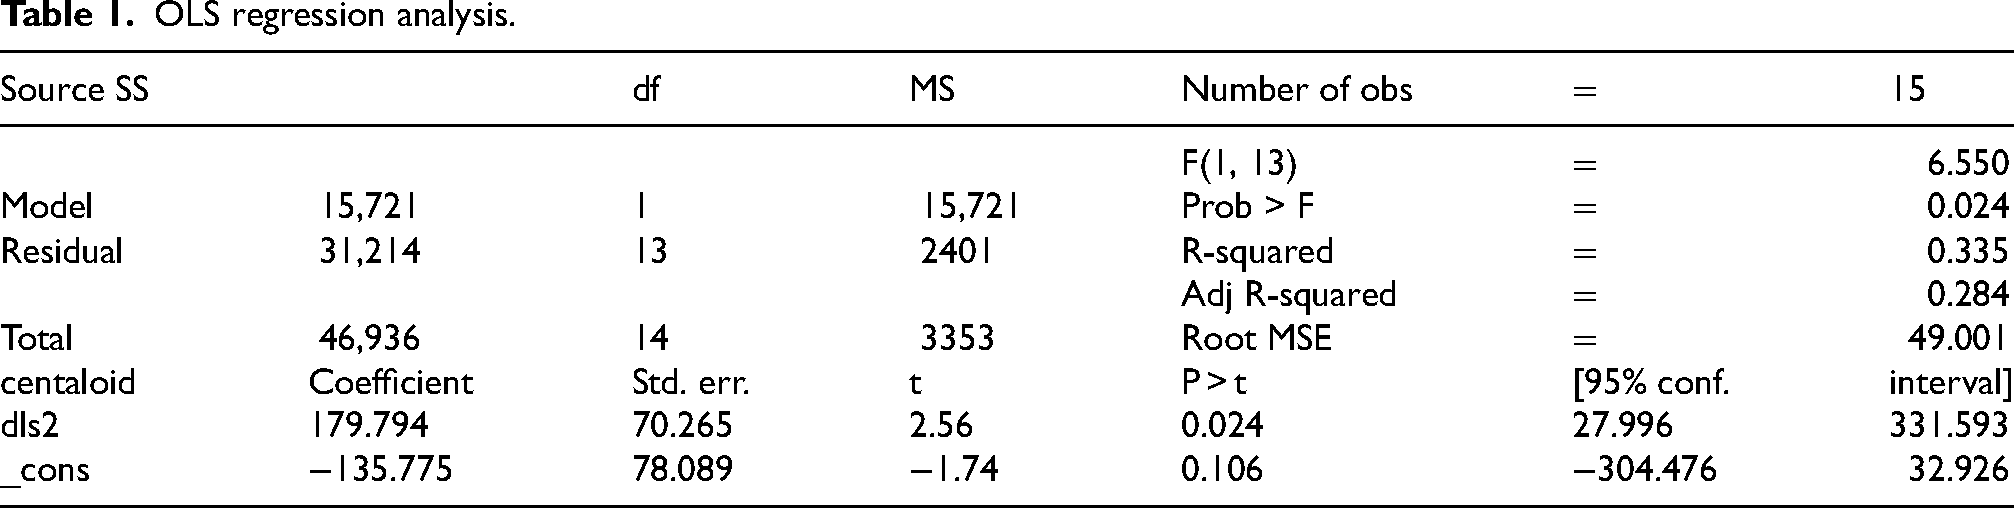
An ordinary-least-squares regression model was estimated where the dependent variable was the Centiloid measurement and the explanatory variable was the raw DLS measurement. This model produced an adjusted R-square of 0.284, indicating that the DLS measurement explained approximately 28% of the variability in the Centiloid measurement. The estimated coefficient was 179.8, which is statistically significantly better than the 5% level (p = 0.024). The coefficient implies that a one-unit change in the raw DLS measurement is associated with a 179.8 unit change in the Centiloid measurement. See Table 1.
OLS regression analysis.
Logistic regression analysis
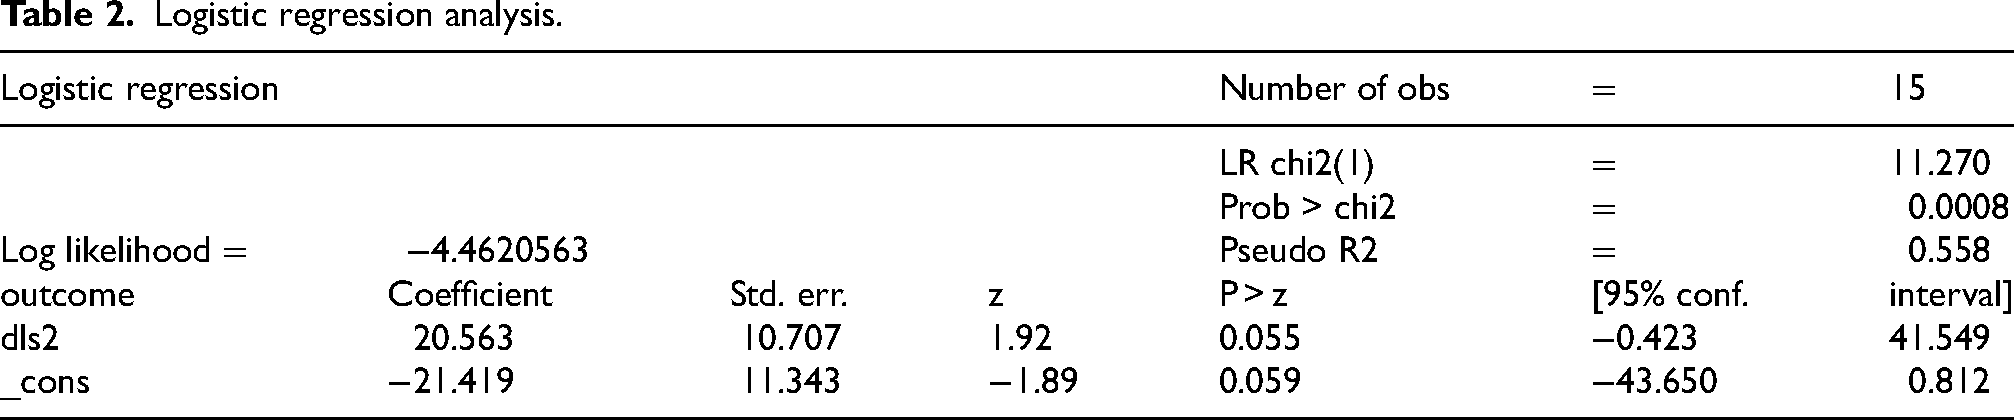
A logistic regression model was estimated where the dependent variable was the positive/negative classification based upon PET amyloid imaging and the explanatory variable was the raw DLS measurement. The model produces a pseudo-R2 of 0.558, indicating that the model explains approximately 56% of the variability in outcomes. The 20.56 coefficient on DLS is significant at the 0.055 level. See Table 2.
Logistic regression analysis.
Post-estimation evaluation of logistic regression model accuracy
Post-estimation, we evaluate the accuracy by plotting an ROC curve and calculating the area under the curve (AUC) (Figure 3). As can be seen by examining the ROC curve, the model is extremely accurate. A naïve model produces a 45-degree line from the bottom left to the top right while a perfect model follow the Y-axis up from 0.00 to 1.00 and then horizontally across from (0.00, 1.00) to (1.00, 1.00). the ROC curve closely tracks the perfect model, indicating a high degree of accuracy. Calculation of AUC confirms the model's predictive accuracy. A naïve model produces and AUC of 0.500, while a perfect model produces and AUC of 1.000. Our model produces an AUC = 0.9352, which indicates that the area under the curve is 93.5% of the total area. This is an extremely accurate model.
Out-of-sample evaluation of logistic regression model accuracy
Finally, we evaluate the accuracy of the model out of sample. Because of the small sample size, it is not feasible to test the model on a hold-out sample. However, we can validate the model using “leave-one-out cross validation” (LOOCV). 23 This is the appropriate methodology for validating small samples. We estimate our model n times, where n is the number of observations (15 in our case). Each time, we leave out one of the n observations, estimating on the remaining (n-1) observations. A predicted value for the hold-out observation is created. We then plot an ROC curve and calculate AUC based upon these out-of-sample predicted values of the dependent variable.
One of the 15 models fails to converge because of quasi-complete separation, so we base our analysis on the remaining 14 out-of-sample predicted values. As can be seen by examining the ROC Curve in Figure 4, the model is extremely accurate out-of-sample—only slightly less accurate than in sample. Our model produces an AUC = 0.9167, which indicates that the area under the curve is 91.7% of the total area. This is almost as accurate as the in-sample results, which produced an AUC of 0.9352.
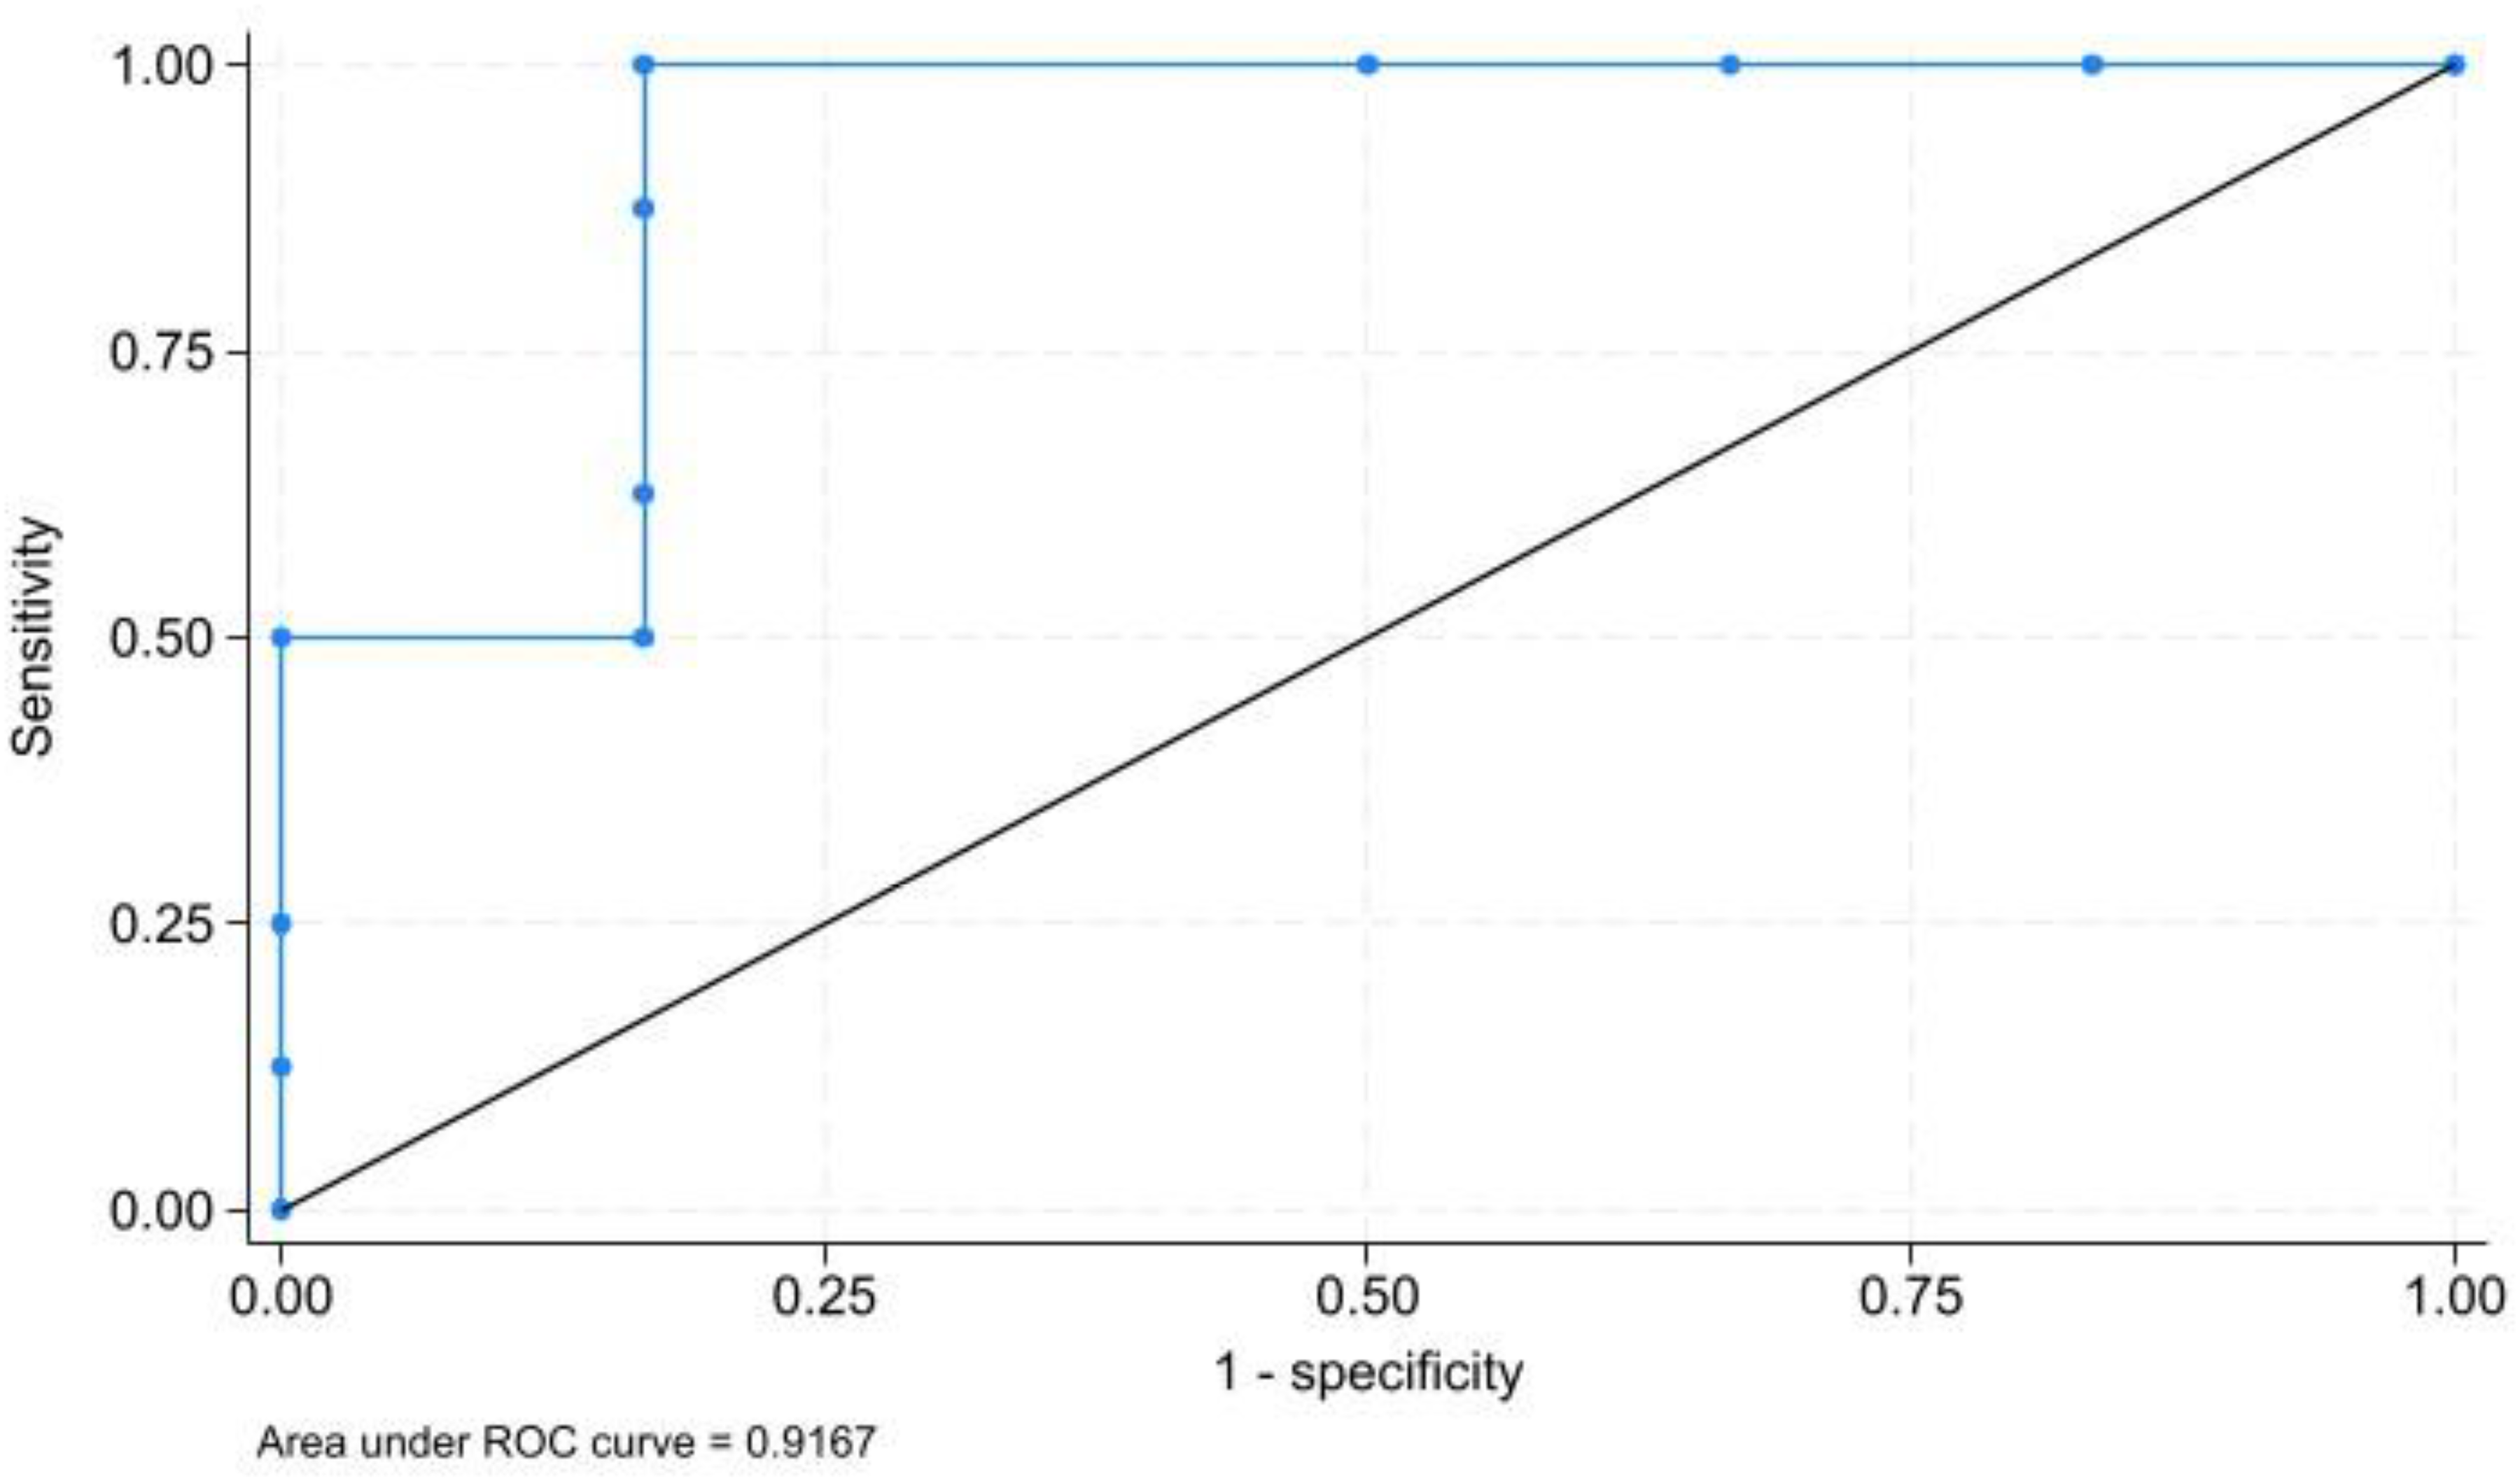
ROC curve and AUC (out-of-sample).
Discussion
Biomarkers, such as PET amyloid scans, cerebrospinal fluid, and blood tests are presently used to diagnose Alzheimer's disease. These tests are invasive, do not offer immediate results, and are expensive. A noninvasive, rapid, inexpensive test with immediate quantitative results would help facilitate earlier diagnosis and access to present treatment options.
Early diagnosis of Alzheimer's disease is important because Alzheimer's disease displays progressive neurodegeneration with a long prodromal phase preceding symptoms. A confirmed diagnosis allows for access to treatment options that slow the progression of symptoms and improve patient outcomes. 24 Current treatment options involve monoclonal antibodies that target amyloid plaque. Lecanemab (Leqembi) and donanemab (Kisunla) are FDA-approved treatments found to slow cognitive decline in early Alzheimer's disease.25–27 An early Alzheimer's disease diagnosis with PET imaging or cerebrospinal fluid testing is needed prior to initiation of treatment.24,25
Diagnosis with amyloid PET imaging allows for detection of amyloid plaque burden at early stages of disease. 28 However, accessibility and high-cost present limitations to PET-CT. Additionally, there may be cases of discrepancy between the visual read and quantitative results. This can be due to multiple factors such as image quality, artifacts, physiologic defects and pathological findings (atrophy, stroke, etc.), and target and reference region selection.29–31 It is estimated that the standardized uptake value ratio may be lowered by 7% when using the entire cerebellum as the selected reference region. 29 A quantitative measurement independent of scan parameters and brain region selection would improve the diagnostic utility.
DLS testing provides a rapid, inexpensive, quantitative result which would make it a valuable diagnostic tool. Our results demonstrated the correlation between DLS measurements and the amyloid PET scan Centiloid score in patients with MCI. However, this study is limited due to the small sample size, and more testing with disparate populations and different neurodegenerative diseases is required. The new DLS instruments nearing completion are non-mydriatic, auto-focusing, with a 3-s measurement duration.
Future testing protocols with larger, more diverse cohorts are being developed to investigate the potential utility of DLS testing in the detection of Alzheimer's disease. The sensitivity and specificity of DLS will determine whether it may become a screening test, or have the ability to replace the present “gold standard” Alzheimer's disease diagnostic tests.
Footnotes
Acknowledgements
The authors wish to thank Dr Christina Oska for her help in preparing the paper.

Ethical considerations
The study was approved by the Institutional Review Board (IRB) of The American College of Regenerative Medicine (Approval Number ACRM-2026-003).
Consent to participate
Written and signed informed consent was obtained from each study participant.
Consent for publication
Not applicable
Author contribution(s)
Funding
The authors received no financial support for the research, authorship, and/or publication of this article.
Declaration of conflicting interests
The authors declared the following potential conflicts of interest with respect to the research, authorship, and/or publication of this article: Jeffrey Weiss is an Editorial Board Member of this journal but was not involved in the peer-review process of this article nor had access to any information regarding its peer-review. The remaining authors declared no potential conflicts of interest with respect to the research, authorship, and/or publication of this article.
Data availability statement
The data supporting the findings of this study are available from the corresponding author. The data is not publicly available due to privacy or ethical restrictions.