
Abstract
The article presents differences in firm-level total factor productivity in the information technology (IT) service firms in India over the period 2000–2016. It is an attempt to study whether technological efforts contribute to productivity differences in the firms in conjunction with several other firm specific characteristics. Controlling for endogeneity in inputs, the estimation of productivity through semi-parametric techniques indicates considerable heterogeneity in productivity across firm types. Technological efforts of firms have a significant impact on the productivity of IT firms. Both embodied technology imports and in-house R&D contribute to higher productivity. While the Indian firms are observed to be more productive compared to their foreign counterparts, the technological efforts also differ due to ownership factors and that contributes to changes in productivity.
Introduction
The growth story of the information technology (IT) industry in India during the last two decades has been a fascinating one. Even without a strong manufacturing base, the industry recorded very high rates of growth. The industry grew to a size of US$177 billion in terms of revenue during the financial year 2018–2019 from US$167 billion in the previous, with a growth rate of 6.1% as per NASSCOM (2019). Over the last decade, from 2010 to 2018, the sector recorded a compounded annual growth rate of 10.45% (IBEF, 2019). In the recent times, the industry’s contribution to Indian GDP stood at around 7.9% in 2017–2018 (IBEF, 2018). Given the high growth rates, there has evolved a significant literature that has attempted to understand the growth of these services with particular focus on software services. Availability of quality workers (Arora et al., 2001; Athreye, 2005; Patibandla et al., 2000), presence of multinational corporations in the industry (Patibandla & Peterson, 2002), active local entrepreneurship for technological upgradation (Parthasarathy & Aoyama, 2006; Parthasarathy, 2010), export market orientation (Arora et al., 2001; Arora & Athreye, 2002; Kumar, 2001), upsurge of institutions providing technical education (Arora & Athreye, 2002; Patibandla et al., 2000) and also governmental efforts to setting up the necessary infrastructure (Arora & Athreye, 2002; Narayanan & Bhat, 2011; Patibandla et al., 2000) are some factors that have been attributed to the industry’s growth. While the growth of the IT industry has been impressive, the crucial factor that helped maintain the industry’s competitiveness is the relative abundance of cheap yet skilled labour in India. Given the context, a relevant question that arises is how the firms in the IT industry would maintain their competitiveness once the pool of surplus labour is exhausted and the cost advantage also erodes.
It is in this context that the importance of maintaining productivity of the industry arises as increased input applications or mere cost advantages are not sufficient in sustaining growth in the long run. Following the works of Abramovitz (1956), Solow (1957) and Griliches and Jorgenson (1966), the total factor productivity growth, also called the ‘residual’, is often said to be a result of some kind of technical progress or technological growth. Even at a micro-level, it has been noted that firms can show different levels of productivity due to variations in generation and distribution of technology (Nelson, 1981). The firm specific shocks to technology, costs of inputs and demand conditions in the industry induce differences in otherwise similar firms resulting in variations in employment and investment decisions and thereby affecting productivity (Bartelsman & Doms, 2000; Syverson, 2011). While innovative efforts within the firm for creation and upgradation of products remain crucial, the differences in access and use of technology also arise from the ownership structure of a firm. Ownership within a firm could either take the form of inflow of foreign investments motivated by the desire to exploit some firm-specific advantage in a different country (Caves, 1974; Dunning, 1977) or affiliation to a business group (Khanna & Palepu, 2000; Khanna & Yafeh, 2007). Thus, sustaining growth in the long run is not just about increase in productivity but also understanding how a host of other factors in turn influence firms’ access to technology and the organizational factors that provide advantages to firms in accessing resources used in production.
The literature on productivity measurement and analysis is vast. In the Indian context, a plethora of studies have analyzed productivity particularly for the manufacturing sector. 1 With the increase in the share of services in Indian GDP, studies in the Indian context have noted improvements in total factor productivity (TFP) of the service sector both at the aggregate sectoral level and at the industry level (Goldar et al., 2014). The role of services has also been noted in increasing the TFP in manufacturing industries (Banga & Goldar, 2007; Mukherjee, 2018). However, not many studies have attempted to understand productivity performance of firms within the service sector. Thus, the specific focus on the Information Technology firms within the service sector distinguishes our study from any existing ones. We particularly focus on the IT services as it is one of the fastest growing sectors within services. Furthermore, across the industry comparison of firms within services will result in a complete neglect of the heterogeneity that exists within them. Earlier studies, particularly related to the IT sector, either have focused on the effect of IT investments within firms and its contribution to productivity (Khanna & Sharma, 2018) or have taken a comparative approach in productivity analysis between firms in manufacturing and services (Rath, 2018). The present article contributes to the existing literature in the following ways: first, it measures total factor productivity of firms in the IT service industry in India and, second, it examines the effect of technological efforts and ownership factors in determining inter-firm differences in productivity. This study uses panel data for a period of 17 years from 2000 to 2016 comprising firms in the IT service industry.
The remainder of the article is organized as follows. The next section gives an overview of the previous empirical studies related to productivity and the factors affecting it, from India and other economies and also observations made specifically in the Indian IT industry. The third section describes our data set. The fourth section presents the empirical approach and the method involved. The fifth section presents the results and the last section concludes the study.
Related Empirical Evidence
The importance of the effect of technology on productivity finds its roots in the neo-classical framework of estimating production functions. Griliches (1979) is a seminal work that incorporates research and development expenses as contributing to the stock of technical knowledge, in the production function framework, in addition to the traditional inputs of labour and capital to arrive at a measure of productivity. Following the above framework, the efforts of firms to expand knowledge base and propel innovation are an important source of technological progress, which in turn contributes to productivity.
Empirical works that relate productivity and technological efforts are extensive, but for the purpose of our study, we broadly divide them in two sets. The first set of studies are those that view productivity as a result of technological advances made through access to better knowledge sources. One of the primary ways firms add to its stock of knowledge is through its R&D efforts. In the Indian context, studies have found mixed evidence of the effect of R&D on productivity. While some studies find R&D to be favourable (Ferrantino, 1992; Raut, 1995; Satpathy et al., 2017), there are still others that find weak or no support for effect of R&D on firm productivity (Basant & Fikkert, 1996; Hasan, 2002; Sharma, 2014). Such a finding could be indicative of how R&D in the Indian context has often been argued to be of adaptive nature rather than fundamental research. Specifically, in the case of Indian IT sector, it has been noted that in-house R&D investments are low compared to the developed countries (Radhakrishnan, 2006). On the other hand, Narayanan & Bhat (2011) note that the large firms and multi-national corporations in the IT sector in India have relatively larger investments in R&D so that they are able to participate in the international markets. Technology is also sourced through other channels besides the in-house research efforts. It has been observed that firms from developing countries such as India depend on import of technologies to have a competitive advantage over their rivals (Lall, 2001). These imported technologies can be either in embodied or disembodied form. Firms acquire embodied technology generally in the form of capital goods import. These capital goods are usually based on modern design and technologies. The productivity of firms that import is higher than that of the non-importing firms, as they can receive better capital goods and technology compared to the latter (Hasan, 2002; Sahu & Narayanan, 2011; Xu & Wang, 1999). On the other hand, disembodied technology is acquired though import of designs, drawings, blueprints and formulae against a payment of royalty and technical fee. These technologies are assimilated in the existing production process to have a better quality of output. Sahoo (2013) in studying the Indian software industry finds that firms that spend on disembodied technology have higher productivity growth than those that spend less. However, Narayanan and Bhat (2011) note that although the large corporations in Indian IT industry frequently import capital goods, it does not seem to have a significant impact on their decision to invest abroad.
The second set of studies focus largely on the firm characteristics and how these in turn affect technology accessibility. Technology transfer involves a large amount of tacit and firm specific components. In order to avoid spill-over and diffusion of their expensive and newly evolved technologies, multinational corporations support the internalised transfer of technology. As such, firms prefer foreign direct investment to purchases through the market (Siddharthan, 1992). Underlying this idea is also the expectation that foreign inflow of investments into domestic firms results in knowledge spill-overs into the subsidiary firms. Such investments would bring in the new capital and new management techniques and tacit skills and thereby, contribute to increase in productivity. However, the findings of the empirical studies linking productivity and foreign ownership are mixed. While there are studies that find that foreign owned firms have higher productivity compared to the domestic ones (Bottasso & Sembenelli, 2004; Griffith et al., 2004a; Harris & Robinson, 2003; Temouri et al., 2008), there are others that do not find a clear support for such a relationship (Javorcik, 2004). It is argued that foreign firms might keep most of the high value-added operations at home and concentrate the low value-added operations in the host nation (Doms & Jensen, 1998). Studies related to the service sector also note a differential performance of the firms that have foreign presence in them. Griffith et al. (2004b) also found that firms with foreign presence have a relatively higher share of R&D activities. With the advent of globalization, India has also seen the entry of multinationals in different industries. For firms in the Indian IT sector, studies find that foreign equity participation favourably affects the performance of firms in the international market (Narayanan & Bhat, 2011; Siddharthan & Nollen, 2004).
In addition to foreign involvement, tacit transfers are also facilitated among firms that belong to a particular business group. In the context of emerging economies such as India, with comparatively weak capital and labour markets, the role of business groups has become critical in providing access to information within a particular network of firms in order to avoid spill-overs into the market (Khanna & Rivkin, 2001). Lamin (2013), in his study on Indian IT firms, argues that the importance of business groups continues even as the markets in emerging economies become efficient as these group ties become suitable conduits of information exchange regarding new market developments and opportunities.
Not just technology transfers but also cost minimizing efforts of the firms in the form of outsourcing is an important contributor to productivity changes. Bhagwati et al. (2004) argue that outsourcing contributes to improvement in productivity when low priced service inputs, which are being outsourced, are used as intermediate inputs. While theoretical arguments point towards an increase in productivity due to outsourcing, the empirical evidence show mixed results. Girma and Görg (2004) for UK manufacturing firms, Görg et al., (2004) for Irish manufacturing firms, de Groot & Möhlmann (2013) for Dutch manufacturing firms and Schwörer (2013) for firms in several European countries found a positive association between outsourcing and productivity. On the other hand, Egger & Egger (2006) found a negative productivity effect of outsourcing in the short-run and a positive effect in the long run for European manufacturing sectors. Amiti & Wei (2004) found no impact of outsourcing materials on productivity for US manufacturing firms. Other sets of studies that further look into the nature of outsourcing also have mixed findings. Görg et al. (2004) for Irish manufacturing firms did not find a clear benefit of outsourcing services and majority of these services procured were regarded to be of inferior quality. Schwörer (2013), however, notes a positive effect of outsourcing of service and non-core activities for European countries. Mukherjee (2018) finds that outsourcing of services played a positive role in boosting manufacturing productivity growth in India.
Export market participation is an indicator of the competition faced by firms due to outward orientation. To be able to export, a firm needs to invest in developing a product or service that not only caters to the international market but also is better compared to that produced by other firms world-wide. The literature on export market participation and productivity can broadly be divided into studies related to self-selection and learning by exporting. Self-selection hypothesis postulates that firms oriented towards the international market are more efficient than those focusing on the domestic market primarily (Bernard et al., 2003; Girma et al., 2004). Thus, the more efficient firms cater to the export market. On the other hand, there are studies, which emphasise the importance of induced gains from export market participation, which has positive effects in the form of increased competition and technology transfer, also referred to as the phenomenon of learning-by-exporting (Bernard et al., 2003; Greenaway & Kneller, 2007). Hence, whether firms self-select or learn from exporting, there are positive effects of exporting on productivity growth.
The best practice levels of technology, management and marketing requires new skills, more advanced and varied than those needed to serve domestic markets. If the production structure has to shift from simple to complex, technology-intensive activities, skills need to grow broader and more demanding (Lall, 2000). Specifically, in the case of IT firms, to deal with international clients especially from the technology forerunners, the Indian firms require high level of skills. Kapur (2002) notes that the abundance of skilled professionals in India is capable of catering to the demands of the IT sector. Although the industry benefits from cheaper labour, off-shoring of work from developed countries and increased exports, the higher levels of attrition in the firms require them to compensate the workers with higher salary packages and other benefits in order to maintain the skill level of the workforce within the firm (Arora et al., 2001; Kumar, 2001). Studies have found that firms in the IT industry with higher investments on skilled employees favourably affect those firms that participate in the international markets through exports as well as overseas investments (Narayanan & Bhat, 2009, 2011).
Most of the studies mentioned above have largely focussed on the manufacturing sector, be it at the aggregate or at the firm level. A reason for this could be the limited availability of data sets for service sector at the micro-level. Even when such data sets are available, comparison of services across sectors is difficult in terms of defining output and a clear separation of the factor inputs. However, in an economy such as India, where the growth is dominated by services, it becomes important to understand performance of the set of firms within the sector, as it would have further implications on the growth of the economy.
Data and Variables
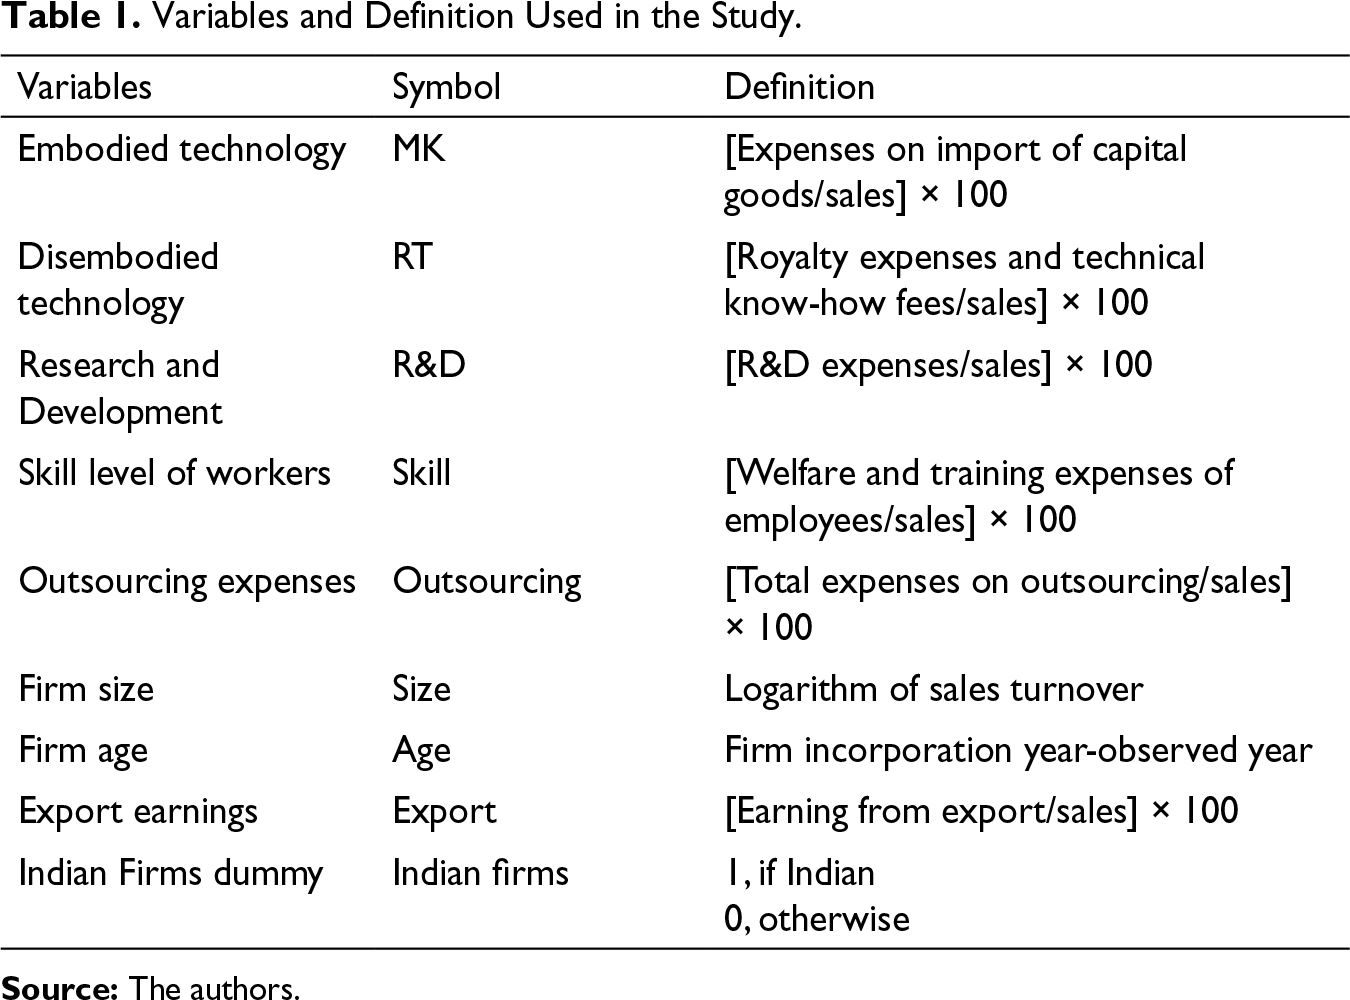
Variables and Definition Used in the Study.
Distribution of Firms in Information Technology Services.
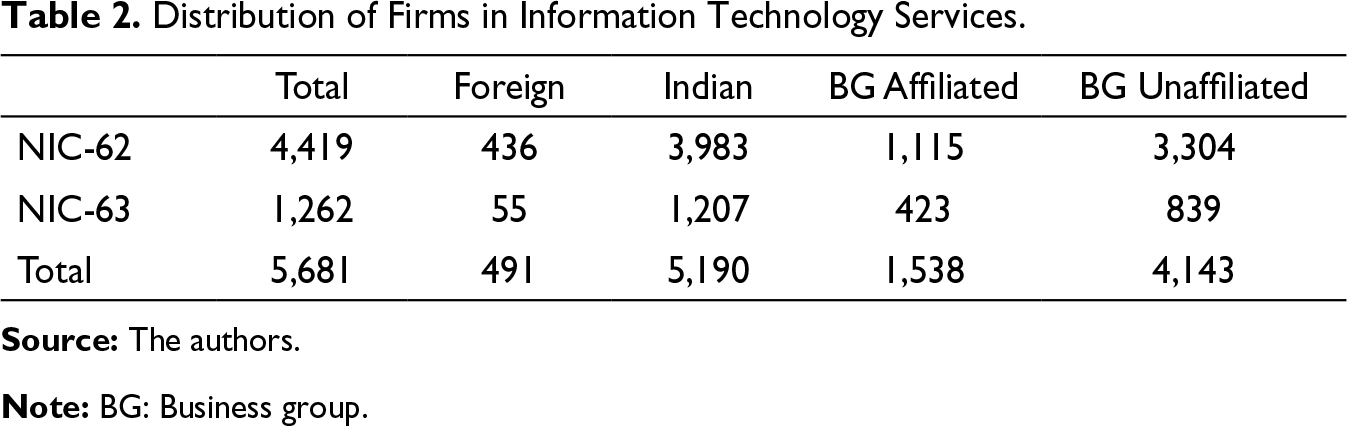
Note: BG: Business group.
Econometric Method and Estimation Issues
The main form of analysis will focus on production functions from which TFP levels are estimated to understand the trend in productivity. The standard estimation technique describes the process in terms of a production function, which is affected by other factors as observed in the literature, such as technology transfer, foreign presence and other firm characteristics. This essentially involves estimation of the following equations:

Where yt, lt, et, kt and mt are the logarithmic form of the firm’s output, labour, energy, capital stock and intermediate inputs, respectively. lt, et, mt are the freely variable inputs, and kt is a state variable. 2
One of the hurdles of measuring firm level productivity using regression technique is the potential correlation between input levels and unobserved productivity shock. These unobservable factors affect the use of production inputs, and consequently, the use of these inputs are determined endogenously. The inclusion of a proxy that controls for the part of the error term correlated with inputs ensures that such bias is eliminated (Levinsohn & Petrin, 2003; Olley & Pakes, 1996). We use the Levinsohn and Petrin (2003) method under, which intermediate inputs are used as proxy for controlling the unobserved productivity shocks. A common measure of intermediate inputs is the expenditure incurred on raw materials. Given the nature of our industry, we do not have sufficient information on the kind of raw materials used, and as such, we use the communications expenditure as a proxy.
Once the input coefficients are obtained and the TFP values are estimated, we construct a productivity index as used in literature (Aw et al., 2001; Pavcnik, 2002; Topalova & Khandelwal, 2011). This methodology ensures that the productivity index has the desired properties of transitivity and insensitivity to the units of measurement (Pavcnik, 2002). The hypothetical firm approach provides an unambiguous basis for comparison for observation, which have no natural ordering (Good et al., 1996). The productivity index is obtained by taking a deviation of firm i’s productivity from the productivity of the reference firm in the base year. The reference firm is constructed from the mean output and input levels in the base year. The productivity index is calculated as the logarithmic deviation of a firm from a reference firm’s productivity in the base year. In other words, we subtract the productivity of a firm with the mean log output and mean log input level in 2000–2001 from the estimated firm level TFP,

Where, 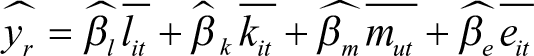
where the bar over a variable indicates a mean over all plants in a base year. Hence, yr is the mean log output of plants in our base year 2000, and is the predicted mean output in 2000.
To examine the effects of technology transfer and firm’s ownership in determining the productivity differences across firms, we estimate the following model:
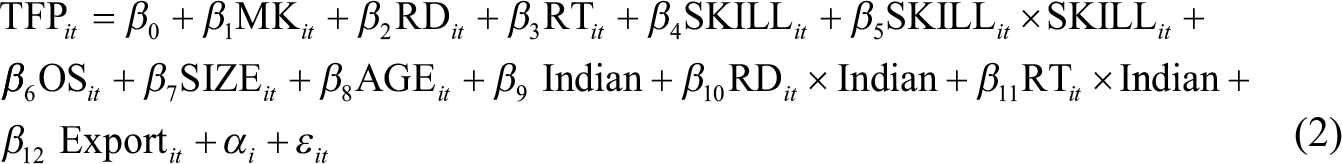
We also use additional firm specific variables such as firm size and age as controls in our estimation. TFP it used in the above equation is the productivity index that is calculated through the steps mentioned above. The model is estimated over the period 2000–2016 using a panel data fixed effects estimation. The fixed effect estimation method addresses the concern of omitted variable that is caused by unobserved firm characteristics. A firm level data set spread over such a long period could be suffering from potential heteroscedasticity or cross-sectional dependence. The correction we use is a fixed effects regression with Driscoll & Kraay’s (1998) standard errors. This correction method assumes that the error structure could be heteroscedastic, autocorrelated up to some lag and possibly correlated between the groups. The non-parametric covariance estimator provides consistent standard errors robust to these problems.
Empirical Results
This section provides the estimates from the production function estimation obtained from the different methods, the descriptive statistics from various cross tabulations and also the econometric analysis that is being carried out using a fixed effects model to analyze the effect of the relevant variables on the productivity of the IT service firms.
Production Function Estimates
Comparison of Production Function Estimates from Different Approaches.
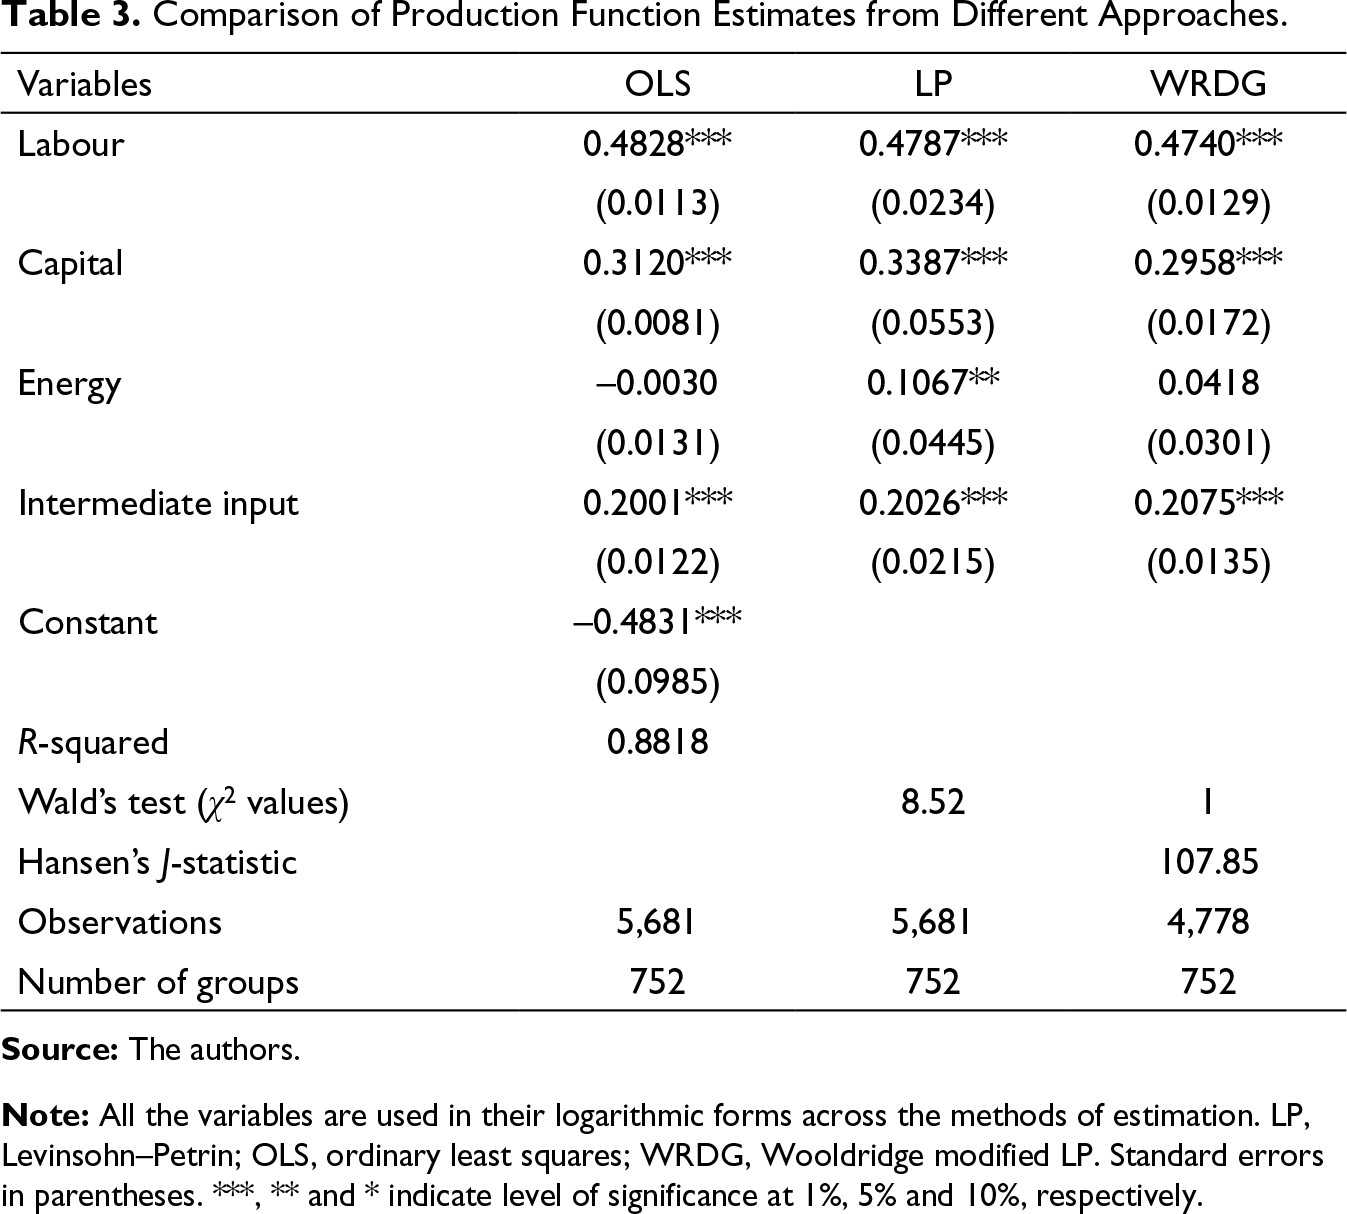
Note: All the variables are used in their logarithmic forms across the methods of estimation. LP, Levinsohn–Petrin; OLS, ordinary least squares; WRDG, Wooldridge modified LP. Standard errors in parentheses. ***, ** and * indicate level of significance at 1%, 5% and 10%, respectively.
In our estimation of the production function, we use the gross output specification. Table 3 presents the estimates of input coefficients that are obtained from the different methods used. Since all the inputs are considered in their logarithmic form, their estimated coefficients can be interpreted as their elasticities. The output of the IT service firms is more elastic to labour than the other inputs. This is probably because much of the product or services provided by these firms require the use of skilled labour. The coefficient of labour is found to be the highest, irrespective of the methods used. We note that the capital coefficient is underestimated in the OLS model. These results are broadly consistent with the idea that OLS will tend to overestimate the labour coefficient and will usually underestimate capital coefficient (Levinsohn & Petrin, 2003). The higher elasticity of output with respect to labour is reflective of the argument across the literature for software and IT services that growth in the sector is largely driven by the abundance of cheap yet skilled labour in, India making it an attractive destination for off-shoring work from the developed countries. As can be seen in Table 3, for the WRDG (Wooldridge modified LP) approach although the coefficient estimates are similar to that under the LP approach and though it attempts to correct the timing issue of the labour coefficient under the LP approach, the high value of Hansen’s J-statistic raises concern on the validity of the instruments used. The null hypothesis of the test is that the population moment conditions are correct. However, the rejection of the null implies that the instruments are not satisfying the orthogonality conditions that are required for their employment. This could be because the instruments are not truly exogenous and consequently, the estimated input coefficients might not be reliable (Baum et al., 2003). Furthermore, while each of the methods correct upon the assumptions of the previous versions, studies have shown that none of the extensions or alternatives are superior to the other in all cases and that the estimates are sensitive to the data and assumptions used in the estimations (Rovigatti & Mollisi, 2018). Hence, for the purpose of further analysis, we use the productivity estimates obtained under the LP approach.
Descriptive Statistics
Mode of Technology Sourcing, Average TFP Levels, Share of Indian Firms, BG Affiliated Firms.
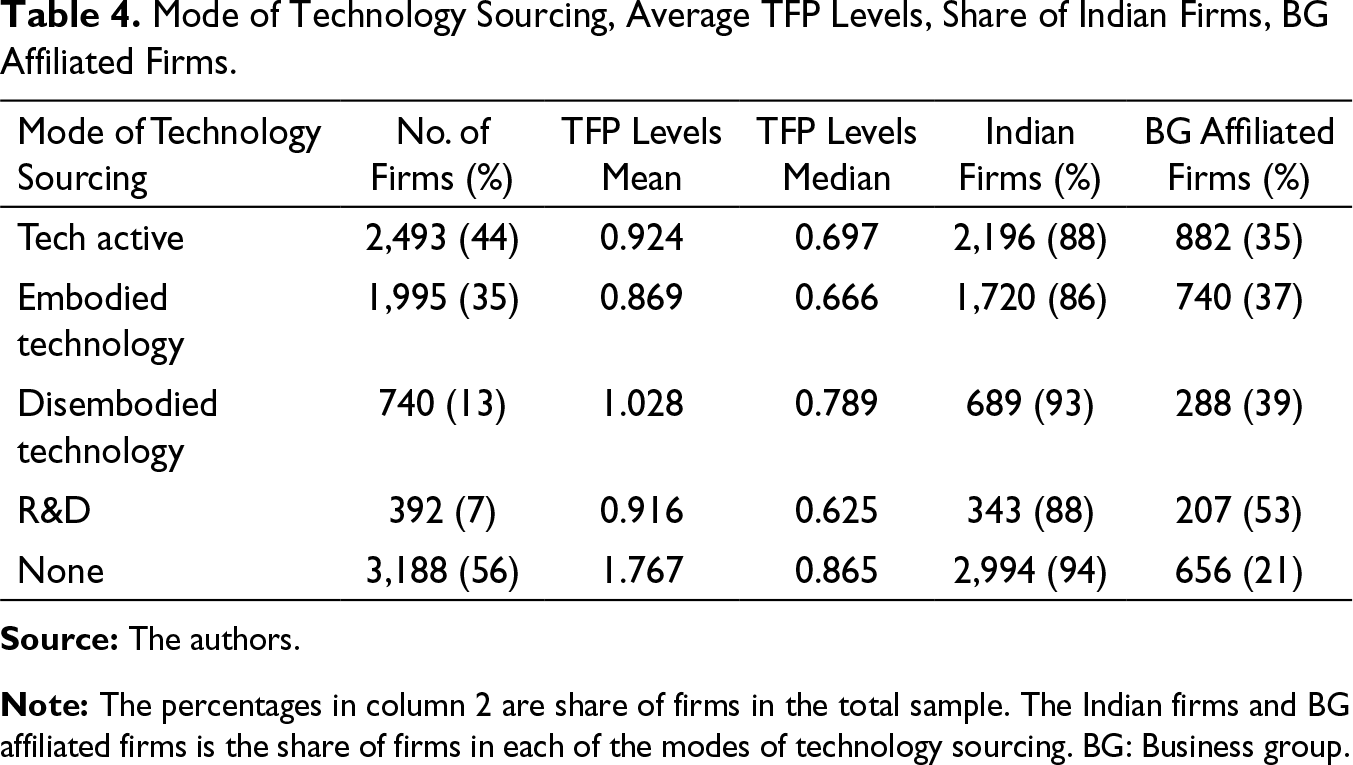
Note: The percentages in column 2 are share of firms in the total sample. The Indian firms and BG affiliated firms is the share of firms in each of the modes of technology sourcing. BG: Business group.
Studies related to micro-datasets explain that there are firm specific characteristics that contribute to the underlying heterogeneity in productivity of firms (Syverson, 2011). In the next set of figures, we compare the productivity levels of the firms taking into account various characteristics such as foreign presence, business group affiliation, outsourcing and skill levels.
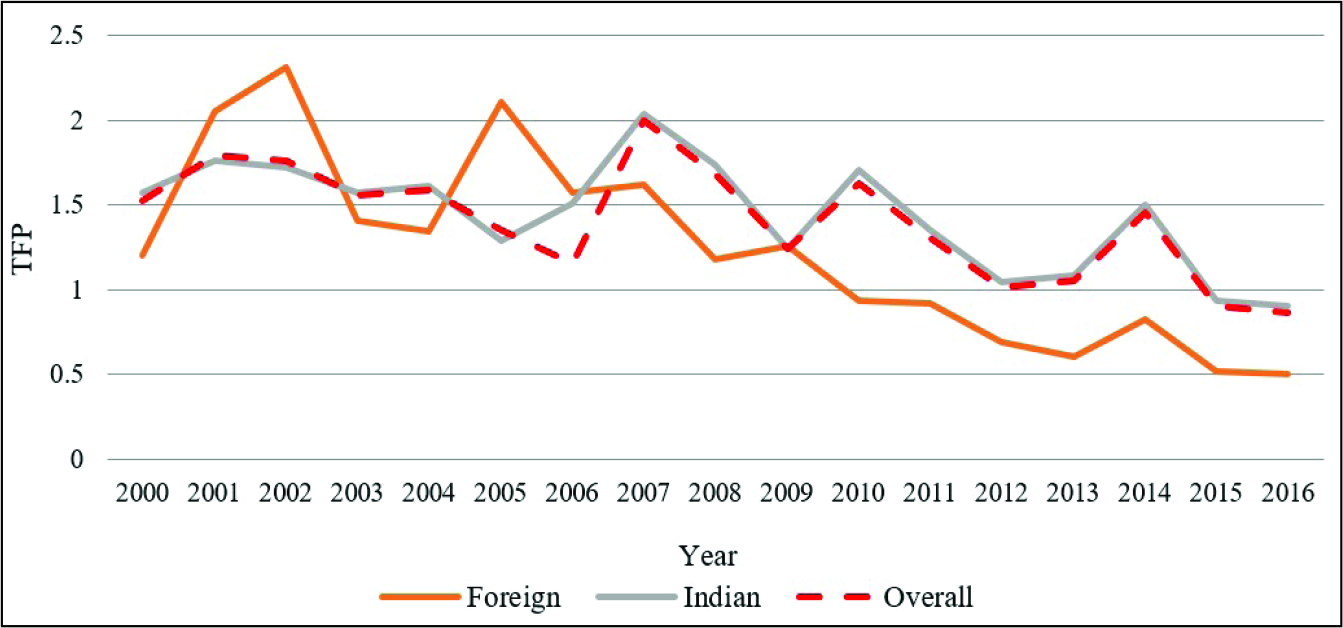
Figure 1 shows the productivity levels of the foreign and Indian firms. The overall trend in productivity levels show a fall towards the end of the period, mostly after 2007. As has been noted earlier, the share of foreign firms is comparatively lower than that of the Indian firms and consequently much of the changes in the average productivity levels are driven by the changes in productivity levels of Indian firms. The fall in average productivity levels of the foreign firms is even higher compared to the overall average as well as that of the Indian firms.
As can be seen in Figure 2, throughout the study period, it is the firms that are unaffiliated to business groups that have higher productivity levels compared to firms that are affiliated to business groups. The overall trend in productivity follows that of the unaffiliated firms and this is likely owing to the fact that the nearly 73% of the firms in the sample are unaffiliated to any business group. A fall in productivity levels of the unaffiliated firms is also noticeable for these firms in the post 2007 period while that of the firms affiliated to business groups has been roughly stable except for the period 2007–2009 and post 2014. While Lamin (2013) argues that business groups in the case of software firms continue to play an important role, he also acknowledges that not all affiliations would be as beneficial. The lower productivity levels of the firms affiliated to business groups could then imply that the firms are not benefitting from such ties. However, this does not diminish the importance of business groups for our sample of firms since it is this category that includes some of the popular giants of the industry such as Aditya Birla Minacs IT Services Ltd., Tata Infotech Ltd., Tata Consultancy Services Ltd., Wipro Ltd., ITC Infotech India Ltd. and HCL Technologies Ltd., among others.
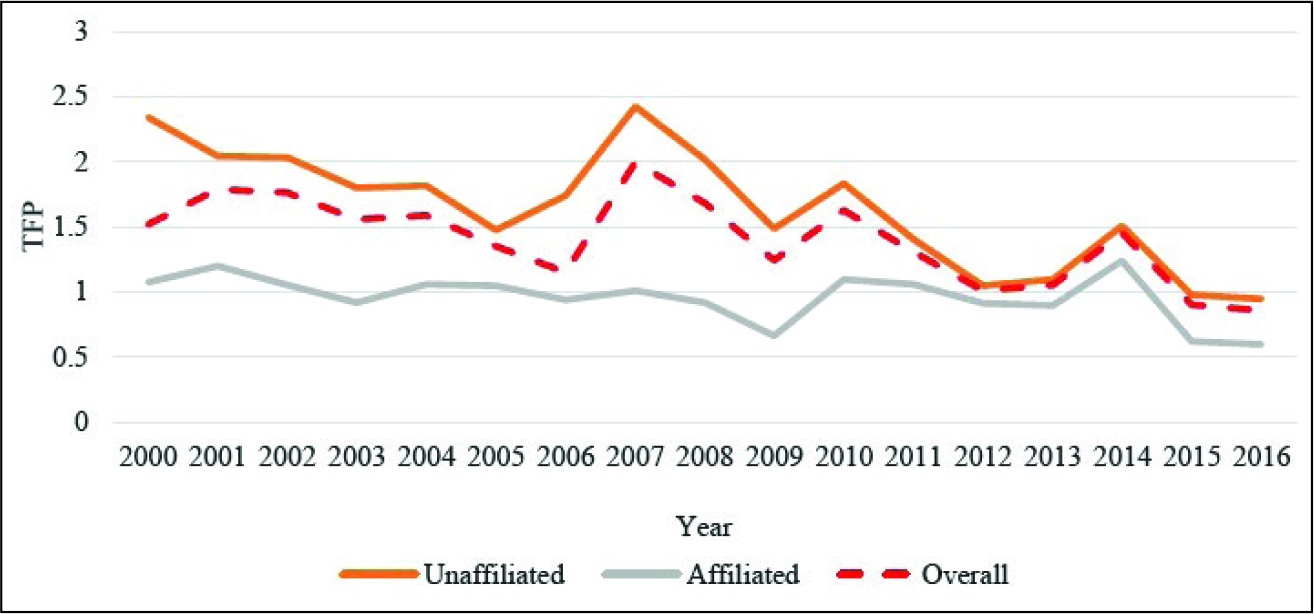
The above figures also indicate that changes in policy and economic environment have been crucial in the performance of the IT services industry. In the period up to 2007, there is an improvement in the productivity levels and this could be due to the Information Technology Act of 2000 that was implemented in 2002. For a sector that is driven by the external demand, the global recession does bring down the productivity levels of the firms in the sector and there are signs of recovery post 2009. From 2009 to 2014, there is slight improvement in the productivity levels although it falls thereafter, which could be a result of the increased emphasis of the government to revive manufacturing sector growth.
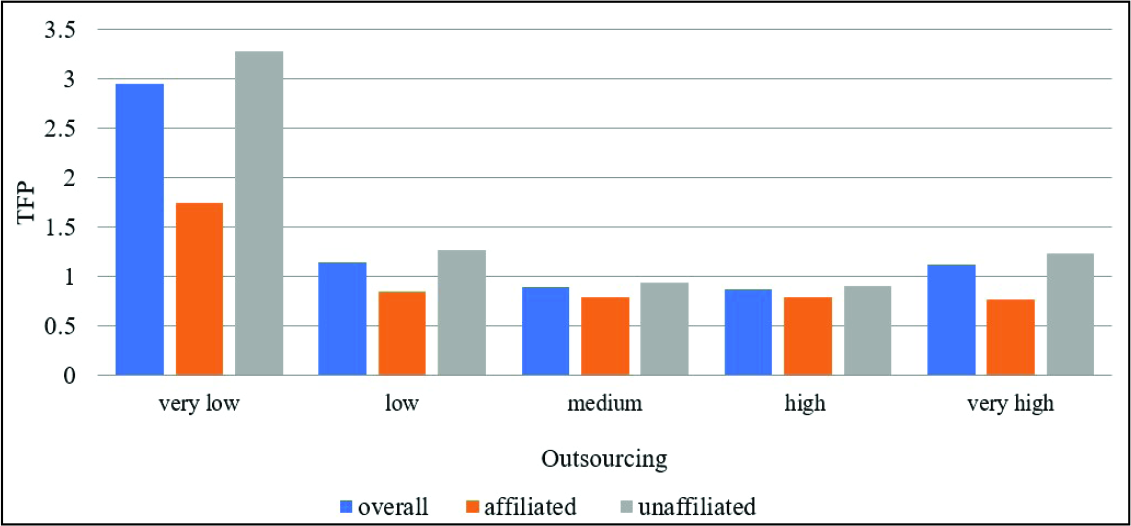
An interesting aspect of the sector is the extent of outsourcing that takes place in the industry. Almost all firms in the sample report a positive level of outsourcing irrespective of their sizes. The average share of outsourcing is around 7% for the entire sample. The outsourcing that takes place is either for manufactured jobs or professional jobs or services. Among them, the outsourcing of services constitutes the major chunk (as high as 95% and very few firms have outsourced manufacturing jobs) of the total outsourcing expenditure. In our analysis, we consider the sum total of the outsourcing expenditure. On dividing the sample of firms on the basis of their outsourcing expenditures, we find that the average productivity levels fall as the outsourcing expenditure of the firms increase (Figure 3). It indicates that the more productive firms outsource less compared to the firms that have low productivity.
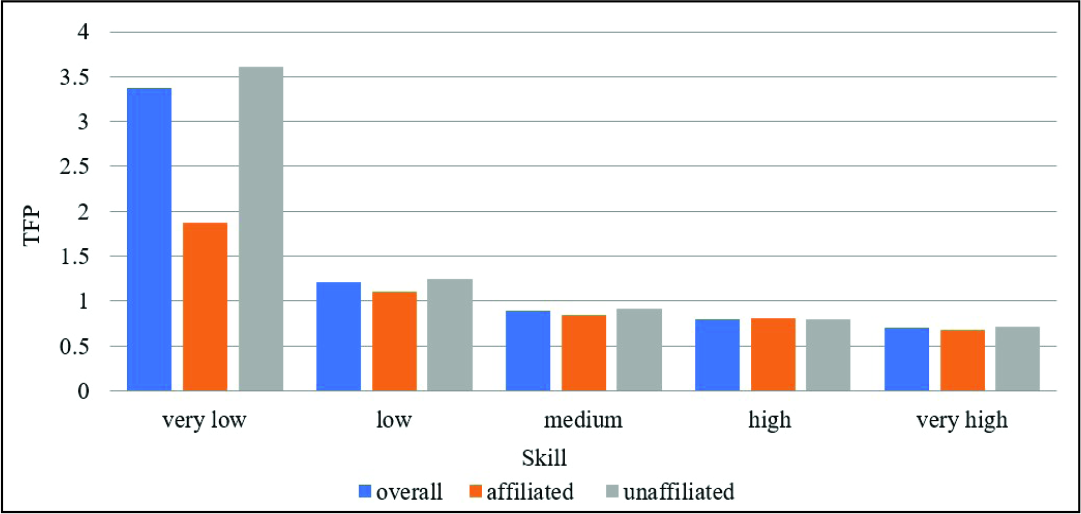
Being an industry that demands high level of skills of the workforce, it is likely that skill intensity will also have an impact on the productivity levels. In the present analysis, the skill level is measured by the welfare and training expenditures the firms incur as a proportion of sales. Classifying the sample on the basis of skill levels, we rather find an inverse association of the productivity levels with the skill intensity of the firms (Figure 4). The average productivity levels falls as one moves from the set of firms that have very low skill intensity to firms that have high skill intensity. While the average productivity levels for the firms that are affiliated to business groups remain relatively lower than the unaffiliated firms, as was previously observed, the pattern of a lower productivity level for the high skill intensive firms is noticed even for the affiliated set of firms.
Regression Results
Following the descriptive statistics and the cross tabulations presented in the previous section that helped in the formulation of expected signs, in this section, the results from the regressions are presented. As mentioned earlier, for the purposes of the regression analysis, we convert the productivity levels to an index as it helps in a comparison of the productivity relative to the hypothetical firm in the year 2000. Table 5 provides the regression results.
Regression Results (dependent variable—TFP index).
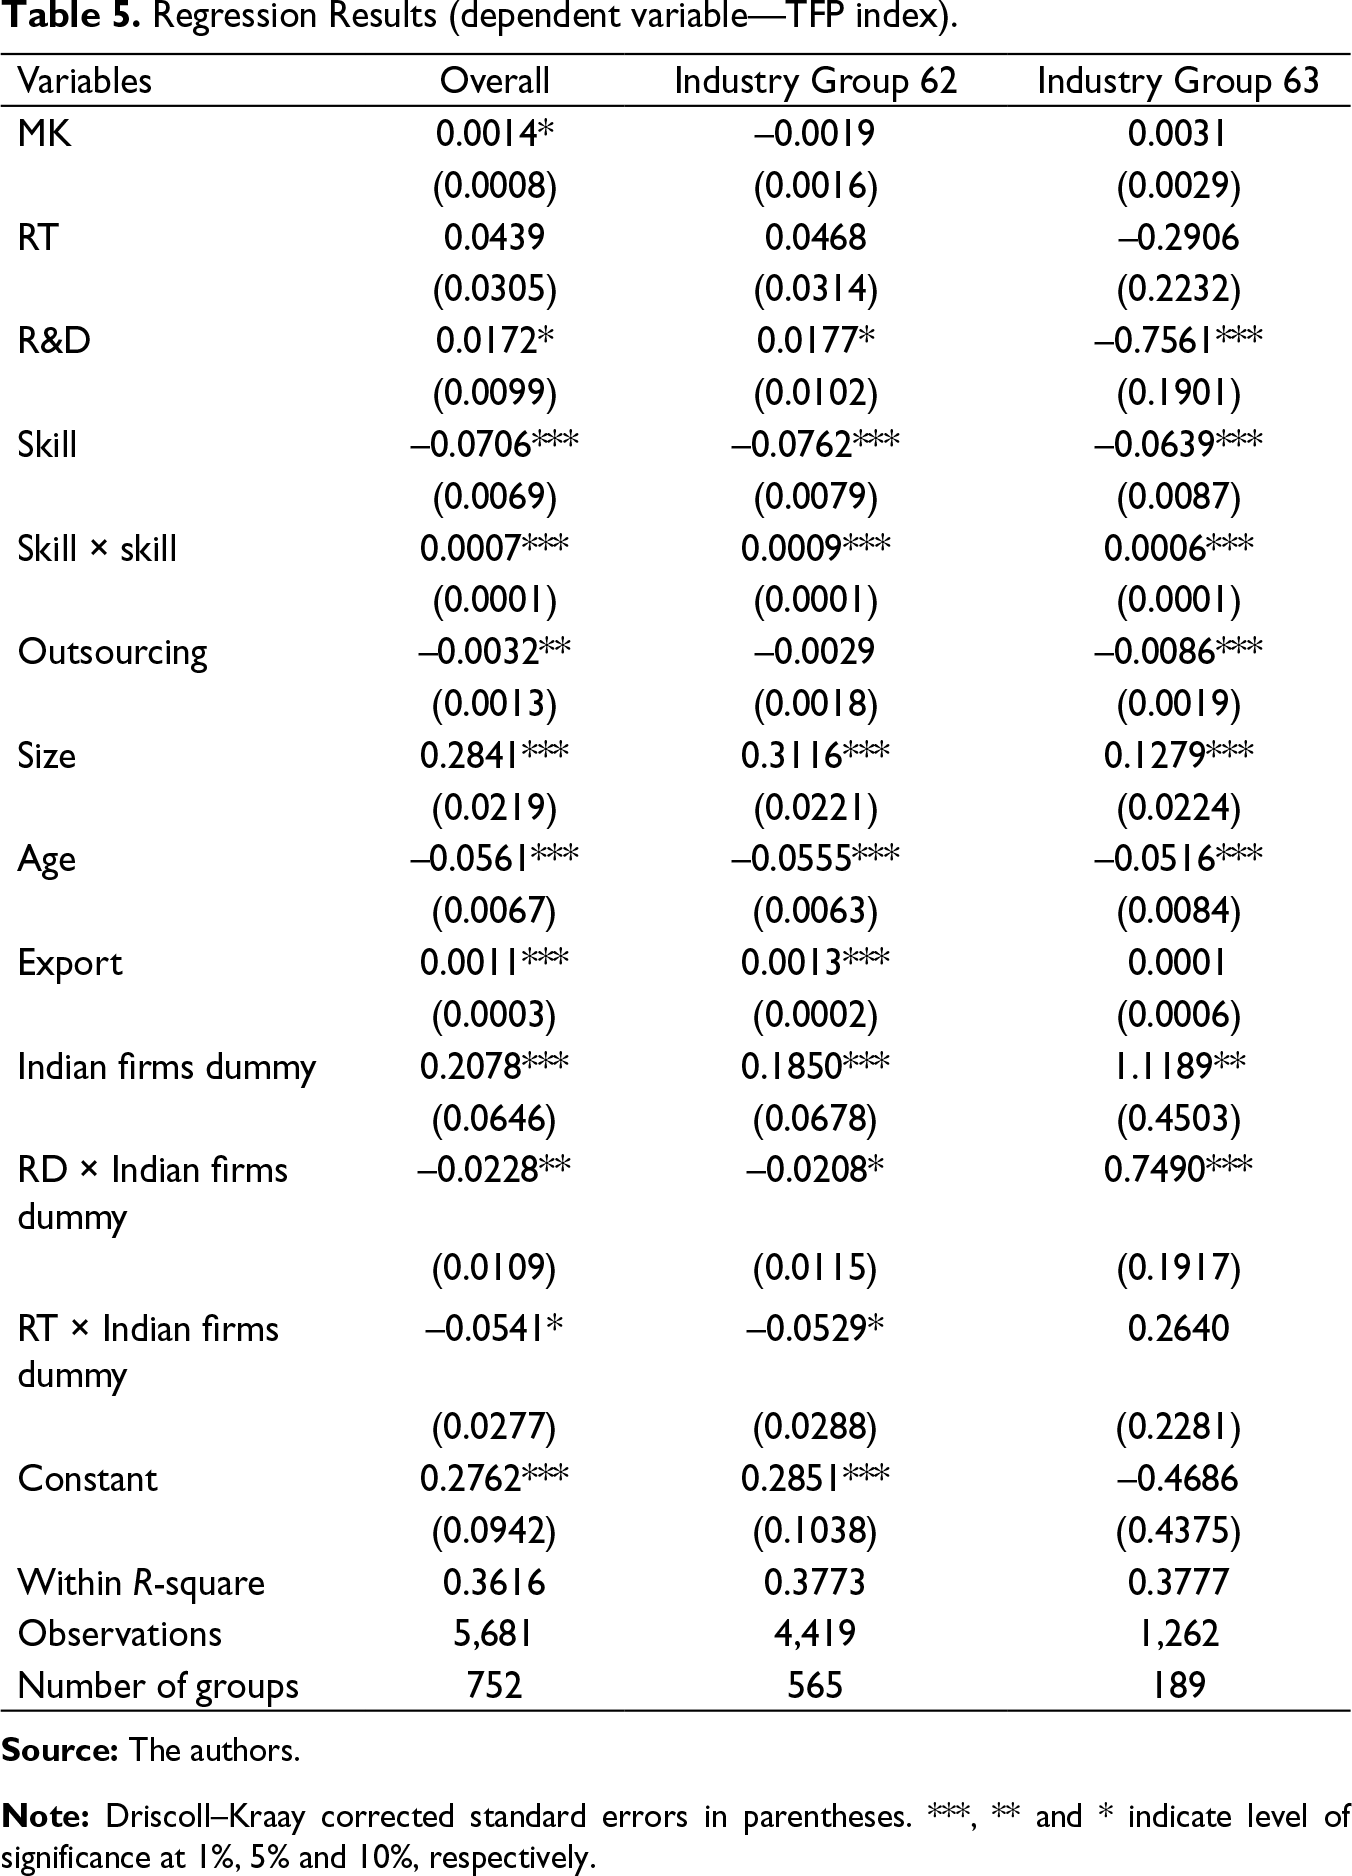
Note: Driscoll–Kraay corrected standard errors in parentheses. ***, ** and * indicate level of significance at 1%, 5% and 10%, respectively.
Although lesser share of firms undertake research expenditures, the coefficient for in-house R&D turns out to be significant and has a positive effect on productivity. It indicates the importance of such expenditures in an industry that has been evolving swiftly. Studies particularly related to innovation in the IT sector in India also note an increase in technological competence over time (Joseph & Abraham, 2005). The development of any new software involves different stages in terms of requirements analysis, designing, coding, installation, testing and post-production support. Most of the innovation is said to happen in the earlier stages compared to the lower ones involving coding and other processes. 3 In our analysis, given the data, we cannot comment on the nature of R&D in the sample. However, an interesting finding is that the positive effect on R&D holds only for those set of firms that have foreign investments in them. On the other hand, the negative coefficient of the interaction term between R&D and the Indian firms’ dummy means that the Indian firms are not able to engage in innovative activities that are able to contribute effectively to increase in productivity, although the size of the coefficient is small, as given by 0.0172 – 0.0228= −0.0056. A similar negative coefficient for the interaction of the disembodied technology with the Indian firms dummy shows that these firms, despite access to proprietary technology, are not able to effectively assimilate the new technology in their work process to produce improved quality services and have a higher productivity. In line with the literature on foreign involvement, these set of results also underline the importance of knowledge transfers that happen within firms that have inflow of foreign investments Thus, the IT industry in India, from a low-end service provider, is gradually moving into creation of new products and quality services to cater to the changing demands in the market over time.
In line with the observations in Figure 1 on average productivity levels, the dummy for Indian firms is noted to be positive and significant implying a higher productivity growth of these firms. A parent company invests in another host country only when faced with some advantages in foreign land; the relatively lower share of investments flowing into the IT industry firms could result from the already existing comparative advantage for these set of firms in the form of surplus skilled labour that is capable of providing their clients with competitive products and services.
While the cross-tabulations showed a negative relation between skill and productivity, the results from regression analysis showed that the relationship takes a non-linear form; we observe a U-shaped form. It implies that there is a threshold level of skill beyond which the productivity of the firm increases. The development of newer software products and services demands skills that are updated with the latest available techniques, and thus, better quality of these services provided by the firms are reflected in their higher productivity levels. Our results find support in the prior observation made in the IT industry, where firms are required to undertake training and other welfare expenses not only to compensate workers and keep the worker attrition low but also to keep the skill level of the workers updated to meet the swiftly changing demands of the industry (Athreye, 2005).
The negative significant coefficient for outsourcing implies that firms that are outsourcing have lower productivity. This finding is similar to the observations in Figure 3. A possible reason for such a relationship could be that firms outsources their work in order to cut down the costs in the production process, and it is likely that the effect of such an expenditure would affect their profitability and need not reflect in productivity increase.
Firm specific characteristics such as size and age also turn out to be significant. The positive effect of size on productivity growth implies that the larger firms have higher productivity growth compared to the smaller ones. Bigger firms are likely to be endowed with more resources and hence are able to put in more efforts to acquire technology. The relatively easier duplication of software products enables large firms to reap economies of scale, cut their costs of production, and thus, have higher productivity. A similar effect of firm size influencing productivity growth was noted in prior study of software firms in India (Sahoo, 2013). On the other hand, the negative effect of age, which was also observed in the previous tabulations reflects that the younger firms have higher productivity compared to the older ones. Because the technology in the IT industry is rapid and fast changing, it is likely that the newer firms, which are equipped with better knowledge of the upgrading techniques, are able to create newer software products and other IT services. Some studies related to the IT industry however, do not find significance of firm age and argue that in an industry where the product cycle is short, the experience gained over time is not likely to give extra advantage to the older firms unless they keep updating their knowledge base (Narayanan & Bhat, 2011).
Regression Results for Sub Samples (dependent variable—TFP index).
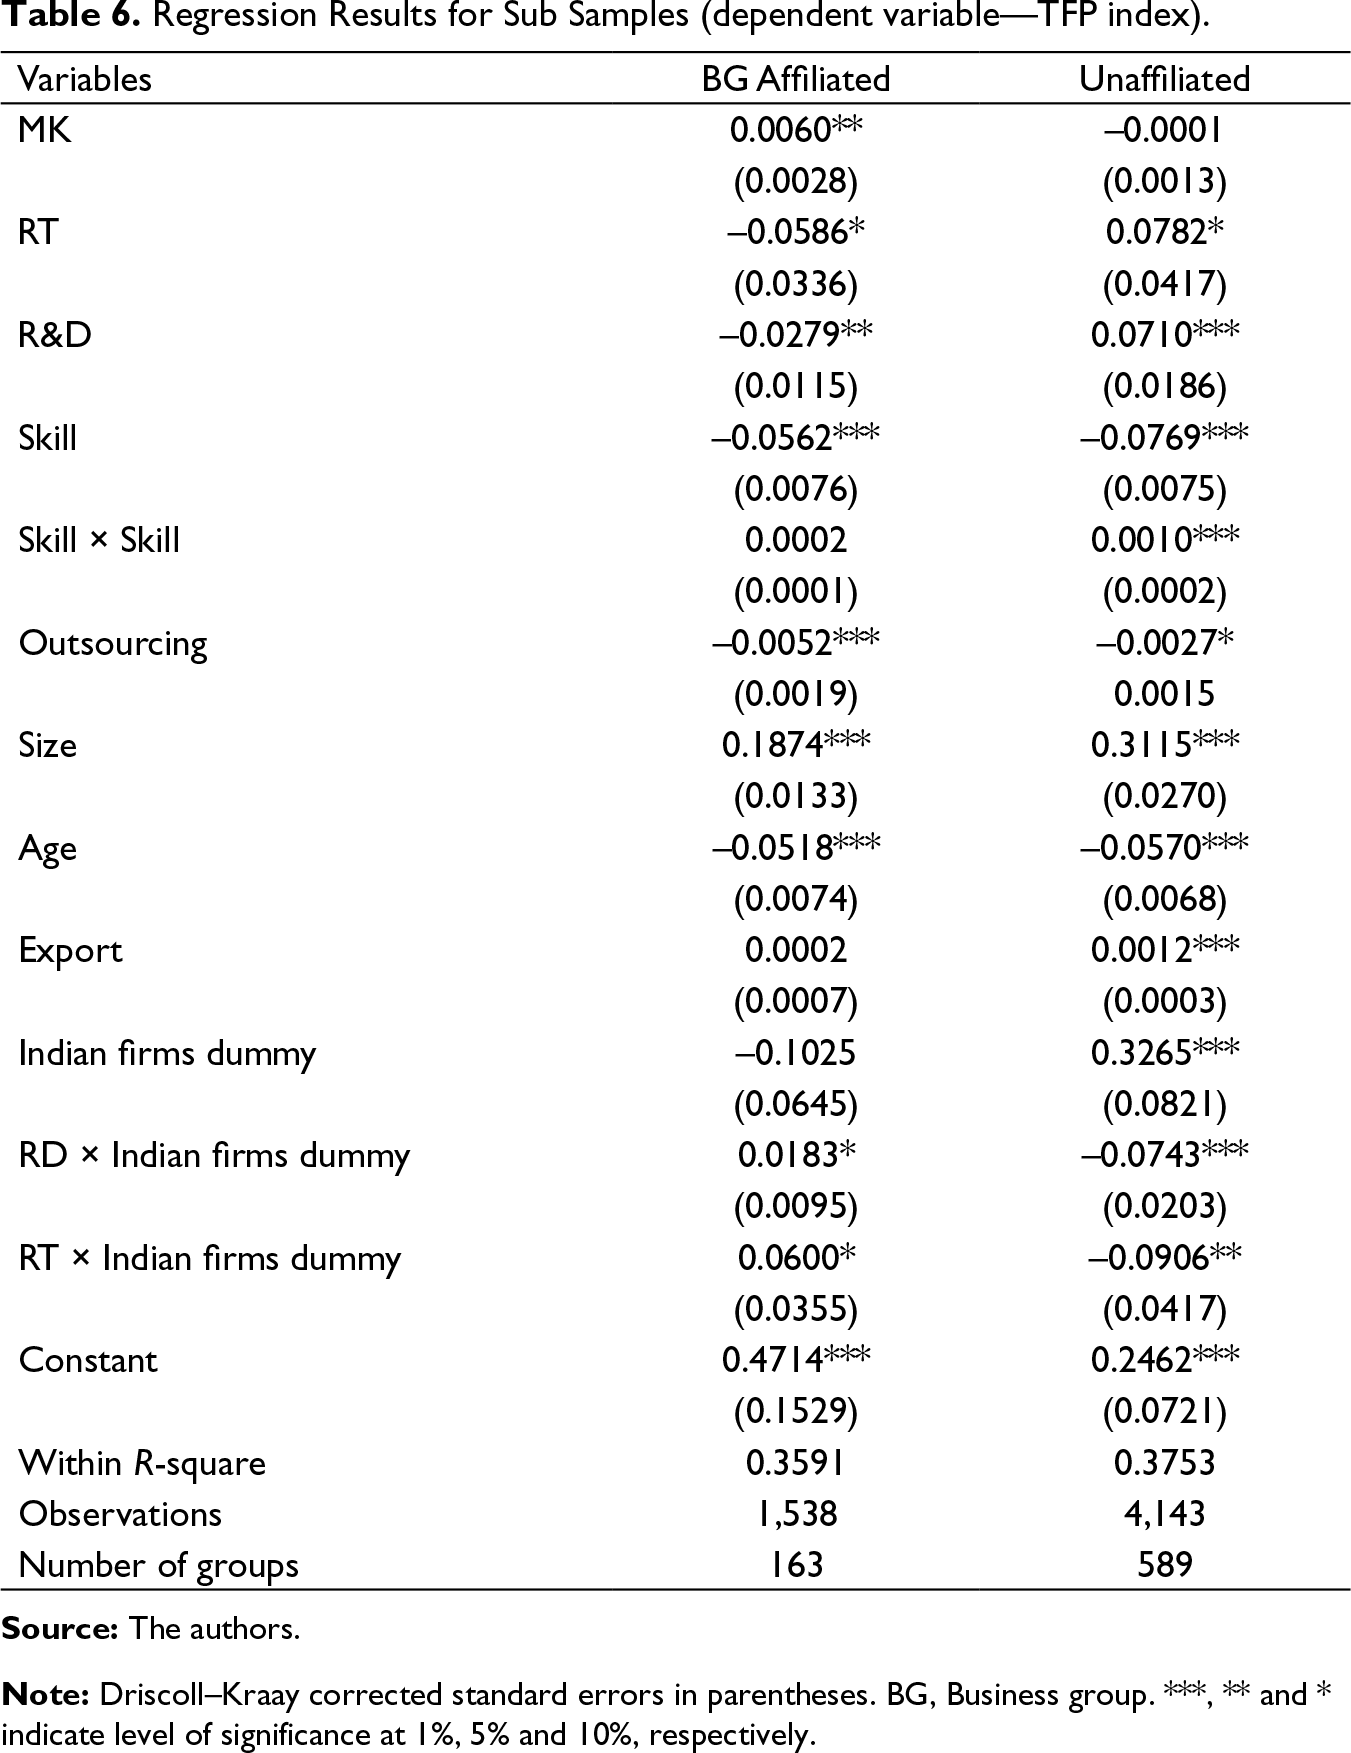
Note: Driscoll–Kraay corrected standard errors in parentheses. BG, Business group. ***, ** and * indicate level of significance at 1%, 5% and 10%, respectively.
Based on the kind of activities, our sample of firms can be further categorized into their industry groups. We additionally check whether the overall results hold within the industry categories as in table 6. While all the results are broadly similar, we find some interesting changes specifically in the case of firms belonging to the NIC-63 (Information Service Activities). The coefficient for in-house R&D is negative and remains so for the Indian firms as well, as given by −0.7561 + 0.7490 = −0.0071. The firms in this industry category engages in activities such as data processing, which are low value jobs. Given the nature of these activities, it is unlikely that the R&D reporting of these companies are actually expenditures assigned for ‘innovation’ purposes but possibly expenditures undertaken to adapt and assimilate the transferred technology in the production process. A further comment on the kind of activities would only be possible with a more detailed view of the activities of the firms, which is beyond the scope of the current study.
In addition to industry categories, we check for consistency of our results for firms categorized on the basis of business group affiliation. The literature hints at a possibility of better resource accessibility for the affiliated firms. Our results for this category of firms are similar to the broader results, although for the sub-sample of firms related to business groups, the coefficient value for the disembodied technology for Indian firms remains positive, given by −0.0586 + 0.0600 = 0.0014. In comparison to the original model, the positive sign of the coefficient for this category of firms implies that there could be firm specific elements and characteristics, some information and resource advantage that firms enjoy when they are affiliated to business groups and that contributes to higher productivity.
Summary and Conclusion
The present study is an attempt to understand the productivity differences across Information Technology service firms and identify the factors that affect productivity differences across firms in the industry. A panel data analysis using a fixed effects model is carried out to investigate the impact of firm ownership and technological efforts on total factor productivity. We observe that despite the improved performance of the IT sector over the years, the fall in productivity of these firms over the years indicates the need for them to improve upon their performance, through efficient utilization of resources and use of better technologies to maintain competitiveness and sustain growth in the long run. The results in our analysis bring forth the importance of the technological efforts in contributing to productivity increase. The dependence of the firms on embodied and disembodied technology shows that firms are followers of their counter parts in developed countries in terms of use and assimilation of technology. The foreign presence within firms aids the transfer of know-how and other tacit skills for effective creation of newer products and also the assimilation of the proprietary resources into production and service delivery by the firms.
The study finds that in the case of service firms, technology alone would not be sufficient to bring about increase in productivity levels. In this context, other firm specific characteristics also become important for productivity. The IT service industry has been noted to be a skill intensive industry and the findings of the study reiterates the importance of maintaining the skill pool within the firm in order to be able to deliver quality services. Although the industry shows reliance on imports to avail access to latest technology or on more foreign presence for transfer of know-how, higher productivity of the Indian firms shows that the IT service industry in India is still able to reap some of its cost advantages. The findings of the study in terms of importance of technology and skilled labour are indicative of the need to continuously invest in skill development of the workforce so that they are able to move up the value-chain, deliver superior quality services and products and not just rely on other external factors for the transfer of know-how. Furthermore, indigenous products would not only have the benefit of cheap inputs but with increased demand, they will induce more competition in the industry and thereby drive productivity.
Footnotes
Appendix A
For labour, we arrive at a measure of the number of employees using the method elaborated in Chawla (2012) and Rath (2018) by using the information on compensation to employees for the firms in the industry. Capital stock is measured using the formula
Acknowledgment
The authors are thankful to an anonymous referee for their insightful comments. A previous version of this paper was presented at the 14th Annual Conference of Forum for Global Knowledge Sharing at IIT Madras and the authors are thankful for the comments received from the conference participants. The first author has largely benefitted from the inputs received from Prof. N.S. Siddharthan and Prof. Surajit Bhattacharyya.
Declaration of Conflicting Interests
The authors declared no potential conflicts of interest with respect to the research, authorship and/or publication of this article.
Funding
The authors received no financial support for the research, authorship and/or publication of this article.