
Abstract
This study presents an analysis of the intra-regional performance of South Asian economies in terms of their productive efficiency during the period 1985–2019. A window data envelopment analysis (dea) based technique with bootstrapping is used to model the production frontier for seven South Asian economies to estimate their efficiency levels. The results show substantial differences in technical efficiency levels across South Asian economies and thus, the existence of vast potential to catch up with the best practices is revealed among these economies. On an average, the extent of technical inefficiency in south asia is about 46.92% per annum after adjusting for statistical bias. This is indicative of a huge gap in laggard and best practices within region. Both managerial and scale components of efficiency performance are equally responsible for observed production inefficiency in south asia. The existence of managerial inefficiency reflects failure of policy planners among affiliate countries to catch-up the best practices within South Asian region. However, the observed scale inefficiency (SIE) is because of the dominance of scale economies over diseconomies that urges need of enlarging cooperation among member nations.
Introduction
Historically, the South Asian region remained grappled in conflicts and political instability as many wars have been fought on its soil to exacerbate the tensions in the subcontinent. For a substantial period, the regional tension deterred the economic and strategic interests of the area to take precedence in matters of policy and development. The countries of South Asia came forward to form a regional block under the banner of the South Asian Association of Regional Cooperation (SAARC) in the year 1985 to mitigate the political tensions and restore stability amongst affiliated nations. The group further entered into the South Asian Preferential Trade Agreement (SAPTA) and the South Asian Free Trade Area (SAFTA) in the years 1995 and 2004, respectively, to realize potential gains from economic integration. These two agreements were endorsed in the zone for providing vigor in the economic performance of its affiliates such that the laggard economies may catch up the prevailing best practices in the region. Thus, an inspection of the best practices and laggard economies within South Asian region can provide much important inputs to the policymakers of the region. Therefore, this study analyses the gap among best practices and laggard economies of the region in terms of productive efficiency of these nations using the frontier approach. The economies maximizing real Gross Domestic Product (GDP) for given levels of employment (labour) and capital inputs are said to be operating at frontier and have been designated as the best-practice efficient economies of the region. The productive efficiencies of South Asian economies operating below the frontier are estimated with reference to the best-practice nations to ascertain the extent of gap amongst performance of the affiliates. Also, a hypothesis that the formation of SAFTA didn’t contribute significantly in catching-up of the best practices amongst the affiliate economies has been tested against an alternative hypothesis that the best practices have been catch-up at a significant rate by the laggard nations of South Asian region. In simple words, the study carries an objective to ascertain the existence of best-practices spillover phenomenon whereby the formation of SAFTA assumed to mitigate the variations in productive performance of the party nations in a regional integration.
Knowing the peer practices is of a great importance for a fragile economy as the information about best practices may help it to improve upon its own performance. The economies within South Asian region need to know each other’s production efficiency performance so as the weak performers of the group may gain the technical know-how of the peers of the group to reap maximum benefits of regional integration. Knowing efficient production operations is also crucial for an economy to attain higher productivity levels as catching-up is an important component of total factor productivity (TFP) growth along with technological progress. An improvement of its technical efficiency is generally more beneficial (cost-effective) than an introduction of new technology to attain higher levels of TFP growth if any decision-making unit (i.e., South Asian economy) is not taking full advantage of its existing technology. However, if a firm (economy) is technically efficient, then an increase in TFP demands new technology to shift the production frontier upward. Moreover, Given the higher potential for industrialization in developing economies, the inability of economies to fully benefit from low-cost access to advanced technology from overseas may prove detrimental for development (Jayasuriya & Wodon, 2005).
In general, there are several studies like Adkins et al. (2002), Milner and Weyman-Jones (2003), Gust and Marquez (2004), Jayasuriya and Wodon (2005), Kneller and Stevens (2006), Thompson and Garbacz (2007), Repkine (2008), Henry et al. (2009), Dimelis and Papaioannou (2011), Jarraya (2014), Lemonakis et al. (2016), and Gkypali et al. (2019), which have performed cross-country analysis of productive efficiency and tried to identify various factors affecting efficiency. However, in the context of South Asian region, although profuse literature focused on economic growth aspect (e.g., Devarajan & Nabi, 2006; Sahoo & Dash, 2012; Rahman et al., 2019; Rosegrant & Evenson, 1992) yet there is hardly any study specific to South Asia that analyzed intercountry and intertemporal productive efficiency in the region to the best of our knowledge. This dearth in the literature makes our study relatively important. In summary, it can be concluded that analysis of efficiency is pivotal for South Asia for identifying the ways to increase output per capita by following peer practices. This study is a leap towards this direction and attempts to fill up the already existing void in the literature. The analysis thus carries an objective to measure inter-temporal and inter-country variations in technical efficiency of South Asian economies. A hypothesis that the technical inefficiency among South Asian economies is statistically insignificant due to the insignificant nature of the managerial and scale inefficiency (SEI) components has been tested using the method of window data envelopment analysis (DEA) with bootstrapping.
Methodological Framework
Performance comparison has always remained a technical issue analyzed using either ratio-based or frontier-based methods. The earlier category lacks robust evaluation of performance as the different ratios may provide different results. The frontier-based methods enable clubbing many indicators of performance in the form of input and output variables to provide a single performance measure say efficiency score. Technical efficiency is defined as the ability to produce outputs or services with the minimum level of resources required. Technically efficient firm (economy) generates the maximum possible output(s) from a given bundle of inputs or produces a certain level of output(s) with a minimum input bundle. The notion of technical efficiency is inherently related to the estimation of a production frontier as efficiency measures could only be defined with reference to a benchmark, that is, an ideal level of performance (best-practice frontier). The literature on the measurement of technical efficiency supplies two contending approaches that estimate the best-practice frontier to estimate the relative efficiency (i) non-parametric frontier approach and (ii) parametric frontier approach. The non-parametric frontier approach was at first developed by Farrell (1957) and later unfolded by Charnes et al. (1978), Banker et al. (1984), Färe et al. (1985), and others. Unlike the parametric approach, this approach doesn’t make any assumption about the functional form of production technology. This approach was named as DEA by Charnes et al. (1978). The DEA utilizes a set of peer entities called Decision Making Units (DMUs) and employs linear programming to estimate the best practice frontier. The DMUs operating on the frontier are the best practice institutions and get a score of 1 while the inefficient DMUs get the score between (0,1]. The inefficiency is therefore, measured by the gap between the individual economy’s performance and the estimated best-practice frontier. Various mathematical programming DEA models have been added to the literature (see Charnes et al., 1997). Basically, these different DEA models try to find out which of the n DMUs determine the best-practice frontier. In this study, we employ the following output-oriented Charnes et al. (1978) and Banker et al. (1984) models.
CCR and BBC Models
The CCR model, named after Charnes et al. (1978), provides the scaler measure of Overall Technical Efficiency (OTE) by assuming a constant return to scale (CRS). Whereas, the BCC model, named after Banker et al. (1984), assumes variable returns to scale (VRS) and gives the scalar measure of Pure Technical Efficiency (PTE). Scale efficiency (SE) measure is equal to the ratio of OTE and PTE. Assuming there are N economies, that is,
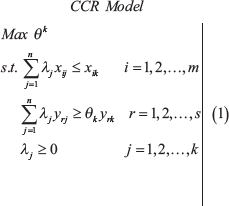
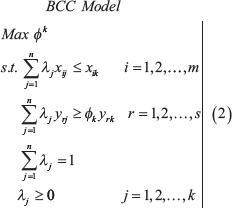
The model (1) is CCR model with assumption of constant returns to scale (CRS) while model (2) with an additional convexity constraint is called bcc model having variable returns to scale (VRS) assumption in dea literature. The parameter
Bootstrapping Analysis: A Separation of Noise from Efficiency Score
The limitation of the CCR and BCC models is that these models are non-stochastic and do not separate the white noise error term from efficiency scores. Measurement error, sampling error, and specification error are some common types of errors. Thus, the presence of significant white noise error term may cause the interpretations of efficiency score misleading. The solutions like stochastic DEA, Stochastic Non-Parametric Envelopment of Data (stoned), and bootstrapping DEA have been presented in the literature to separate the error term from efficiency scores. However bootstrapping DEA is the most popular approach amongst all of these techniques (see Fried et al., 2008). Simar (1992) pioneered the use of bootstrapping in frontier models. However, Ferrier and Hirschberg (1995) and Simar and Wilson (1998, 2000a) took the lead in using the bootstrapping technique in non-parametric envelopment models. The theoretical account of the bootstrap with DEA estimators is provided by Kneip et al. (2003). The main assumption of this approach is that the known bootstrap distribution will resemble the original unknown distribution if the known data-generating process (DGP) is a consistent estimator of the unknown DGP. The bootstrapping will therefore create the values that resemble the distribution, which would be produced from the unobserved and unknown DGP (Simar & Wilson, 1998, 2000a, 2000b).
To obtain the measures of overall, Pure and scale technical efficiency bias and the sample variance of bootstrapped efficiency estimates (i.e.,
Solve the original simple DEA model (1) and get the efficiency scores
let
Smooth the sampled values utilizing the following formula:

where
Get final

Where,
Adjust the original output using the ratio
Resolve the original DEA model (1) utilizing the adjusted outputs to get
Repeat steps (ii)-(vi)
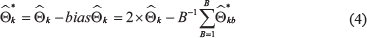
When the suitable number of samples is generated then the bias of the original estimate of theta is worked out as follows:

A bias-corrected estimator of true value of
But, to bootstrap the SE scores, change
DEA Window Analysis
The number of South Asian economies is seven and thus, the cross-section observations are not enough for the construction of an efficient frontier. This deficiency of cross-section observations provides too few degrees of freedom and reduces the discriminatory power of DEA (Coelli et al., 2005). Thus, the application of DEA to small samples can cause the ‘self-identifiers’ problem (Gaganis & Pasiouras, 2009). Window analysis is often a suggested remedy to this problem of too few observations. Window analysis, an approach used in a panel setting developed by Charnes et al. (1985), performs DEA over time by using a moving average analogy, where an economy in each different period is treated as if it were a ‘different’ economy. More importantly, an economy’s performance is compared with its performance in other periods as well as to the performance of other economies. Therefore, this study chooses to carry out the DEA window analysis with a window width of five years.
Assume, there are observations for n different economies over T periods, it is considered as if there are
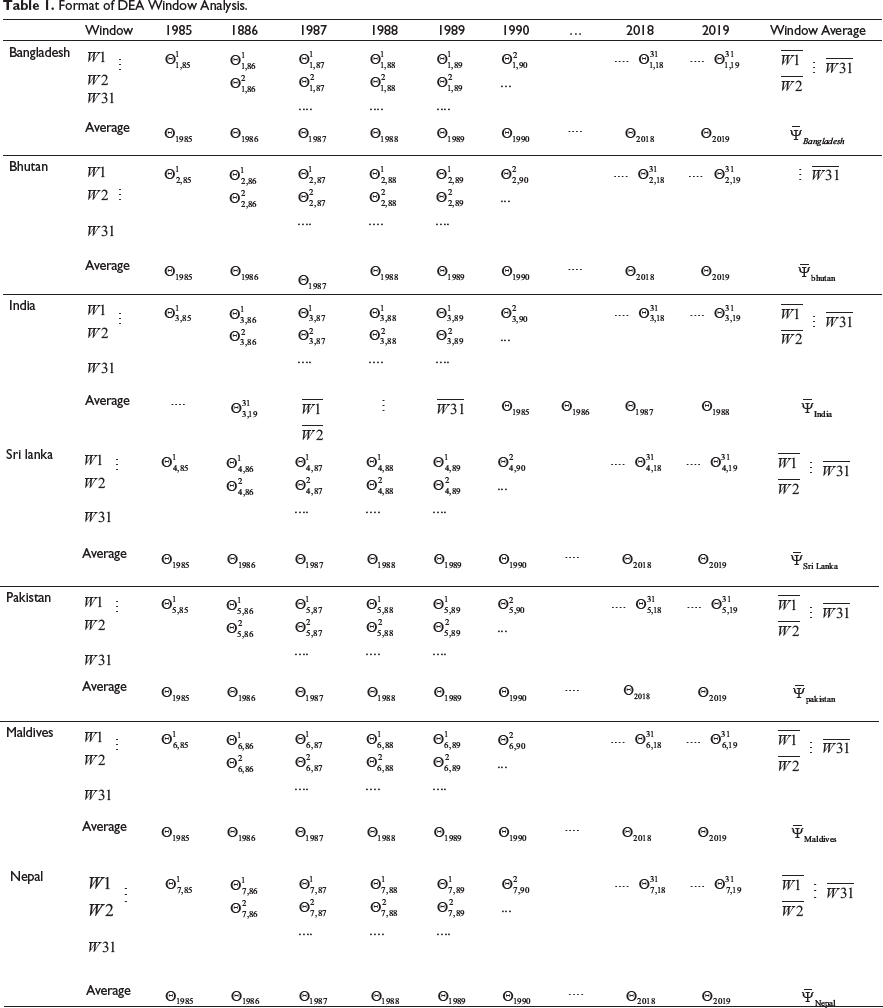
Let‘s consider dataset of seven South Asian economies over 34 (T = 34) years used in the present analysis. To do the window analysis using a five-years (w = 5) window, Table 1 shows the window analysis setup for the bias corrected efficiency scores obtained with five period moving window. Each economy is considered as if it is a different economy for each of the five consecutive years in the first window (year 1, year 2,..,year 5), and an analysis of the 35
Format of DEA Window Analysis.
Sources of Data and Construction of Variables
The empirical analysis is confined to the period of 34 years over 1985/86 to 2018/19, which is further divided into two sub-periods to see the evolution of technical efficiency before and after the formation of the SAFTA. The two sub-periods are: (i) Pre-SAFTA period (1985/86 to 2004/05) and (ii) Post-SAFTA period (2005/06 to 2018/19). This division is justified by the belief that free trade is likely to improve efficiency by inducing competition (Tybout et al., 1991). A set of one output and three input variables has been used for estimating the production frontier to calculate various types of efficiency scores. The real GDP at chained PPPs (in million 2017 US dollars) has been taken as an output variable. The Capital stock at PPPs (in million 2017US dollars) and the number of persons engaged in production activities aged 15 years and over (in millions) have been taken as two inputs. The affiliates of SAARC region are heterogeneous in their size and thus, the GDP figures are not comparable. To control for country-specific heterogeneity, all figures have to be taken in per-capita terms and thus, the inputs and outputs must be divided by the total population. However, Emrouznejad and Amin (2009) criticized the use of ratios in DEA models. Thus, the denominator of output variable, that is, population has been taken as an additional input to control for size-specific heterogeneity among South Asian nations. Thus, the countries maximizing the GDP for given level of employment, capital, and population (non-discretionary) are said to be the efficient countries. The data on all aforementioned variables have been culled out from Penn World Table, Version 10.0 (Feenstra et al., 2015).
Empirical Results
The analysis has been bifurcated into inter-country and inter-temporal analyses of various types of efficiency figures obtained for the South Asian region. In inter-country analysis, the window averages of efficiency scores for each affiliated nation have been compared while the inter-temporal analysis offers trends in annual average efficiency scores of the South Asian region and its affiliates over the entire study period.
Inter-country Comparison of Productive Efficiency in South Asian Region
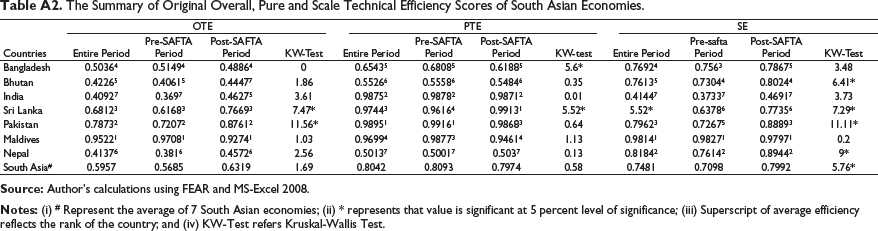
The perusal of Table 2 reveals that during the entire study period, the average OTE score for the South Asian region is about 53.08%. It indicates that in the South Asia region, the level of overall technical inefficiency (OTIE) is to the tune of 46.92% implying the existence of huge gap in laggard and best practices followed within the South Asian region by its affiliate countries. This suggests that if laggard South Asian economies follow the best practices, it can improve its GDP by 46.92% using the same input resources. To catch-up the best practices within the region, the benchmark countries shall have to extend cooperation to laggard nations in terms of their technical competence to improve upon possible existence of managerial inefficiency. Also, in case the SIE exists the countries shall have to create an environment such that the existing scale economies may be exploited and diseconomies may be reduced within the South Asian region.
The Summary of Bias Corrected Overall, Pure and Scale Technical Efficiency Scores of South Asian Economies.
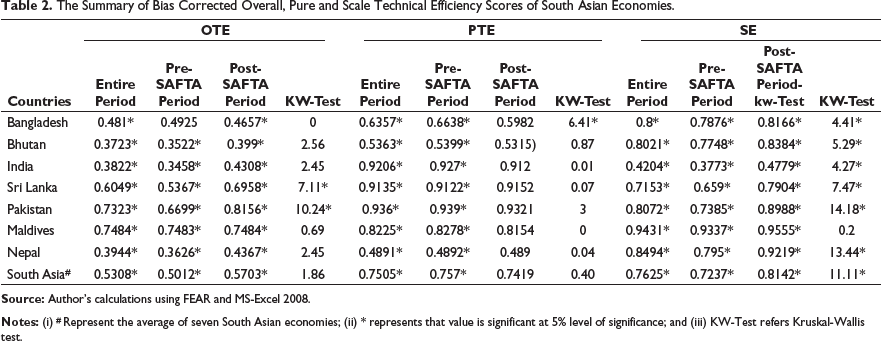
The economies of South Asia formed a free trade agreement called SAFTA in 2004. It is expected that reducing trade barriers induces competition and is likely to improve efficiency by transfer of technology via trade facilitation and transfer of technology. Therefore, to analyze the impact of this free trade agreement on the OTE of South Asia, the entire study period has been bifurcated into two sub-periods: (i) pre-SAFTA period from 1985/86 to 2004/05 and (ii) post-SAFTA period from 2005/06 to 2019/20. The analysis shows that OTE though increased by 6.91% in the post-SAFTA period yet the Kruskal-Wallis test fails to identify a significant improvement in OTE within the region.
The inter-economy analysis shows that average OTE scores range between 0.3723 and 0.7484. Maldives’s economy turns out to be the benchmark country with average OTE of 0.7484 that makes it relatively more efficient than other economies of South Asia. On the ladder of efficiency, second, third and fourth positions are occupied by Pakistan, Sri Lanka and Bangladesh with an average OTE score of 0.7323, 0.6049 and 0.4810, respectively. Nepal, India and Bhutan find their positions at the bottom of the efficiency ladder with an average OTE score of 0.3944, 0.3822 and 0.3723, respectively. Thus, there is plenty of room for these economies to improve their performance by adopting the best practices in the region. Only the economies of Pakistan and Sri Lanka manage to significantly increase their OTE in the post-SAFTA period relative to pre-SAFTA period. Therefore, it can be said that the formation of SAFTA does not seem to have a positive impact on the OTE in South Asia. In summary, the analysis shows a soaring amount of OITE in South Asia and the existence of a substantial inter-country variation in efficiency performance. Therefore, an analysis of the sources of such a high level of OTIE in South Asian economies is of utmost importance to explore possible solutions to the inefficiency problem within region.
The measure of OTE is decomposed into PTE and SE, which are non-additive mutually exclusive components. This decomposition lets us know the Sources of OTIE in South Asian economies. Unlike the OTE measure, the PTE measure is devoid of scale effect so all the inefficiency reflected from the PTE score directly emanates from managerial sub-performance. In the present context, the pure technical inefficiency (PTIE) is assumed to be the failure of managers (say policy planners) of the South Asian economies who are unable to catch-up best practices prevailing within the South Asian region. On the other hand, the SE measure lets us know whether the South Asian economy in question is operating at the most productive scale size (MPSS) or not. In simple, the SIE shall exist because of the dominance of either scale economies or diseconomies over each other. In both contexts, the South Asian region shall have to create such an environment that the excess of any of these two entities can be controlled up to desired equilibrium level.
Table 2 also provides the inter-economy variations in the PTE and SE of the South Asian region. It is noted that on average PTE and SE of South Asia is to the tune of 75.05% per annum and 76.25% per annum respectively. This indicates that 24.95% points of 46.92% of average OTIE is due to inappropriate management practices adopted by the managers to organize input resources for the production process. PTIE contributes almost 53.17% to the OTIE in South Asia. The rest 46.83% is contributed by the SIE. Thus, both PTIE and SIE contribute to the OTIE in South Asia. SAFTA does seem to influence the SE in the region as 9% increase of SE is observed in the post-SAFTA period.
By applying the above logic, the inter-economy analysis reveals that the contribution of PTIE of Bangladesh, Bhutan, Maldives and Nepal to OTIE is 70%, 74%, 70% and 84%, respectively. The PTIE is a dominant source of OTIE in these economies. Therefore, these economies can potentially improve their OTE by improving their managerial efficiency. The best-practices on VRS frontier are Pakistan, India and Sri Lanka with an efficiency score above 90%. The laggard countries may follow practices or technical knowhow of any one of these economies to become a South Asian benchmark. On the other hand, the contribution of PTIE of India, Sri Lanka and Pakistan to OTIE is 13%, 22% and 24%, respectively. It indicates that the OTIE is mainly contributed by SIE in these economies. This suggests that these economies aremanagerially efficient but not operating at optimum scale size. Thus, there is a scope for these economies to improve upon their OTE by altering their scale of production. In addition, barring Maldives all the South Asian Countries significantly improve their SE in post-SAFTA period relative to pre-SAFTA period. In summary, both PTIE and SEI are responsible for OTIE in South Asia. Adoption of the best managerial practices and optimum scale size can help the South region to improve its technical efficiency.
Inter-temporal Comparison of Productive Efficiency in South Asian Region
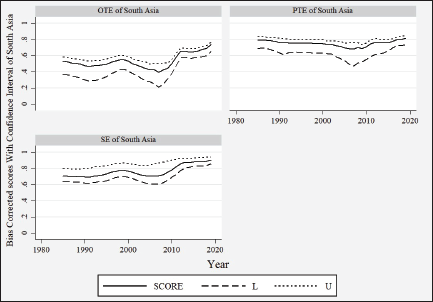
A diagrammatic analysis has been performed to explore inter-temporal fluctuations in various efficiency figures. The solid line in Figure 1 represents bias-corrected average efficiency scores for South Asian region while the lower and upper confidence intervals to bias-corrected efficiency scores have been plotted as broken dashed and dotted lines, respectively. It may be noticed that the OTE of South Asian region is remaining substantially low up to the year 2010 and afterward exhibited an upward trend. The major reason of the said fluctuation in OTE seems the managerial component as a downward trend in PTE is visible up to year 2010 given an oscillating behaviour of SE. The OTE improvements became noticeable once SE started improving in South Asian region post late 2000 period.
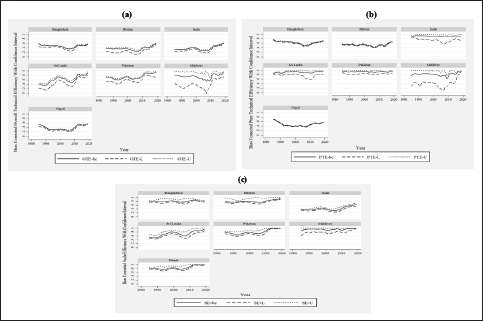
The panel data line plots have been used to explore inter-temporal variations in OTE, PTE and SE in the countries of the South Asian Region. Figure 2 represents the bias corrected scores and confidence intervals of OTE, PTE and SE of the South Asian countries over the entire study period. The inter-temporal variations of OTE seems similar in Bhutan and India where both the countries experienced very low OTE over the period of time. However, there seems positive trend in OTE post 2005 driven by the increase in SE. The OTE of Sri Lanka exhibits the increasing trend engulfed with the wide fluctuations and this upward trend is mainly driven by the improvement in SE. Thus, Sri Lanka managed to increase its OTE and catchup the best practice frontier over the course of time. The inter-temporal variations of OTE of Bangladesh and Nepal show a downward trend till the late years of first decade of twenty-first century. The visible declining trend of PTE seems to be responsible for this down sliding of OTE in these economies. This spree of downslide of OTE is broken by the SE and managerial efficiency which started to improve in around 2008. Pakistan’s variation in OTE remained stable till 2010; however, there seems positive trend driven by improvements in SE in the period post 2010. In summary, it seems that some countries experienced upward trend and some downward trend in OTE till late years of the first decade of twenty-first century while almost all the countries showed upward trend of OTE post the said era. It is very interesting to note that this increase in OTE is mainly led by the improvement in SE. Since SAFTA was implemented in 2004, it might be the case that this improvement of SE in late 2000 period is stimulated by the formation of SAFTA. Therefore, the conclusion of above analysis reiterates our earlier finding that formation of SAFTA might be responsible for the improvement in SE in the region of South Asia.
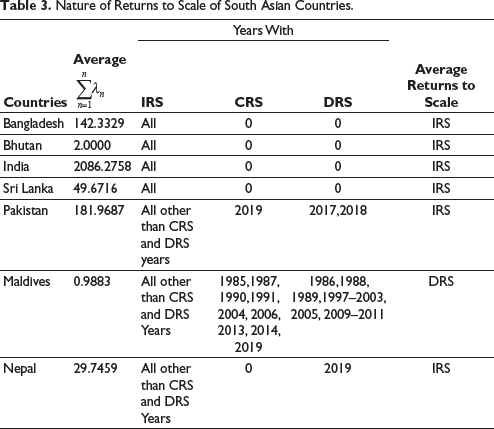
As mentioned earlier, SEI along with pure inefficiency is equally responsible for the OTIE in the region. In addition, the inter-temporal analysis shows that in recent times SE turned out to be very important component for improving overall efficiency in the region. Therefore, knowing the nature of returns to scale would be very beneficial for the countries of South Asian region to further improve their SE. SEI in production operations may exist due to the operation of an economy at super-optimal (i.e., at decreasing returns to scale (DRS) or sub-optimal (i.e., increasing returns to scale (IRS) scales of production. The nature of returns to scale can determined by
Nature of Returns to Scale of South Asian Countries.
It is worth noting here that the above are the sources of the OTE within South Asian region in the form of managerial and scale efficiencies. However, there are some external factors that are responsible for variation in the efficiency levels of South Asian countries. These factors may be (i) R&D expenditure, (ii) net exports (export orientation in production focuses more on quality), (iii) level of infrastructure (social overhead capital), (iv) Foreign Direct Investment, (v) governance, (vi) political stability and (vii) debt-GDP ratio, and so on. among others. The level of Human Development may also be taken as a significant source of inter-country variations in efficiency performance. Also, the performance of South Asian block may be addressed in terms of enhancing intra-regional trade wherein the ratio of South-Asian trade to total trade of a country can be taken as an additional output while computing efficiency measure. Thus, the study provides a huge scope for future research in the direction of performance evaluation of the South Asian economies in intra-regional framework.
Conclusion
This study tries to accomplish an inter-country comparison of the performance among the seven South Asian economies in terms of their productive efficiency over a period of 34 years (i.e., from 1985/86 to 2019/20). The exercise is performed by using the method of window DEA with Bootstrapping. The empirical analysis shows a soaring amount of technical inefficiency of about 46.92% indicating a huge gap between the best-practice and laggard technologies among South Asian economies to convert the input resources into national output. This suggests that if South Asia uses the best practices, it can improve its performance by producing 46.92% more output using the same bundle of inputs. The managerial inefficiency and scale inefficiency (SIE) were found to be equally responsible sources of such a high level of technical inefficiency within the South Asian region. A substantial range in bias-corrected efficiency score between 0.3723 and 0.7484 supports the inference of significant efficiency gap among South Asian countries.
The major source of inefficiency in economies of India, Sri Lanka and Pakistan is SIE that stems because of the dominance of increasing returns-to-scale within the South Asian region. Though the SIE among the remaining four (i.e, Bangladesh, Bhutan, Maldives and Nepal) economies is not dominant source yet the operation at increasing returns-to-scale is a major cause of this type of inefficiency within the region. The direct connotation is that there exist ample unexploited economies of scale within South Asian region. An enhanced cooperation among the affiliate countries may help to enlarge the region’s output with same amount of inputs to exploit all available scale economies up to their optimum extent.
The managerial inefficiency is the dominant sources of technical inefficiency in the four countries of Bangladesh, Bhutan, Maldives and Nepal. These economies can potentially improve their performance by learning the benchmark practices from nations with high managerial efficiency such as Pakistan, India and Sri Lanka. Finally, the formation of SAFTA does seem to have impacted the SE of South Asia while its impact on managerial efficiency is insignificant. Thus, the South Asian region shall have to strengthen SAFTA such that the transfer of knowledge through free trade can be smoothened among affiliate countries. The transfer of knowledge with trade shall help to remove technology barriers among affiliated countries and shall help to enlarge the total output within the South Asian region.
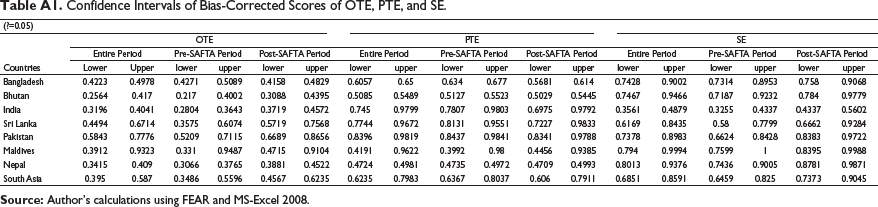
Appendix A
Confidence Intervals of Bias-Corrected Scores of OTE, PTE, and SE.
The Summary of Original Overall, Pure and Scale Technical Efficiency Scores of South Asian Economies.
Footnotes
Acknowledgement
Authors are grateful to the anonymous reviewers of paper who contributed significantly in improving the quality of this manuscript.
Declaration of Conflicting Interests
The authors declared no potential conflicts of interest with respect to the research, authorship and/or publication of this article.
Funding
The authors received no financial support for the research, authorship and/or publication of this article.