
Abstract
Aims: To determine and compare the extent of the nutrition transition between Kenyan and South African women. Methods: A nationally representative sample of women aged ≥15 years (n=1008) was assessed in Kenya. Weight, height, and waist and hip circumferences were measured. A 24-hour dietary recall was conducted with each participant. This data was compared with data of the Demographic and Health Survey (DHS) of women in South Africa (n=4481). Dietary intake of South African women was based on secondary data analysis of dietary studies using the 24-hour recall method (n=1726). Results: In South Africa, 27.4% women had a BMI ≥30 kg/m2 compared with 14.2% of Kenyan women. In both countries there were large urban–rural differences in BMI, with the highest prevalence in women in urban areas. BMI increased with age, as did abdominal obesity which was equally prolific in both countries with more than 45% of women in the older groups having a waist/hip ratio ≥0.85. The nutrient mean adequacy ratio (MAR) of the South African rural diet was lower than those of the Kenyans diet (55.9; 57.3%, respectively). Dietary diversity score (DDS) and food variety score (FVS) were significantly lower in South African rural women (3.3; 4.9) compared with Kenyans (4.5; 6.8).
Introduction
Both South Africa and Kenya are sub-Saharan countries undergoing rapid urbanisation resulting in changing lifestyles and dietary habits; the so-called nutrition transition [1]. This generally presents itself as large urban rural differences in diet, with fat and saturated fat, added sugar, and sodium increasing with urbanisation; while fibre intake decreases [2]. These changes are detrimental to health and together with physical inactivity may lead to chronic non-communicable diseases (NCDs) [3]. The development of NCDs has also been strongly associated with an increase in body weight per se as well as unfavourable fat distribution [4]. Because of the strong link between childhood malnutrition and later susceptibility to NCDs such as type 2 diabetes [5], the problem needs to be studied as extensively as possible in order to gain a full understanding of the outcomes of the nutrition transition.
In low-income countries, many people are exposed to food insecurity resulting from a diet low in energy and essential nutrients. One of the major causes of this is the consumption of a diet, with limited diversity, which leads to stunting, underweight, and micronutrient deficiencies [6]. Hence, when evaluating diet in the context of the nutrition transition, it is essential to determine both the quality and diversity of the diet.
South Africa has a Human Development Index (HDI) of 0.597 compared with 0.470 for Kenya and 0.389 for sub-Saharan Africa [7]. Both countries have high mortality rates attributed to NCDs; 867 and 729 (per 100,000) for South Africa and Kenya respectively [8]. However, the per capita dietary energy intake per day from the Food and Agriculture Organization’s food balance sheets differs significantly between the two countries with 2999 kcal for South Africa [7] and 2089 kcal for Kenya [9]; nearly 1000 calories more in South Africa. This partly explains the finding that the percentage stunting and underweight in children under 5 years is considerably higher in Kenya (35%; 16.5%) [8] than in South Africa [10] (21.7%; 10.1%), respectively. While numerous studies in South Africa have indicated that there are significant urban–rural differences in diet and nutritional status in South Africa [11–13], there are little data available in this regard on Kenya, and very little published in peer-reviewed journals.
Despite South Africa being a wealthier country than Kenya, this wealth is very unequally distributed and South Africa has the second highest Gini Index in the world (South Africa GI= 65; Kenya=42.5) [14]. Because a large percentage of the population do not have access to land in South Africa, people have to rely on foods bought from small stores (spazas), fast food outlets, and/or supermarkets, while in Kenya a large majority of people do have access to land and are able to produce some foods for themselves and their families even though their land is sometimes very small and their yields are poor [15].
This tradition has not been followed in South Africa since the previous regime did not allow black people to own land prior to 1994 unless they lived in the so called “homelands”, which were generally in very semi-arid areas unsuitable for crop cultivation. In South Africa, 87% of land is owned by whites, and 13% by blacks [16].
Because of the reliance on commercial (bought) foods, South Africans have been exposed to the nutrition transition to a much greater degree than those in Kenya. In Kenya most communities have traditional crops such as indigenous vegetables, wild fruits, roots, and tubers [15]. Despite the latter often being underutilised, they become very important in terms of food security during the dry season when many households rely on these foods because food prices become too high for them to purchase [17].
The objectives of the present study were to examine the food intake, nutrient adequacy, and dietary variety of women in Kenya and South Africa and also to assess their weight status in order to describe and discuss the level of nutrition transition occurring at country level. The nutrition transition in this case being regarded as one exhibiting a dietary pattern which resembles the typical Westernised one and a high prevalence of obesity, compared with the traditional rural dietary pattern and lower level of obesity in rural areas. Lastly, we compared the nutrient adequacy of the more Westernised urban diet with the rural one.
Methods
Study population and sampling
In Kenya, women aged 15–60 years, were randomly selected from the four primary regions, Nakuru, Kisumu, Meru, and Nairobi by the Kenya Central Bureau of Statistics (CBS) personnel. The regions were stratified according to socioeconomic categories (low, medium, and high) as well as urban and rural areas and the sample was drawn proportionally from these subregions. Fifteen households were randomly selected from each Enumerator Area by the CBS and the main female responsible for food preparation was interviewed at her home in 2005. Anthropometric and dietary data were obtained from each participant (n=1008; 96% response rate). Dietary data were collected by means of a structured pre-coded validated 24-hour recall questionnaire and more detail is provided elsewhere [18,19].
In South Africa, the most recent Demographic and Health Survey (DHS, 2007) provided anthropometric data of women aged 15 years and older (n=4481; 85% response rate) [20]. The sample was stratified by age, geographic location, level of education, province, and population group and represents the demographics of the country, namely 80% black African [21].
Since there has never been a national dietary survey on adults in South Africa, a dietary database was created by pooling the results of regional studies. The studies that were selected included different ethnic groups and all used the 24-hour recall methodology to collect dietary data on 1726 women. The database was generated by statistical procedures and weighting to provide a proportional representation of South Africans aged 15 years and over. Secondary dietary analysis was then conducted on this database to generate a composite “average” South Africa intake for females [22,23].
Data collection
The main data collection tools were: a structured researcher administered questionnaire comprising sociodemographic questions, anthropometry, and a 24-hour recall. In both studies, research assistants were trained on completing the questionnaires and in doing the anthropometric measurements before they entered the field. The actual data collection took place at different times in the two countries. Fieldwork was undertaken in all studies after 3–5 days had been spent on training of the fieldworkers. All the questionnaires were tested on at least 10 adults in each country immediately prior to the survey.
Sociodemographic questionnaire
Basic socioeconomic data were elicited in both countries and included: type of housing; household size and composition; level of education; type of fuel used for cooking; sanitation; source of drinking water; household equipment/appliances; and assets such as a vehicle, television, cattle, or land.
The 24-hour recall questionnaire
Each participant was required to report on all the foods and drinks consumed during the previous 24 hours. Probing allowed the interviewer to obtain information on forgotten foods. In order to facilitate the estimation of portion sizes, various dietary aides were used. Most of the South African studies used household utensils and food models. In Kenya, the fieldworkers used a dietary assessment kit comprising life-size drawings and generic food models.
Anthropometry
Each participant was weighed and measured by a trained fieldworker, according to a field manual prepared for this purpose. Weight was measured with a digital foot scale to the nearest 0.05 kg [24]. Height was measured without shoes to the nearest 0.5 cm using a stadiometer or steel tape anchored to a flat wall [24]. A wooden headrest allowed the measurement to be taken at the point perpendicular to the top of the head. Waist was taken at the narrowest point of the middle and hip measurement was taken at the widest point around the hips [24]. An average of two measurements was taken of each measure. Body mass index (BMI) was calculated as weight in kilograms over height in metres squared and waist/hip ratio as waist divided by hip measurement [24].
Ethical and legal considerations
Signed informed consent was obtained from each participant in each country. Before consent was obtained, the fieldworker explained the purpose of the study to the participant reading it from an information sheet if the participant was not able to read herself. Patients were not identified by name on the questionnaires and strict confidentiality was maintained. The Ethics Committee of the Medical Research Council and the Department of Health approved the proposals for the study.
Validity and reliability of the data collected
Repeated 24-hour recall interviews and anthropometric measurements were undertaken in Kenya on 10% of the sample (n=104) in order to evaluate the reliability of data collected. These repeated interviews were done by the supervisors of the teams. No one knew in advance which homes would be randomly selected for the repeated visits. Repeatability of a random 10% of the sample (n=104) found that there were no significant mean differences in energy and macro- and micronutrients (except vitamin D) evaluated between the repeated measurements, suggesting that one recall provided sufficient reliability of data intake. Anthropometric repeated measurements showed a Pearson’s r value of 0.999 for BMI with no significant BMI difference (p<0.01) in the repeated sample. Furthermore, quality of the data were ensured by a rigorous training programme of 3 days, use of dietary life-size portion sizes and photographs; supervisors doing quality checks on the fieldworkers throughout the study; and stringent data cleaning. Although the South African dietary surveys were validated, they differed in their validation procedures. These procedures can be viewed in more detail elsewhere [22,23].
Data management and statistical analysis
Basic measures of central tendency and dispersion were determined using the SAS programme. Dietary data was analysed using FoodFinder, a software product developed by the Medial Research Council of South Africa [25]. The most commonly eaten Kenyan foods were added to the South African tables from Kenyan National Food Composition Tables [26]. All data were analysed in terms of age and location, (as by census categories). The evaluation of dietary adequacy used in this study is based on the methods described by Hatloy et al. [27].
The dietary diversity score (DDS) is defined as: the number of food groups consumed over a period of 24 hours [27]. The diet was classified according to nine food groups as recommended by Food and Agricultural Organization (FAO). These included: (1) cereals, roots, and tubers; (2) vitamin A rich fruits and vegetables; (3) non-rich vitamin A (other) fruit; (4) non-rich vitamin A (other) vegetables; (5) legumes and nuts; (6) meat, poultry, and fish; (7) fats and oils; (8) dairy; and (9) eggs. Other remaining items, such as tea, sugar, and sweets were not used in DDS or in the food variety score (FVS) calculations [27]. The FVS was defined as the number of food items consumed over 24-hours, from a possible 163 items.
In order to determine the nutrient adequacy of the diet a nutrient adequacy ratio (NAR) was calculated for 11 micronutrients (vitamins A, B6, B12, C, niacin, thiamine, riboflavin, and minerals calcium, iron, and zinc) and energy and protein. NAR was calculated as the ratio of the intake of a nutrient divided by the recommended intake for that nutrient (RNI), using WHO/FAO recommended intakes [28], which are set at 2 standard deviations above the average requirements. The mean adequacy ratio (MAR) was calculated as the measure of adequacy of the overall diet. MAR=sum of each NAR (truncated at 1)/number of nutrients (excluding energy and protein). A MAR of 100% would indicate a perfect diet with the exact requirement met for each nutrient.
Results
Table I shows some interesting aspects of urbanisation within and between the two countries. In Kenya in rural areas, nearly 60% of women only had a primary school level of education compared with only 10% of South African rural women. However in Kenya, more women, in both urban and rural areas (20.4% and 6.5%) had a tertiary education compared with women (10.6% and 4.8%) in South Africa. Other important factors associated with Westernisation of lifestyle are shown between the two countries. Eighty-seven per cent of women in urban areas in South Africa used electricity for cooking, while in Kenya only 6.2% did so. While electricity was most often used in South Africa in both urban and rural areas, paraffin and wood was the main source of fuel used in Kenya in urban and rural areas, respectively. In South Africa, the majority of urban participants had their own tap (88.7%) and a flush toilet (81.1%), compared with only 36% and 39.2%, respectively, in urban areas of Kenya. However, in rural areas of both South Africa and Kenya, only 7% and 8.3%, respectively, had a flush toilet. While it was not possible to ascertain how many South African black women had access to land, this amounted to 61.4% in Kenya.
Sociodemographic status of a representative study on women in South Africa and Kenya.
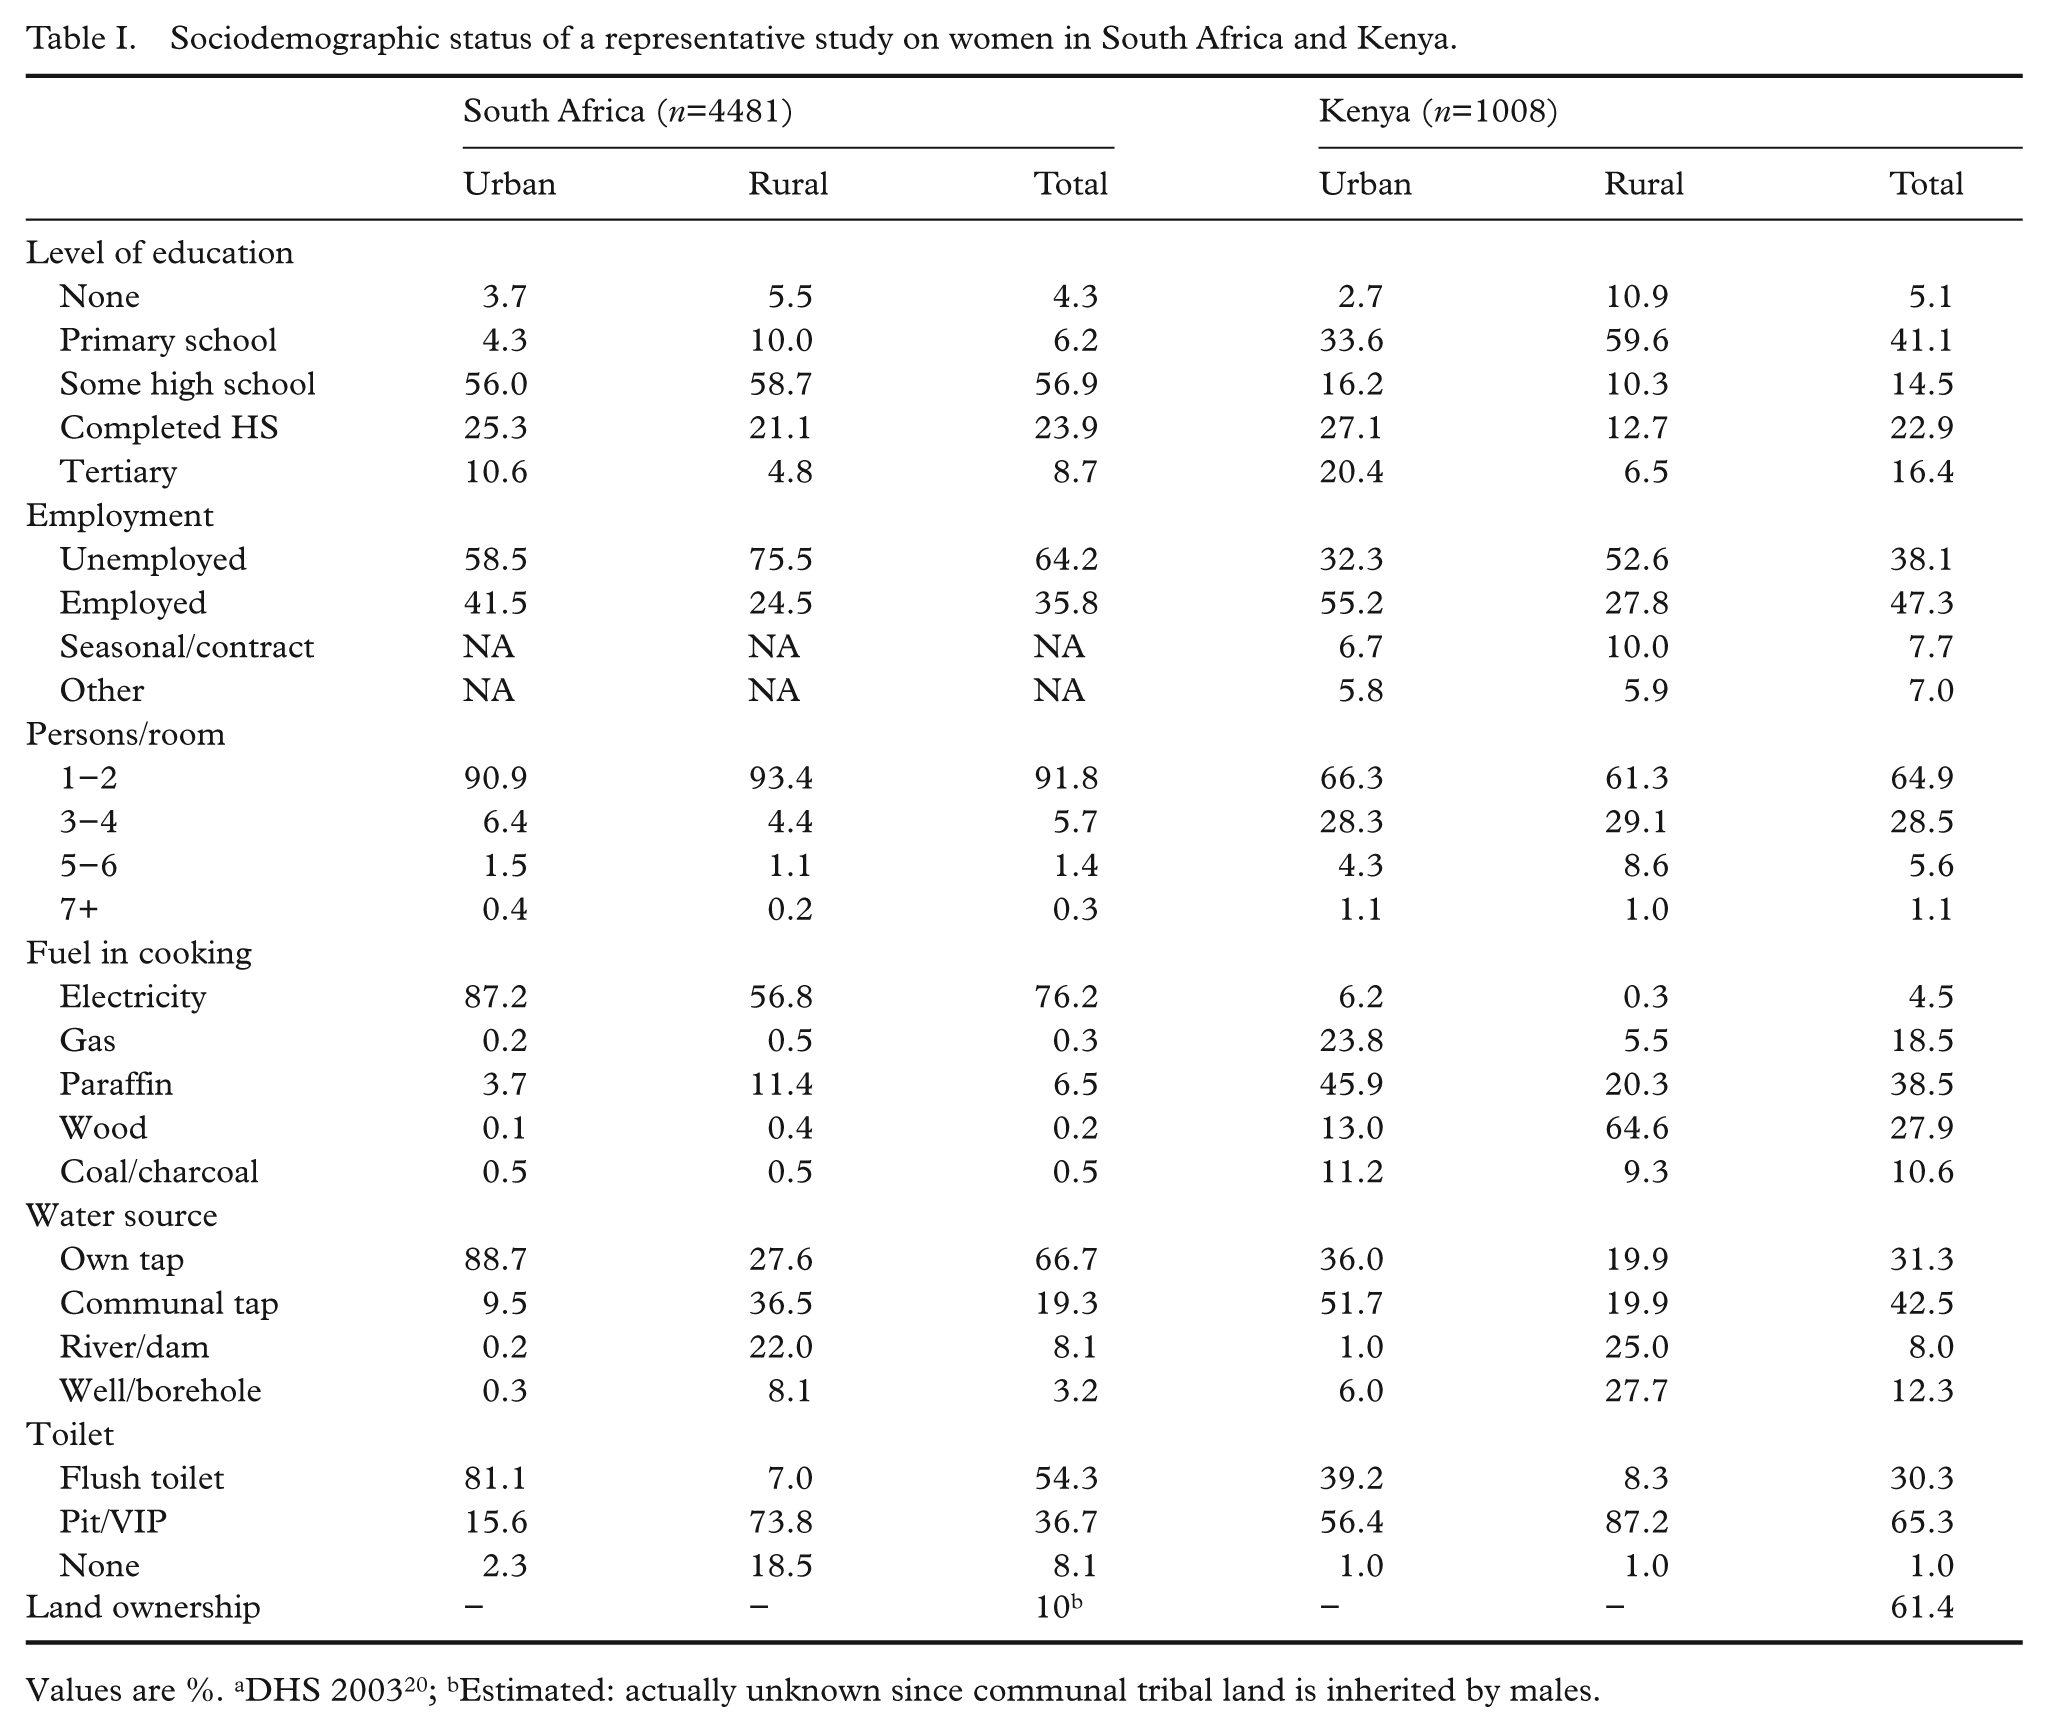
Values are %. aDHS 200320; bEstimated: actually unknown since communal tribal land is inherited by males.
Overweight and obesity are two serious concerns in women of both countries (Table II). The prevalence of obesity was higher in South African women than in Kenyan women. Twenty-seven per cent of women in South Africa had a BMI ≥30 kg/m2 compared with 14.2% of Kenyan women. In both countries there were large urban–rural differences in BMI, with women in urban areas having the highest prevalence of obesity in both countries. Thirty-one per cent of urban and 21% of rural South African women were obese compared with 15.8% urban and 10.3% rural Kenyan women. Furthermore, in both countries BMI increased steadily with age. A high distribution of abdominal fat as shown by a high waist/hip ratio also increased by age group in both countries, with nearly 50% of women above 55 years having a waist/hip ratio ≥0.85. South African women had a higher mean waist/hip ratio at every age group and also in urban and rural areas compared with Kenyan women. In South Africa, 32% of women had a waist/hip ratio ≥0.85 compared with 18.5% of Kenyan women.
Body mass index and waist/hip ratio of participants in South Africa and Kenya.
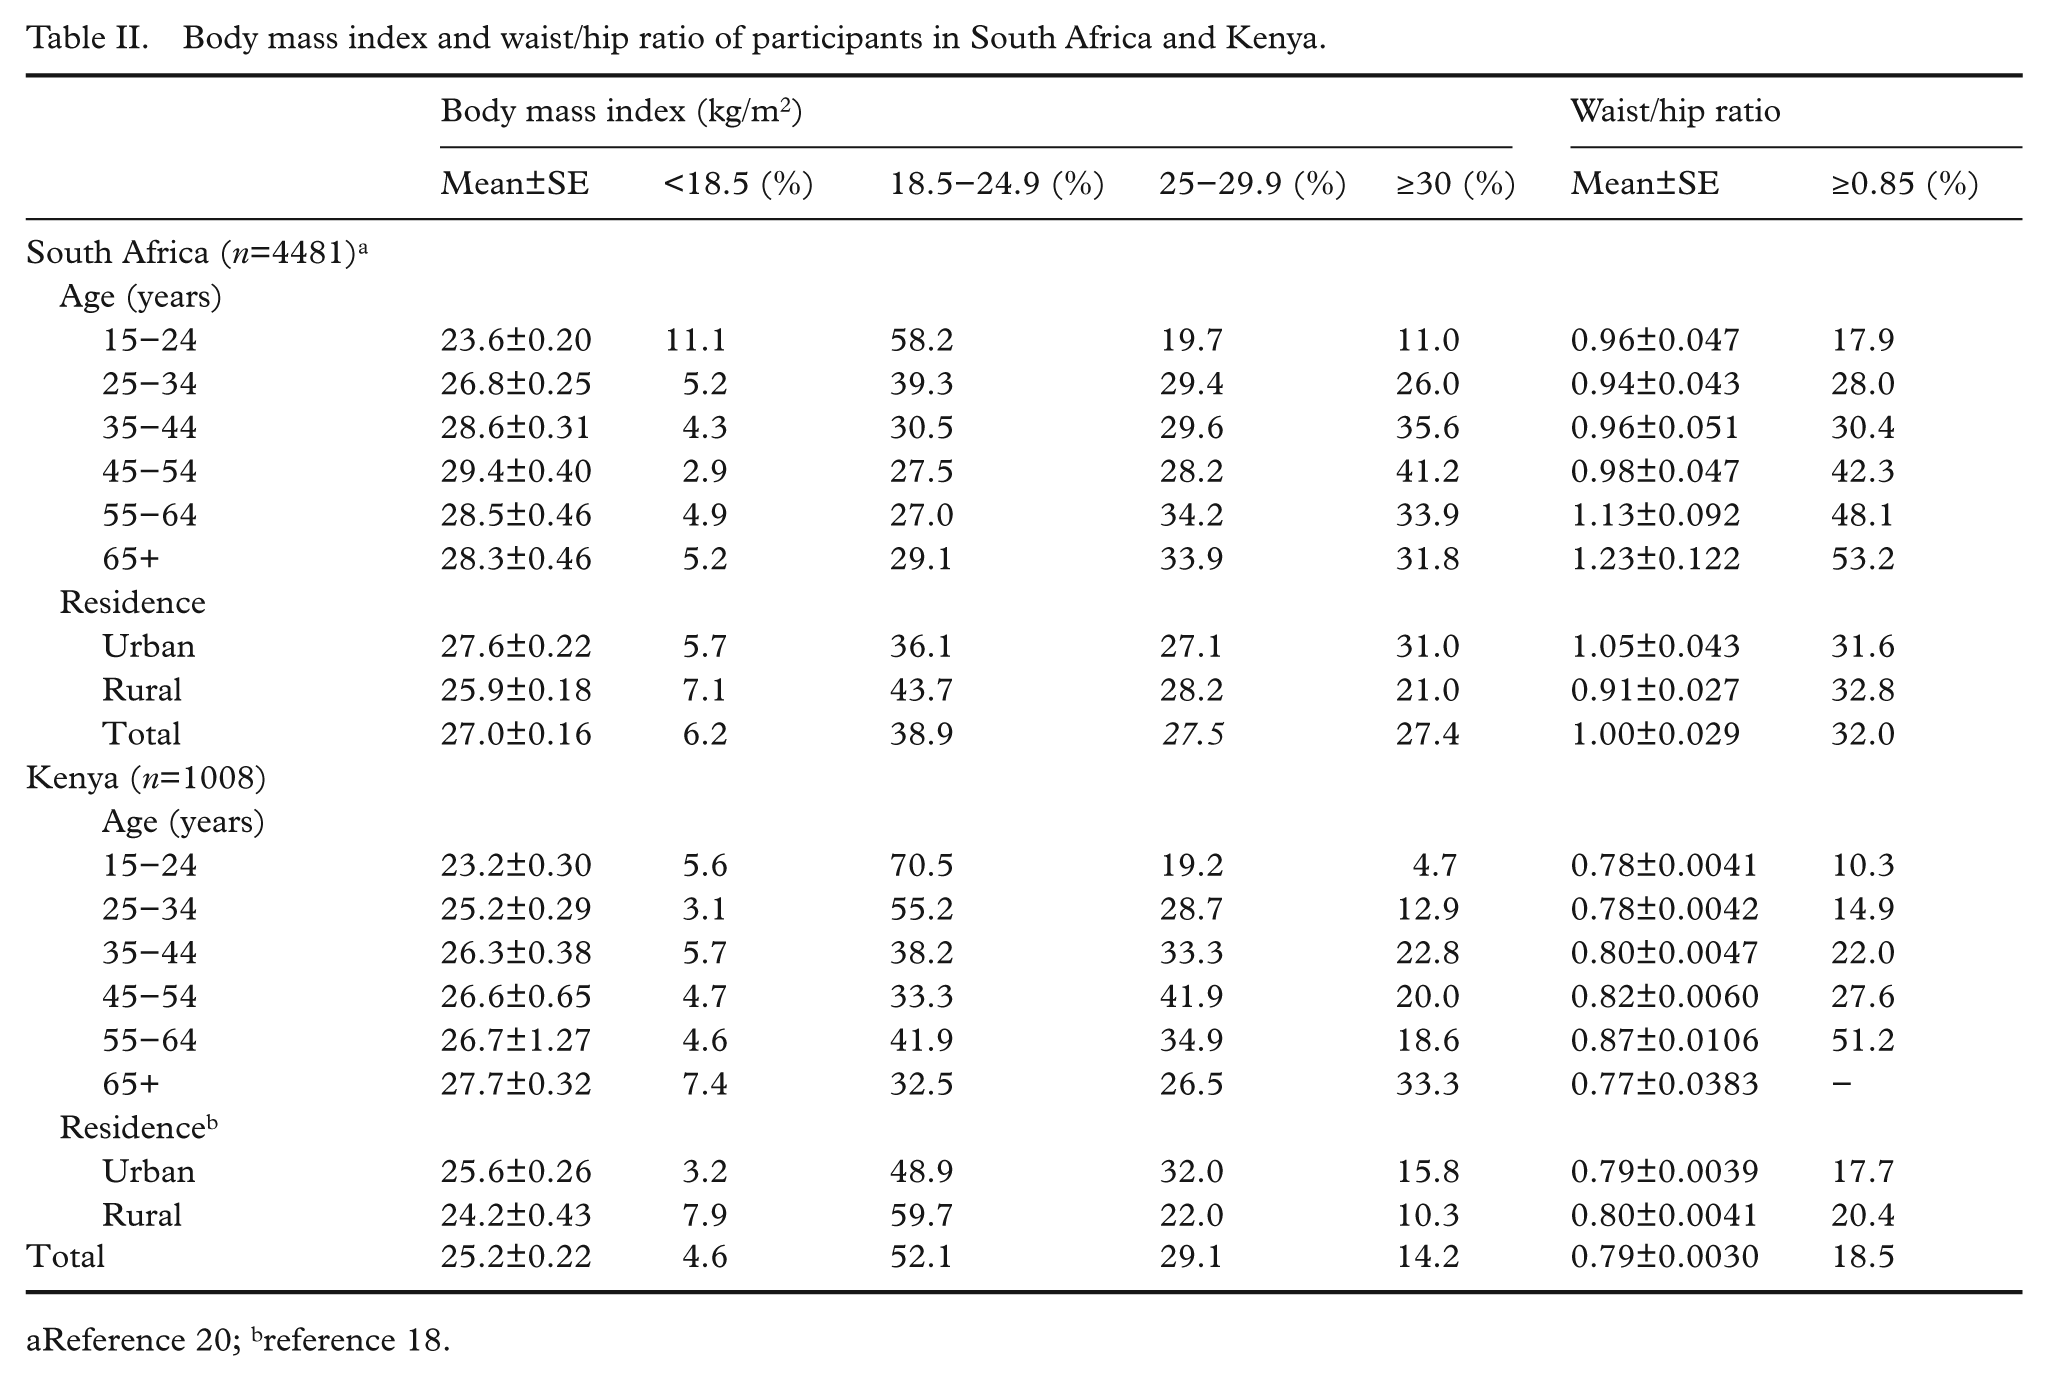
Reference 20; breference 18.
Nutrient adequacy and dietary variety are shown in Table III. In urban and rural South Africa, energy intakes were 1731 kcal and 1716 kcal, respectively, and 1679 kcal and 1610 kcal in Kenyan urban and rural areas, respectively. NARs for energy were very similar in the two countries although closer to 80% in South Africa. While protein NAR appeared to be adequate in South Africa, it fell below 100% in Kenya. The NARs for calcium were low in both countries with a large difference between South African rural (NAR=28.6%) and Kenyan rural (NAR=62.2%). Selenium was also low in the rural areas of both countries. South Africa had low NARs for folate and vitamin D while in Kenya it was for folate, niacin, vitamin B6, and vitamin D. Overall, the MAR of the South African diets (urban vs. rural, 63.4%; 55.9%) were similar to those of the Kenyans (60%; 57.3%), although better in South African urban compared with Kenyan urban areas and higher in Kenyan rural areas compared with South African rural areas. Table III also presents the NAR mean values for South Africa after fortification of maize and wheat flour in 2005 [29]. The nutrients added were iron, zinc, folate, niacin, riboflavin, thiamine, riboflavin, and vitamin B6. With fortification, the MAR increased to 70.1% in urban areas and to 75.6 in rural areas. NARs for all fortified micronutrients in South Africa increased to over 100% in rural areas and to a lesser degree in urban areas.
Nutrient adequacy ratios, food variety and dietary diversity scores of women in South Africa and Kenya.
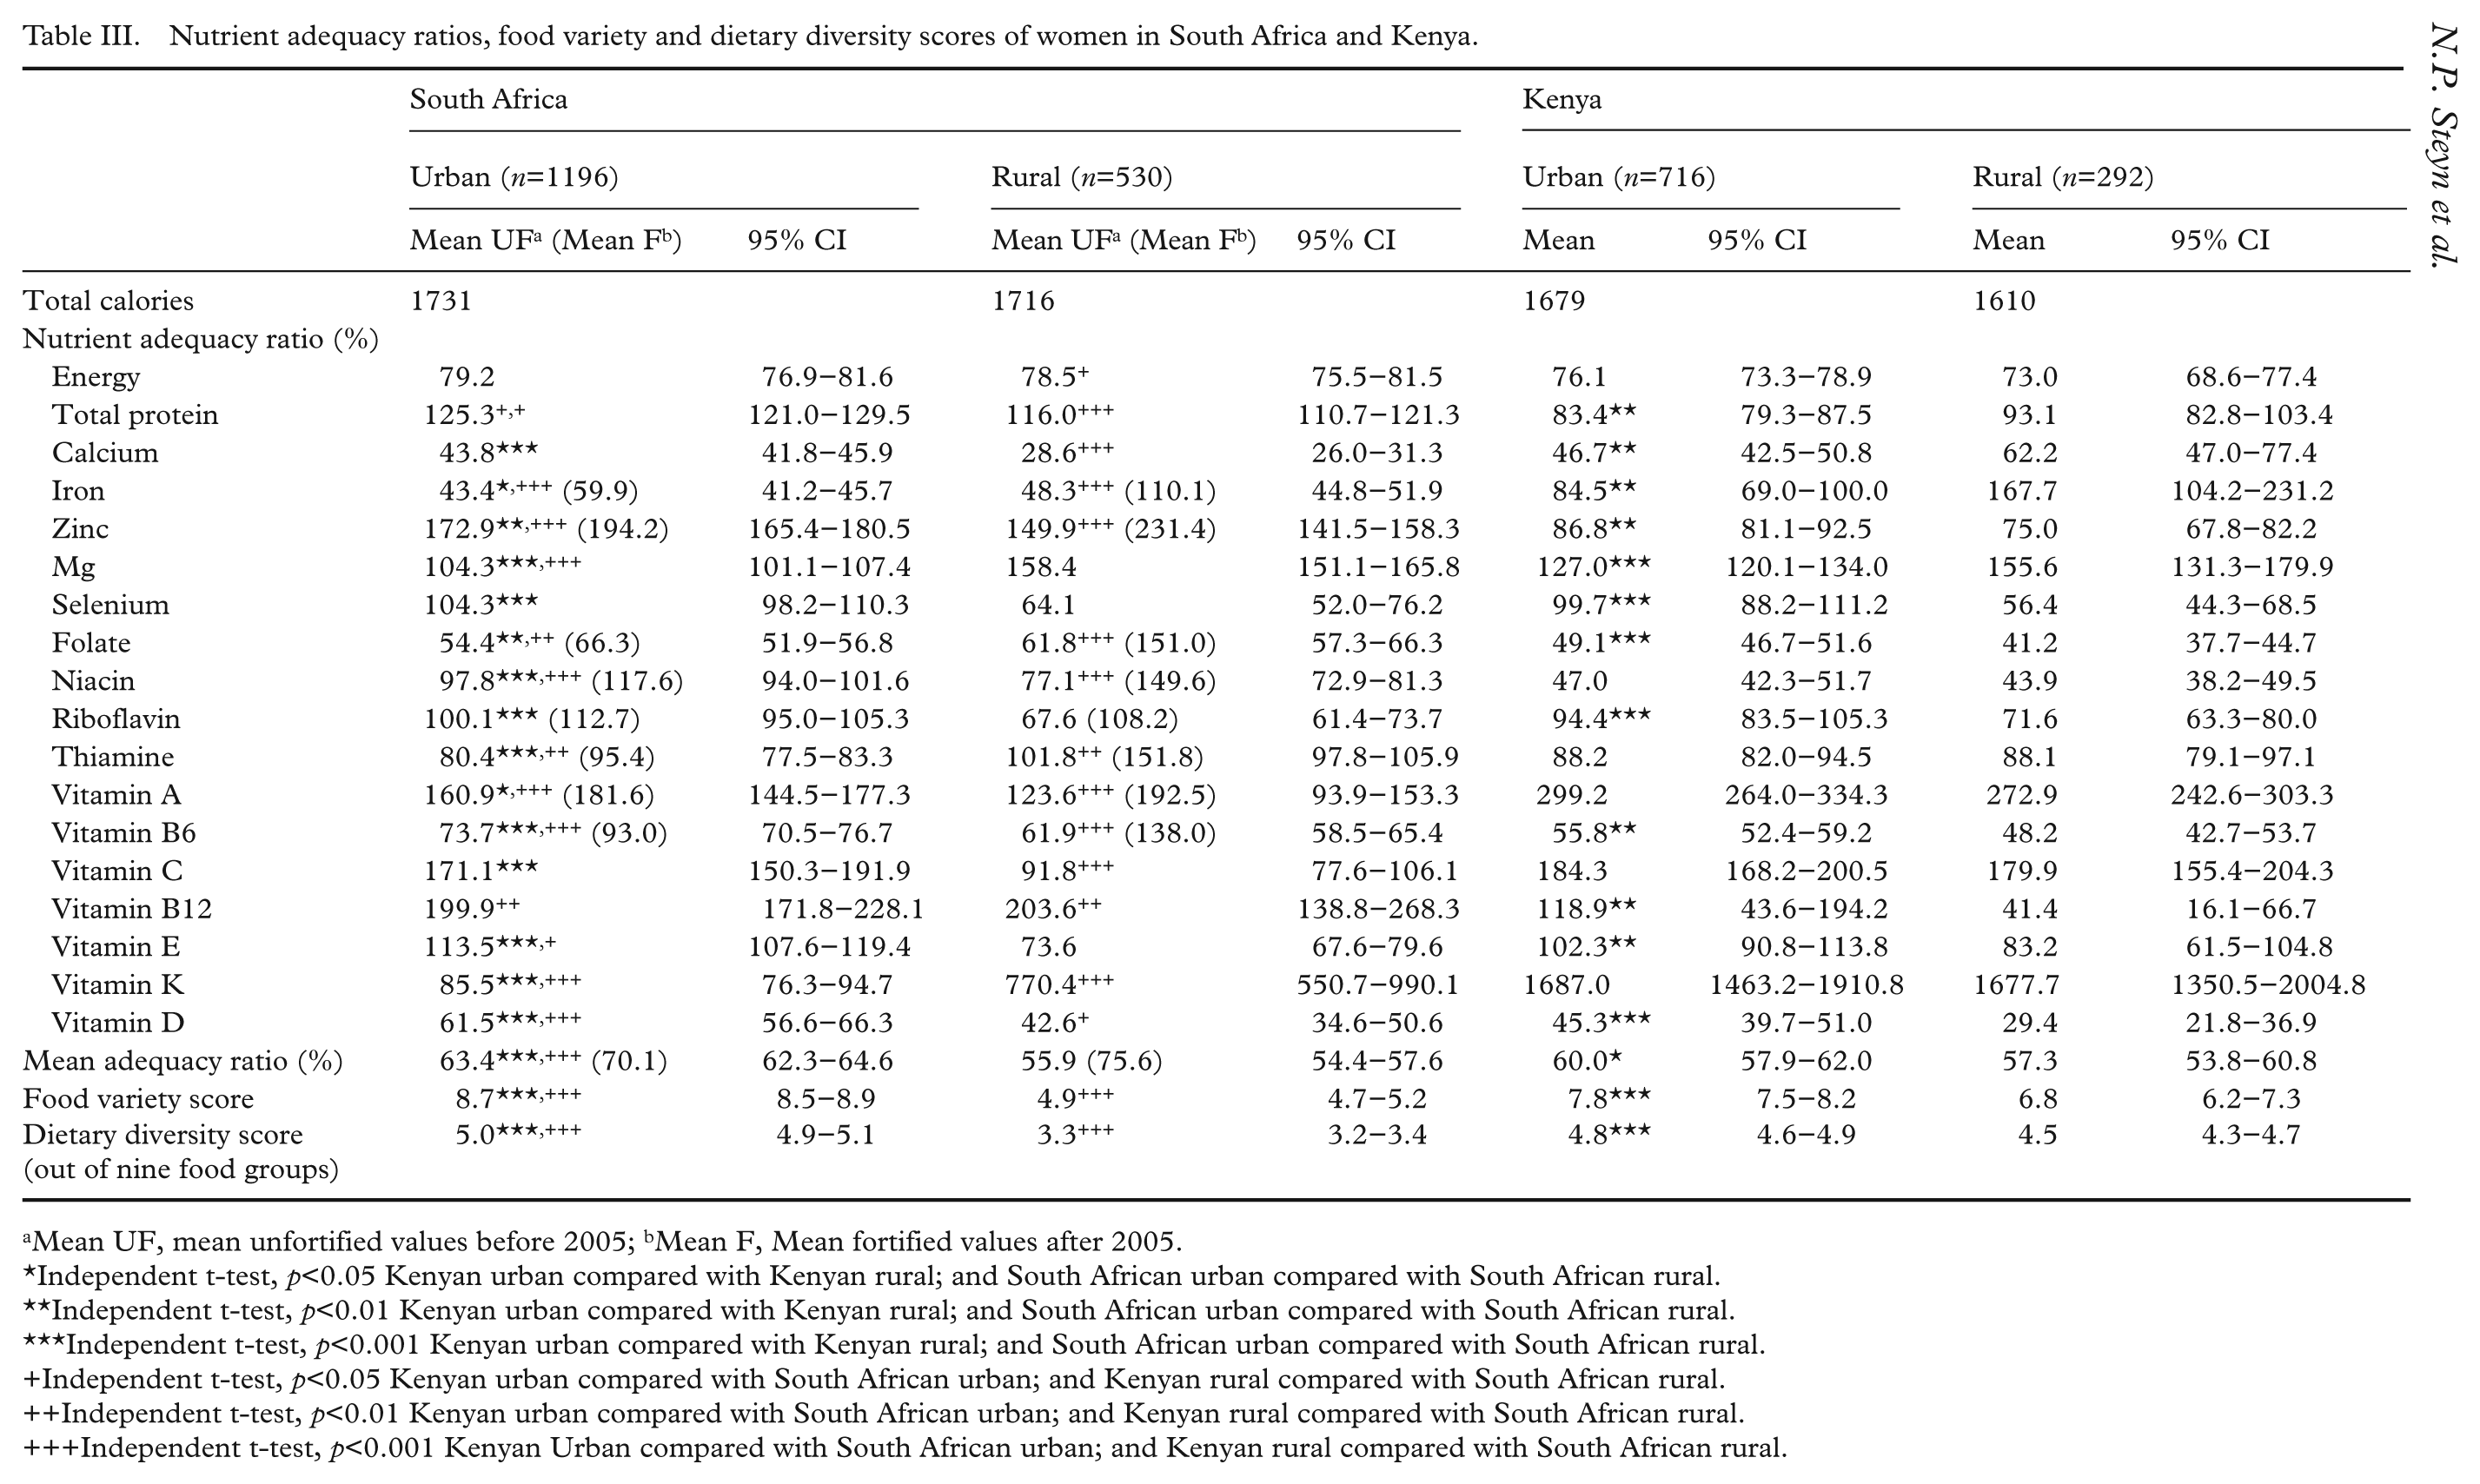
Mean UF, mean unfortified values before 2005; bMean F, Mean fortified values after 2005.
Independent t-test, p<0.05 Kenyan urban compared with Kenyan rural; and South African urban compared with South African rural.
Independent t-test, p<0.01 Kenyan urban compared with Kenyan rural; and South African urban compared with South African rural.
Independent t-test, p<0.001 Kenyan urban compared with Kenyan rural; and South African urban compared with South African rural.
Independent t-test, p<0.05 Kenyan urban compared with South African urban; and Kenyan rural compared with South African rural.
Independent t-test, p<0.01 Kenyan urban compared with South African urban; and Kenyan rural compared with South African rural.
Independent t-test, p<0.001 Kenyan Urban compared with South African urban; and Kenyan rural compared with South African rural.
DDS was lowest in South African rural women who consumed an average of only 3.3 (95% CI 3.2–3.4) food groups a day while rural Kenyan women consumed significantly more food groups (4.5, 95% CI 4.3–4.7, p<0.001) (Table III). Furthermore, the FVS was also significantly higher in Kenyan rural areas (6.8, 95% CI 6.2–7.3) compared with South African ones (4.9, 95% CI 4.7–5.2, p<0.01) indicating a population diet with very little variety, where the average person had five different food items per day. The average DDS was found to be 5.0 (95% CI 4.9–5.1) for South African urban areas and 4.8 (95% CI 4.6–4.9) in Kenyan urban areas. MAR differed significantly between South African and Kenyan (p<0.001) urban areas but not between rural areas.
Energy contribution from carbohydrates was virtually identical in South Africa and Kenya, being 56–57% in urban areas and 70% in rural areas (results not shown). Protein contribution to energy was lower in Kenya particularly with regard to animal protein intake. However total fat and saturated fat intakes as a percentage of total energy (E) intakes were considerably higher in Kenya in both urban (35% E; 12% E) and rural (30% E; 10% E) areas but especially in urban areas where they were higher than the WHO [30] recommendations of <30% E fat and <10% E saturated fat. Fat and saturated fat as a percentage energy intake was 29.1% E and 8.6% E in urban South African women and 15.6% E and 4.0% E in rural South African women, respectively. Actual fat intake for Kenyan women amounted to 62.3 g per person and for South African women 46.6 g per person [18]. Sugar intake was highest in South African urban areas at 13% while it was 8% in Kenyan urban women.
Table IV shows that the main food items consumed in both countries were virtually identical when examining only the top 10 items in terms of percentage who consumed them on the previous day. Additional staple foods appear on the Kenyan food list such as plantains, cassava, and millet which are not commonly consumed in South Africa. Kenyans also appear to have consumed more fruits, vegetables, and legumes than the South African adults. South African adults had a higher sugar intake by virtue of the higher intake of soft drinks (99 g vs. 31 g per capita).
Food items most commonly consumed in the diet as measured by 24-hour recalls.
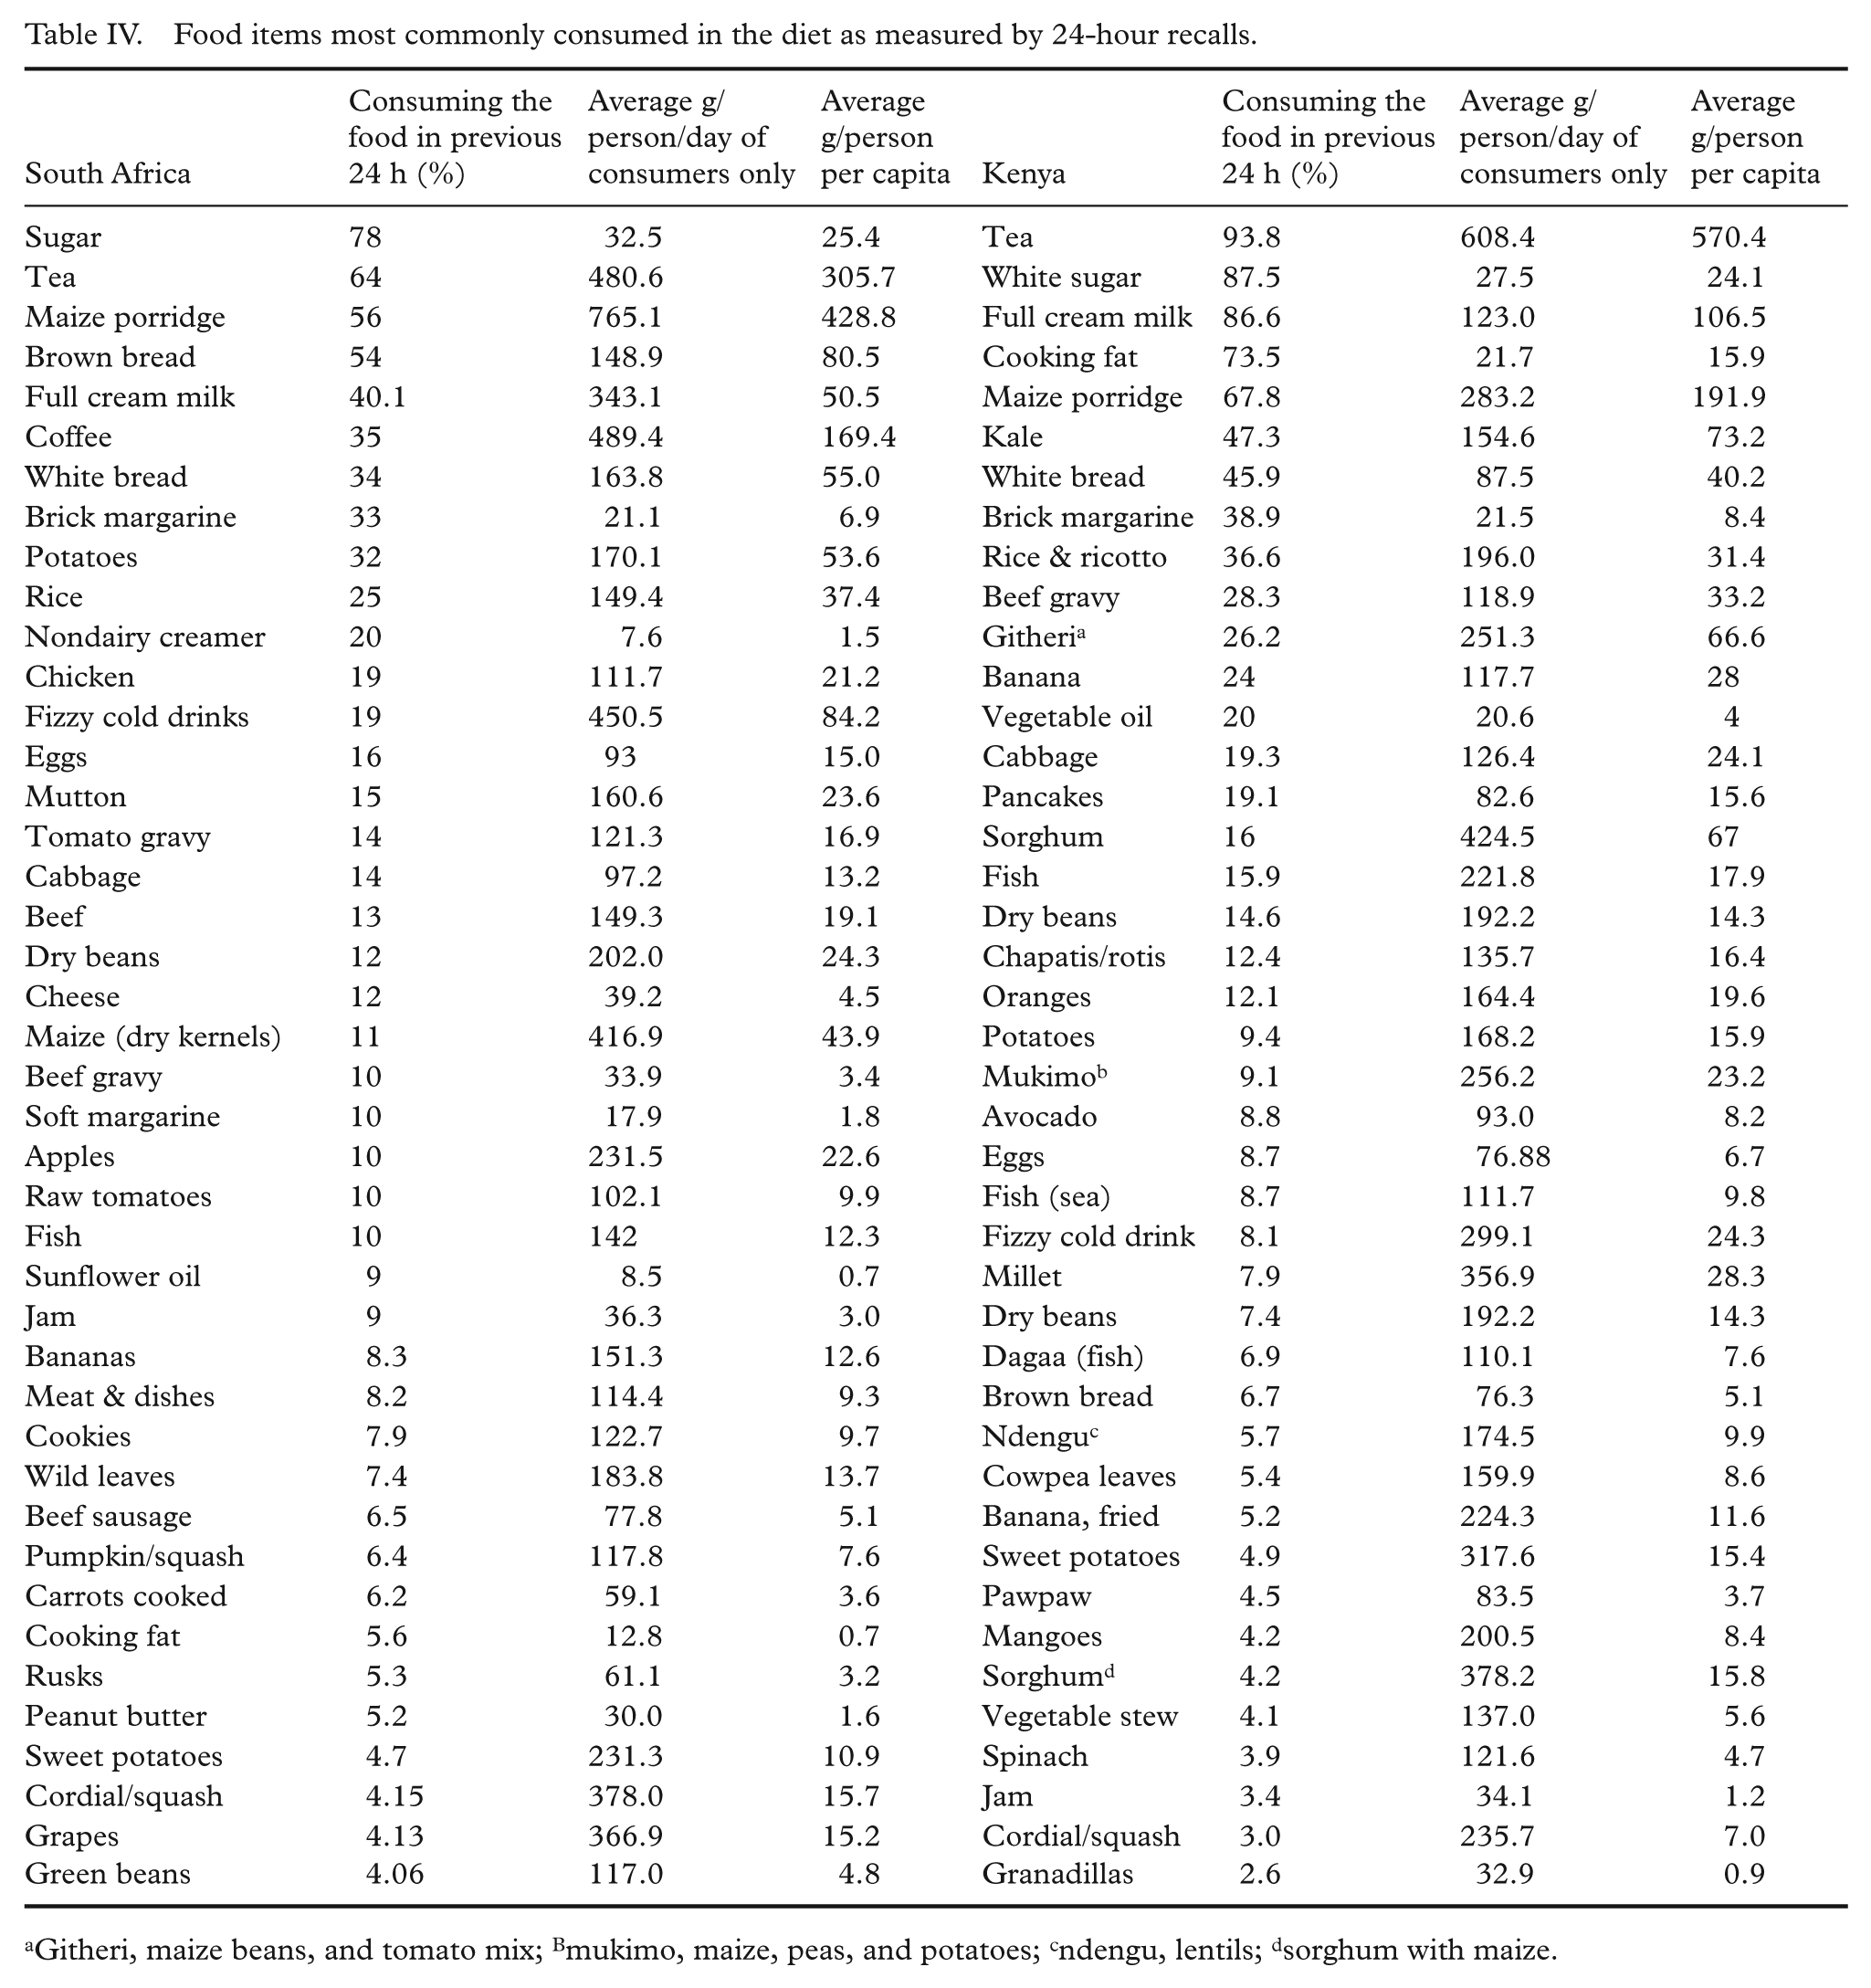
Githeri, maize beans, and tomato mix; Bmukimo, maize, peas, and potatoes; cndengu, lentils; dsorghum with maize.
Table V presents an indication of the likelihood of a sociodemographic factor impacting on DDS and MAR. Significant factors which increased the odds of having both a low DDS (<4) and a MAR of less than 75% as indicators of poor nutrient adequacy; were respectively: female headed households (1.50; 1.10); low education of woman managing the household (1.98; 1.15); having a communal tap (1.92; 1.15); having no fridge (1.90; 1.21); having no stove (2.09; 1.32); having no telephone (2.35; 1.14); having no car (6.85; 1.48); and having a low income (2.16; 1.14). Factors which bestowed significant protection were: high school education of woman managing the household (0.41; 0.84); <3 persons per room (0.55; 0.86); cooking with electricity (0.32; 0.84); and having their own tap on their property (0.37; 0.80).
Specific socioeconomic factors influencing dietary diversity score and mean adequacy ratio in Kenyan women, adjusted for age and locality.
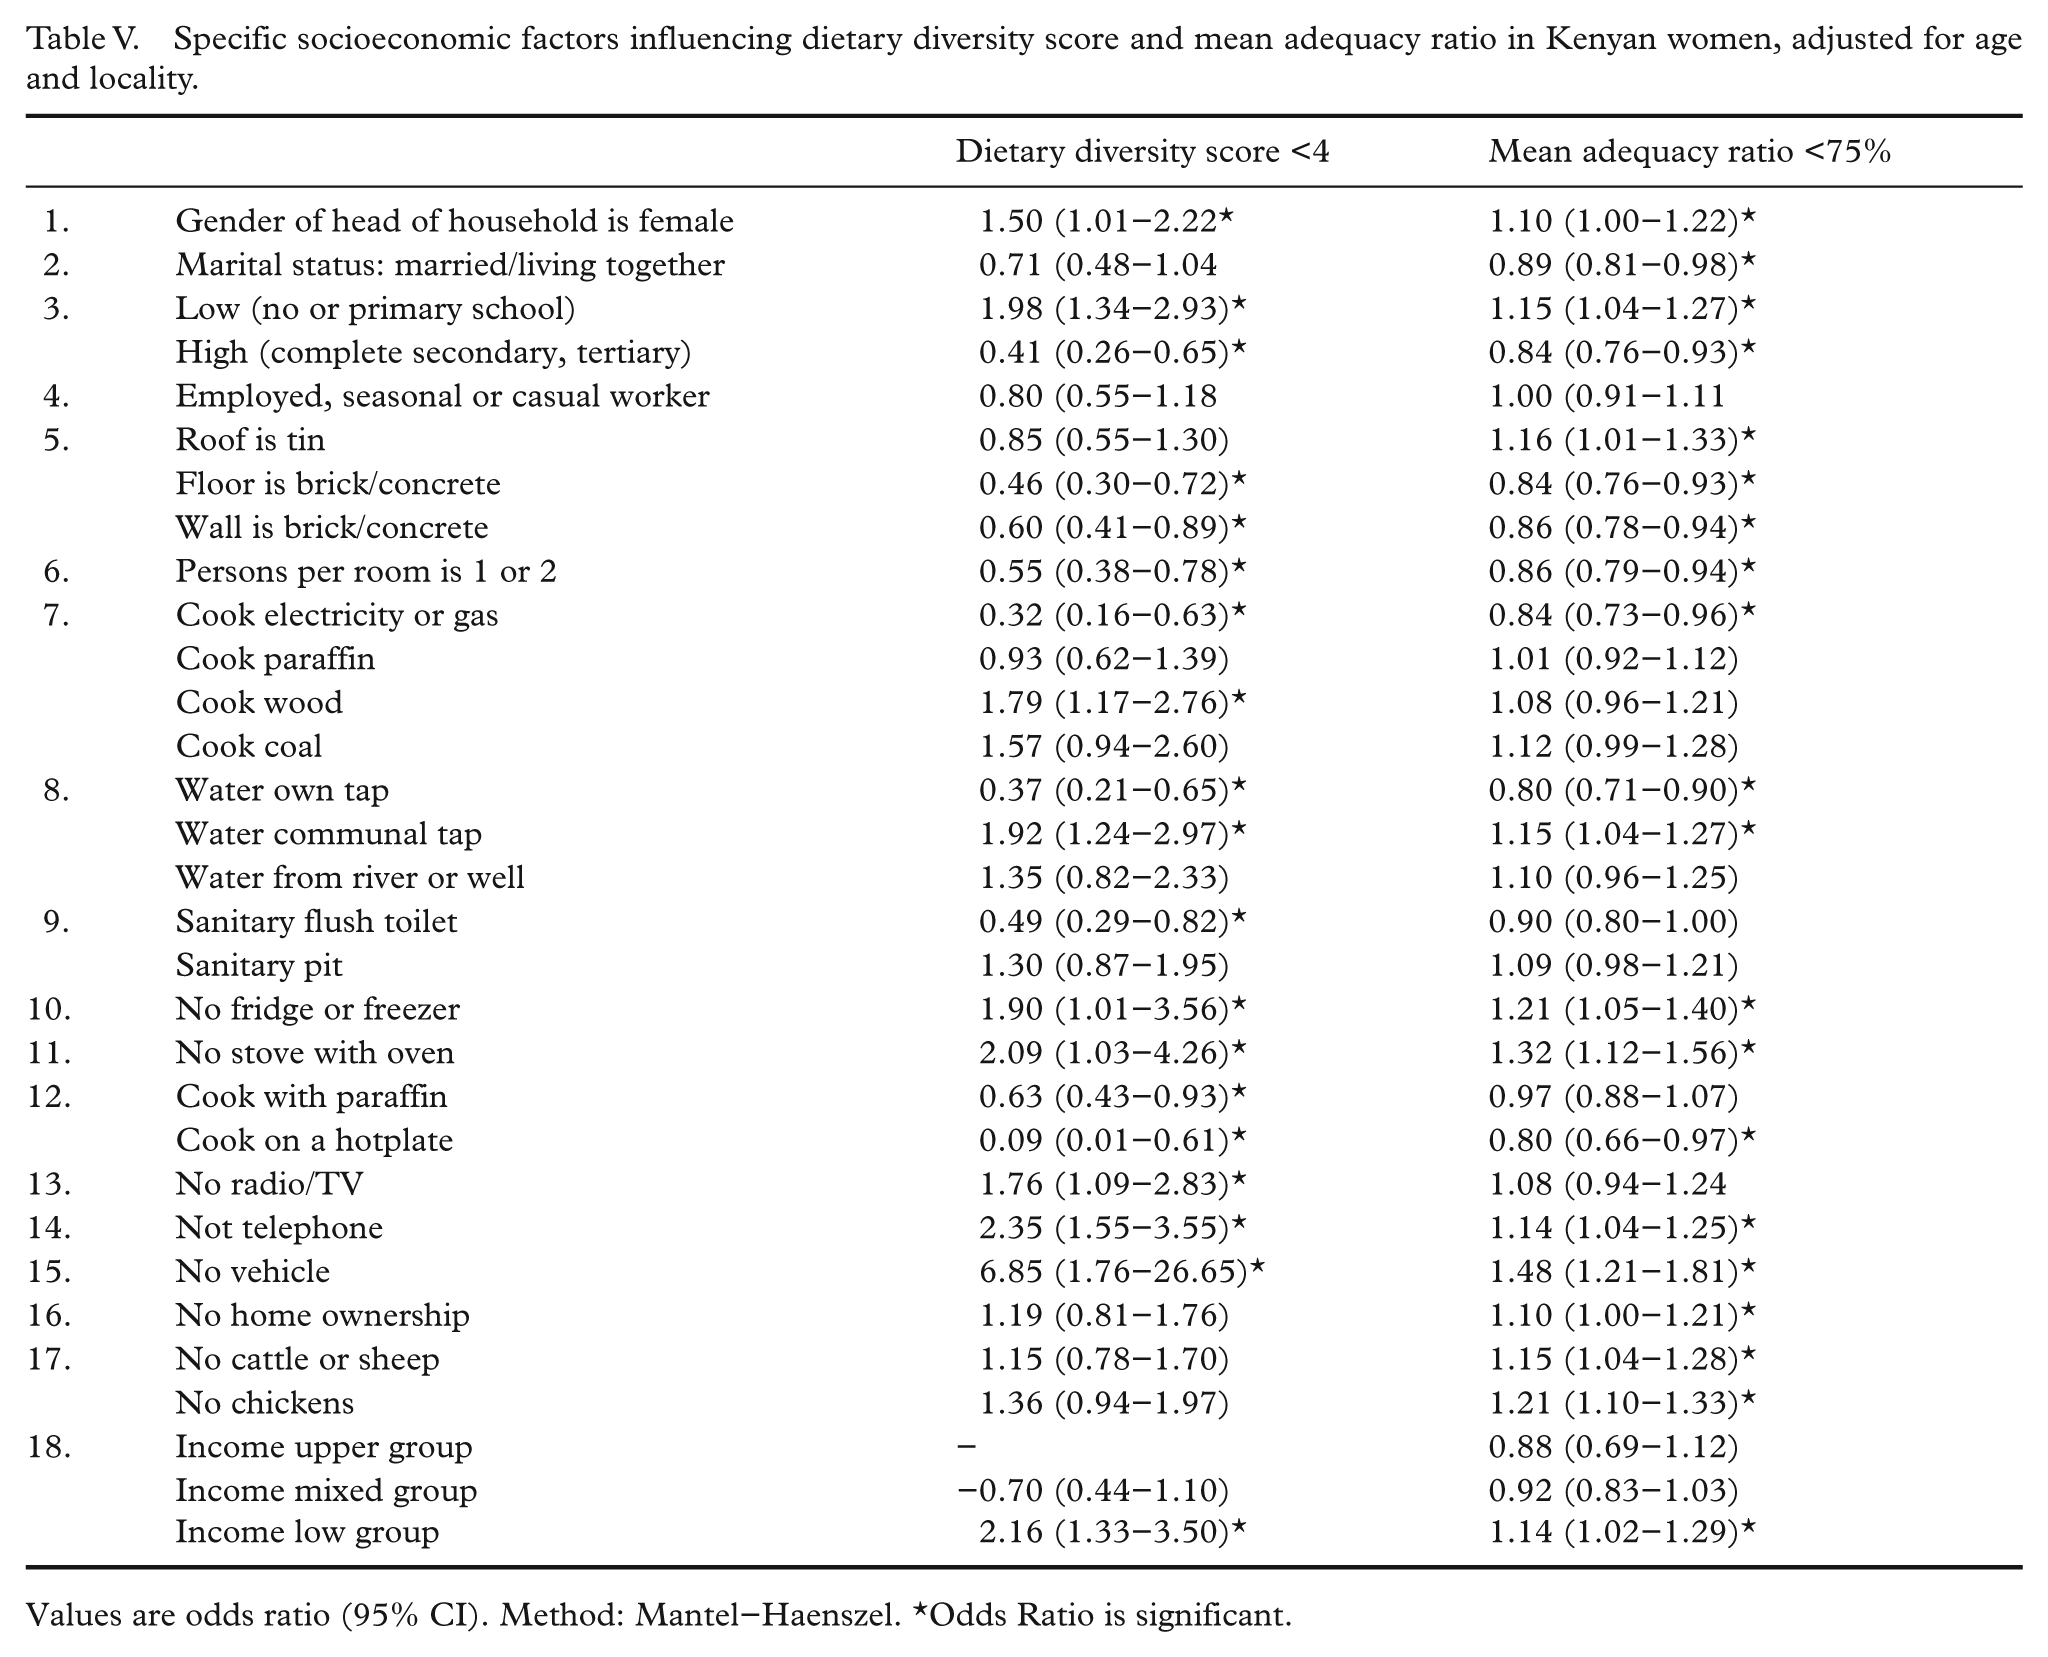
Values are odds ratio (95% CI). Method: Mantel–Haenszel. *Odds Ratio is significant.
Discussion
The results of the current study show some interesting findings between women in the two different countries. The Kenyan women were sociodemographically far more disadvantaged: the majority only had some primary education, their housing density was higher, and the majority did not have electricity or a tap on their premises, nor a flush toilet. Furthermore, these differences were more pronounced with the rural areas being worse off in all instances. Despite the dietary limitations of the study, namely the fact that the dietary database for South Africa was calculated based on numerous regional studies based on lack of a national survey; findings showed that carbohydrate intake as a percentage of energy intake were virtually identical in the two countries, with mean intakes being about 10% higher in rural areas, a typical non-Westernised trend. Mean energy intake from the surveys were also similar (in the two countries) with only about 100 kcal difference despite the finding that food balance sheets showed that South Africa had a per capita energy intake of about 1000 kcal more per day than Kenya [7].
The main differences in diet between the two countries, were found in protein and fat intakes. Fat intake as a percentage of energy intake was higher in Kenya, particularly in the rural areas compared to South African rural areas (30% E vs. 16% E), the latter being higher than that recommended by WHO [30]. Mean protein intakes were higher in South Africa. When examining the foods eaten, these differences are easier to understand. South African women had higher intakes of meat while Kenyans had higher intakes of fish and legumes. Fats and oils were highly prevalent on the intake list of Kenyans, including two items (cooking fat and brick margarine) appearing among the most common 10 items. Furthermore, many food items frequently eaten were fried, e.g. pancakes, chapattis, even bananas.
How does one explain the high contribution of fat intake in Kenya in terms of the nutrition transition, when fat intakes are usually lower in less developed (low income) countries? Food balance sheets for Kenya showed that in 2007 they had a lower protein (59.7 g) and fat (49.1 g) per capita intake than South Africa (80.9g; 81.9 g, respectively) [7]. However, food balance sheets are crude measures of dietary intake since they express availability of macronutrients assuming that these are evenly distributed in the population. The higher fat intake of the Kenyan women (in the survey) may be due to the finding that at the time of the study, spazas (informal shops) and local shops sold small packets of margarine (25 g) and oil. During the survey it appeared that these were being used by most households, while they were not available in small quantities in South Africa. Margarine could hence be purchased daily in small quantities in Kenya, negating the need for a refrigerator; which most rural households did not possess.
Another way to explain this paradox is to consider the possibility that the fat intake of the South African women was underestimated. Since there has never been a national quantified dietary survey in South African adults, it is possible that the dietary intake model [22,23], used in this study (which was based on smaller regional studies) may have underestimated the actual percentage contribution of fat to energy intake. This may be the most likely explanation since the rural intakes are based on studies which were small and may not necessarily have reflected rural intakes elsewhere. Additionally, the largest urban study in black adults was undertaken nearly 20 years ago and fat intake is likely to have increased since then as South Africa has been undergoing rapid urbanisation. It is therefore recommended that withstanding the possibility of a national study that fat intakes per se are evaluated in further studies in South Africa in rural and urban areas.
A finding of significance in the present study was the fact that adults in rural Kenya had a better MAR, FVS, and DDS than those in rural areas of South Africa at the time of the study and these differences were statistically significant. The most obvious reason for such differences was the finding that the majority of Kenyan women (61%) had access to land and were able to produce a variety of foods for their own consumption as well as being able to pick indigenous (wild) fruit and vegetables from their surroundings, unlike the average black South African. Mandatory fortification of wheat flour and maize meal did, however, increase the MAR in rural South African regions considerably, by nearly 25% [29]. This raises the issue of introducing mandatory fortification as a means of improving dietary quality in Kenya. Such a move would considerably improve the overall nutrient adequacy of the Kenyan diet and is highly recommended.
Conclusion
Urban–rural differences in diet and weight status indicated that the nutrition transition was similar in both countries despite large sociodemographic differences; however, rural Kenyan women had a better MAR, DDS, and FVS than South African women until 2005, most probably due to 60% having access to land. After fortification was introduced in South Africa, MAR improved significantly in urban and rural women. Fortification is recommended as a means of improving dietary quality in Kenya.
Footnotes
This study was supported by Unilever and the South African Medical Research Council (grant number- UND 15/8/2004).
No conflict of interest declared.