
Abstract
Background: The Lapinlahti 2005 study was carried out to explore cardiovascular disease risk factors, lifestyle and quality of life in Lapinlahti residents in eastern Finland. Our aim was to study the association between lifestyle and health-related quality of life (HRQoL) in the community. Subjects and methods: The present study is based on the baseline data of the followed up (2005–2010) population-based cohort (N = 376, n of males = 184). A trained research nurse measured weight, height, waist circumference and blood pressure. Self-reported HRQoL was measured using a 15D questionnaire. A BDI-21 inventory was used to assess the presence of self-reported depressive symptoms. Lifestyle factors (nutrition, exercise, smoking and alcohol use) were examined with a structured questionnaire. Each lifestyle item was valued as −1, 0 or 1, depending on how well it corresponded to the recommendations. Based on the index the participants were divided into three lifestyle sum tertiles: I = unhealthy, II = neutral and III = healthy. The age- and sex-adjusted linear trend between the tertiles was tested. Results: The 15D score had a positive linear relationship with the lifestyle tertiles (P = .0048 for linearity, age- and sex-adjusted). Respectively, self-reported depressive symptoms were less frequent among subjects with a healthier lifestyle (P = .038).
Introduction
The World Health Organization (WHO) defines quality of life as the living conditions associated with the corresponding goals, expectations, standards and concerns of each individual living in different cultural systems [1]. Health-related quality of life (HRQoL) is a multidimensional construct of physical, psychological and functional well-being [2]. HRQoL is increasingly used as an outcome in clinical trials, effectiveness research and research on quality of care [3]. The concept of HRQoL and its determinants have evolved since the 1980s to encompass those aspects of overall quality of life that can be clearly shown to affect health, either physical or mental [4].
Smoking, alcohol consumption, poor diet and physical inactivity are among the top 10 risk factors for death and disability in Western countries [5]. There is evidence from various countries that obesity is associated with impaired HRQoL, and especially physical functions in both genders [5,6]. It is reported that lifestyle interventions, especially in physical activity, ameliorate HRQoL [7]. Among patients at risk for cardiovascular disease the number of uncontrolled (not achieving treatment goals) risk factors (RR mean >140/90, total cholesterol >5 mmol/L, blood glucose >6.1 mmol/L fasting or >10 mmol/L random, BMI >30 and smoking) was associated with impaired HRQoL [8]. However, the HRQoL in that study was only modestly lower among patients with risk factors compared with those without risk factors. Interestingly, physical activity level had more pronounced relationship with the HRQoL. Obesity is associated with decreased disability-adjusted life years (DALY) [9]. Smoking is associated with shortened life expectancy [10] and it is also significantly and negatively associated with HRQoL [10]. Several studies have examined the association between HRQoL and alcohol use [11,12]. One study from 2004 reported that frequent binge drinking was associated with significantly worse HRQoL and mental distress, including stress, depression and emotional problems [13].
Physical activity is associated with a reduced risk for health conditions, including coronary heart disease, diabetes and stroke [14]. One study showed that a higher level of physical activity is associated with better HRQoL. This relationship was consistent across different measures and types of physical activity [15]. A study among Chinese civil servants showed that a decline in HRQoL is closely related to poor eating habits and an irregular lifestyle [16].
Most studies have focused on the relationship between a specific lifestyle issue (e.g. smoking) and HRQoL. Few studies have explored the association between lifestyle as a whole and HRQoL [16,17]. A large population-based study indicated that multiple healthy behaviours increase the chance of reaching old age disease-free and fully functional in an additive manner, better than any particular lifestyle factor [17]. However, at the community level, we do not know much about the potential burdens of people with different lifestyle patterns. This information could benefit professionals involved in health promotion and clinical work when planning and targeting actions. Among these issues may be HRQoL-related factors. Therefore, we explored these relationships in a community-based sample.
Our aim was to assess in the community based-setting whether there is a relationship between multiple health behaviours, HRQoL and depressive symptoms.
Materials and methods
Lapinlahti, with a total population of 10,289, is a typical semi-rural municipality in eastern Finland, with a demographic shift to older age strata and increasing migration of the young and economically active population to urban centres (Statistics Finland, available at: https://www.tilastokeskus.fi/index_en.html). In 2005, 480 (230 men and 250 women) underwent a complete health survey that consisted of a structured questionnaire and a health examination [18]. The present study is based on the baseline data of the followed up (2005–2010) cohort (N = 376, n of males = 184). Age, sex distribution, educational level, marital status, employment status and BMI were similar in subjects who were lost from follow-up or were not responded and those who were followed up. Complete information about HRQoL was for 358 subjects.
The health examination included measurements of weight and height, blood pressure and waist circumference. Weight was measured in light clothing with a calibrated Camry® standing scale to the nearest 0.1 kg, and height was measured in a standing position to the nearest 1.0 cm. Body mass index (BMI) was calculated as weight/height2. Waist circumference was measured at the midpoint between the lowest rib and the iliac crest. For the blood pressure measurements, we used an Omron® M3 semiautomatic device. Blood pressure was taken in a sitting position at 5-minute intervals after 10 minutes of rest. For the statistical analysis, we calculated the means of the three measurements.
All the laboratory investigations were performed according to the protocol of the Kuopio University Hospital’s medical laboratory. Glucose level was tested from capillary blood with a glucometer (HemoCue 201) which was calibrated for plasma glucose level. Other laboratory tests were done from the serum of venous blood. Lipid levels were measured with a Cobas 6000 analyser as follows: plasma cholesterol (P-chol) by using a colorimetric enzymatic assay, plasma high-density density cholesterol (P-chol-LDL) by using a homogenous enzymatic colorimetric assay, plasma low-density cholesterol (P-chol-LDL) by using a homogenous enzymatic colorimetric assay and triglycerides by using an enzymatic colorimetric test. High-sensitivity CRP (hs-CRP) was analysed by using an enhanced immuno-turbidimetric assay.
The study participants filled out a structured questionnaire including background variables (e.g. age, gender, marital status, vocational education, employment status and lifestyle variables). HRQoL was measured with the 15D questionnaire [19]. The 15D instrument is a generic, multidimensional, standardized, self-administered evaluative HRQoL tool that can be used primarily as a single index measure, but also as a profile measure [19–21]. It describes health status by assessing 15 dimensions, namely: mobility, vision, hearing, breathing, sleeping, eating, speech, elimination, usual activities, mental function, discomfort and symptoms, depression, distress, vitality and sexual activity. Each dimension is comprised of one question with five answer options. A single index score (the 15D score) is obtained by incorporating population-based preference weights to the dimensions. The maximum score is 1 (no problems in any dimension) and the minimum score is 0 (being dead) [19,21]. The 15D instrument has good test–retest reliability, construct validity and discriminatory power in general populations [19,21]. It has been observed that a change or difference of ≥ 0.03 is clinically or practically important or significant change [19].
Depressive symptoms were assessed using the 21-item Beck Depression Inventory (BDI-21) [22]. The sum index was constructed from the questions (range 0–63) and 10 scores were used as a cut-off point for depressive symptoms. This cut-off score has been shown to indicate at least mild depression [23].
The questionnaire included lifestyle items regarding smoking, alcohol use, exercise and nutrition. These lifestyle variables were given a value of −1, 0 and +1. In Finland, there are national guidelines and recommendations regarding smoking, alcohol, exercise and nutrition [24,25]. Based on these recommendations, we ranked lifestyle as follows: meal beverage (+1 = water or non-fat milk, 0 = skimmed milk or sour milk, −1 = fatty milk or something else), cooking fat (+1 = nothing or margarine, dairy spread, 0 = mixture of butter and vegetable oils, −1 = butter or something else), spreads (+1 = nothing or margarine spread, 0 = mixture of butter and vegetable oils, −1 = butter or something else), cooking fat and spreads were combined; use of vegetables (+1 = used more than 6 times/week, 0 = used from 1 to 5 times /week, −1 = never or occasional); berry and fruit intake (+1 = used more than 6 times/week, 0 = from 1 to 5 times /week, −1 = never or occasionally), vegetable, berry and fruit intake (VBF) were also combined into a new variable as was done with fats; adding salt to food (+1 = never, 0 = usually when food doesn’t taste salty enough, −1 = often even without tasting); alcohol consumption (male: +1 = less than 5 doses/week, −1 = over 5 doses/week or more, female: +1 = less than 4 doses/week and −1 = 4 doses/week or more); smoking (+1 = never smoking, −1 = regular or irregular smoking); exercise (+1 = daily or more often, 0 = from 1 to 6 times /week, −1 = less than one time/week). All these values were summed up and a mean value (ranging from −1 to +1) was calculated for each participant. The participants were divided into three tertiles (I = unhealthy, II = neutral and III = healthy) according to the value of the sum score. Figure 1 shows the distribution of sum score and tertiles.
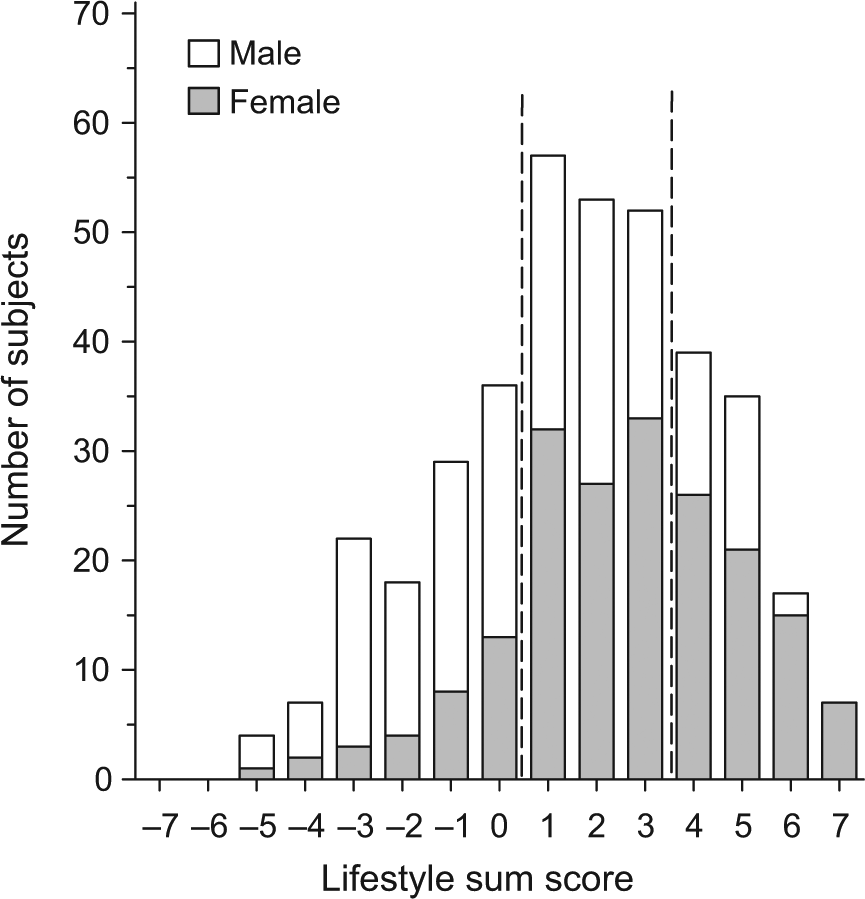
The distribution of sum score and tertiles.
The data are presented as the means and standard deviations or as counts with percentages. The statistical comparisons between groups were performed by using the analysis of variance (ANOVA) for continuous variables; Kruskal–Wallis test for ordinal and chi square test for categorical variables. Statistical significance for the hypotheses of linearity was evaluated by using generalized linear models with appropriate distribution and link function. In the case of violation of the assumptions (non-normality), a bootstrap-type or permutation test (Monte Carlo p value) was used. The normality of variables was evaluated by the Shapiro–Wilk W test. All analyses were adjusted with age and sex. A p value less than 0.05 were regarded as significant.
All the participants signed an informed consent form. Ethical permission for the study was granted by the ethics committee of the Kuopio University Hospital.
Results
The demographic and clinical characteristics of each of the three lifestyle tertiles (I, unhealthy; II, neutral; III, healthy) are presented in Table I. There was a relationship between gender and lifestyle (the amount of females is highest in tertile III). Age was similar in all three tertiles. Higher education was more common in the neutral and healthy tertiles than in the unhealthy tertile. We did not find a relationship between lifestyle and waist circumference or BMI. The proportions of subjects using medication for blood pressure, diabetes, elevated lipids or depression were similar in all the tertiles. Neither was there a relationship between lifestyle and blood pressure or hs-CRP. However, lifestyle had relationship to total cholesterol level and fasting glucose. In addition, among women, triglyceride levels were significantly lower in tertile III than in tertiles I and II.
Demographic and clinical characteristics of the study population according to lifestyle tertiles.
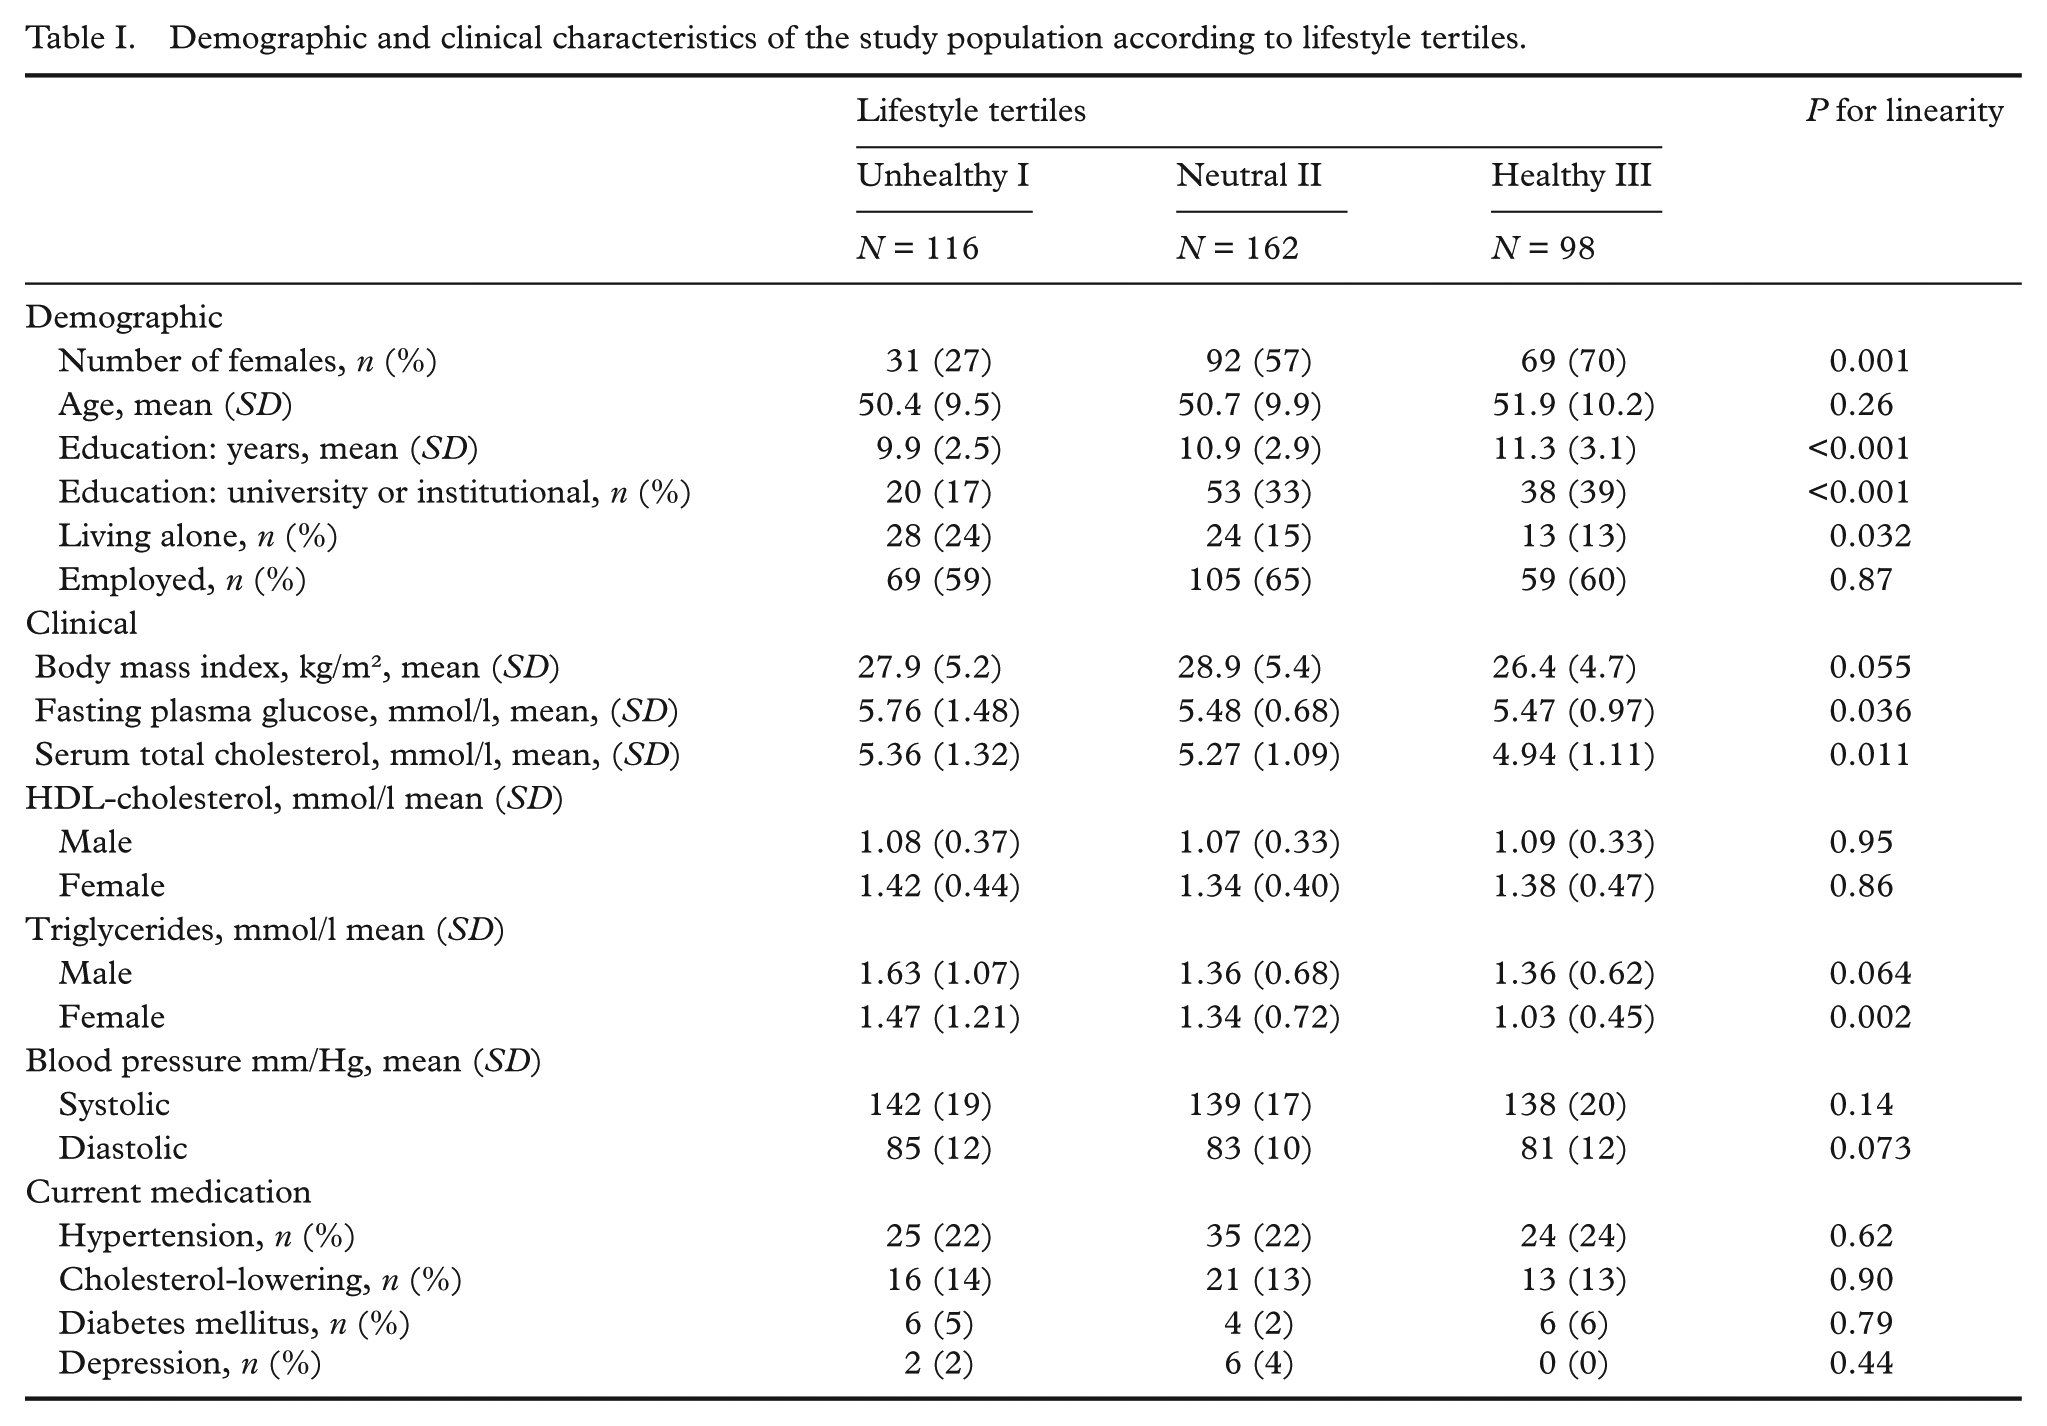
Figure 2 indicates the scores for each particular item (smoking, alcohol use, exercise, VBF, meal beverage, meal fat and use of added salt) of the lifestyle score according to the total score tertiles (unhealthy, neutral, healthy). All subjects who were in the healthy tertile (tertile III) had the positive (healthy) value (score > 0.25) for each of the particular items of the lifestyle index. Among the subjects in the neutral (II) tertile, the score was positive for smoking, alcohol use and exercise but negative in all nutrition questions. This indicates that subjects who were at least moderately physically active and neither smoked nor used alcohol excessively nevertheless may often have unhealthy nutrition-related lifestyles. In the unhealthy (I) tertile, the score was positive only for alcohol use and negative in all other questions, indicating that subjects with an unhealthy lifestyle in relation to all other items however do not usually report excessive alcohol use.
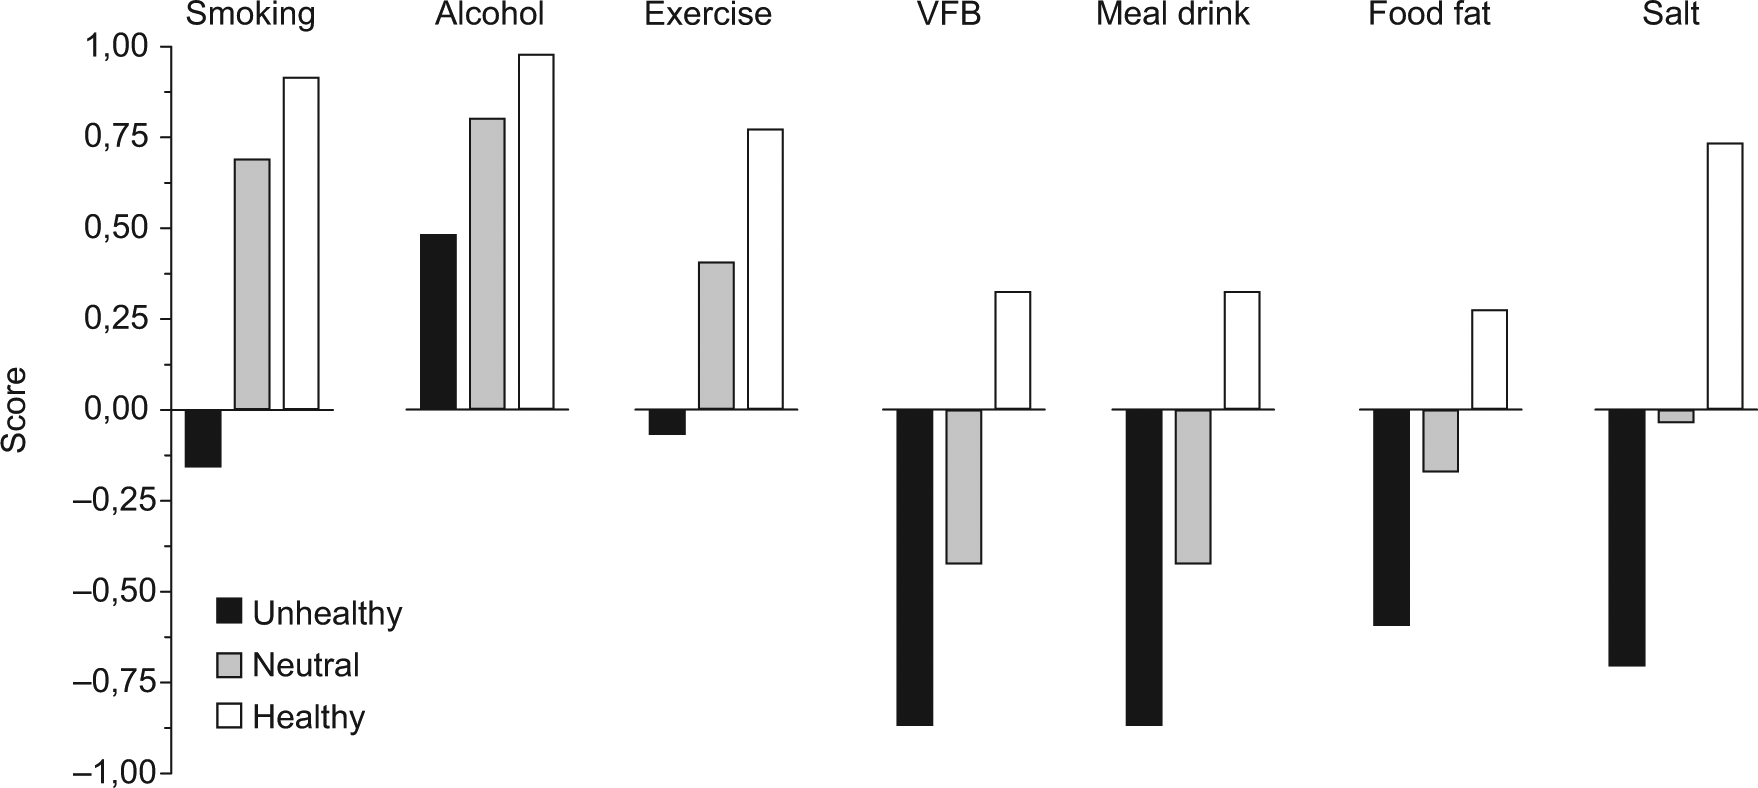
Particular lifestyle scores for items of smoking, alcohol use, exercise, use of vegetables, berries and fruits (VBF), meal drink, meal fat and use of added salt according to the total lifestyle score tertiles (unhealthy, neutral, healthy).
The linear relationship of the scores of each particular item was in line with the total score. This indicates that in each item, subjects in the unhealthy tertile had the lowest score and subjects in the healthy tertile had the highest score (age- and sex-adjusted, p < .001).
Figure 3 presents the total 15D score and the proportion of subjects with self-reported depressive symptoms by lifestyle tertiles. In the lifestyle tertile comparison, there was a linear decrease in the 15D total score towards an unhealthy lifestyle (p = .0048). The crude mean values were 0.907 (SD 0.087) in tertile I, 0.923 (SD 0.069) in tertile II and 0.932 (SD 0.070) in tertile III. Age and sex adjusted difference between tertile III and tertile I was 0.031 (95% CI: 0.01 to 0.055; p = .011). Similarly, the proportion of subjects with depressive symptoms decreased linearly towards a healthier lifestyle (p = . 038).
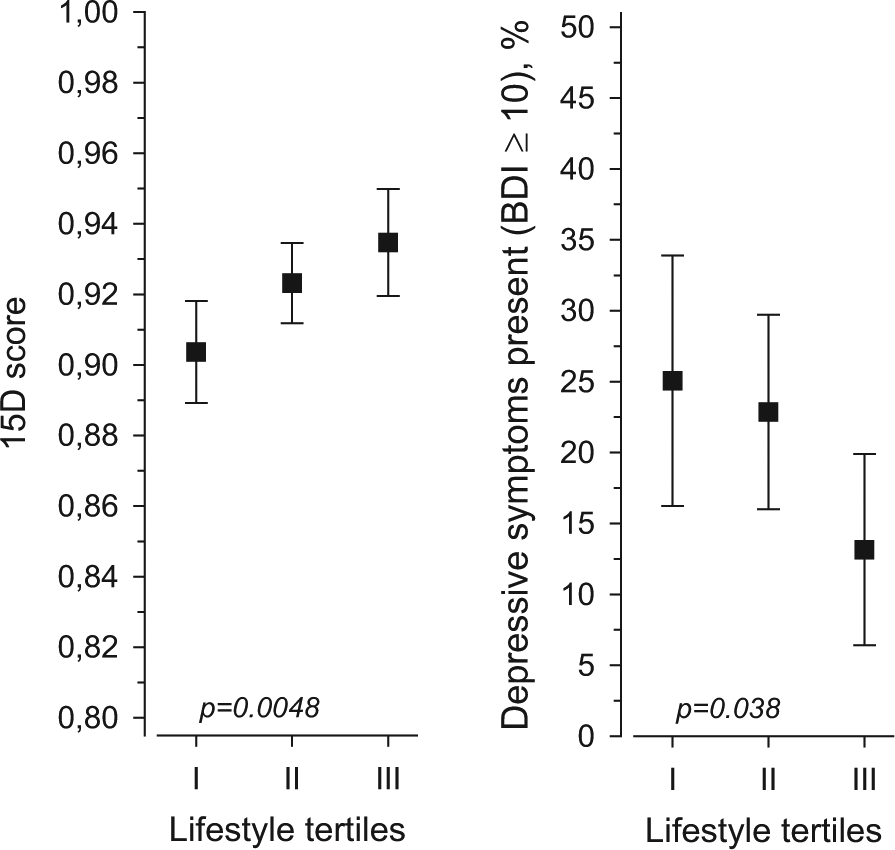
15D total score and proportion of subjects with self-reported depressive symptoms by lifestyle tertiles.
Figure 4 presents the 15D profile by lifestyle tertiles. Linear relationships were found for breathing, usual activities, depression, vitality and discomfort and symptoms; the most significant relationship being for usual activities and depression.
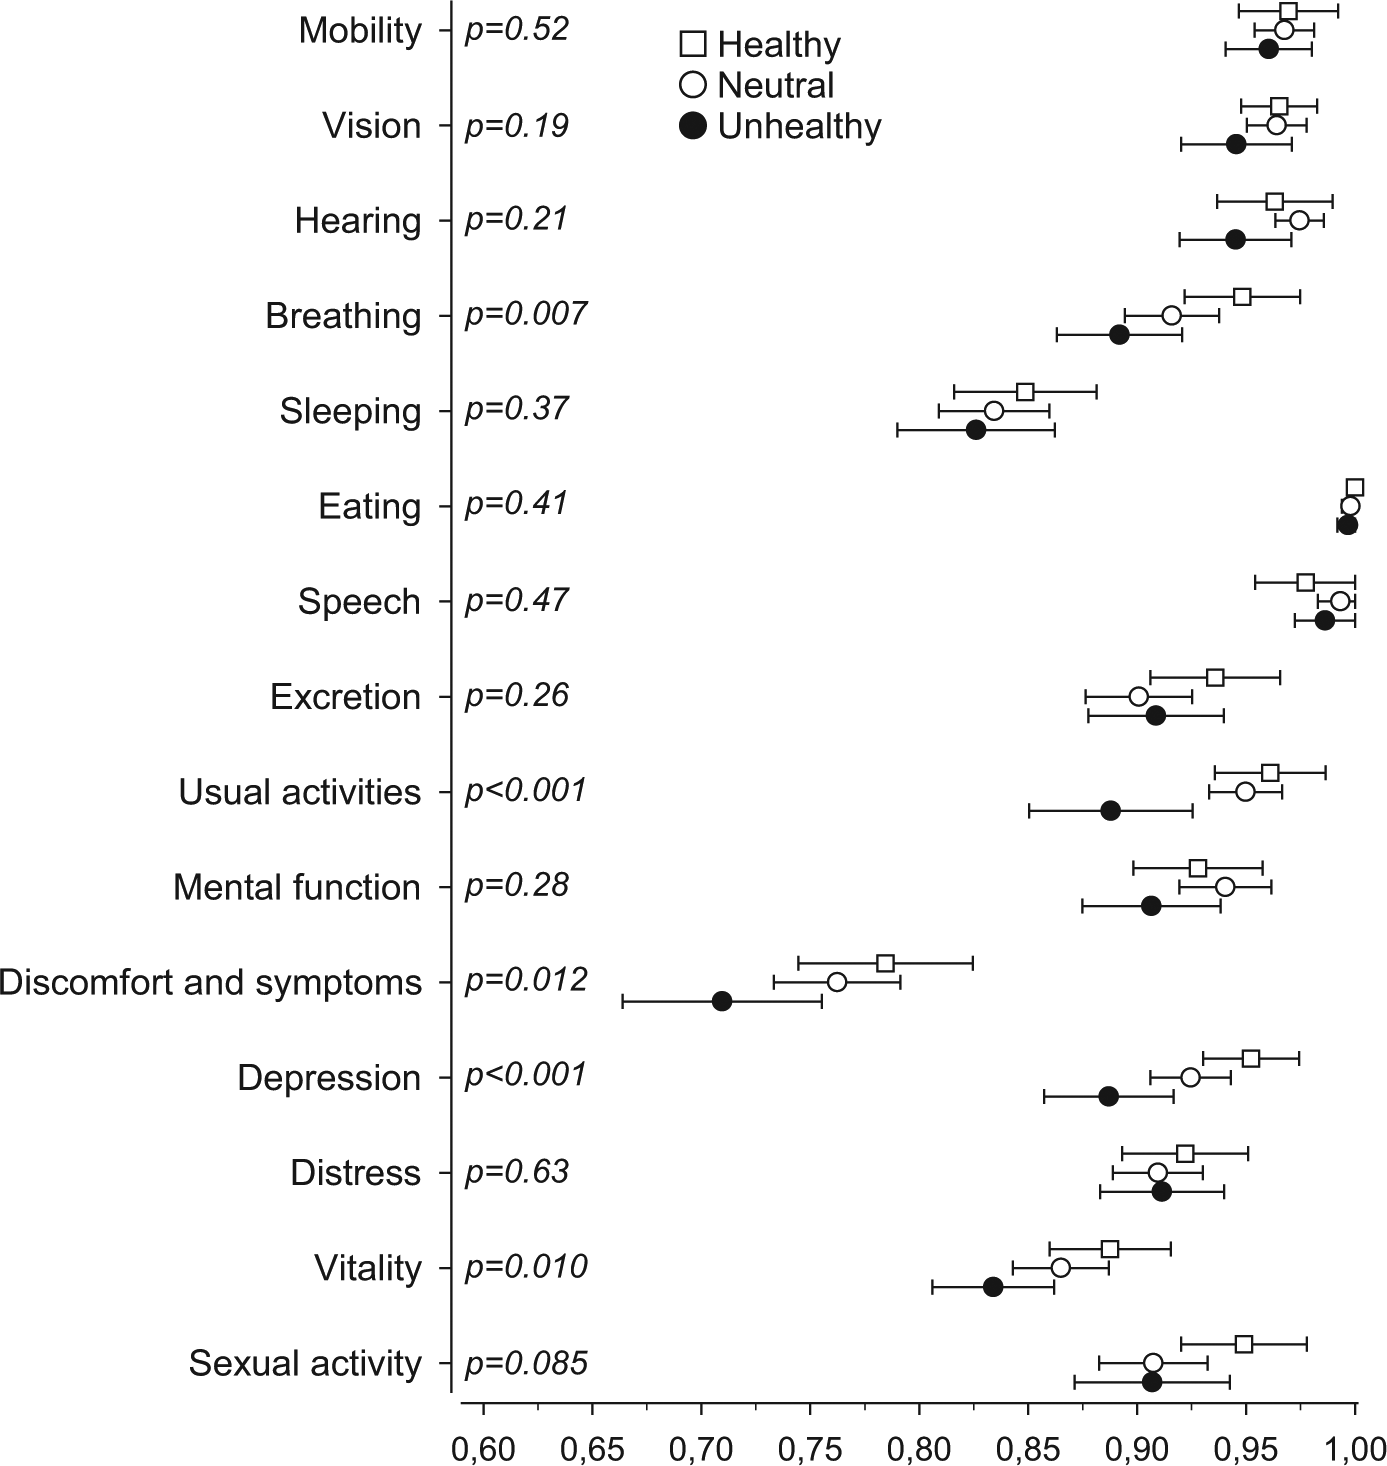
15D profile by lifestyle tertiles.
Discussion
In this community-based study, those who adhered to the lifestyle recommendations had better HRQoL and less depressive symptoms. This is one of the first studies showing the connection between combined healthy behaviours and HRQoL in this kind of community-based study. According to previous studies, the combined impact of lifestyle factors predicts mortality better than single lifestyle factors [17,26].
In addition to the population-based design, strength of the present study is that lifestyle factors were included comprehensively, and HRQoL and depressive symptoms were measured with validated instruments. The index which was developed here was intended for assessing lifestyle as a whole. One potential weakness of this index is that it quite roughly assesses different lifestyle factors. The subjects were divided up into lifestyle tertiles better according to VBF, meal beverage, meal fat and salt than according to smoking, alcohol consumption and exercise. Factors related to nutrition had the biggest impact on the index, indicating that more people are eating unhealthier than smoking or drinking excess alcohol. For a smoker, cessation may be the most important lifestyle change, but at the population level, changing dietary habits may have at least equal impact. Our index did not include total energy intake. Therefore, the nutrition information which can be obtained using this kind of measurement cannot be directly used for weight control. Finns should be quite aware of a healthy way of life. Finland has a long tradition of nutrition policies and there have been many health-promotion programmes of which the North Karelian project is the most well- known [27]. Therefore, it is possible that there might have been a bias to positive reporting about lifestyle. Assessment of alcohol use was based on responses to two questions (alcohol use in general and doses per week). This kind of assessment probably results in underestimation and may miss possible excessive alcohol use. In this study, we did not explore the prevalence of chronic diseases among the participants. Therefore, we cannot judge the severity of probable conditions, either. Nevertheless, the frequency of using medication for chronic diseases (hypertension, diabetes, lipid disturbances) did not differ significantly across lifestyles. Lapinlahti is a semirural community, and therefore these results may not be directly generalized to more urban populations. As this is a cross-sectional study, it was not possible to assess a possible causal relationship between lifestyle and HRQoL.
These results indicate that subjects who seem to have the least favourable combined healthy behaviours may have the biggest need for a lifestyle change. There was a clear and significant linear trend towards a better HRQoL with lifestyle tertiles. However, of the 15D dimensions the most significant linear trends were found for depression and usual activities. In line with that, the presence of depressive symptoms was most prevalent among those with unhealthy lifestyle. It has been found that emotional status is influential in lifestyle change [28]. Therefore, traditional individual or population-based health promotion strategies may produce poor results among many people with an unhealthy lifestyle profile. The present findings suggest that mental wellbeing may have the strongest relation to lifestyle. An international comparison found differences in depressive symptoms at the population level which was related to more sedentary lifestyle [29]. Our study indicates that even in a community with a smaller number of people, there may be similar relation between health behaviour and wellbeing. It has been stated that lower mental wellbeing may hinder people from changing their lifestyle [30]. Further, the differences related to lifestyle HRQoL and emotional wellbeing may be related to social inequality [30]. In the present study, the lower level of education was found among the people with unhealthy lifestyle. Previously, it has been concluded that capacity, capability and motivation to choose health are strongly influenced by mental wellbeing, while unhealthy behaviours may be a rational option among people with the psychosocial burden [30].
The findings of the present and previous studies suggest that at the population level, the burden of lower HRQoL and depressive symptoms should be considered when targeting the health promoting actions and strategies. In the high risk strategy, for example in the opportunistic health promotion of primary health care, individualized actions with the proper assessment of HRQoL should be considered with easy and equal access to care. More information is needed about the association between lifestyle and HRQoL. Longitudinal studies would shed more light on this association. Perhaps it would be easier to motivate people to change their way of life if we had more evidence on the positive impact of lifestyle modification on quality of life in addition to its positive impact on morbidity and mortality.
The present study indicates that people who are expected to strive most to change their lifestyle have the lowest quality of life and psychological welfare, which should be taken into account in both clinical work and health promotion.
Footnotes
Acknowledgements
The authors want to thank research nurse Satu Hautala for conducting health checks and Sami Kärkkäinen for technical support and the staff members of the Lapinlahti Primary Health Care Centre for their contribution to the study.
Conflict of interests
None declared.
Funding
This study has been supported by the Development Programme for the Prevention and Care of Diabetes in Finland (DEHKO/D2D) through the Northern Savo Hospital District. JS was supported by the National Graduate School of Clinical Investigation of Finland