
Abstract
Aims: The aim of this study was to explore differences in self-rated health and physician-diagnosed disease across geographical regions in Iceland to better understand regional requirements for health services. Methods: Data on self-rated health and diagnosed disease from a 2007 national health survey (n=5909; response rate 60.3%) across geographic regions were analysed. Area of residence was classified according to distance from the Capital Area (CA) and availability of local health services. We used regression models to calculate crude and multivariable adjusted odds ratios (aOR) and corresponding 95% confidence intervals (95% CI) of self-rated health and diagnosed diseases by area of residence. Models were adjusted for age, gender, education, civil status, and income. Results: Residents in rural areas with no local health service supply rated their physical health worse than residents of areas with diverse supply of specialised services (aOR 1.40, 95% CI 1.21–1.61). Residents outside the CA rate both their physical (aOR 1.35, 95% CI 1.23–1.50) and mental (aOR 1.17, 95% CI 1.06–1.30) health worse than residents in the CA. In contrast, we observed a lower prevalence of several diagnosed chronic diseases, including cancers (aOR 0.78, 95% CI 0.60–0.99) and cardiovascular disease (aOR 0.77, 95% CI 0.62–0.95) outside the CA.
Introduction
Health inequalities across geographic regions, both within and between countries, have frequently been reported [1,2] and reducing health inequalities across geographic regions is in accordance with the new World Health Organization European policy for health, Health 2020 [3]. Better understanding of regional variations in health is essential for evidence-based organisation of health services and health-promoting infrastructure on a national level.
Studies of geographic variations in health have typically concentrated on either disparities between neighbourhoods (e.g. as defined by census tract areas or between urban and rural areas and sometimes between different rural settings). Evidence from studies of the relative contribution of contextual vs. compositional neighbourhood effects on health is mixed [4–6]. Studies in both England and Finland have found significant association between poor self-rated health and several neighbourhood socioeconomic attributes, while a study in Canada found individual-level factors to be more important [4–6].
Access to health services can be viewed as an important marker of neighbourhood quality. Delivering adequate health services is more challenging in rural than urban areas and the influence of differential geographical access on health is not fully understood. Factors such as limited service provision, lack of physicians, remoteness from and difficulty in travelling to urban health services, and inadequate health-promoting infrastructure have been suggested to contribute to urban–rural health differences [7]. An underlying assumption is that healthcare access is positively associated with health outcomes. A literature review of 10 studies indicates that primary care physician supply is associated with improved health outcomes, including self-rated health [8].
Studies on urban–rural differences in self-rated health show mixed results. A recent study in the USA [7] found, for example, that residents of remote rural counties had the greatest odds of reporting bad health and indications of worse health with increasing degree of rurality. A study among the elderly in Finland also found poorer health in rural communities [9]. Self-rated health was, however, more favourable in rural settings in England [10] and Scotland [11]. Health differences between large cities and more rural areas in England were found to be largely accounted for by differences in socioeconomic conditions between poor urban localities and more affluent rural places [10]. Some studies have found no general urban–rural differences in health [e.g. 12–14].
One of the main objectives of Icelandic health legislation is to ensure equal access to services. Iceland was recently divided into seven health regions which will serve as a foundation for the organisation of general health services [15]. Yet, knowledge on spatial variations in health in Iceland is lacking and it is uncertain whether geographic provision of health services is in accordance with local health status. With the motivation to support evidence-based spatial organisation of health care, the aim of this study is to explore potential differences in self-rated health and diagnosed chronic disease by geographic regions in Iceland. Taking into consideration settlement pattern and socioeconomic characteristics the objectives are to: (1) compare health indicators inside and outside the Capital Area; (2) compare health indicators in communities in various distance zones from the Capital Area; and (3) compare health indicators in communities with varying availability of local health service supply.
Materials and methods
The study protocol was approved by the National Bioethics Committee (VSNb2008090001/03-7) and the Data Protection Authority (2008090601).
Setting
The population of Iceland was approximately 320,000 by the end of 2008 [16], with two-thirds of the population residing in and around the Capital Area (CA). The Icelandic healthcare system is comprehensive and mostly financed through general taxes [17].
Healthcare centres throughout the country provide primary healthcare. Specialist outpatient care is provided by hospitals and self-employed healthcare practitioners who are unevenly distributed in Iceland (i.e. primarily concentrated in the CA).
Data from a national survey
The data for this study are from a cross-sectional health survey of the Icelandic population, carried out in late 2007. Data was collected with a self-administered questionnaire. Participants were randomly selected from the Population Register. In order to enable research into geographic and age variations in health, residents outside the CA and the older age groups are overrepresented in the sample [18]. A total of 9807 individuals received a questionnaire. The total response rate was 60.3%: 57.6% in the CA and 61.9% outside the CA; in total 5906 individuals aged between 18 and 79 years [18].
Measures of health
The following items were used to measure self-rated health. For the question ‘In general, how would you rate your physical health? In general, how would you rate your mental health?’, there were four response categories (very good, good, fair, and poor). The questionnaire also included questions on diagnoses of diseases. From a list of 30 diseases, the respondents were instructed to respond only “yes” to diagnoses made by their physicians. If respondents neither checked off “yes” nor “no” at a given disease category, their responses were treated as a “no”. To preserve numbers for meaningful analyses, several related diseases were grouped into larger categories. Three diseases (cirrhosis, paralysis of upper limbs, and paralysis of lower limbs) were excluded from further analysis due to small numbers (<200).
Residence (area data)
The survey contained data on residence by postal codes and level of urbanisation. Data on location were missing for 105 individuals and they were consequently excluded from the analysis. Respondents were assigned to communities or localities by combining postal codes into urban nuclei (n=115) as defined by Statistics Iceland. An urban nucleus is a town, village, or other area where inhabitants live in houses standing in the vicinity of one another. Localities with population below 200 are defined as rural independent of density of houses.
Communities were further classified according to population distribution and availability of health services. Firstly, by contrasting the CA (the reference category) with all other areas. Then two approaches were used in categorising areas outside the CA. First, we classified settlement according to distance from the CA; within 70 km from the CA (<1 hour driving time; ~38,000 inhabitants in total), 70–249 km (1–3 hours driving time; ~23,000 inhabitants in total), and more than 250 km (≥3 hours driving time; ~56,000 inhabitants in total). The three distance zones were identified from a survey of domestic travel pattern [19]. Secondly, residency was classified according to availability of local health services assessed for each urban nucleus using information from an official register [20]. For the purpose of this study, four categories of local health service supply were identified: (1) areas with diverse specialised services (the reference category); the CA and Akureyri belong to this group (~215,000 inhabitants in total); (2) areas with only limited specialised services; some of the larger urban nuclei in Iceland with a population of few thousands are in this group (~36,000 inhabitants in total); (3) areas where there is only a local healthcare centre and perhaps also a nursing home; small urban nuclei with a population of few hundred up to 3000 fall into this category (~28,000 inhabitants in total); and (4) areas where there are no health services in the local neighbourhood; rural areas and the smallest urban nuclei where population does not exceed 600 individuals belong to this group (~37,000 inhabitants in total). Figure 1 contains a map displaying distance zones and availability of health services in each community.
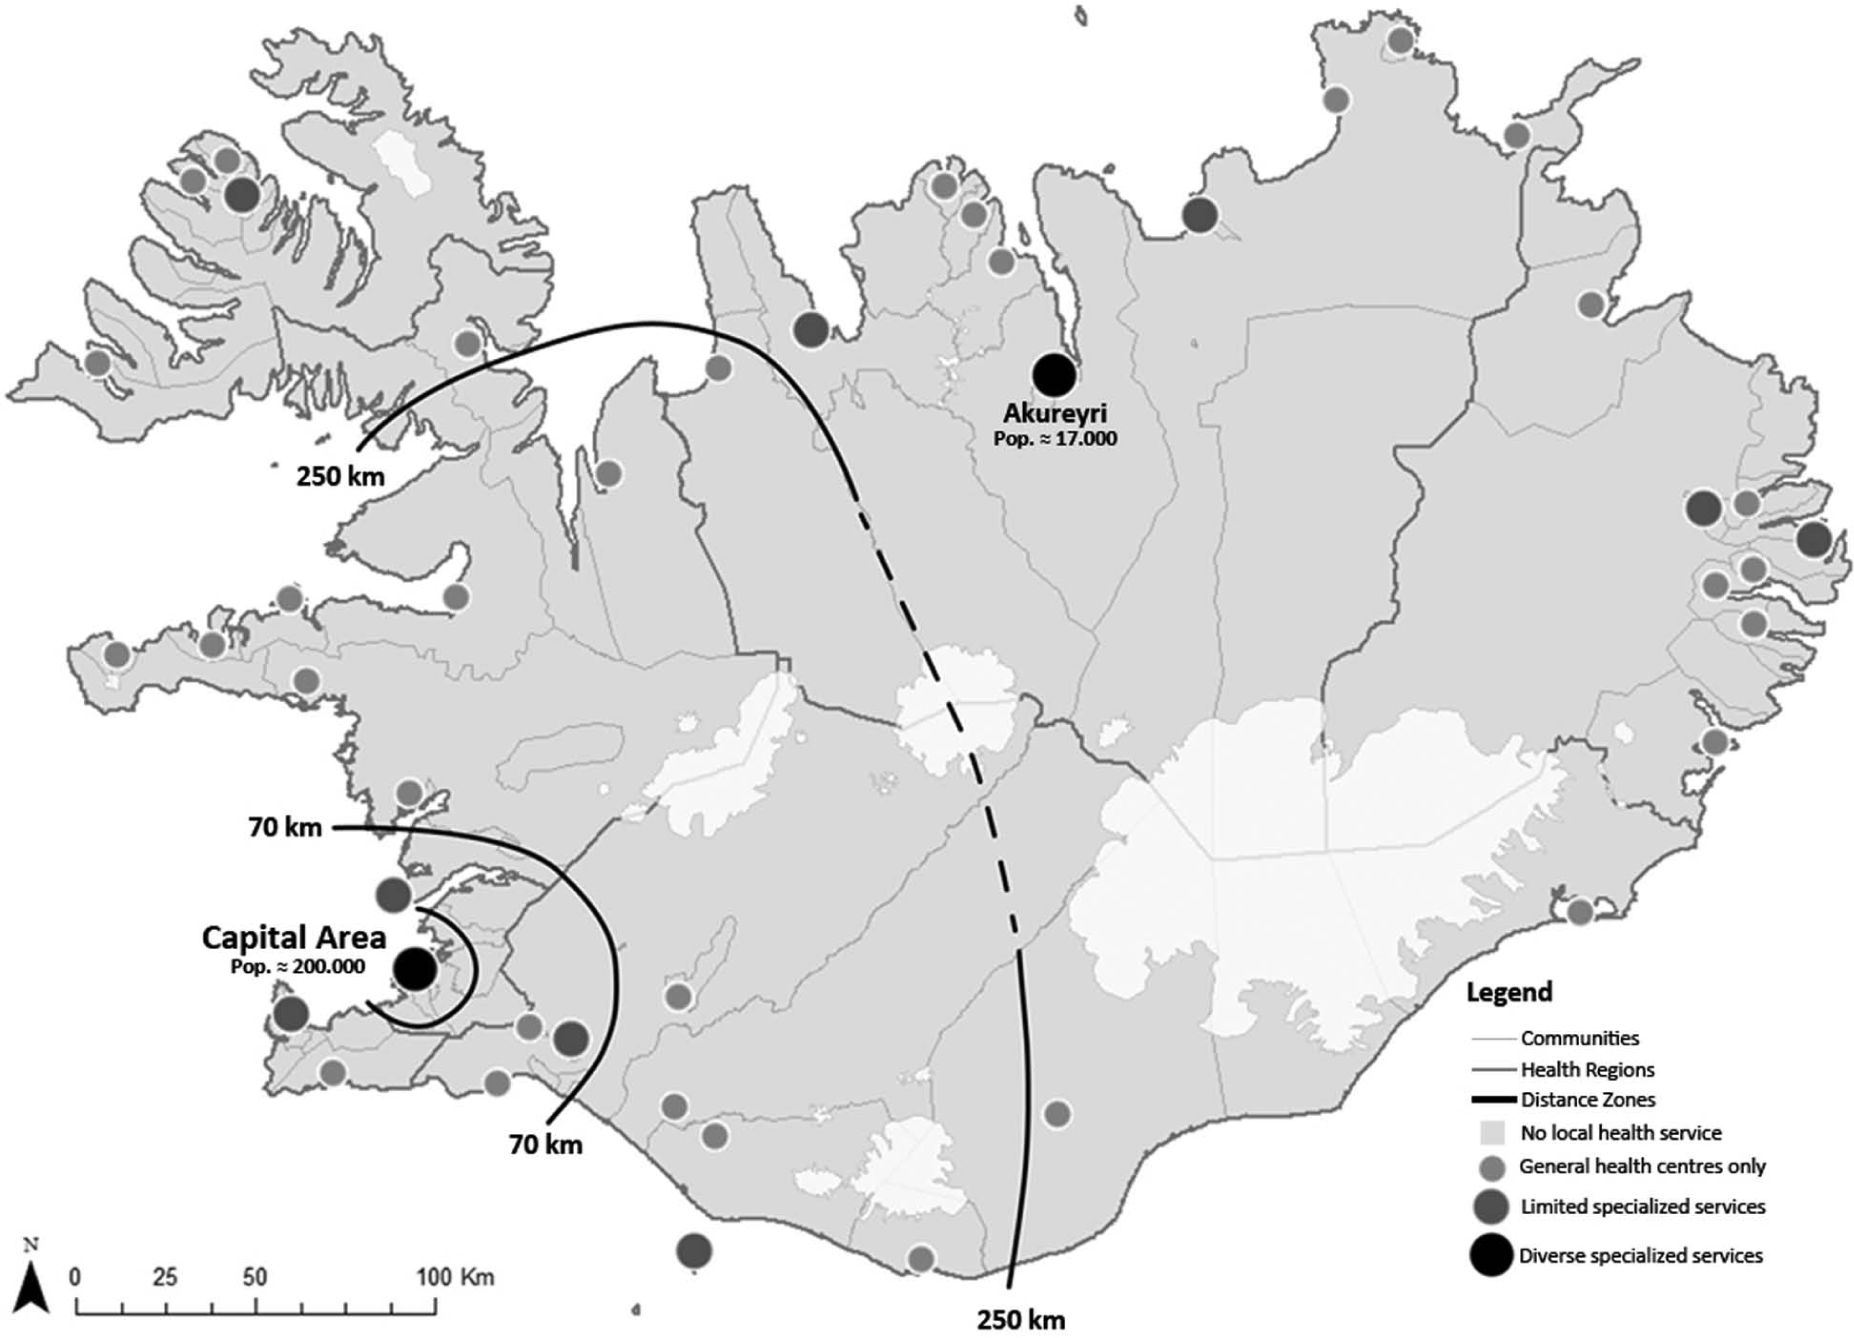
Map of Iceland displaying approximate boundaries between distance zones from the Capital Area and categories of local health service levels in all communities.
Statistical analyses
Data are presented as proportion of participants in a given area reporting respective health outcome. Ordinal regression was used to explore differences in self-rated health by area of residence and logistic regression was used to explore differences in physician-diagnosed diseases while controlling for socioeconomic characteristics. Odds ratios (OR) and 95% confidence intervals (95% CI) were calculated both crude and adjusted for age, gender, education, civil status, and income. Lifestyle factors are strong determinants of self-rated health [21]; in order to examine to what extent lifestyle factors explain differences in health outcomes between residential areas, we ran additional models adjusting for smoking, body mass index (BMI), and perceived stress (PSS4) [22]. Weights were not employed in logistic models since categories of geographical residence are presented and adjustments are made for age in accordance with the sampling procedure (18–29, 30–39, 40–49, 50–59, 60–69, and 70–79 years). With this approach, the point estimates (odds ratios) correspond to weighted estimates but the prevalences are slightly higher for outcomes that are more prevalent in the older age groups (that are overrepresented in the sample). Data were analysed using SPSS version 17.0.
Results
Descriptive characteristics
Of the 5801 respondents, 3006 lived outside the CA (51.8 %) and 2795 in the CA (48.2 %). Age distribution was similar inside and outside the CA but there were slight but significant differences in terms of gender, civil status, and income. Considerable differences were, however observed with respect to level of education (Table I). While 26.7% of the residents of the CA had a university degree, 12.9% of residents outside the CA reported having an equivalent degree. The proportion of smokers was similar inside and outside the CA but there was a small but significant difference in the mean perceived stress score (4.13 inside the CA and 4.34 outside; p=0.008). There were substantial differences in BMI scores: 25.2% of participants outside the CA were obese (BMI >30.0 kg/m2) as compared to 18.8% of residents inside the CA (p<0.001).
Characteristics of participants (n=5906).
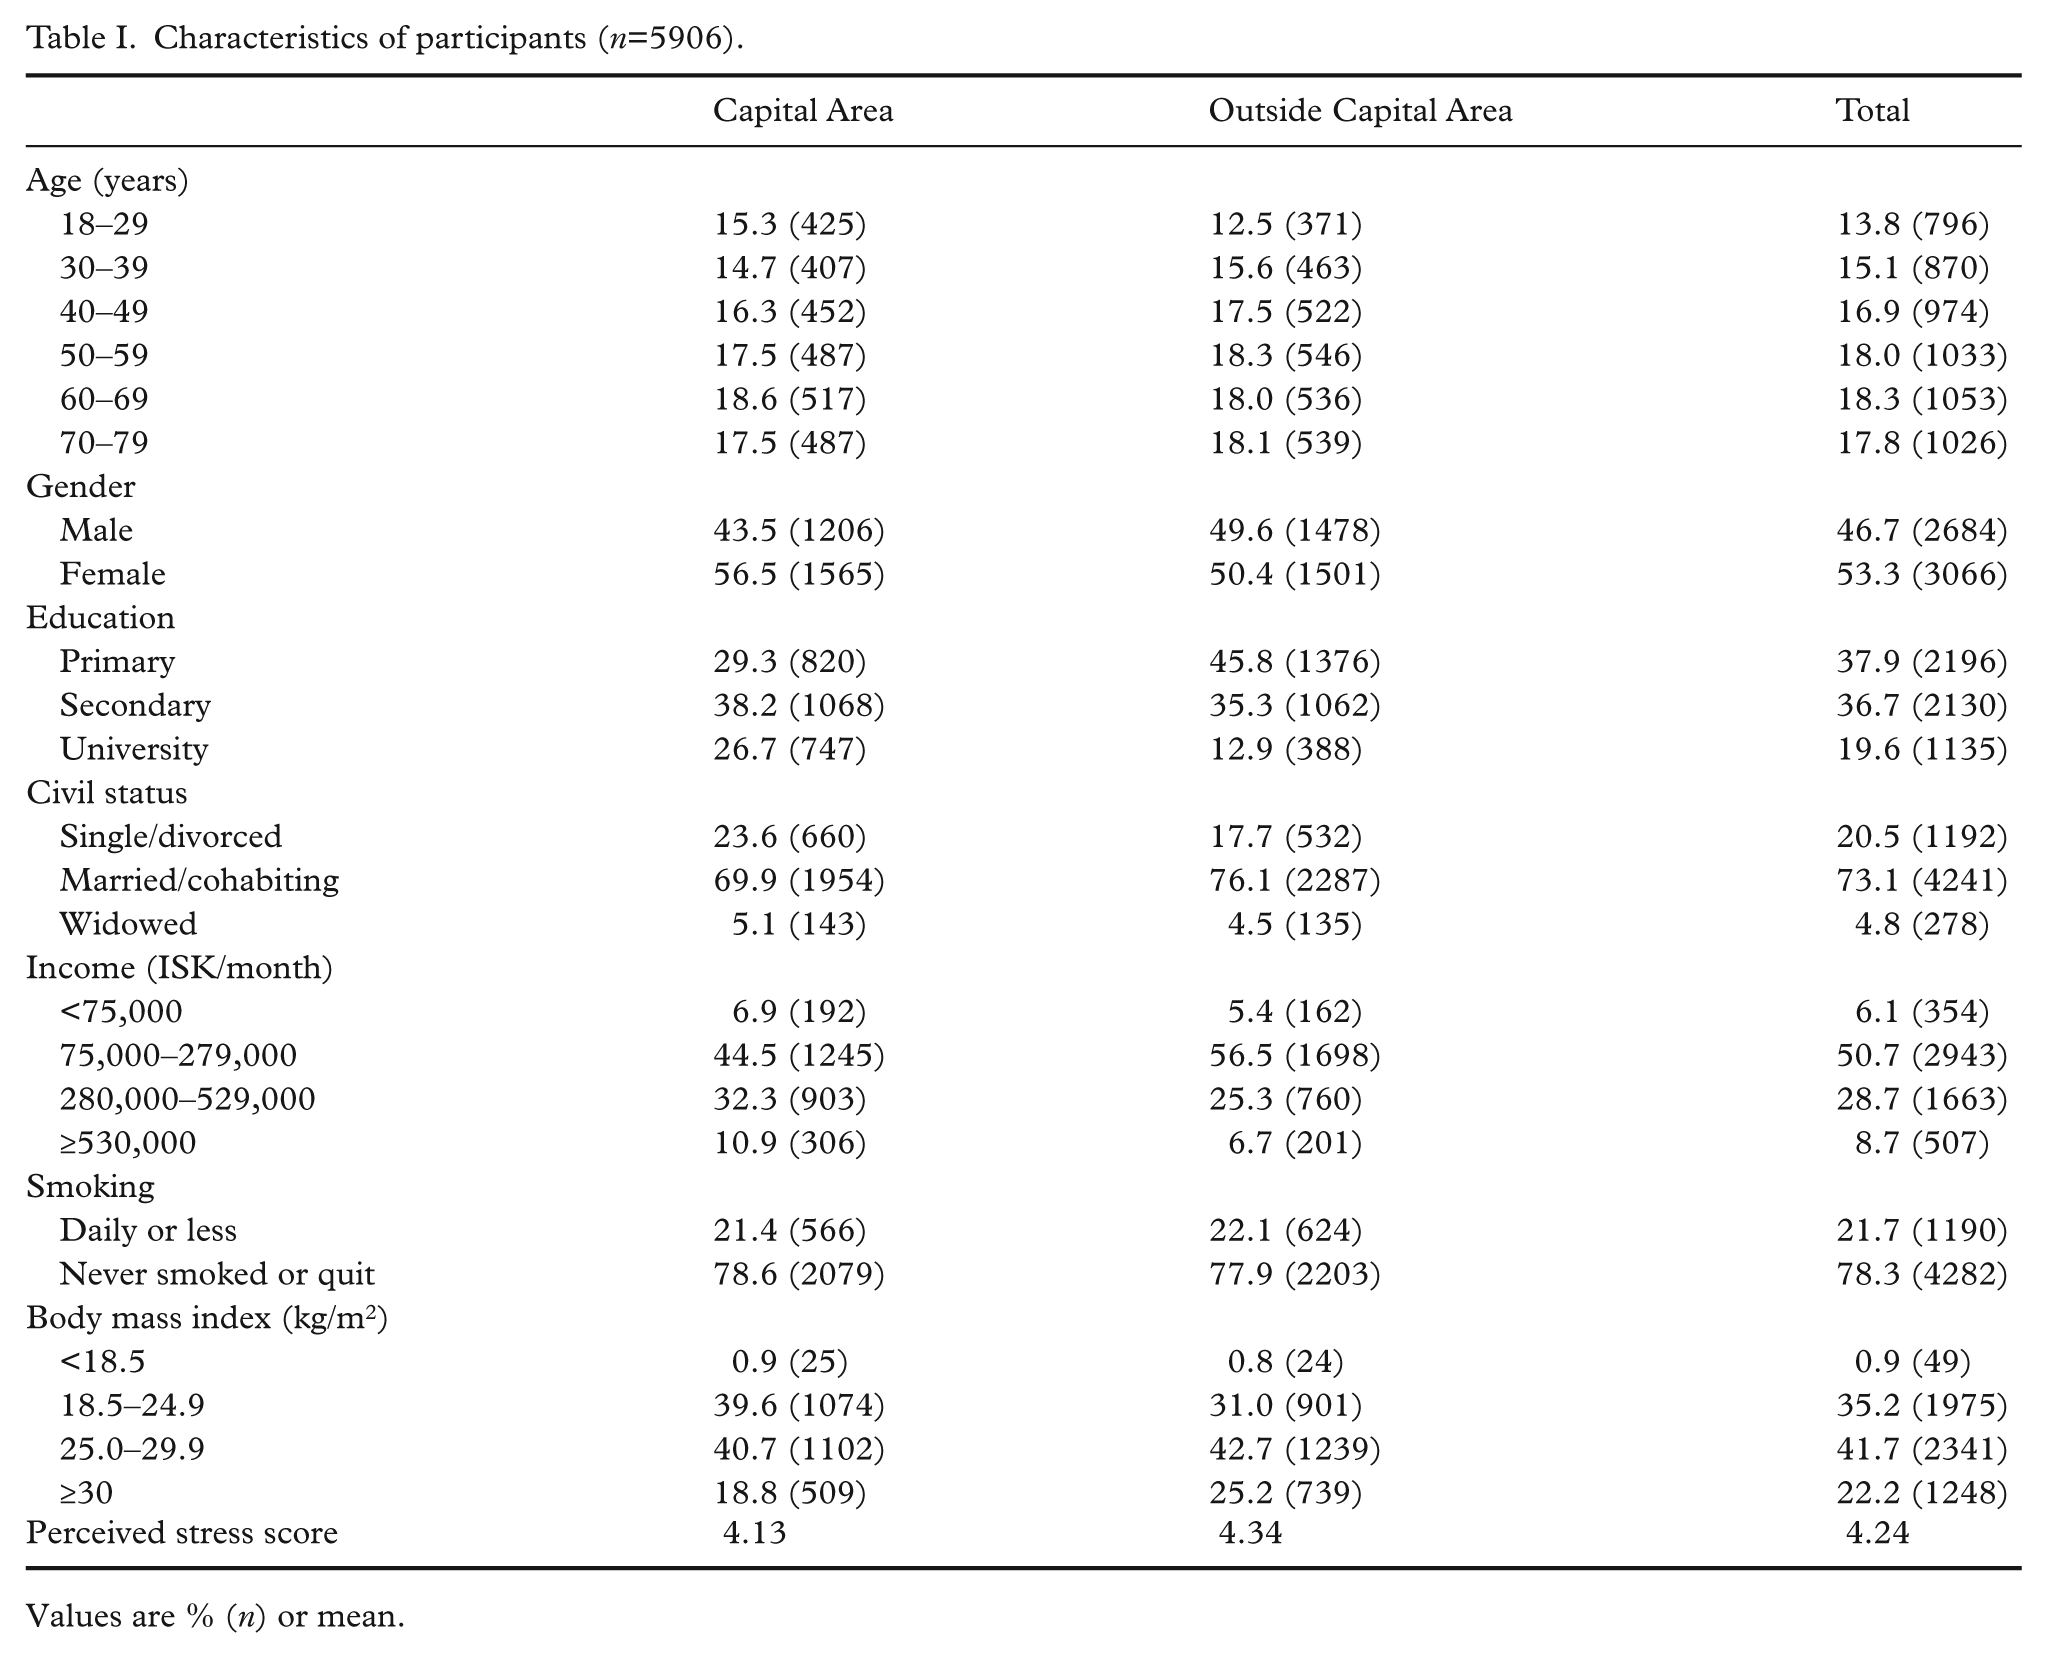
Values are % (n) or mean.
Self-rated health by distance from the Capital Area
Residents outside the CA rated their own health worse than those living in the CA (Table II). When potential socioeconomic confounders were accounted for, we observed increased odds of reporting poorer self-rated physical health outside the CA (adjusted OR, aOR 1.35, 95% CI 1.23–1.50). Residents furthest away from the CA were most likely to rate their physical health as poor compared with residents of the CA (aOR 1.41, 95% CI 1.25–1.60). On the other hand, residents in areas adjacent to the CA were most likely to report poor mental health (aOR 1.22, 95% CI 1.06–1.41) compared with residents of the CA. Adding lifestyle factors to the model slightly reduced the odds of reporting worse self-rated health outside the CA. The difference between the CA and residential areas outside the CA became insignificant in self-rated mental health in this second model but remained statistically significant in terms of self-rated physical health.
Differences in self-rated health by distance from the Capital Area.
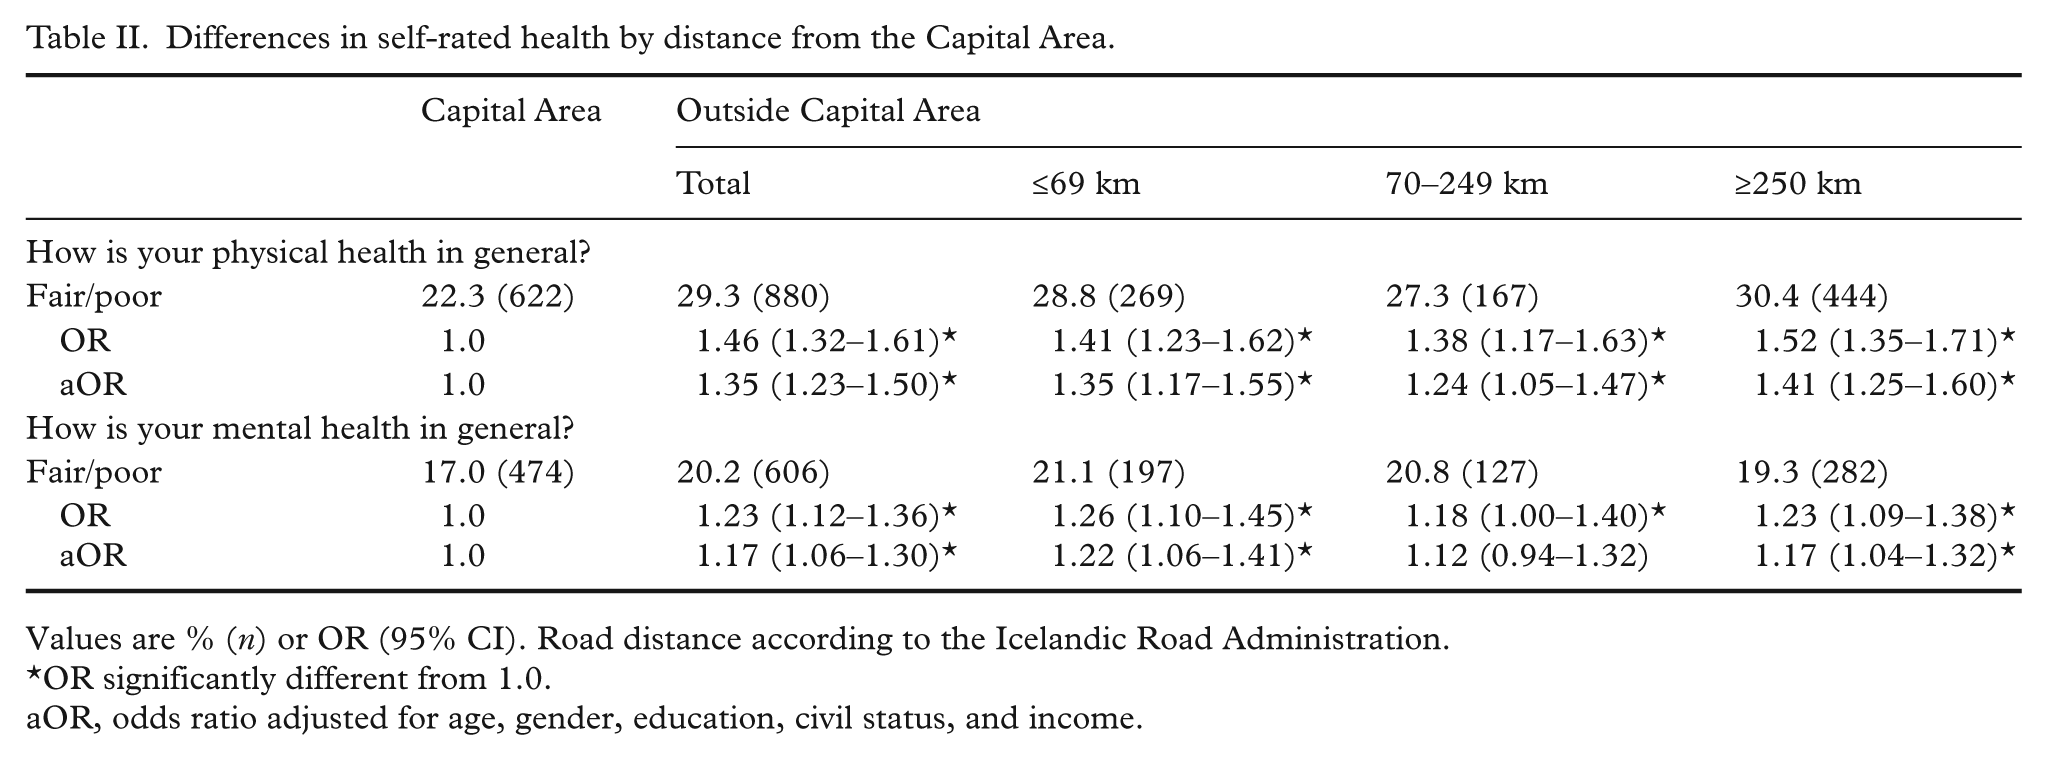
Values are % (n) or OR (95% CI). Road distance according to the Icelandic Road Administration.
OR significantly different from 1.0.
aOR, odds ratio adjusted for age, gender, education, civil status, and income.
Self-rated health by local health service supply
Residents in areas with no local health service supply reported poorer physical health than residents of areas with the most diverse supply of specialised services (aOR 1.40, 95% CI 1.21–1.61; Table III). Individuals living in areas with only general health centres reported poorer mental health than those living in areas with at least some supply of specialised services (aOR 1.27, 95% CI 1.08–1.49). This difference was attenuated when adding lifestyle factors to the model but remained statistically significant except when comparing self-rated physical health in areas with only general health centres and areas with the most diverse supply of services.
Difference in self-rated health by local health service.
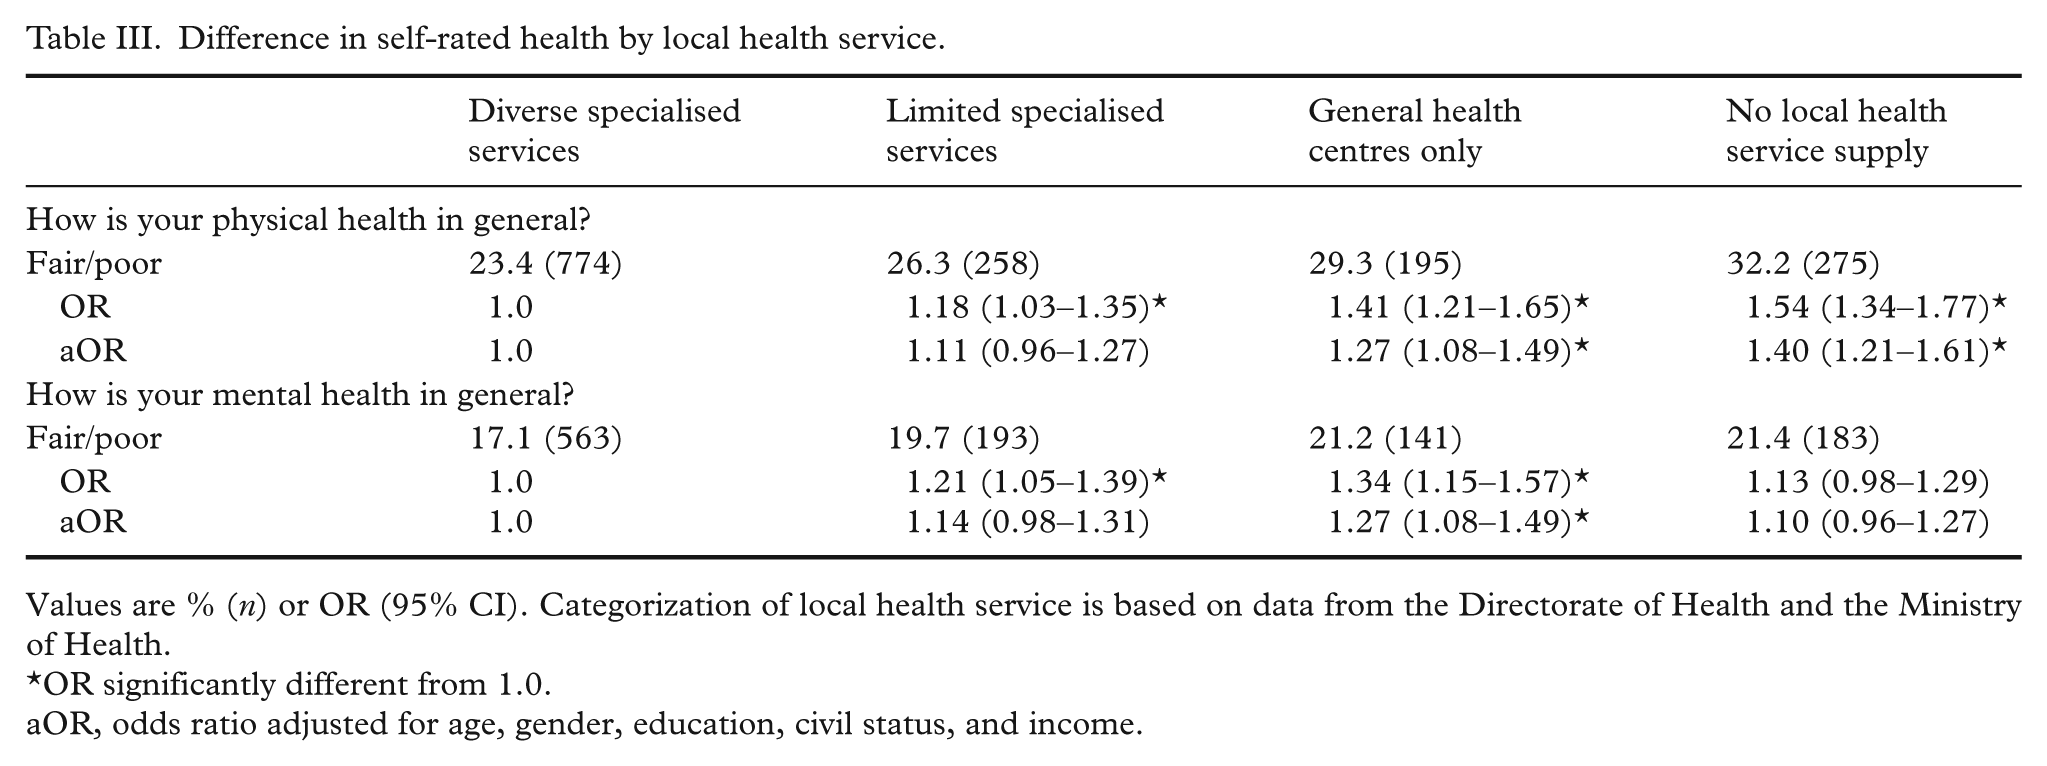
Values are % (n) or OR (95% CI). Categorization of local health service is based on data from the Directorate of Health and the Ministry of Health.
OR significantly different from 1.0.
aOR, odds ratio adjusted for age, gender, education, civil status, and income.
Diagnosed diseases by distance from the Capital Area and by local health service supply
Of the 22 observed disease categories, four were significantly less prevalent outside the CA than within (heart and circulatory disease, cancer, diseases of the eye, and alcoholism and drug abuse; Table IV). When socioeconomic factors had been accounted for, the odds of reporting heart and circulatory diseases outside the CA were e.g. 0.77 (95% CI 0.62–0.95). The odds of reporting asthma and allergy, common cold, chronic anxiety/tension, other mental health problems, and benign neoplasm were also lower outside the CA but marginally or not statistically significant. Only one disease category, hyperthyroidism, was more prevalent outside the CA than within (aOR 1.25, 95% CI 1.00–1.57). No large differences were observed in disease prevalence between residents in different distance zones from the CA, but the lowest ORs were most frequent furthest away from the CA.
Self-reported physician-diagnosed diseases and disorders according to distance from the Capital Area.

Values are % (n) or OR (95% CI). Road distance according to the Icelandic Road Administration. Each individual is only counted once, but may have more than one disease within each category.
OR significantly different from 1.0.
aOR, odds ratio adjusted for age, gender, education, civil status, and income, bheart attack, myocardial infarction, cerebral haemorrhage, cerebral infarction, carthrosis, arthropathy, osteoarthritis, fibromyalgia, chronic fatigue syndrome.
Similar results were obtained with regard to local health service supply (Supplementary Table A, available online). Residents in areas with abundant supply of specialised health services were more likely than residents with limited health services to report that they had been diagnosed with heart and circulatory diseases, cancer, benign neoplasm, other mental health problems, diseases of the eye, and urinary incontinence.
Adding lifestyle factors to the models generally resulted in similar or slightly reduced odds of reporting most disease categories outside the CA and in areas of less or no local health services, indicating that different levels of smoking, BMI, and stress did not mediate the differences between residential areas. Two disease categories (chronic anxiety/tension and angina/coronary heart disease) became significantly less prevalent outside the CA in this model including lifestyle factors (OR 0.79, 95% CI 0.66–0.95 and OR 0.74, 95% CI 0.56–0.97, respectively).
Discussion
The findings from this national survey of almost 6000 Icelanders indicate that self-rated health is generally reported poorer in rural areas with limited healthcare supply; individuals living outside the CA rate their own mental and, especially, physical health poorer than those living in the CA with easy access to specialised health services. In contrast, possibly reflecting differential diagnostic activity across regions or regional differences in healthcare use, the findings reveal that some chronic disease categories are less common outside the CA (i.e. heart and circulatory diseases, cancer, diseases of the eye, and alcoholism and drug abuse). Conversely, residents in areas with abundant supply of specialised health services are more likely to report that they had been diagnosed with diseases in three of the four aforementioned disease categories as well as psychiatric disorders than those living in areas with no local health service supply.
Previous research and mechanisms
Many studies suggest some health disadvantages in rural areas [7, 9]. This current study found indications of poorer self-rated health outside the CA, while there was a general tendency towards decreased odds of some self-reported major chronic diseases outside the CA. A potential explanation for these contradicting findings is that specialised health services are less accessible to residents outside the CA resulting in less diagnostic activity. Regional differences in healthcare-seeking behaviour (e.g. lower healthcare use) might also contribute to lower rates of diagnosed disease outside the CA. In support of this mechanism, a recent Icelandic study found that residents outside the CA used less mental health services whereas residents of the CA used psychologists and sometimes psychiatrists more often [23]. The authors conclude that access to services or attitudes towards these health problems or services might explain the observed regional differences in healthcare utilisation.
Alternatively, an explanation for why some chronic diseases are less prevalent outside the CA could be that those who suffer from those diseases have moved to the CA in order to gain better access to specialised services. Selective migration might therefore have contributed to lower rates of certain disease outside the CA. A longitudinal study in England and Wales revealed that over a 20-year period, the largest flow of migration was by healthy migrants moving away from more deprived areas towards less deprived areas, raising ill-health and mortality rates in the origins and lowering them in the destinations [24]. The CA of Iceland is a more affluent residential area in terms of education and income compared to the rest of the country. The general trend in internal migration in Iceland for the past decades has been that people tend to move to the CA away from rural regions [25]. Two-thirds of those who have moved to the CA have been under the age of 30, and 96% under the age of 60 [26]. Consequently, it could be argued that internal migration should have contributed to higher disease prevalence outside the CA but not the contrary. However, given that the availability of specialised services is to a large extent concentrated in the CA, it is still reasonable to assume that chronic disease sufferers are dependent on proximity to such services.
Alternative explanation of differences between self-rated health between residential regions could be differences in lifestyle or health-related behaviours. Lifestyle factors such as smoking and BMI along with stress have indeed been strongly related to self-rated health [21]. Controlling for these factors in the analysis did however not alter our point estimates to a large extent, particularly not with respect to self-rated physical health. Our findings therefore indicate that differences in self-rated physical and mental health across geographic areas with varying access to health care are only to a limited extent explained by these measured lifestyle or socioeconomic factors.
Validity and reliability
One of the strengths of the present study is that it uses data from a large, nationwide survey allowing a meaningful inquiry into geographic variations in health [18]. The response rate is moreover adequate and residence data is based on relatively small spatial units, allowing various categorisation of residence. The cross-sectional design of the survey prevents, however, analysis of processes behind spatial variations.
The study relies solely on one source of information on health: i.e. self-rated health and self-reported diseases, albeit diseases that were supposedly diagnosed by physicians. This is obviously a source of bias as respondents may not recall all diseases they have been diagnosed with. However, in order to obscure these findings, this source of misclassification needs to be differential across areas. Another potential source of bias relates to questions on diseases where unchecked diseases were always interpreted as a “no”. Again, it is not likely that this source of error is systematic across health regions. Future studies should, however, explore other health indicators and mechanisms behind spatial differences in health.
Icelandic population pattern, albeit unique, has many characteristics in common with other countries, particularly neighbouring Nordic countries. A high and an increasing proportion of the total population living in the CA, uneven distribution of health services, difficulties in adjusting health services to changes in population distribution and financial difficulties. Nevertheless, our findings cannot be directly transferrable to other cultures or populations; thus, further studies in other settings are needed for testing the generalisability of these findings.
Conclusions
The findings of this study indicate that residents in rural areas with no local healthcare centre are most likely to report unfavourable physical health when compared with residents of areas with more supply of health services. Residents in areas with general health centres only were, however, most likely to report unfavourable mental health. Differences in lifestyle and stress between areas seem only to explain to a small extent the observed differences. In contrast, residents in areas with abundant supply of specialised health services were more likely to report major diagnosed diseases than those living in areas with no local health service supply. This could suggest differential diagnostic activity across areas, differences in healthcare-seeking behaviour, or selective migration of ill individuals, circumstances which could all be related to regional variations in health service supply. These geographic differences in health in relation to local health service supply require further research, for example by using alternate indicators of health as well as different study designs. Only a longitudinal study design can explore the causality of this association, as well as the contribution of potential confounders and effect-modifiers to this association.
Icelandic health authorities have been reconsidering provision of health services in different regions as an element in reducing healthcare spending, especially after the economic collapse in 2008. All health institutions have experienced considerable financial cuts and they have adjusted to the best of their abilities. Revision of Icelandic health services is announced in the proposed 2020 Icelandic health policy [27]. Continued relocation of both general and specialised services from rural areas is probable due to continued demand to reduce spending. This study clearly indicates that residents in rural areas constitute a vulnerable population that report poorer self-rated health and yet have lower prevalence of diagnosed diseases. Thus, to ensure equity, healthcare policymakers should take into account that, beyond population size, the rural population may need more health-promoting efforts and prevention as well as maintained access to health care.
Footnotes
Acknowledgements
We thank the Directorate of Health for access to data, Sigrún Helga Lund for statistical advice and Lilja Bjarklind Kjartansdóttir and Elín Inga Magnúsdóttir for assistance in cartography.
Conflict of interest
There is no conflict of interest.
Funding
This work was supported by Rannis – the Icelandic Centre for Research (R10–0008 2010).