
Abstract
Aims. The aim of this study is to explore the psychological well-being of Polish and Asian immigrant youth in Iceland in comparison with their native peers, and the role of sociodemographic background and social support in explaining ethnic differences. Method. The study is based on a dataset from the research network Health Behavior in School-Aged Children (HBSC), collected in the school year 2009–2010. A total of 11,561 students aged 11, 13, and 15 years participated in the study. Immigrant status was determined by parents’ birthplace dividing the two non-native groups into four: non-mixed Polish, mixed-Polish (one parent born in Poland), non-mixed Asian, and mixed-Asian (one parent born in Asia). Data were analyzed by means of hierarchical multiple regression. Results. Less life-satisfaction and more distress was reported in all non-native groups compared with natives. The outcomes were more negative for youth of mixed ethnic origin. Initial ethnic differences in life-satisfaction and distress disappeared or were substantially reduced when sociodemographic background and social support were controlled. A key finding is that non-native youth more often live in challenging socioeconomic circumstances and experience less access to social support than their native peers.
Keywords
Introduction
Health and well-being of immigrants are an ongoing concern [1]. Migration has been considered a stressful transition that can result in worsening mental and physical health [2]. However, the research evidence is mixed as some studies indicate worse health among immigrants and their offspring than among natives while others do not [1]. It is commonly acknowledged that migration entails challenges for children and adolescents, but the degree to which it will affect their health and other adaptation outcomes depends on various protective and risk factors in their lives. Studies indicate that socioeconomic status [3], parental support and monitoring [4], and peer support [5] can be of importance as protecting factors in the process.
Well-being and health of immigrant youth
Contrasting results have been reported in studies that compare well-being of immigrant and native youth. Some studies indicate poorer mental health in the immigrant group [6,7], and others find the opposite [1]. Different results have led researchers to explore the issues of immigrant generations [8], ethnic background [9,10], occupational background [3], and social support [11,12] in order to better understand what may explain observed differences.
In Ireland, first-generation immigrant youth reported higher life-satisfaction than natives while taking into account family affluence, gender, and age [13]. Other studies have found no difference in psychological adaptation between natives and immigrants [14], and still others have reported lower life-satisfaction for immigrant youth [6,7].
Studies of mixed and non-mixed ethnic background as factors in mental health also report different results. Carlerby and Viitasara [9] found girls with a foreign background reporting more distress than other groups (mixed and native background). Weathers et al. [15] also found that non-mixed foreign background was associated with worse health than mixed background while Abu-Rayya [10] found higher prevalence of depression and anxiety in mixed background youth than in those with a non-mixed foreign background.
Social support from parents, friends, and classmates
Evidence suggests a positive impact of social ties and social support on health and well-being [16,17]. In particular, perceived social support has been found to positively relate to physical and psychological well-being [16]. The transition from childhood to adulthood involves many challenges, and while parent–child relationships change during adolescence, parental emotional support remains of vital importance [18]. Perceived parental and friend or classmate support are positively related to students’ life-satisfaction [19] and self-assessed physical health [20].
A Finnish study showed that parental support may reduce stress related to migration and increase life-satisfaction [11], and increases in family and classmate support positively affected mental health in immigrant children in Norway [12]. However, these studies did not compare native and immigrant youth. Another Norwegian study considered different effects of social support by ethnicity but did not produce conclusive results [5].
The current study
The aim of this study is to explore psychological well-being of immigrant youth in Iceland in comparison with their native peers, and the role of sociodemographic background and perceived social support in their well-being. There are four non-native groups: non-mixed Polish, non-mixed Asian, mixed-Polish (one parent born in Poland), and mixed-Asian (one parent born in an Asian country). The mixed-ethnic groups had one Icelandic parent in 69% of the cases for the mixed-Polish group and in 75% of the cases for the mixed-Asian group. In Iceland, second-generation or subsequent-generation immigrants are extremely rare with only 1% of the total population [21]. Consequently, our data only include a limited number of second-generation immigrants. Our analysis is therefore based on comparing natives and immigrants who are predominantly of the first generation.
In view of previous research, we ask whether immigrant youth in Iceland report less life-satisfaction and more distress than their native peers, and whether youth of mixed background fare worse than youth of non-mixed foreign and native background. We also ask whether sociodemographic background explains ethnic differences in psychological well-being. Finally, we ask if ethnic differences in perceived parental, peer, and classmate support explain ethnic differences in psychological well-being, and if the support affects well-being differently depending on ethnicity (interaction).
The study took place in Iceland, a country of roughly 320,000 inhabitants recently experiencing influx of immigrants, who in 2014 accounted for 8.4% (27,447) of the population compared to 2.0% in 1996 [21]. Polish immigrants are the largest immigrant group, constituting 36.9% of the immigrant population (10,141 1 January 2014), Lithuanians are the second largest group (5.2%), and Filipinos are in third place (5.2%) [21]. With low unemployment rates and a stable welfare society, Iceland has in recent years attracted migrants from Asian and Eastern European countries searching for a better life. The majority of the work available to immigrants is in occupations without special educational or prior training requirements, such as in construction, care work, and other services [22]. In this study we compare the well-being of two immigrant youth groups, Poles and Asians (Filipino, Vietnamese, and Thai), to native youth. Other foreign origin subgroups were not large enough to enable statistical analysis.
Method
Participants
The study uses an Icelandic dataset from the WHO collaborative network Health Behavior in School-Aged Children (HBSC) established in 1982 [13]. In 2009/2010 a standardized anonymous questionnaire was administered in Iceland to all 6th, 8th, and 10th grade students (11, 13, and 15 year olds) present in school at the day of administration (schooling is obligatory for all children through the 10th grade). The survey complied with regulations and requirements concerning human subjects research, as laid out by the Data Protection Authority in Iceland (Personuvernd), and was approved by the relevant school authorities. The students were informed that participation was voluntary, and that if they accepted to participate, they could skip questions that they did not want to answer. A total of 11,561 students, from 161 schools, participated in the study, yielding an 87% response rate [23].
Males were 50.5% of the respondents, 32.5% were 6th graders (11 year olds), 33.9% 8th graders (13 year olds), and 33.2% 10th graders (15 year olds). Responses to the question of country of birth yielded 8.7% foreign born, and 8.4% reported to have mothers and 7.8% to have fathers born in a foreign country. Icelandic citizens born to Icelandic parents abroad are included in those numbers. In order to minimize classification error arising from this, we restricted non-mixed native background to having both parents born in Iceland (84.9% of the sample).
Measures
Ethnic variables
Immigrant status was determined by parents’ birthplace. Five groups were created: non-mixed Icelandic background (84.9%), non-mixed Polish background (1.1%), mixed-Polish background (0.4%), non-mixed Asian background (0.7%: Filipino, Vietnamese, and Thai), and mixed-Asian background (1.2%). Dummy variables were created for the five groups with the non-mixed Icelandic group as a reference.
Sociodemographic and support variables
A dummy variable was created for gender (boy = 0, girl = 1), two dummy variables for age (6th grade as a reference group), two for parental employment status (working father and mother as a reference), and three for family structure (single-parent household, living with a step-parent in addition to a biological parent, and other arrangement), with both biological parents living in the home as a reference group. The HBSC study uses the Family Affluence Scale (FAS) as an indicator of youths’ socioeconomic status [24]. The FAS scale comprises four questions about car and computer ownership in the household, family holidays, and if the child has his/her own bedroom. Each item gets a score and the four items are added to create a total FAS score for each participant on a scale of 0 to 9.
To assess perceived support, participants were asked to answer the question “How easy is it for you to talk to the following persons about things that really bother you?” In this study we use the answers for mother, father, and best friend: responses were rated on a five-point scale (0 = Do not have or see this person to 4 = Very easy). A score for perceived parental support was created by using the higher support value, whether it was from a mother or a father. Classmate support [25] was assessed by three items: “The students in my class(es) enjoy being together”; “Most of the students in my class(es) are friendly”; “The students in my class accept me as I am.” Responses were rated on a five-point scale (2 = Strongly agree to (2 = Strongly disagree). The scores for the three items were added (Cronbach’s alpha = .79).
Dependent variables
Two well-being measures were used. One is life-satisfaction measured by Cantril’s ladder [26]. The questionnaire included a picture of a ladder with the instructions that the top of the ladder (10) represented the best possible life and the bottom (0) the worst possible life. Participants were asked to choose a number describing where they stood at the present time. The second well-being measure, distress, was assessed by eight items: In the last 6 months how often have you had the following (headache, stomach-ache, backache, feeling low, irritability or bad temper, feeling nervous, difficulties in getting to sleep, feeling dizzy)? Responses were rated on a five-point scale (1 = About every day to 5 = Rarely or never). A mean score was calculated for the first three items (headaches, stomach-aches and backaches) and the scores for the remaining five items were added to the mean score of the first three, to obtain a summary distress score (Cronbach’s alpha = .84).
Analysis
First, descriptive background statistics (frequencies, means, and standard deviations) were explored for each of the ethnic groups. Next, ANOVA statistics compared life-satisfaction and distress across ethnic groups. Finally, a hierarchical multiple regression was conducted to test ethnic differences in life-satisfaction and distress. The first step of the regression contained the four ethnic groups (with the native respondents as a reference group), the second step also included gender, age, family structure, FAS, and parental employment status. In the third step, parental, friend, and classmate support were added, and in the last step, significant interactions between ethnic group and the support variables were included.
In order to reduce standard errors of coefficients, interval level variables involved in statistical interactions were centered prior to analysis.
Results
Table I presents frequencies for background variables by ethnicity. It shows that a higher proportion of non-native youth than non-mixed Icelandic youth live in non-intact families and are more likely to have non-employed parents (fathers of non-mixed polish origin and both parents in mixed-Asian families).
Demographic characteristics by ethnic background.
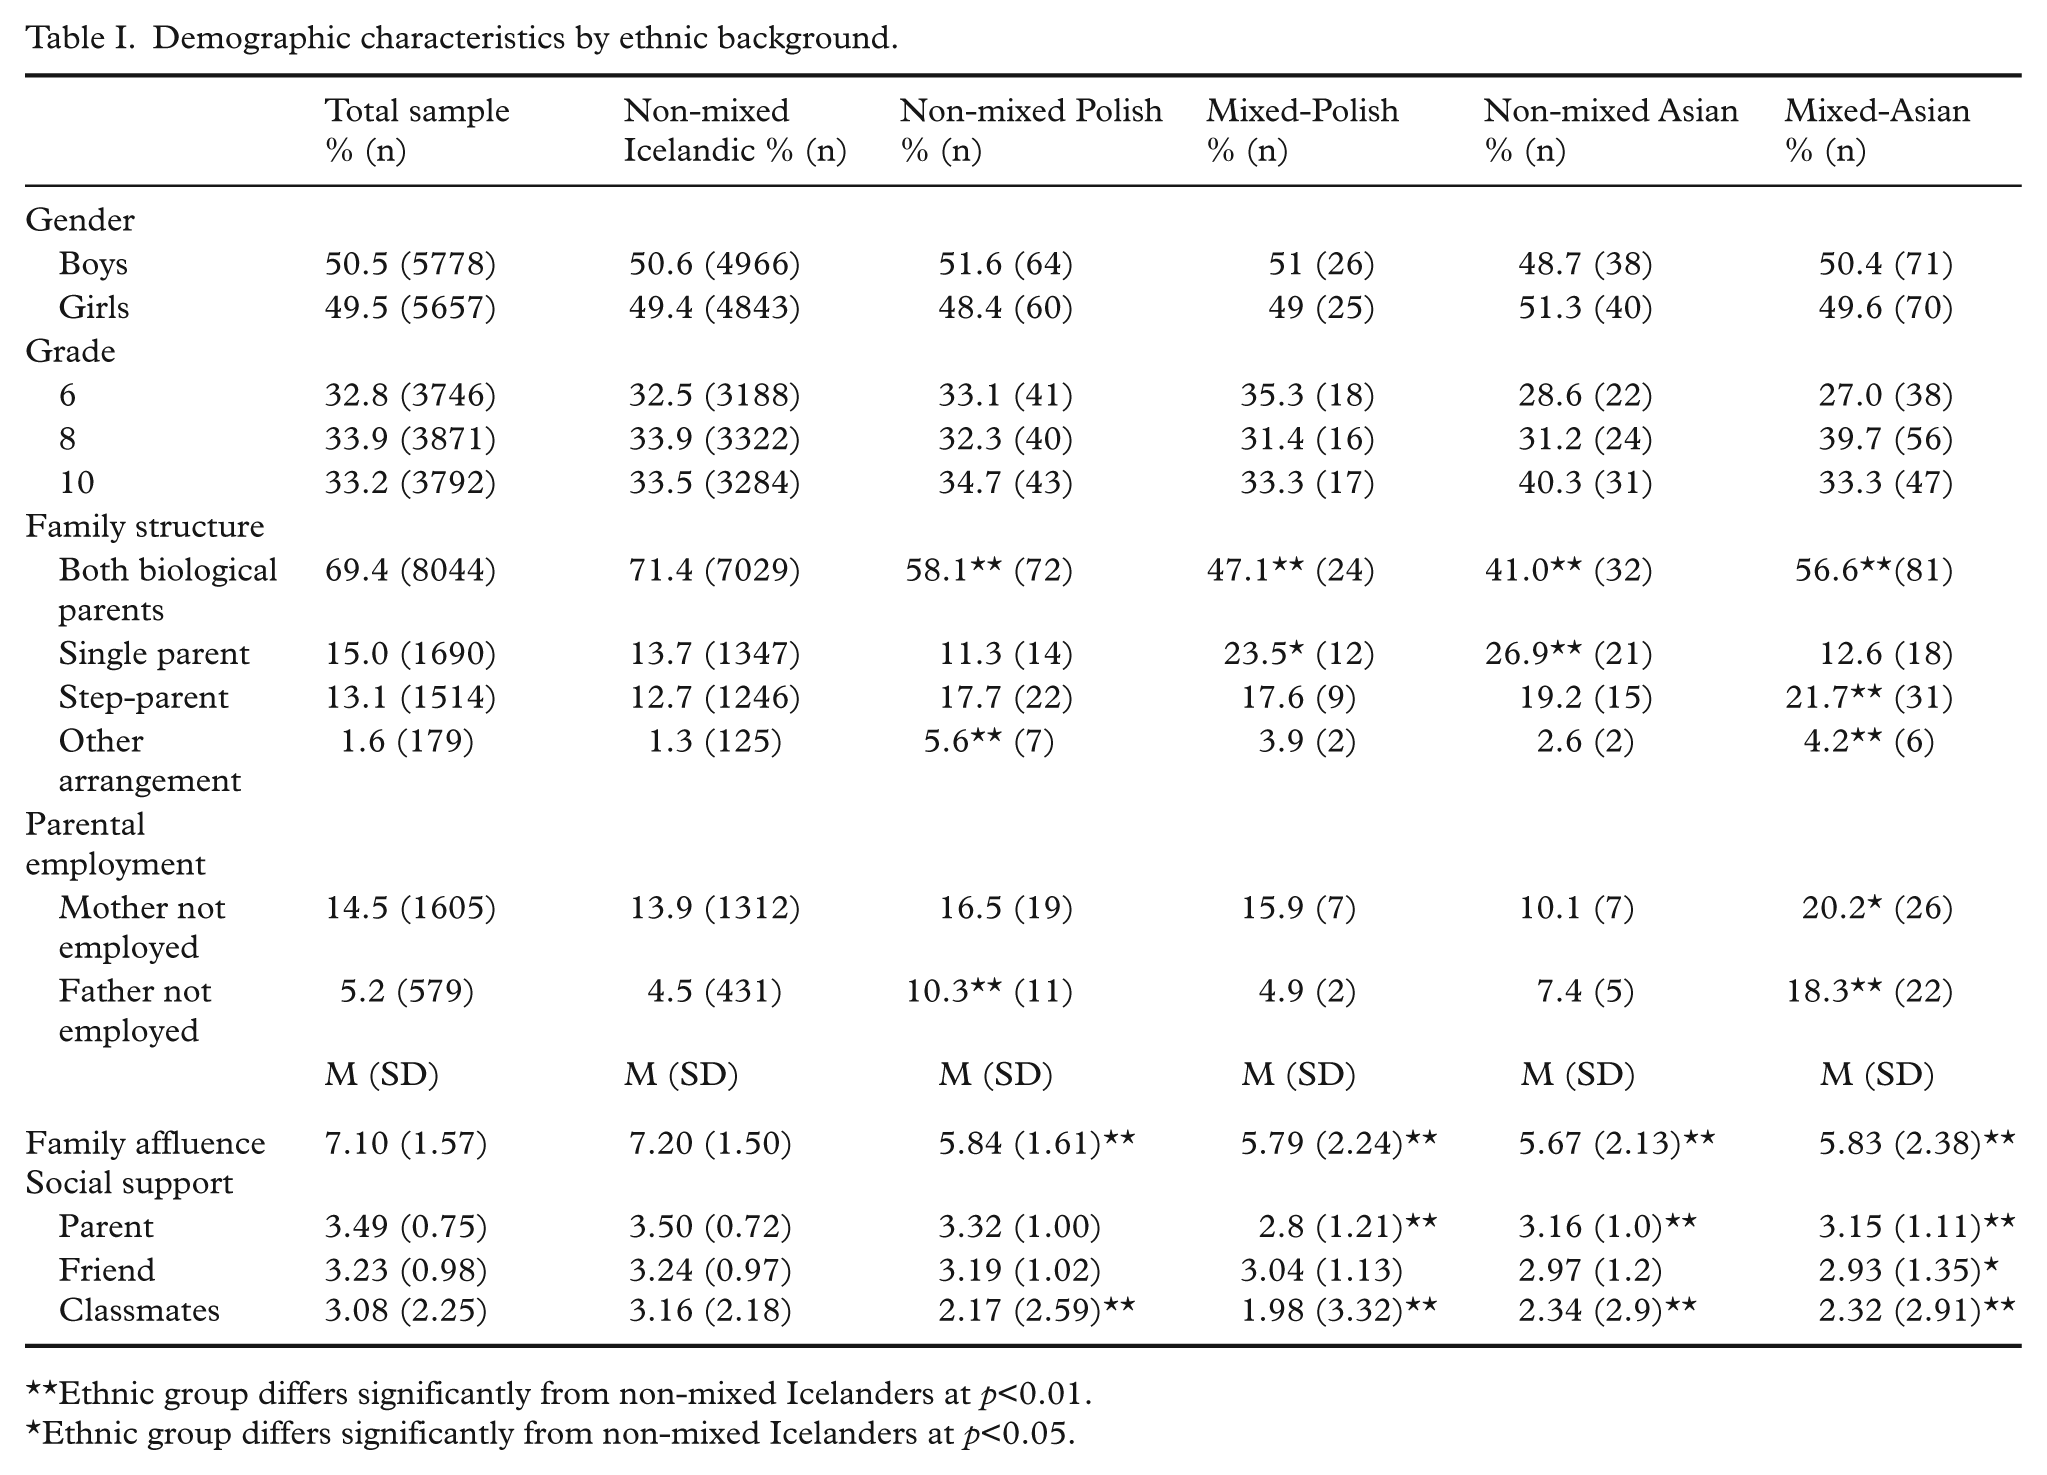
Ethnic group differs significantly from non-mixed Icelanders at p<0.01.
Ethnic group differs significantly from non-mixed Icelanders at p<0.05.
Mean values of FAS and perceived support are also lower for non-native youth. The Bonferroni-corrected post hoc test yielded significantly higher FAS for non-mixed Icelandic youth than the other ethnic groups (p<0.01). Non-mixed native youth reported more parental support than mixed-Polish (p<0.01), mixed-Asian (p<0.01), and non-mixed Asian youth (p<0.01). Non-mixed polish youth reported more parental support than mixed-Polish youth (p<0.01) and, finally, mixed Asian youth reported more support than mixed-Polish youth (p<0.05). Support from a friend was significantly lower among mixed-Asian youth than non-mixed native youth (p<0.05). Finally, non-mixed native youth perceived more support from their classmates than all the other ethnic groups (p<0.05).
In Table II means and standard deviations for life-satisfaction and distress are presented for the five ethnic groups.
Mean levels of well-being by ethnic background (standard deviations SD in parentheses).
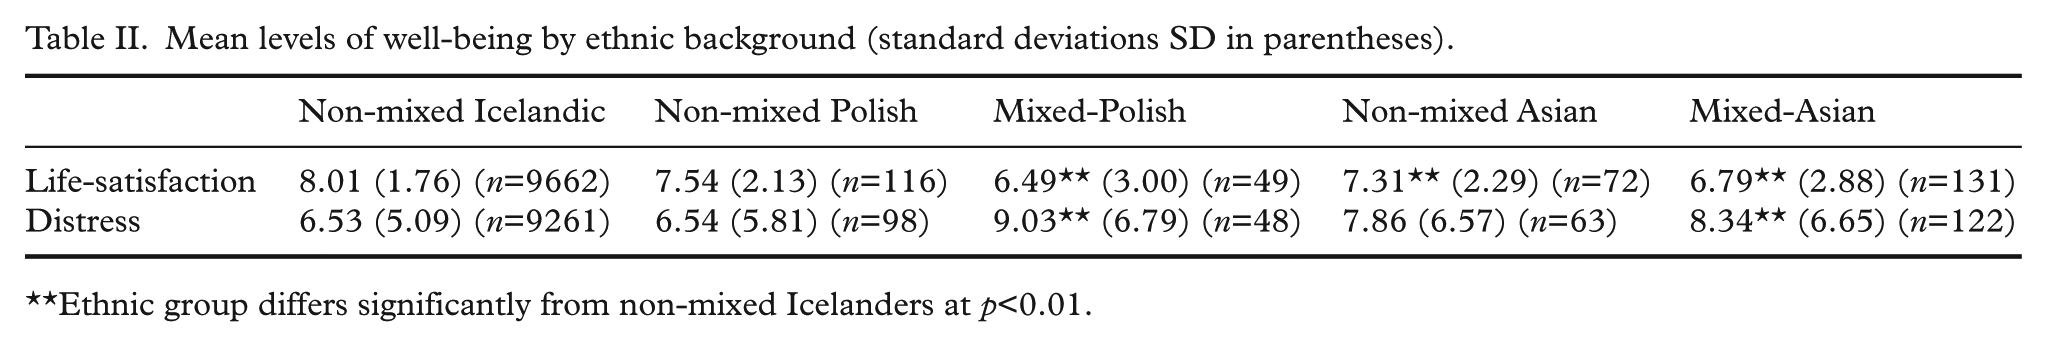
Ethnic group differs significantly from non-mixed Icelanders at p<0.01.
The non-mixed native group was significantly more satisfied with life than the mixed-Polish, mixed-Asian, and the non-mixed Asian group (p<0.01). Youth of mixed-Polish origin were less satisfied than non-mixed Polish youth (p<0.01) and the latter group, in turn, reported more life-satisfaction than mixed-Asian youth (p<0.05). Furthermore, significantly less distress was reported in the non-mixed native group than in the mixed-Polish (p<0.01) and mixed-Asian youth (p<0.01).
Table III shows a hierarchical regression predicting life-satisfaction. At the first step, the non-mixed native group (reference category) was compared with non-mixed and mixed Polish and Asian youth. All four mixed and non-native groups reported less life-satisfaction than the non-mixed native youth, and this was especially the case with the mixed ethnic groups. In step two, sociodemographic background variables were introduced. Older respondents, girls, the less affluent, those living in non-intact families and having non-employed parents, reported less life-satisfaction. With the addition of these variables, ethnic differences were markedly reduced, and non-mixed Polish and non-mixed Asian youth no longer differed from non-mixed native youth, although life-satisfaction remained lower in the mixed ethnic groups.
Hierarchical Ordinary least squares (OLS) multiple regression predicting life-satisfaction.
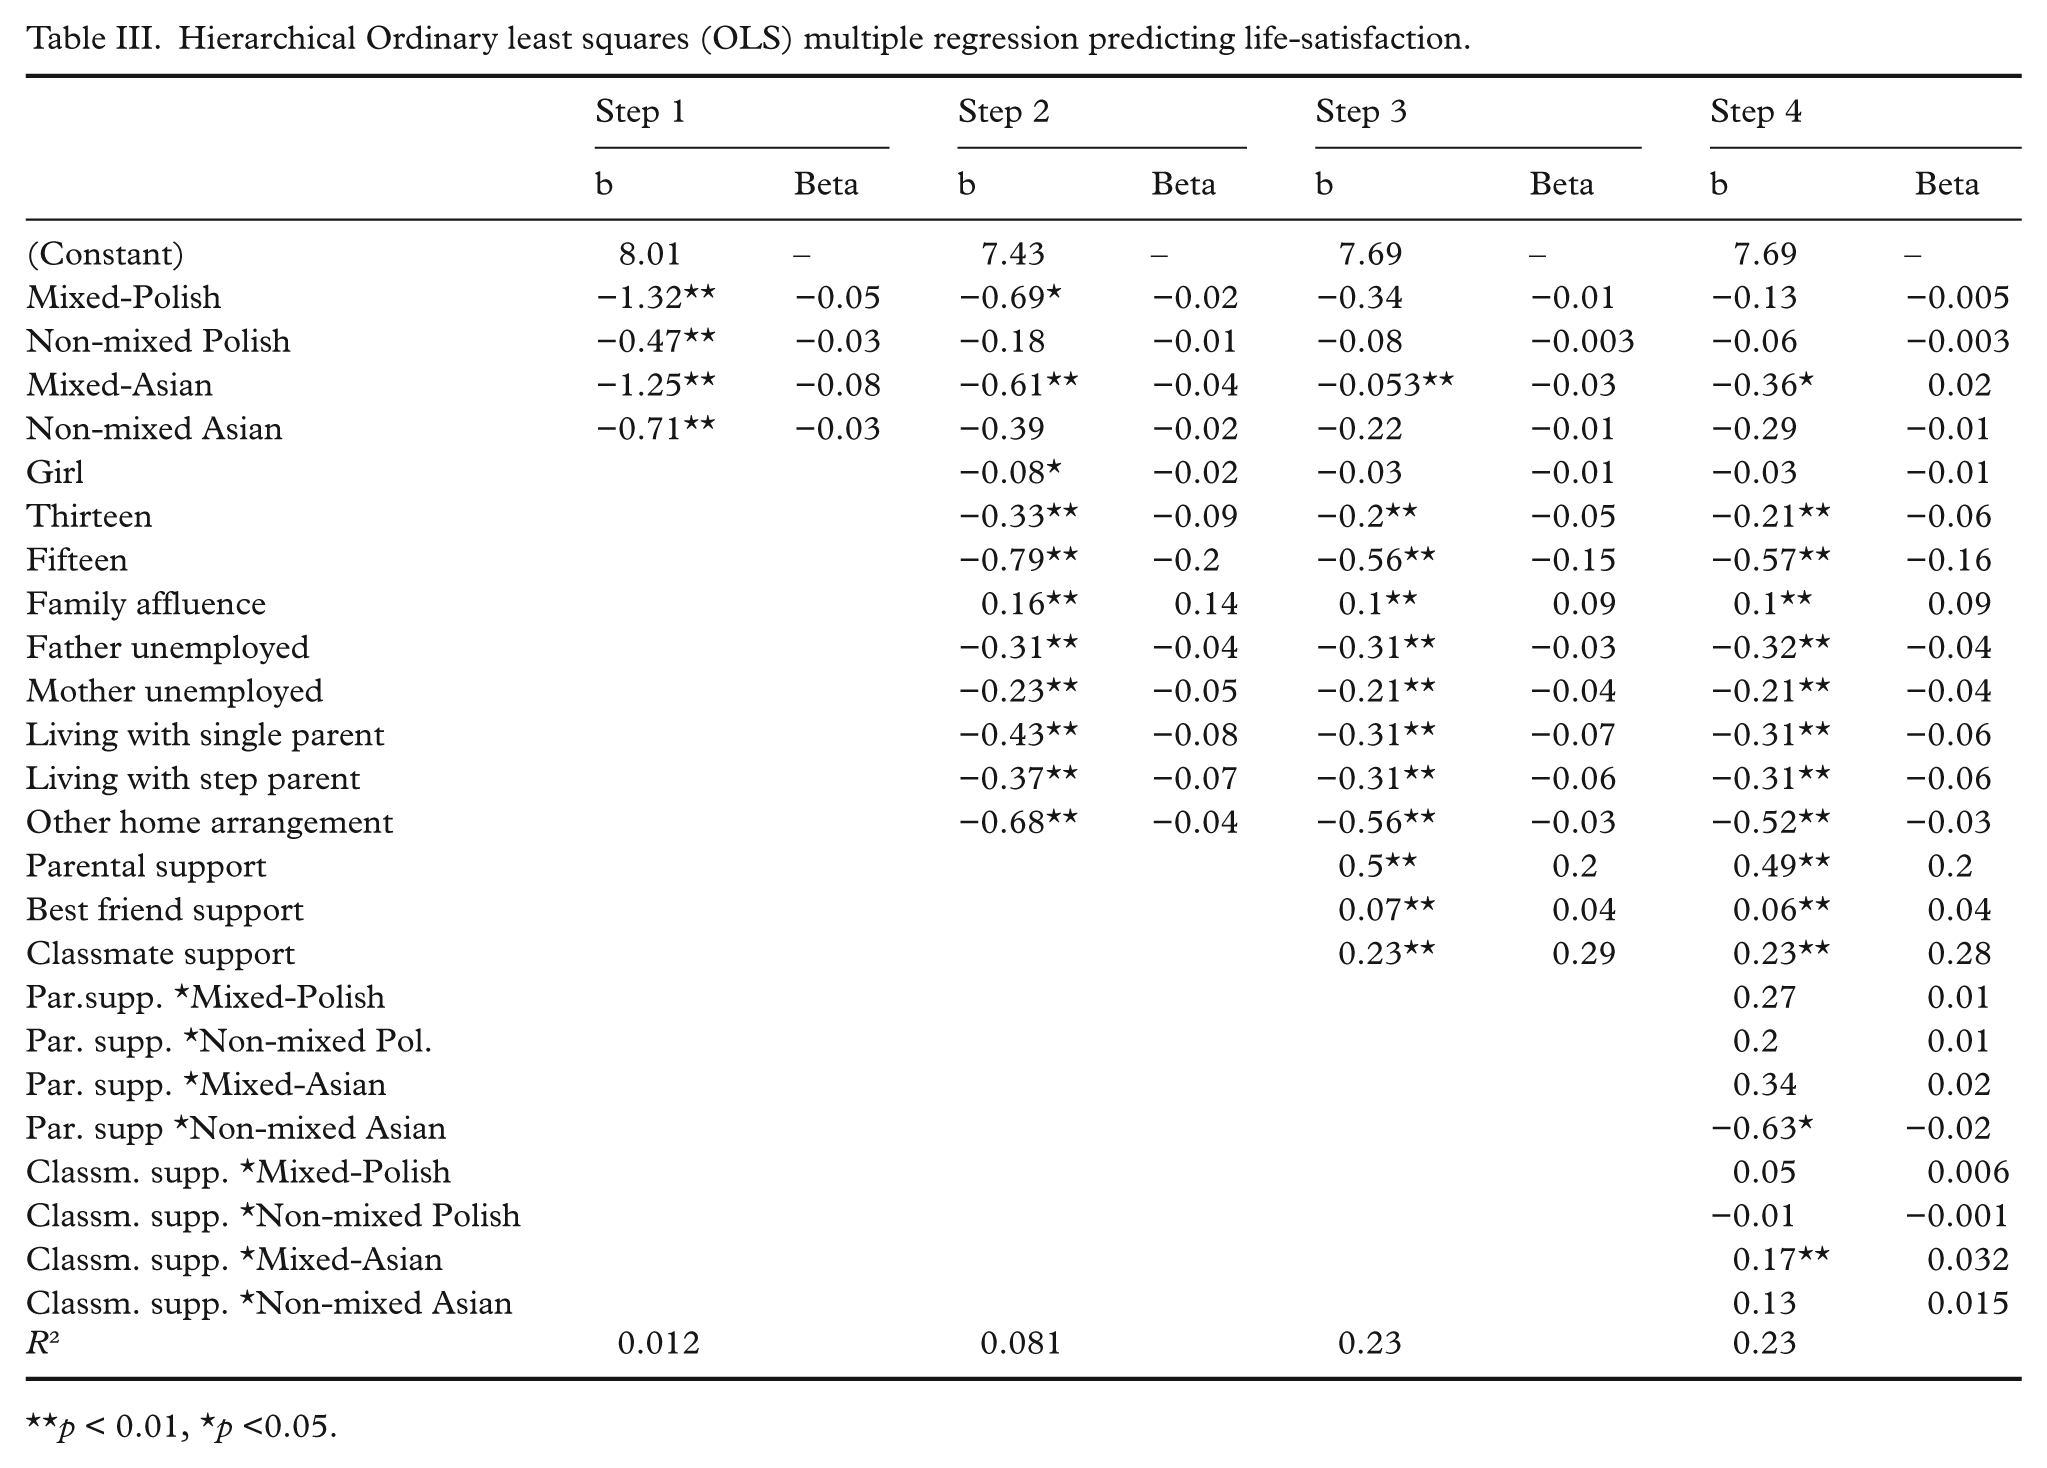
p < 0.01, *p <0.05.
In the third step, parental, best friend, and classmate support were added to the model, all of which were related to higher life-satisfaction. Again, ethnic differences were substantially reduced and now only mixed-Asian youth reported less life-satisfaction than non-mixed native youth.
In the fourth and final step, significant interaction effects between the support variables and ethnicity were added to the model. Parental support and classmate support significantly interacted with ethnicity. More specifically, classmate support was more important for youth of mixed-Asian background than non-mixed natives. In addition, parental support was less important for life-satisfaction among non-mixed Asians than non-mixed natives.
Table IV presents hierarchical regression predicting distress. Youth of mixed-ethnic background, both Asian and Polish, reported more distress than the natives. In the second step sociodemographic background variables were added showing more distress among older respondents, girls, the less affluent, those living in non-intact families, and those having non-employed parents. With the addition of these variables, ethnic differences in distress were no longer significant. The third step included support from parents, best friend, and classmates, showing lower distress among those reporting higher support from parents and classmates. Interestingly, now non-mixed Polish youth report significantly less distress than non-mixed natives. Analysis of interaction effects yielded no significant results.
Hierarchical Ordinary least squares (OLS) multiple regression predicting distress.
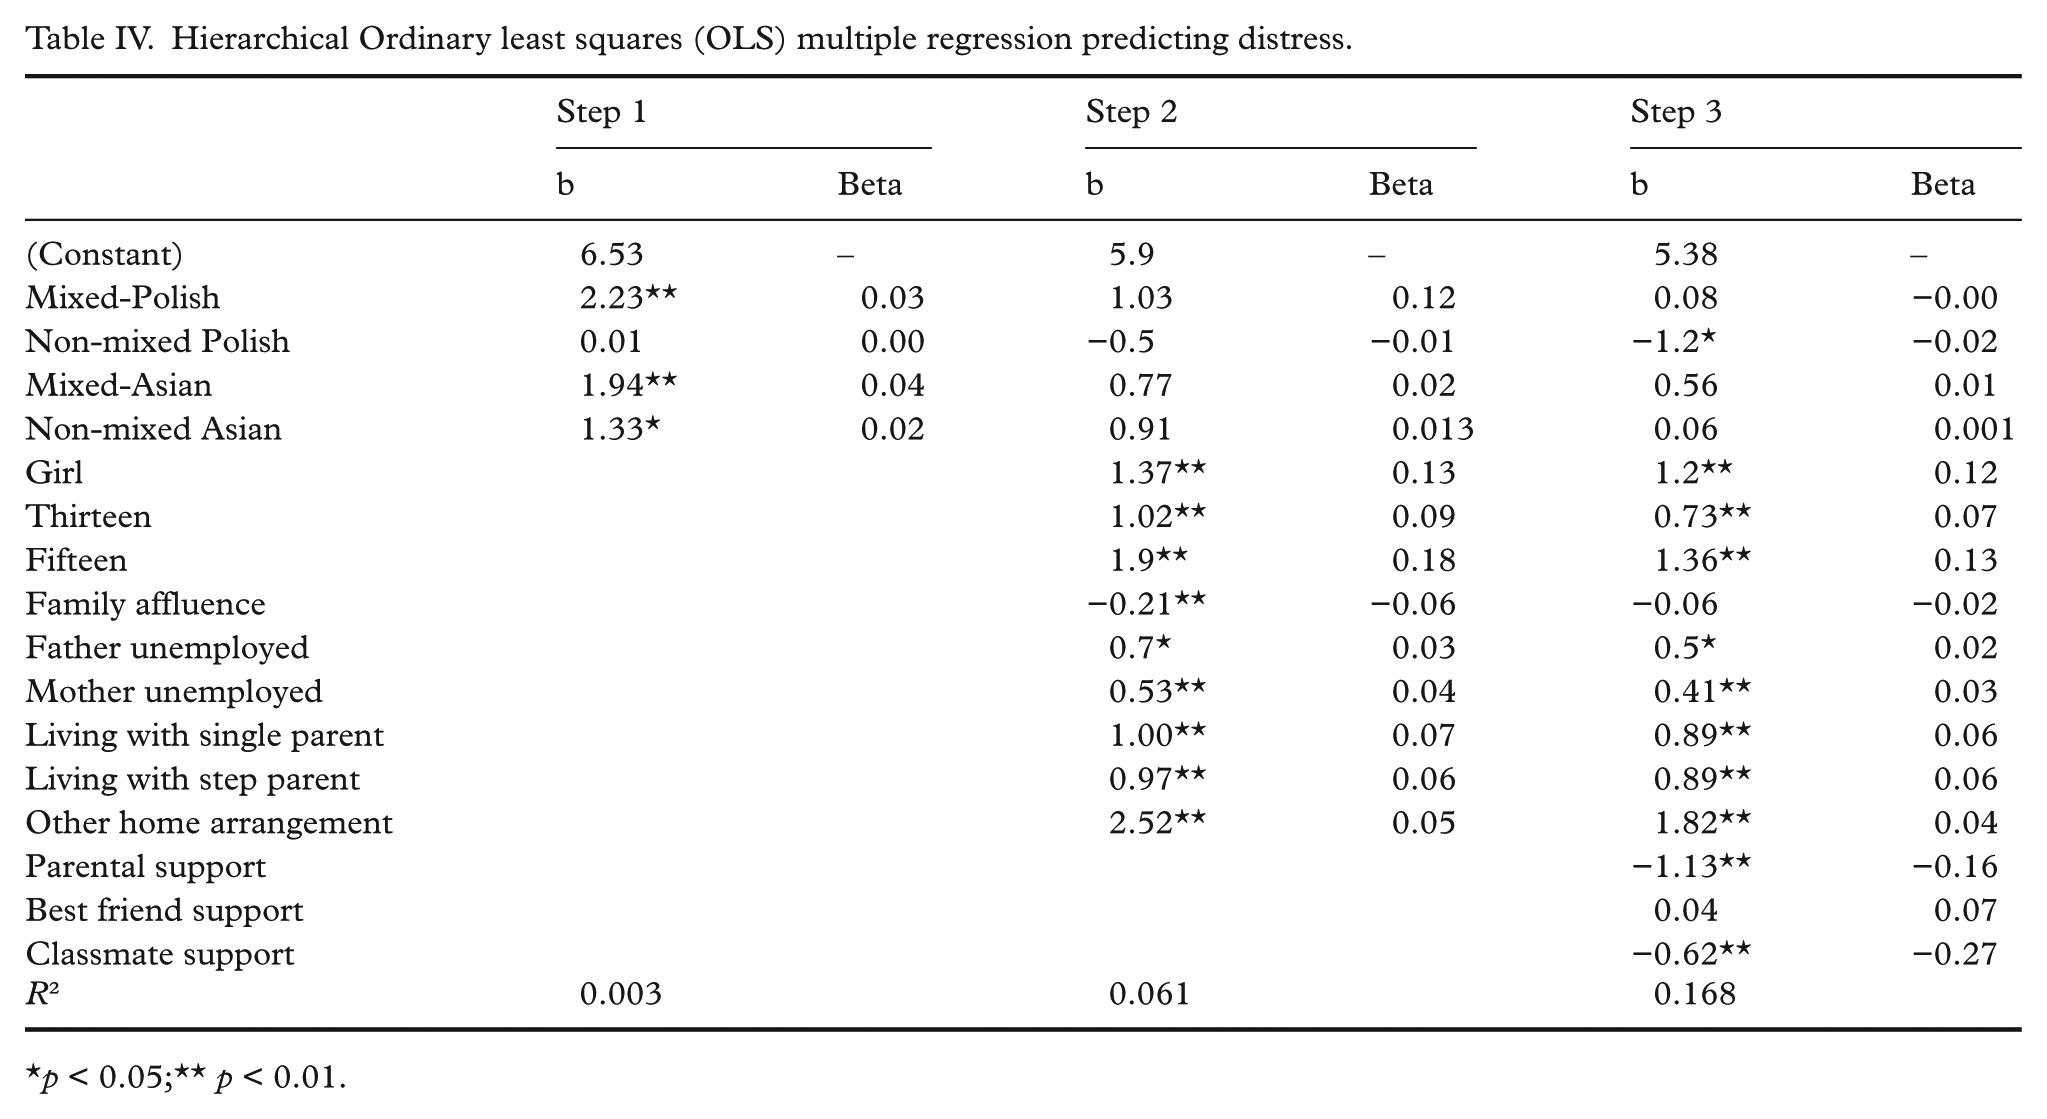
p < 0.05;** p < 0.01.
Discussion
This study was aimed at exploring the well-being of Polish and Asian immigrant youth in Iceland in comparison with their native peers and whether sociodemographic background and social support from parents, best friend, and classmates could account for ethnic differences in well-being. Our results reveal less life-satisfaction in all mixed and non-native groups than in non-mixed natives. Furthermore, the mixed-Asian and mixed-Polish youth reported less life-satisfaction than the non-mixed Polish and non-mixed Asian youth. Similarly, mixed-Asian and mixed-Polish youth reported more distress than their non-mixed native peers. The findings of less well-being in the mixed background groups are in line with findings from Abu-Rayya [10] but other studies show more positive results for mixed ethnic groups than for those with an entirely foreign background [9,16]. Different definitions of ethnic groups make comparison problematic. While some studies use respondents’ place of birth (see e.g. [6]), others use parental place of birth in which one or two parents are foreign-born (see e.g. [27]), and still others categorize parental place of birth separately, similar to what is done here [9].
The fact that initial ethnic differences in life-satisfaction and distress disappear or are substantially reduced when background is controlled for, indicates a vulnerable situation among mixed and non-native youth in Iceland, which is in line with other research [6,9]. More specifically, we find that non-mixed native youth more often belong to intact and well-off families, and have employed parents, all of which partly explain their advantage.
Social support accounted for differences in well-being between ethnic groups, in addition to sociodemographic background. In fact, ethnic differences in life-satisfaction and distress were almost fully accounted for when sociodemographic background and social support were controlled. When compared to non-mixed natives, we found less parental support in the mixed-ethnic groups and the non-mixed Asian group, less friend support in the mixed-Asian group, and less classroom support in all the mixed and non-native groups, which partly accounts for their disadvantage. Interestingly, youth of two Polish-born parents reported similar parental support as their native peers, and more support than the mixed-Polish counterparts. Moreover, when support was added to the regression model, the difference in life satisfaction between mixed-Polish and non-mixed native youth disappeared, and non-mixed Polish youth now reported the lowest distress. Mixed-Asians reported less life-satisfaction than non-mixed natives through all steps of the regression analysis. Worse outcome for the mixed-Asian youth may indicate weaker relations to the host culture, and a conflict between culture of origin and the host culture. It may also reflect a socioeconomic situation affecting relationship formation in these families. In general, belonging to a family in which both parents are foreign-born appears to be more closely related to well-being and perceived support than having mixed-ethnic background. This finding does not support the notion that having at least one native parent helps integration and acculturation leading to reduced stress related to migration [15]. On the other hand, the results may indicate a tendency towards cultural conflicts in mixed-ethnic families. The results also present evidence that the importance of social support for well-being may vary for different ethnic groups.
A key finding is that non-native adolescents more often live in challenging social and economic circumstances and experience less social support than their native peers. This largely explains poorer outcomes among the non-natives and reflects their less-intact family structures and their parents’ more precarious and lower-level occupations. Governmental policies have not systematically addressed these circumstances of immigrants in Iceland [28]. Reconsideration of governmental policies relating to family support and taxation on low-income households could benefit immigrant families and even positively affect the well-being of immigrant children. Furthermore, health and social services, including school health and counseling services, need to be mindful of non-native youth’s disproportionate service needs to promote health and respond to early signs of decreasing well-being. It should be kept in mind that migration means that previous connections to health and social service professionals in the country of origin are dissolved and need to be established successfully in a new country. Without these connections immigrant families may have to rely too largely on their own limited resources. Less social support among immigrant youth, especially classmate support, may signify isolation from the community and school. Entering a new school, and a new class which has had years of forming alliances and bonds, is a challenge for the immigrant child. School authorities and teachers should be fully aware that immigrant youth are more likely than natives to become marginalized and may have greater need for support from teachers and classmates than their native peers, due to lack of support elsewhere. Developmental projects such as assigning supportive native families to immigrant families as carried out in a primary school in Reykjavik [29] is an interesting example of a way to assist immigrant families to adapt to new circumstances.
The strengths of this study include a large representative national sample, a high response rate, and a standardized questionnaire. The questionnaire was anonymous, which should have minimized social desirability response bias or non-response due to sensitive items [30]. This study only took into account perceived emotional support. Although a key support dimension, other types of support impacting on well-being could be addressed. The cross-sectional design employed here does not allow for interpretation of causality, a strength of longitudinal designs that could yield further insights. Additionally, future research should address the family context of mixed and non-mixed immigrant families, and the relationships, resources, stresses, and strains that may help explain different outcomes of children and youth in these families. Finally, the context of migration should be addressed, such as the length of residency in the new country, the reasons for emigration, and how migrational factors affect the well-being of immigrant children.
Footnotes
Acknowledgements
The Icelandic HBSC study was conducted by the Centre for Prevention Studies at the University of Akureyri in Iceland. The authors would like to thank the staff of the centre for facilitating this research project.
Conflict of interests
None declared.
Funding
The analysis was supported with research grant to the first author from Margaret and Bent Scheving Trust Fund at the University of Iceland.