
Abstract
Aim: The aim of this study was to test the psychometric properties of the Salutogenic Health Indicator Scale (SHIS) in an adolescent population. Methods: The investigation was performed among Swedish students aged 13–15 years (n = 817; 58% girls). The SHIS was assessed for respondent acceptability, and its psychometric properties were evaluated according to classical test theory (regarding unidimensionality, targeting, reliability, and external construct validity). Results: The adolescents found it easy to complete the questionnaire, which was completed in an average of 4 minutes. Exploratory factor analysis, which is based on polychoric correlations, identified one factor, supporting the instrument’s unidimensionality. Floor/ceiling effects were ⩽ 3.3%. Reliability estimates yielded a Cronbach’s alpha value of 0.93; the test–retest reliability (n = 50; 2-week interval) coefficients were 0.89 for the total SHIS score and 0.52–0.79 for item scores. Spearman correlations with other variables were based on a priori expectations (self-rated general health, 0.595; depressive symptoms, −0.773; anxiety, −0.577; and sleep problems, 0.519).
Introduction
Health measurement instruments often measure ill health rather than health and, therefore, do not provide information about the healthy majority of the population, nor do they meet the need for a health-promoting approach in line with the Ottawa Charter [1]. To meet this need, the Salutogenic Health Indicator Scale (SHIS) was developed and psychometrically tested in an adult population [2]. However, there is still a need for a short salutogenic health instrument for use with adolescents, and this study thus provides a psychometric analysis of the SHIS in the adolescent population.
Background
In the Ottawa Charter [1], the promotion of health is defined as the process of enabling people to increase control over and improve their health. Individuals and groups of people must be able to identify and realize their aspirations, satisfy their needs, and change or cope with the environment to reach a state of complete physical, mental, and social wellbeing. The Ottawa Charter further states that health is seen as a resource in everyday life, not the objective of our lives: “Health is a positive concept emphasizing social and personal resources, as well as physical capacities. Therefore, health promotion is not just the responsibility of the health sector, but goes beyond healthy life-styles to well-being” [1]. Similarly, the World Health Organization (WHO) defines health as physical, mental, and social wellbeing, not merely the absence of disease and infirmity [3]. However, most health measurement instruments are based on a pathogenic approach. Therefore, Bringsén et al. [2] developed the SHIS, which was influenced by the salutogenic theory of one’s sense of coherence (SOC). The SOC theory was developed by Antonovsky [4], in which health is considered a subjective experience related to a strong SOC. Bringsén et al. [2] provided the following description of health: “Health is a positive subjective experience of oneself as a whole. Health is measurable by using individuals’ feelings/experiences of physical, mental, and social wellbeing as indicators” [2, p.14]. Despite the similarities between this description of health and Antonovsky’s description of health theory and SOC, there are clear differences between the SOC instrument [4] and the SHIS [2]. The greatest difference is that the SOC instrument was developed empirically from people with a good mental health status despite adverse life experiences [4], whereas the content of the SHIS was developed from theories of health and wellbeing [2]. Bringsén et al. [2] described in depth the development process of the SHIS and the relevant psychometric tests conducted. With a holistic perspective of health, a total index of all health indicator items was calculated. Two factors of the instrument were extracted using principal component analysis (PCA), representing “intrapersonal characteristics” and “interactive function.” Self-rated health status and self-reported sick leave were significantly correlated with the total SHIS score (Spearman’s rho of 0.56 and −0.24, respectively), and a Cronbach’s alpha value of 0.92 was obtained. Item-level test–retest reliability was assessed by weighted Kappa and ranged from 0.44 to 0.67 [2].
There are several situations in which it would be valuable to administer a health measurement scale among adolescents: scales can be used to measure health, evaluate an intervention, or to be applied as a starting point for discussions about health and lifestyle in a healthcare setting. Most adolescents are satisfied with their health, but an increasing number of adolescents report emotional problems, as well as complaints about sleep and pain [5]. Promoting wellbeing in adolescents is an important responsibility for society [6]; one way to accomplish this is through health-promoting discussions with health professionals (for example, school health staff). However, it is important that these discussions be geared towards adolescents. Using questionnaires developed for use in other age groups is not recommended [7]. It is, therefore, valuable to examine the instruments that will be used in the target population.
Aim
The aim of this study was to test the psychometric properties of the SHIS in an adolescent population.
Methods
Participants and setting
This study was conducted in six municipalities (representing rural and urban areas, with a total population of 120,000) in southern Sweden from 2012 to 2014. All schools with students in grade 8 were asked to participate in the study, and 21 of 23 eligible schools agreed to be involved and to participate. All data were collected during the school day in grade 8 classrooms (students aged 13–15 years, median 14 years). Teachers and school health staff distributed the questionnaire to these students (n = 1129), and 817 of them answered the questionnaire (response rate of 72%, with females comprising 58%). Teachers were available to answer questions, and the students were told that there were no “right or wrong” answers and that they should answer according to their own opinion. Students and their parents or guardians were provided written information about the study, including that it was voluntary. Parental permission for participation is not needed for underage students in Swedish high schools when a survey has been approved by the school.
Test–retest reliability was tested with a 2-week interval (n = 50, grade 8, 13–15-year-olds, 54% girls). Students were instructed to answer the questionnaire and provide written or oral comments. The time taken to complete the questionnaire was noted and was used to assess the instrument’s acceptability in the target group.
Ethics
The Regional Ethical Review Board in Lund approved the study (2012/462) before participant recruitment began. Informed consent was obtained after the study had been described to the adolescents. The study was conducted in accordance with the tenets of the Declaration of Helsinki [8].
Instruments
The SHIS is a 12-item scale with six response categories [2]. The questions focus on the last four weeks, and the respondents are asked to provide their opinion on two opposing statements by ticking a series of boxes on one side, “more agreement with the positive statement,” or the other, “more agreement with the negative statement.” The questions concerned experience with energy, level of morale, tension, sleep, concentration, creativity, resolution, expression of feelings, illness, energy level, social capacity, and physical function. Each item is scored on a scale from 1 to 6, and the scores are then summed into a total score that ranges between 12 and 72, with higher scores indicating better salutogenic health.
The EuroQoL visual analog scale (EQ-VAS) is a component of the EQ-5D, an instrument constructed to measure health-related quality of life [9]. The EQ-5D consists of five questions on general health as well as a visual analog scale (VAS). When the EQ-5D is used in adult populations, algorithms are used to achieve quality of life weights from the responses to the five EQ-5D questions. These algorithms have not been validated for individuals under the age of 15 years, and, therefore, we only used the EQ-VAS in this study. The EQ-VAS records current self-rated health on a vertical VAS with the following endpoints: “Best imaginable health state” and “Worst imaginable health state.” The scale ranges from 0 to 100, and higher scores indicate better self-rated health.
The Center for Epidemiologic Studies Depression Scale (CES-D) is a self-reported measure of the frequency of 20 depressive symptoms [10]. The scale’s psychometric properties were appropriate when implemented with adolescents [11]. Each item is scored regarding the frequency of its occurrence in the previous week, with scores ranging from 0 (rarely or never) to 3 (most or all of the time), with a possible total score of 0–60. Higher scores indicate more depressive symptoms.
The Spence Children’s Anxiety Scale (SCAS) is a self-reported measure of 38 anxiety items that has been found to be valid and reliable in adolescents [12]. Each item is scored regarding its frequency, with scores ranging from 0 (never) to 3 (always), with a possible total score of 0–114. Higher scores indicate worse anxiety symptoms.
In addition, students were asked to complete a questionnaire with items selected from the Health Behaviour in School-aged Children (HBSC) study [5]. The HBSC survey has been conducted for 30 years in 43 countries among children aged 11–15 years old and has been found to be valid and reliable in this age group [5]. The selected questions pertained to birth year, gender, country of birth for both the students and their parents, family situation (parents living together, separated, or other), perceived economic situation (“How financially well off is your family,” with six possible answers: very well-off, rather well-off, average, not very well-off, not well-off at all, and do not know) and sleep (“Do you have sleep problems?” with five possible answers: every night, more than once a week, about once a week, about once a month, and seldom or never) [5].
Data analyses
Data were analyzed using IBM SPSS, version 21.0, FACTOR version 10.3.01 (http://psico.fcep.urv.es/utilitats/factor/) [13,14] and VassarStats (http://vassarstats.net/). Psychometric analyses were conducted according to classical test theory (CCT) [7].
The acceptability of the SHIS was assessed by reviewing the respondent’s comments to the questionnaire and by computing the mean time taken to complete it. With the exception of acceptability and test–retest reliability (n = 50), all remaining analyses were based on data from the full sample (n = 817).
Data completeness was determined by the percent of missing responses to each item, with ⩽ 5% considered acceptable [7]. The differences between the participants who completed all items in the questionnaire and those who omitted one or more of the items were assessed with Chi-square test.
The legitimate summation of item scores into total scores requires that items represent one common latent variable; that is, the instrument must be unidimensional. This requirement was tested by exploratory factor analysis (EFA) based on polychoric correlations and parallel analysis to determine the number of factors [15]
Targeting was assessed using descriptive statistics, in which the SHIS total scores spanned most of the possible range (i.e. 12–72), with an average close to the scale midpoint (i.e. 30) and without excess skewness (preferably −1 to +1). Floor and ceiling effects (the percent of respondents with the lowest and highest possible SHIS scores, respectively) were also analyzed, with 15% considered acceptable [16].
Reliability was assessed using Cronbach’s coefficient alpha; alpha values from 0.70 to 0.80, 0.81 to 0.90, and ⩾ 0.90 were considered acceptable, good, and excellent, respectively [17]. Test–retest reliability (n = 50) of the total SHIS score was tested using the intra-class correlation (ICC) (two-way absolute agreement, mixed model), and the quadratic weighted Kappa statistic was used to assess item-level test–retest reliability. ICC values ⩾ 0.7 and Kappa values > 0.60 were considered acceptable [16,18].
External construct validity was assessed by correlations (Spearman’s rank order correlation coefficient) of the SHIS scores with self-rated health (EQ-VAS), depressive symptoms (CES-D), anxiety (SCAS), and perceived frequency of sleep problems. The hypothesis was that a high SHIS value would correspond with high self-rated health and that a low SHIS value would correspond with the scales measuring depression, anxiety, and sleep problems. Known-group validity was tested by comparing the SHIS scores between boys and girls, with the hypothesis that boys would provide higher scores for their own health than girls [19].
Results
The participants were mainly of Swedish origin and lived in a household with two parents (Table I). A majority of the students (78%) perceived their economic situation to be very good or quite good. The instrument was well accepted by the adolescents, although some of them raised questions about the meaning of the last item on physical function: “Felt that my body has been functioning well/poorly in relation to my way of living.” When asked to read the question one more time, they understood it. The respondents completed the SHIS in a mean time of 4 minutes (standard deviation (SD), 1; min–max, 2.5–7). Of the 817 students who answered the questionnaire, 770 (94%) completed all questions, although the prevalence of missing data (at the item level) ranged from 0.6% to 2.3%. The questions concerning energy experience, level of morale, tension, sleep, concentration, illness, energy level, and social capacity had missing data for 0.6%–1.0% of the items, the questions concerning physical function, creativity, and resolution had missing data for 1.2%–1.8%, and the questions concerning expression of feelings had missing data for 2.3%. The 47 students who did not complete all the questions in the questionnaire did not significantly differ from the other students regarding depressive symptoms (measured by the CES-D), anxiety (measured by the SCAS), self-reported health (measured by the EQ-VAS), sleep problems, or perceived economic situation. However, the students who did not complete all questions reported having separated parents more frequently (p = 0.012) and were more often of non-Swedish origin (p = 0.017).
Demographic sample characteristics (n = 770) compared with the average in Sweden for corresponding ages.
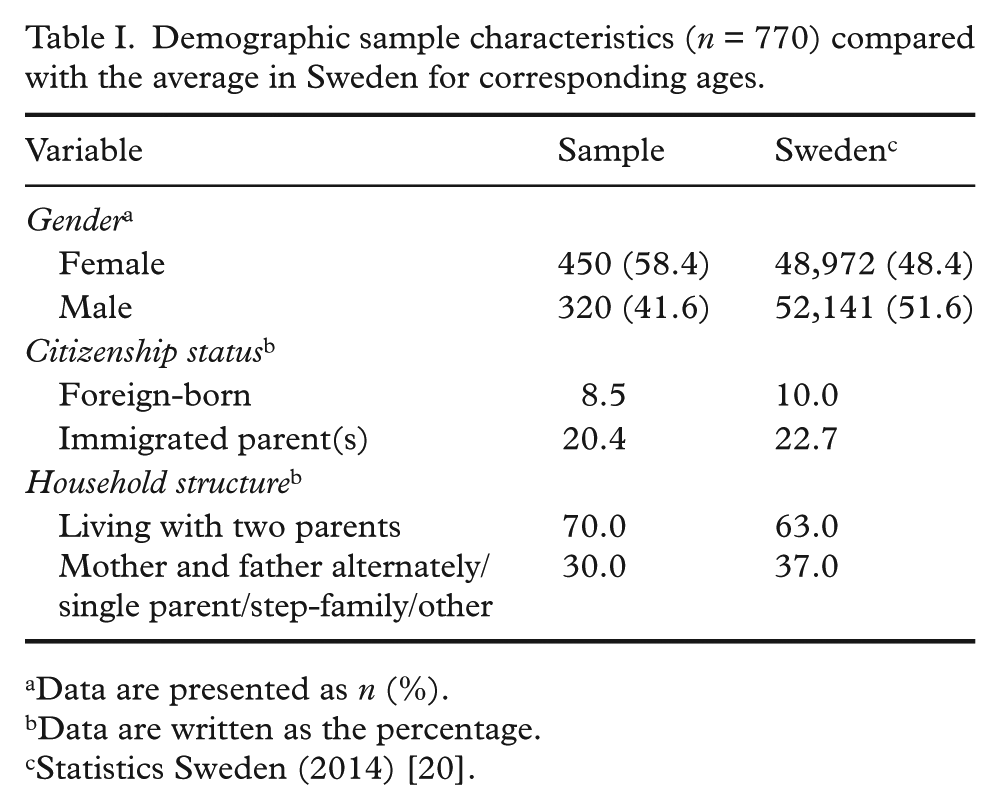
Data are presented as n (%).
Data are written as the percentage.
Statistics Sweden (2014) [20].
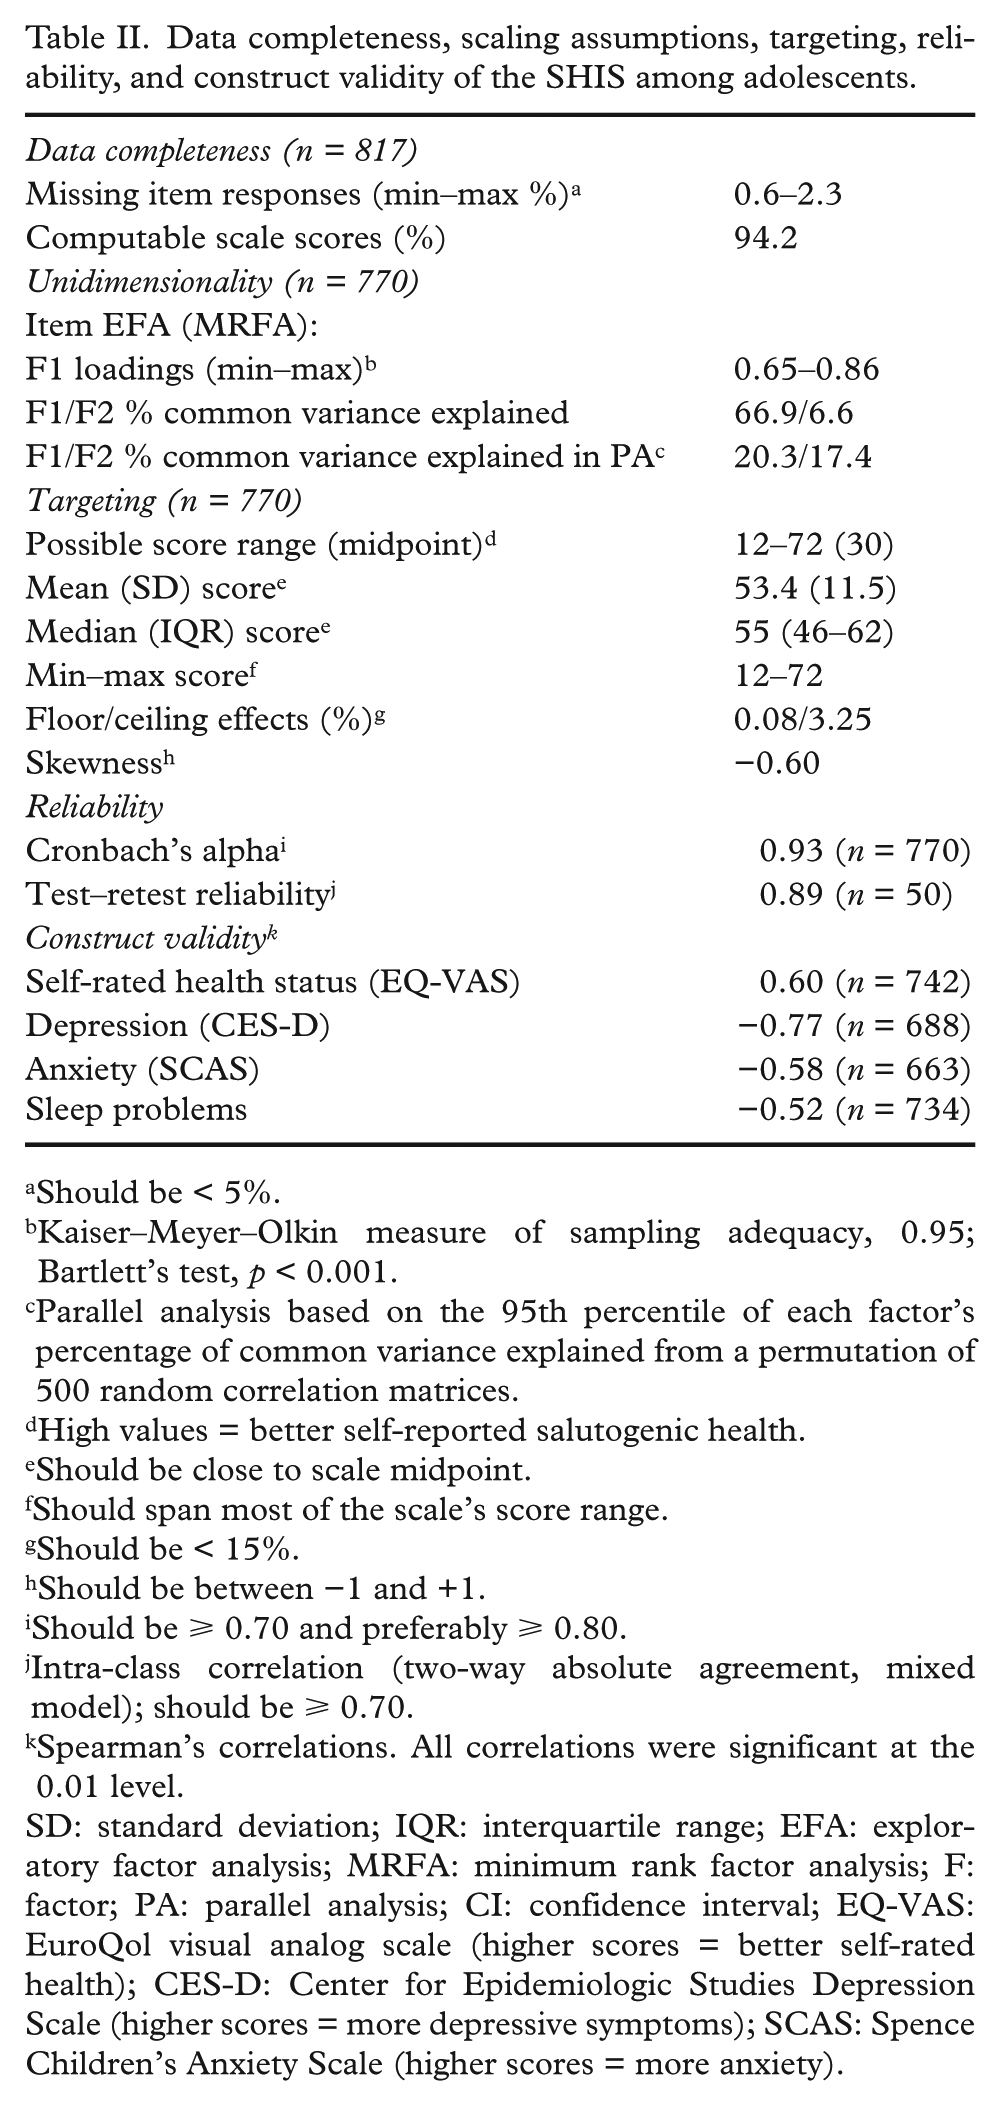
The EFA results provided support for the unidimensionality of the SHIS. That is, the second empirical factor explained only 6.6% of the common variance compared to the 17.4% explained by the second factor derived from random data (Table II). The communalities ranged between 0.44 and 0.70.
Data completeness, scaling assumptions, targeting, reliability, and construct validity of the SHIS among adolescents.
Should be < 5%.
Kaiser–Meyer–Olkin measure of sampling adequacy, 0.95; Bartlett’s test, p < 0.001.
Parallel analysis based on the 95th percentile of each factor’s percentage of common variance explained from a permutation of 500 random correlation matrices.
High values = better self-reported salutogenic health.
Should be close to scale midpoint.
Should span most of the scale’s score range.
Should be < 15%.
Should be between −1 and +1.
Should be ⩾ 0.70 and preferably ⩾ 0.80.
Intra-class correlation (two-way absolute agreement, mixed model); should be ⩾ 0.70.
Spearman’s correlations. All correlations were significant at the 0.01 level.
SD: standard deviation; IQR: interquartile range; EFA: exploratory factor analysis; MRFA: minimum rank factor analysis; F: factor; PA: parallel analysis; CI: confidence interval; EQ-VAS: EuroQol visual analog scale (higher scores = better self-rated health); CES-D: Center for Epidemiologic Studies Depression Scale (higher scores = more depressive symptoms); SCAS: Spence Children’s Anxiety Scale (higher scores = more anxiety).
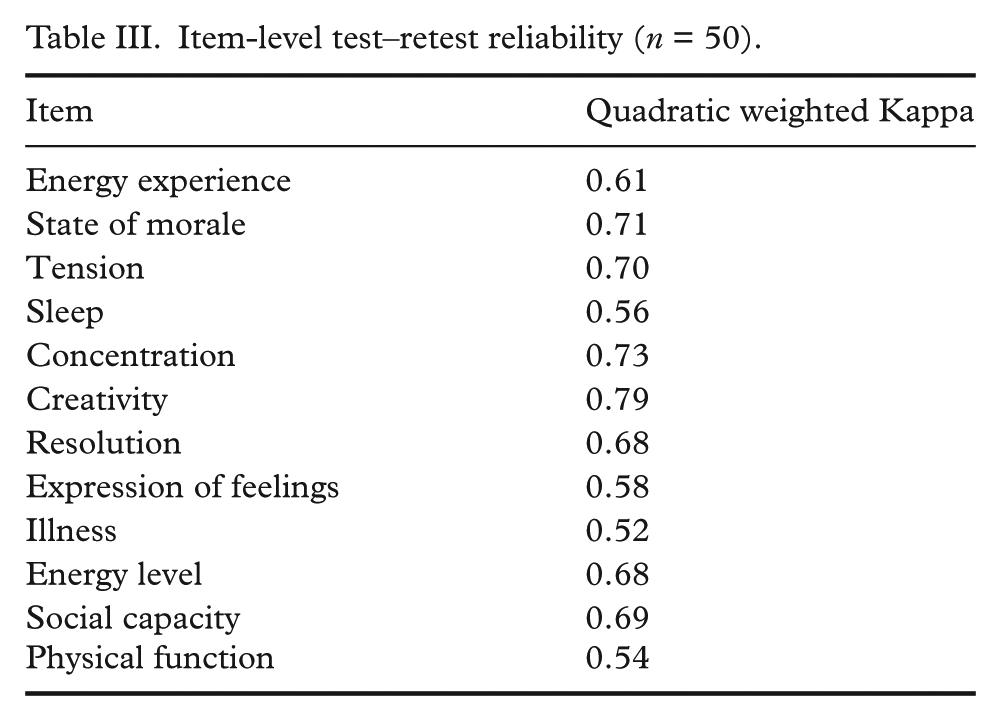
Small floor and ceiling effects (0.1% and 3.3%, respectively) were observed in the total SHIS scores. However, the average total scores were above the midpoint (Table II). Reliability was generally good, with alpha coefficients and ICC values of 0.93 and 0.89 for the total score (Table II), respectively, and item-level quadratic weighted Kappa values ranging from 0.52 to 0.79 (Table III).
Item-level test–retest reliability (n = 50).
The assessments of external construct validity revealed a significant positive correlation between the SHIS and self-rated health and significant negative correlations with depressive symptoms, anxiety, and sleep problems (Table II). Boys had significantly (p < 0.001) higher scores on the SHIS scale than girls (Table IV).
Total SHIS scores among 770 adolescents (aged 13–15 years).
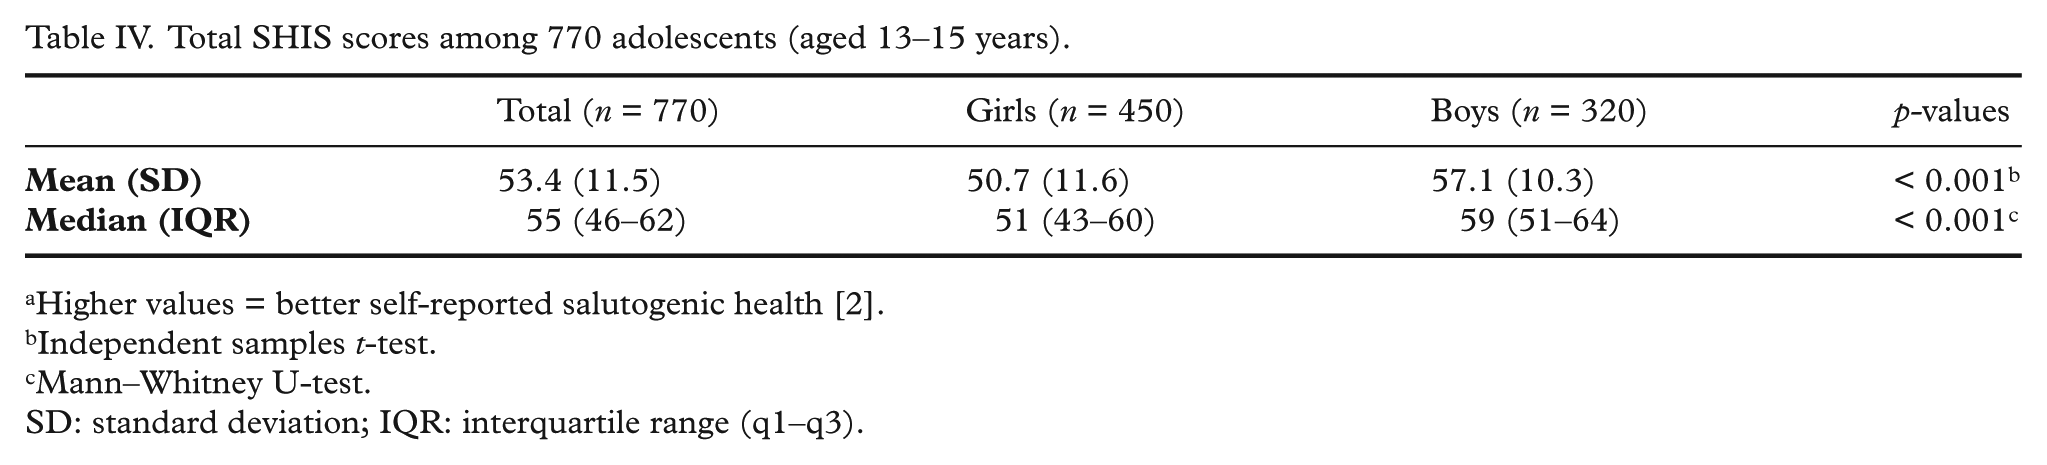
Higher values = better self-reported salutogenic health [2].
Independent samples t-test.
Mann–Whitney U-test.
SD: standard deviation; IQR: interquartile range (q1–q3).
Discussion
This study assessed the use and basic psychometric properties of the SHIS among adolescents in Sweden according to CCT. Our observations provide support for its acceptability as well as its psychometric properties in this population, as indicated by the few missing responses to items, support for unidimensionality, minimal floor/ceiling effects, good reliability, and expected correlations with other variables. Some students raised questions regarding the item on physical functioning, but when they were asked to re-read it, they had no problems understanding it, and responses to the item were omitted in only 1.7% of cases.
The psychometric results are in general agreement with those previously reported by Bringsén et al. [2], who applied the SHIS in an adult population. For example, the alpha coefficient among adults was 0.92 and the item-level test–retest reliability coefficients 0.44 to 0.67, whereas the corresponding values in adolescents were 0.93 and 0.52–0.79, respectively; additionally, the correlation between the SHIS and self-rated health scores was 0.56 among adults and 0.60 among adolescents. These observations suggest that the SHIS shows very similar properties in both groups.
Bringsén et al. [2] identified two SHIS dimensions, whereas we found strong evidence that the items represent a unidimensional latent construct. One interpretation of this discrepancy is that it represents a difference between adults and adolescents. Methodological issues may better explain this finding, as our approach differed from that of Bringsén et al. [2] in several respects. Specifically, Bringsén et al. [2] used PCA with orthogonal (varimax) rotation based on a matrix of Pearson correlations and used the eigenvalue > 1 rule to identify the number of dimensions, whereas we employed an EFA based on a polychoric correlation matrix and a parallel analysis to determine the number of dimensions. It is well established that the former approach tends to yield biased correlations, as well as to identify too many dimensions [21–24]. This can be avoided by using the approaches applied in this study, which account for the ordinal nature of item-level data and which do not attempt to account for the total variance (including error variance) in the data [13,15]. While our observations must be confirmed in adults, we also suggest that the SHIS should be used and interpreted as a unidimensional questionnaire.
Our assessment of the dimensionality of the SHIS has clear methodological advantages; however, our approach using CCT did not allow for the assessment of rating scale properties, including the empirical functioning of response categories and differential item functioning (DIF). Modern test theory measurement constructs, preferably the Rasch measurement theory, must be addressed [25]. For instance, when using the Rasch measurement theory, Hagquist and Andrich [26] found that the SOC instrument was largely applicable among adolescents; however, it was evident that the empirical functioning of its response categories did not coincide with the expectations on two items. Furthermore, there was evidence of DIF between boys and girls for three items, suggesting that these items may not have the same meaning across genders. Future studies of the SHIS should address these issues, as well as potential DIF between adolescents and adults, to determine whether the instrument works equivalently across age and gender groups.
Limitations
The study was conducted among 13- to 15-year-old students in Sweden. The results of this study may not be generalizable to other age groups or different cultural contexts. One advantage of the questionnaire is its short format, as this makes it user-friendly, especially in an adolescent population; however, this could also be a drawback. In short questionnaires, not all aspects of health can be covered, and important information could be lost [7]. In future research, the associations between the SHIS and lifestyle factors should be investigated, as one potential application of the instrument could be as the basis for discussions with adolescents on health and lifestyle (for example, in a school healthcare setting). There is a need for age-appropriate questionnaires, and, thus, the SHIS might be an option due to its adolescent-friendly characteristics. However, as discussed above, further psychometric studies are needed to achieve a more in-depth understanding of its properties and qualities as a measurement tool.
Conclusions
The SHIS instrument was well accepted in an adolescent population, and a psychometric test of the data showed satisfactory reliability and validity. Further research regarding its measurement properties in relation to lifestyle factors is needed.
Footnotes
Acknowledgements
We want to thank all of the participating students. We also want to thank the teachers and the school health staff who were involved in distributing the questionnaires.
Declaration of conflicting interests
None declared.
Funding
This work was supported by grants from the Swedish Association of Health Professionals, Brand och Livförsäkringsaktiebolaget Skånes Jubileumsfond, the Jerring Foundation, the Amalia and Marcus Wallenberg Foundation, the Gyllenstierna Krapperup Foundation, the Clas Groschinsky Foundation, Södra Sveriges Sjuksköterskehem SSSH, the Queen Silvia Jubilee Fund, the Swedish Society of Nursing, and the Crafoord Foundation.