
Abstract
Aims: The purposes of this research were to study the convergent validity of the Mode and Frequency of Commuting To and From School Questionnaire using objectively assessed steps and time spent in different physical activity intensities and to compare the self-reported versus objective journey time in Spanish youths. Methods: Three hundred and eighty-nine Spanish youth aged 7–19 years were asked to complete the questionnaire and wore an accelerometer for five days. The objective commuting distance and time from home to school were estimated using Google MapsTM. Results: There were significant differences between passive and walking participants on step numbers, sedentary time and physical activity levels (except for vigorous physical activity in children). For children, a mean difference of −4.03 minutes between objective measured and self-reported journey time was found (95% limits of agreement were 13.55 and −21.60 minutes). For adolescents, the mean difference was −1.39 minutes (95% limits of agreement were 15.23 and −18.02 minutes).
Introduction
Active commuting to school (mainly walking and cycling) has several health implications, including higher levels of physical activity [1,2] and cardiorespiratory fitness, especially when cycling [1]. Moreover, active commuting to school has shown a positive association with academic skills in both boys and girls [3].
Because of these multiple benefits, it is of interest to develop a valid tool to assess the behaviour of active commuting to and from school. Previous studies have reported a questionnaire as the most common method used to assess this behaviour [4]. However, a recent review examined questions used for assessing the mode and frequency of commuting to and from school, and it concluded that these questions tended to be heterogeneous, with only a low percentage (13%) of the studies reporting the reliability and validity of the questionnaire used [5]. This makes drawing comparisons between studies difficult. As a result, the previous review proposed a questionnaire that requires validation: the Mode and Frequency of Commuting To and From School Questionnaire.
Active commuting to school is a physical activity behaviour occurring daily in specific frame times before and after school. Accelerometry is a valid and feasible tool for measuring the amount and intensity of physical activity [6], and it is also the most used objective method for physical activity measurement. Moreover, accelerometry is appropriate to measure total movement in a given time frame, but it is a weak method to distinguish physical activity types [7]. Consequently, using accelerometers to validate a questionnaire on the mode and frequency of commuting might be appropriate and potentially informative. We found only two studies addressing this issue in adolescents [8,9]. They analysed the correlation between active commuting and objectively measured physical activity intensity levels when commuting to and from school and during leisure time, and no correlation was found [8], except for adolescent girls [9]. Other studies analysed this correlation in adults and older adults, and they found moderate to strong correlations between self-reported physical activity for travelling and objective measured physical activity levels [10,11]. However, we found no studies validating the mode of commuting using step numbers in youth or adults. Most of the studies focused on youth validated the questionnaire using parent reports, and they found positive results in children [12,13].
The time that students spend commuting to and from school is of interest because it is directly related to the distance from home to school, which has been shown as the first correlate of active commuting to school [14]. Self-reported questions might be the easiest and fastest method to assess the time of commuting, but inaccuracies on reporting this time may have an impact on the measure [15]. Objective methods for measuring the travel time used in the literature have been Global Position Systems (GPS), Geographical Information Systems (GIS) or Google MapsTM [16,17]. The cheapest and most feasible method is Google MapsTM [16]. Previous studies that have validated the time when commuting using objective measurements have focused only on driving [16,17]. However, validation of the self-reported time using an objective measurement when commuting on foot is lacking.
Thus, the aims of the present study were to study the convergent validity of the Mode and Frequency of Commuting To and From School Questionnaire using objectively measured steps and physical activity with accelerometry and to compare the objective versus self-reported journey time determined by Google MapsTM in children and adolescents.
Methods
Participants and study design
Participants belonged to a multi-centre longitudinal study named UP&DOWN [18]. A total of 600 Spanish young people aged 7–19 years (265 children aged 7–11 years and 335 adolescents aged 12–19 years) from seven primary schools in Cádiz (children) and six secondary schools in Madrid (adolescents) were included. All participants completed the Mode and Frequency of Commuting To and From School Questionnaire and wore an accelerometer during the same full school week (five days) between March 2012 and January 2013.
From the total sample size of 600 participants, 389 participants (192 children and 197 adolescents) were included in the current study. A total of 166 participants (73 children and 93 adolescents) were not included because they did not meet the inclusion criteria (i.e. to report usual mode of commuting and to report <100 minutes travelling to school), and 45 students belonging to the same school were not included because of difficulties setting the exit time correctly for each student. Furthermore, for the association analyses for each individual journey, 353 participants (177 children and 176 adolescents) from the 389 participants included in this study recorded a total of five days of physical activity with at least 60 minutes registered per day. Additionally, for the steps analyses for each individual journey, 245 participants (151 children and 94 adolescents) from 353 participants included in the association analyses wore GT3X or GT3X+ accelerometer models. Finally, to compare the objectively measured and self-reported journey time by Bland–Altman analyses, a total of 167 participants (71 children and 96 adolescents) from the 389 participants included in this study who reported walking to and from school in all journeys were included.
Ethical approval
This study followed the ethical standards recognised by the Declaration of Helsinki, and the study protocols were approved by the Ethics Committee of the Hospital Puerta de Hierro (Madrid, Spain; case number 269, 26/09/2011), the Bioethics Committee of the CSIC and the Ethics Committe for Research Involving Human Subjects at UCA (Cádiz, Spain; 13/10/2011). The study was explained to the participants before starting, and parents or tutors signed an informed consent.
Mode and Frequency of Commuting To and From School Questionnaire
The tool to assess the mode and frequency of commuting to and from school was a self-reported questionnaire suggested in the scientific literature [5]. We used the Spanish version of this questionnaire (Online Resource 1). Researchers implemented the questionnaire in the classroom, and participants completed it. There were four questions: (1) the usual mode of commuting to school, (2) the usual mode of commuting from school, (3) the weekly counts of school trips by mode of commuting to school and (4) the weekly counts of school trips by mode of commuting from school. Each question provided these answers: walk, cycle, car, motorcycle, bus or other (in this case, the mode was required). If a participant reported two or more modes of commuting to or from school, the time taken in each mode was required. If the time taken was not reported, the questionnaire of that participant was considered as uncompleted (27.7% of participants did not report the time).
The time from home to school and from school to home were reported for each participant in the questionnaire. They wrote the time (i.e. hours and minutes) when they left home and arrived at school in the morning, and the time when they left school and arrived home in the afternoon or evening. The duration of each journey was calculated in minutes.
Physical activity
The ActiGraph accelerometer models GT1M, GT3X and GT3X+ (ActiGraph, Pensacola, FL) were used to measure sedentary time, physical activity levels, and steps. Data were collected with the low-frequency extension filter disabled at a sampling frequency of 30 Hz and subsequently collapsed to two-second epochs. Participants wore them at the lower back attached to an elastic belt. Data from ActiGraph accelerometers were downloaded and processed using the ActiLife software v6.5.3 (ActiGraph).
Non-wear periods were identified by applying the algorithm developed by Troiano et al. [19] to the vector magnitude (i.e. strings of 0 counts per minute during a minimum of 60 minutes with an allowance of two minutes, with 0–100 counts per minute classified as non-wear periods, and excluded from the analyses). To be included in the analyses, a registration of a minimum of 60 minutes for each school day (a total of five) was required. From the full-day data, only recordings of accelerometry during the time of the commuting to and from school were studied (i.e. 30 minutes before the school starting time and 30 minutes after the school exit time regarding each school timetable).
Sedentary time and physical activity levels, during the time of commuting to and from school, were set as the time (minutes/journey) engaged in sedentary, light, moderate, vigorous, and moderate-to-vigorous intensity physical activity based upon standardised cut-offs of 0–100, 101–2292, 2293-4008, ≥4009, and ≥2293 counts per minute, respectively [20]. Total step counts during the time of the commuting to and from school were also registered.
Objectively measured distance and time from home to school
The objective measure of the commuting distance from home to school for each participant was estimated using Google MapsTM software (last updated 1 March 2014). Distances were calculated selecting the shortest walking route from the family postal address to the school postal address from each participant. The objective time needed for the journey was reported by Google MapsTM based on the time needed for each participant to cover the shortest walking route from home to school.
Inclusion criteria
Participants who walked or used passive modes of commuting as their usual mode of commuting were included. Participants who cycle to school were not included due to the inaccuracy of accelerometers to measure the physical activity when cycling [21]. Additionally, those participants who reported a mean of ≤100 minutes travelling to school were included, and those who recorded five days of objective physical activity with a minimum of 70 minutes registration per day were included. Only participants who wore GT3X and GT3X+ accelerometer models provided data on step counts and were included in the analysis. Finally, only participants who reported walking as the only mode of commuting to and from school during the whole week were included in the comparison of self-reported versus objective journey times.
Statistical analyses
A binary variable was obtained from the questions about usual mode of commuting to and from school, which was only used for descriptive data. The use of car, motorcycle or bus was categorised as passive, and walking was categorised as walk. Those who were passive on both ways to and from school were categorised as passive participants; those who walked on at least one way (to or from school) were categorised as walk participants. A similar binary variable was obtained from the questions about every single journey in the week to and from school, which was used for the validation analyses. The use of car, motorcycle or bus was categorised as passive, and walking was categorised as walk. Active travels per week were calculated by summing the number of walking travels on the way to and from school in the overall week (0–10 travels). Moreover, for descriptive analyses, means of each physical activity variable were created. Finally, since the steps and the physical activity intensity variables of light, moderate, vigorous and moderate to vigorous were not displayed normal distributions, log base 10-transformations were performed, and these variables with normal distributions were used in the analyses.
Descriptive data are presented as mean±standard deviation in quantitative variables and percentage in qualitative variables. One-way analysis of variance for normal quantitative variables (i.e. years and physical activity), Mann–Whitney U-test for non-normal quantitative variables (i.e. active travel per week, objective distance, and time to school and self-reported time to school) and chi-square test for qualitative variables (i.e. sex and mode of commuting to and from school) were performed to analyse the differences between passive and walk participants on their way to and from school. Associations between the steps, sedentary time and physical activity levels (i.e. light and moderate to vigorous) with mode of commuting (i.e. passive and walk participants) were studied using one-way analysis of covariance (ANCOVA) controlling by distance from home to school for each journey (i.e. going to school and returning from school every week day from Monday to Friday). Previously, interactions between sex and age were studied in these analyses. In children, there were no interactions, and the sample of children was studied without controlling by age. In adolescents, there were interactions by age, and consequently age was included as a confounder. The agreement of the objective time and self-reported time from home to school scores was plotted using Bland–Altman analyses [22], with the difference between the two measurements plotted against the mean of the two measurements. Limits of agreement were calculated as the mean difference±1.96 standard deviations. One-sample Student t-tests were conducted for the mean of differences between objective and self-report time for both children and adolescents.
All calculations were performed using PASW Statistics for Windows v18.0 (SPSS, Inc., Chicago, IL). For all analyses, statistical significance was set at p<0.05.
Results
Descriptive data
Descriptive data (Table I) displayed differences between passive and walk participants for all travel to and from school variables (p<0.001) for both children and adolescents. Furthermore, steps, sedentary time, and physical activity levels (i.e. light, moderate, and moderate to vigorous) showed differences between passive and walk participants for both children and adolescents (p<0.001, except light: p<0.05 in both children and adolescents; and moderate to vigorous physical activity: p=0.006 in children). Additionally, in adolescents, differences between passive and walk participants were shown in vigorous physical activity (p<0.001).
Demographics, travel to and from school variables, and physical activity variables for the whole sample and for usual passive and usual walk participants to and from school, displayed separately by children and adolescents.
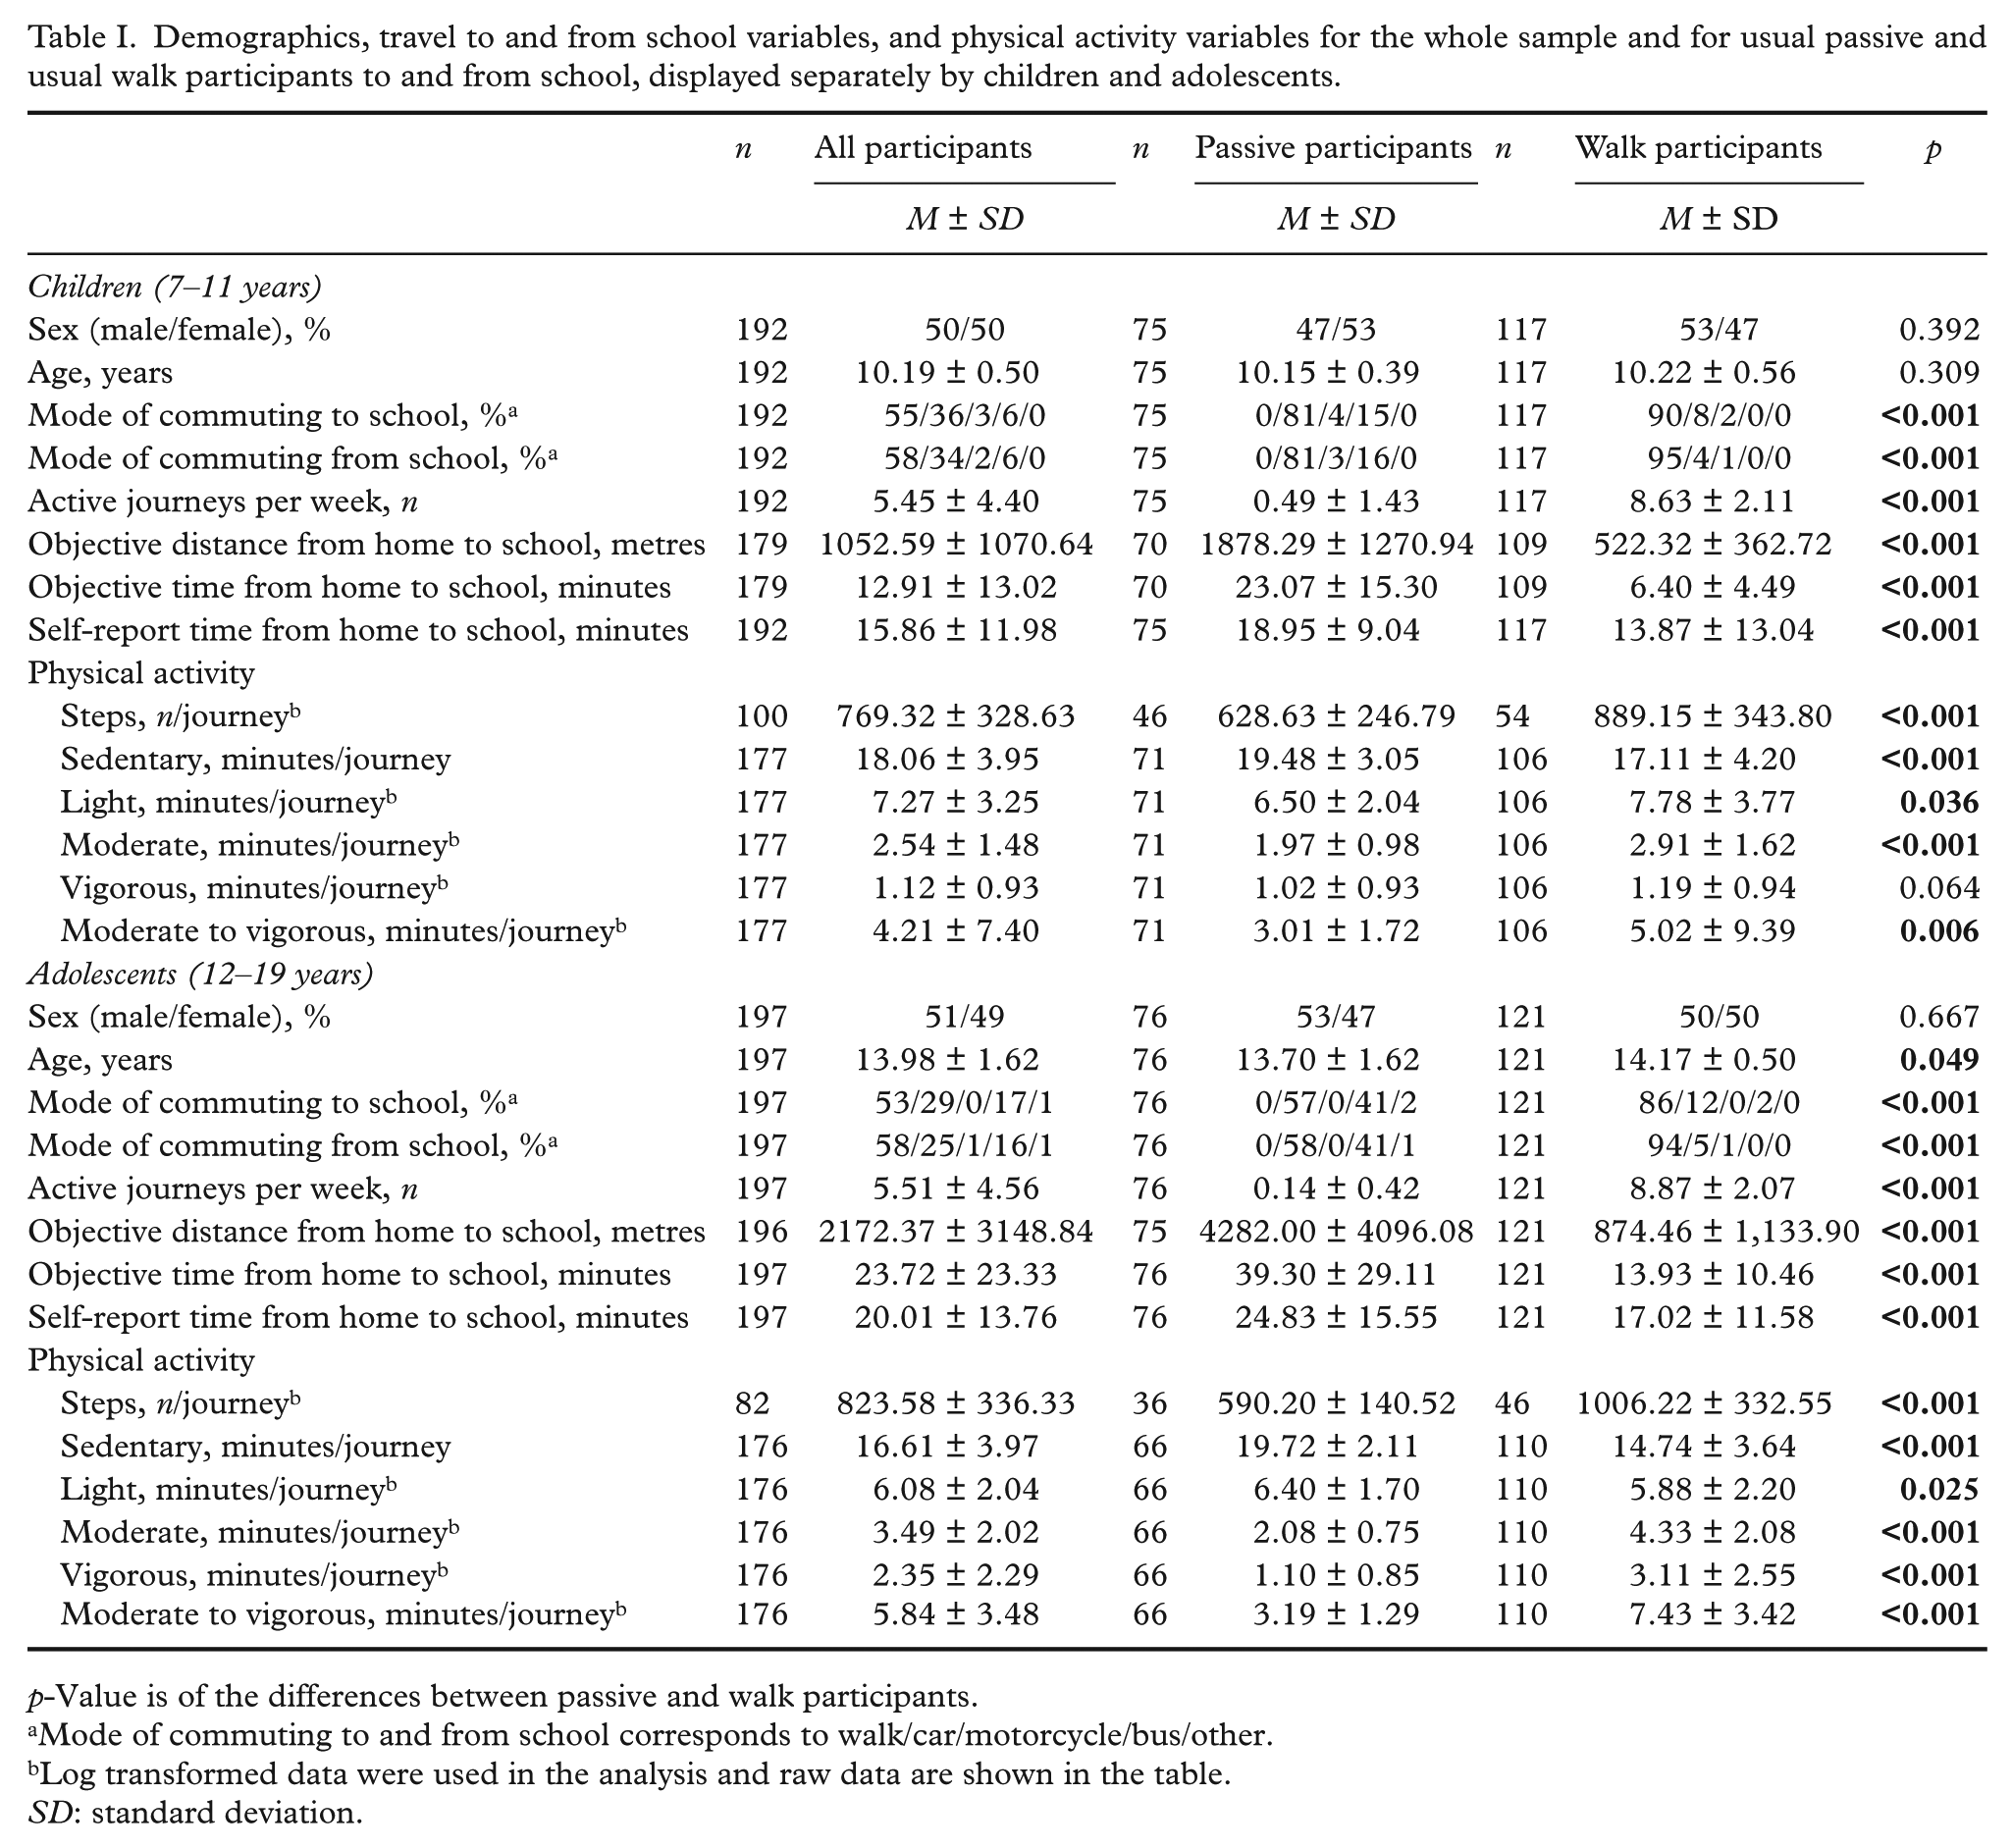
p-Value is of the differences between passive and walk participants.
Mode of commuting to and from school corresponds to walk/car/motorcycle/bus/other.
Log transformed data were used in the analysis and raw data are shown in the table.
SD: standard deviation.
Questionnaire convergent validation
ANCOVA disclosed some different results for children and adolescents (Figure 1). Differences in children between passive and walk participants were shown in steps and sedentary time for each journey, except for Monday and Tuesday back from school (p<0.001, except Tuesday and Thursday go to school: p<0.05), and in moderate-to-vigorous physical activity level for all week days going to school (p<0.05). No differences were found for light physical activity (p>0.05). In adolescents, differences between passive and walk participants were shown in steps for each journey (p<0.05, except for Tuesday back from school: p>0.05), in sedentary time and in physical activity levels (i.e. light and moderate to vigorous) for each journey (p<0.001, except for light physical activity on Monday, Tuesday, Thursday, and Friday go to school: p<0.05).
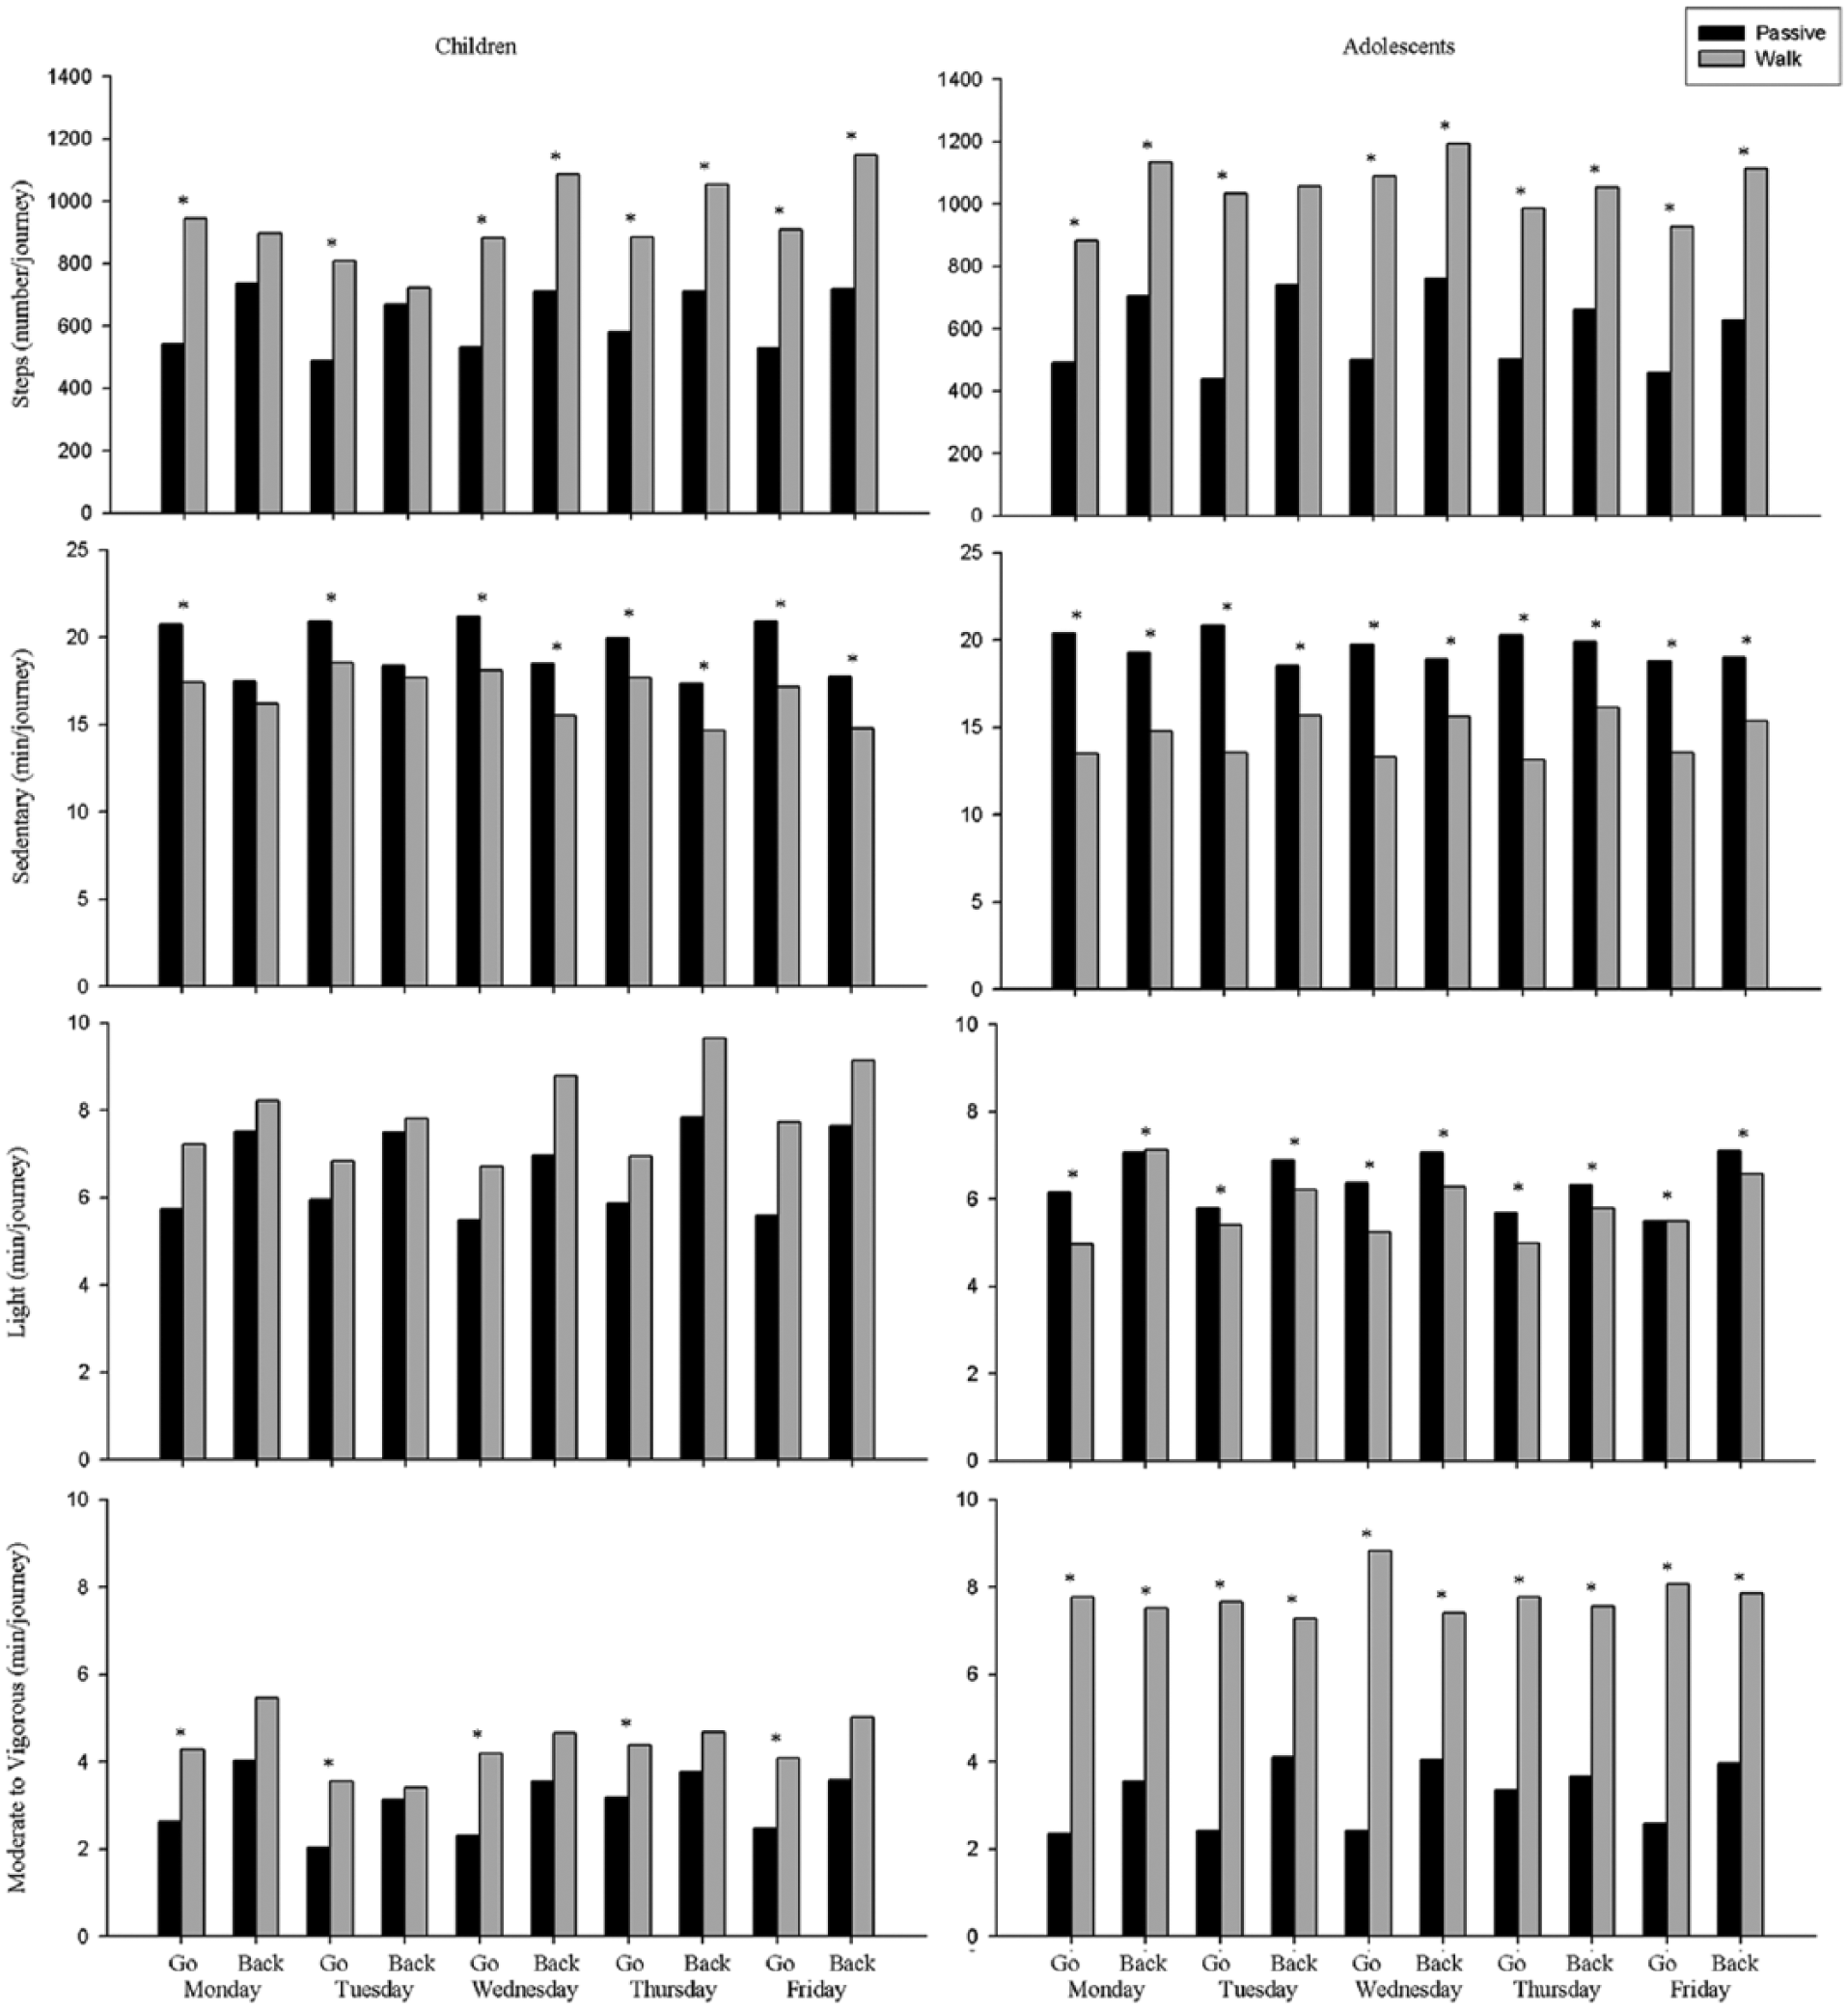
Step number, sedentary time and physical activity levels in passive and walk children (7–11 years) and adolescents (12–19 years) on their journey to and from school, controlled by distance in children and age and distance in adolescents.
Objective versus self-reported time
The inter-method agreement between the objective time and self-reported time from home to school is displayed in Figure 2. Children perceived a mean of 4.03 minutes for commuting more than the objectively measured time (95% limits of agreement [random error] were 13.55 and −21.60). Adolescents perceived 1.39 minutes for commuting more than the objectively measured time (95% limits of agreement [random error] were 15.23 and −18.02). One-sample Student’s t-tests showed significant differences in children (p<0.001) but not in adolescents (p>0.05).
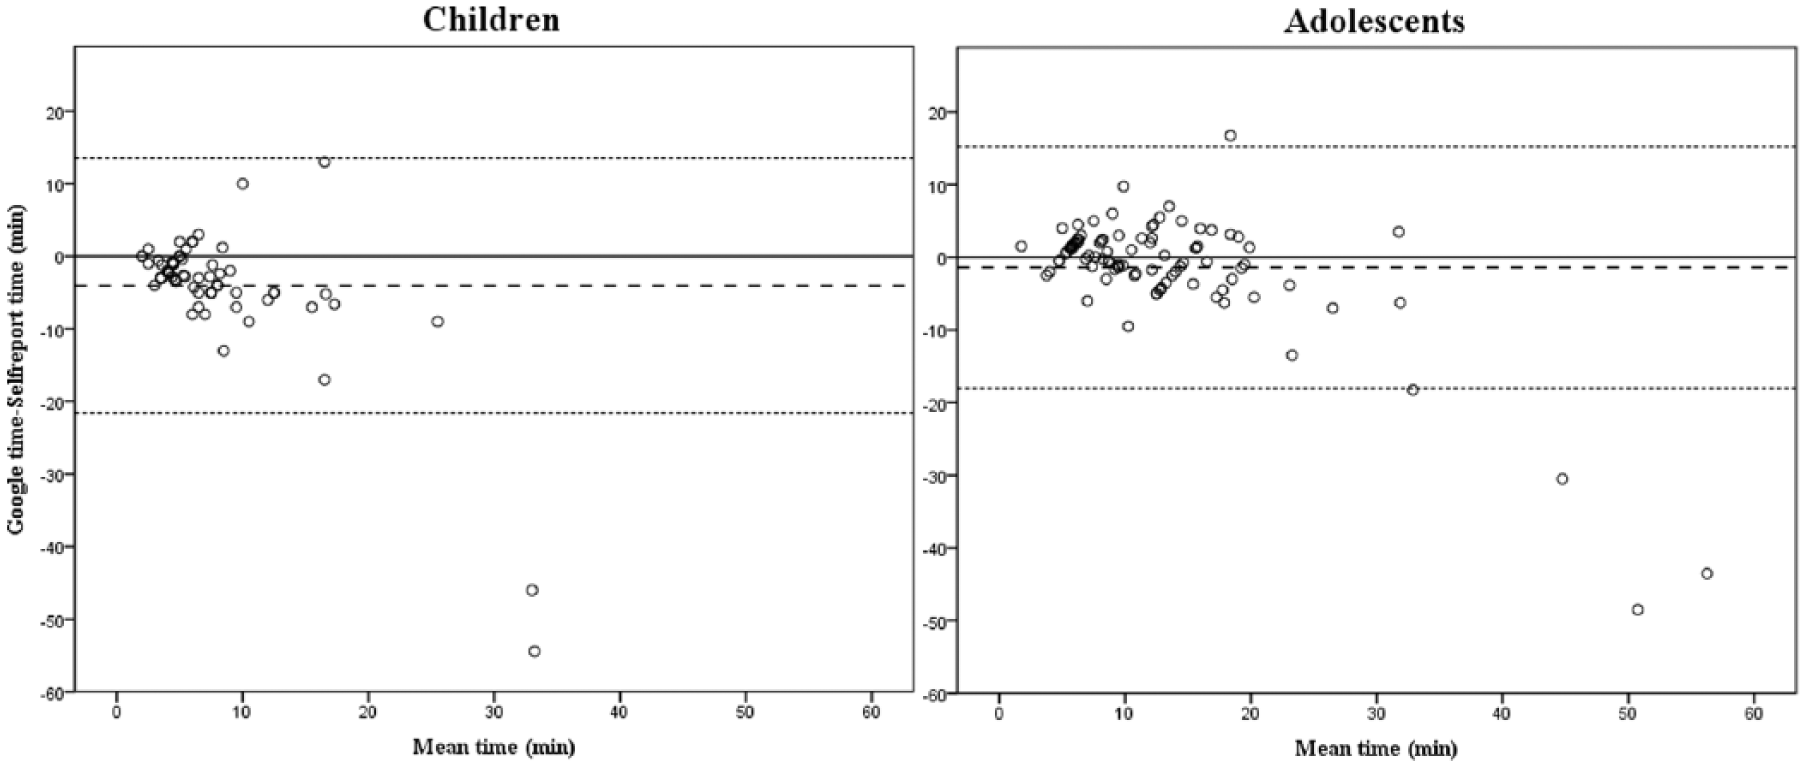
Bland–Altman plot of the objective time and self-report time from home to school for children (7–11 years) and adolescents (12–19 years). The central dotted line represents the mean of differences between the objective time measure and the self-report time measure; the upper and lower dotted lines represent the upper and lower 95% limits of agreement (mean differences+1.96 standard deviations of the differences), respectively. Solid lines indicate a value of zero.
Discussion
The Mode and Frequency of Commuting To and From School Questionnaire has shown convergent validity among children and adolescents. The self-reported mode of commuting was positively associated with objectively measured physical activity in both children and adolescents. Moreover, the comparison of the self-reported time of the journeys compared to objectively measured time using Google MapsTM software was as accurate in adolescents as in children.
Questionnaire convergent validation
Our results suggest that the Mode and Frequency of Commuting To and From School Questionnaire showed convergent validity. The self-reported mode of walking was associated with a higher step number, less sedentary time, and higher physical activity level in both children and adolescents. Walking participants achieved an average of steps in each journey of 8% in children and 9% in adolescents from the 11,500 daily steps recommended for both children and adolescents in the scientific literature [23]. Consequently, young people who walk to and from school might do a fifth of the daily recommended steps. Furthermore, walking participants spent more time in moderate and moderate-to-vigorous physical activity intensity levels than those who used passive modes of commuting. Non-differences on vigorous physical activity might be due to the filtering process of ActiGraph (proprietary information) which lead to activity counts at high intensities to be underestimated [24]. Consequently, we might confirm that self-reporting the active commuting behaviour in this questionnaire showed convergent validity, since it is highly associated with the physical activity measured using an objective tool. Similar questionnaires assessing the mode of commuting behaviour have been validated previously. However, these validation studies in children used questionnaires self-reported by parents as a gold standard measurement [12,13]. Additionally we found only one study which analysed the correlation between self-reported active commuting and objectively measured physical activity when commuting to and from school and during leisure time in adolescents [8], reporting a lack of association. This result was contradictory to the present study, and it might be due to different issues: the characteristics of accelerometer models (i.e. 7164 accelerometer against GT1M, GT3X and GT3X+ accelerometers in the present study), the sample sizes and ages (i.e. 33 adolescents against 389 children and adolescents) and different considerations of active commuting (i.e. walk and cycling, the latter of which is not directly comparable with accelerometry).
Self-reported versus objective time
The comparison between the self-reported and objective time while walking from home to school was quite similar for adolescents but different in children in the current study. Both age groups tended to overestimate the time of commuting to school, although this overestimation was higher in children. Children reported a mean close to four minutes while adolescents reported a mean of 1.5 minutes. Additionally, a Student’s t-test confirmed that there were significant differences in children but not in adolescents. Two explanations for this result might be that children take more time to cover the same distance as adolescents and/or that children estimate times with less accuracy than adolescents. Both explanations are related to the lower age and development of children compared to adolescents. This inaccuracy of reporting the time taken from home to school in children could have an impact on the measurement, as a previous study suggested [25]. However, this inaccuracy does not seem to exist among adolescents [26]. Moreover, these results are supported by the 95% limits of agreement, which are quite similar in children and adolescents (35.15 and 33.24 minutes of difference between the upper and lower limit of agreement for children and adolescents, respectively). Consequently, the self-reported measurement for the time of commuting seems to be comparable with Google MapsTM measurement in adolescents but not in children.
Strengths and limitations
To the best of our knowledge, this is the first study to have examined the convergent validity of a questionnaire about commuting behaviour using objectively measured physical activity and objective time from home to school. Furthermore, to study the convergent validity in both children and adolescents is another strength. The main limitation is that 30 minutes before and after the starting and finishing time of the school was selected as the commuting time to obtain the accelerometer data, since >80% of participants reported less than this time. However, it might not be the real time of commuting for every participant, and other types of activities might be included within this period (e.g. taking breakfast, watching TV, playing outside, etc.). Furthermore, a limitation is the use of three types of accelerometers (i.e. GT1M, GT3X and GT3X+). However, they have been demonstrated to be comparable under laboratory or controlled conditions [27], but not in a free-living environment [28]. Additionally, the use of Google MapsTM to obtain the objective commuting time by walking between home and school may not fully correspond to the real commuting time, since children may not choose the shortest walking route suggested by Google MapsTM. However, a previous study estimated a similar distance between the use of GIS and GPS which use the real commuting route [29], and a second and more recent study reported a high correlation between Google MapsTM and GIS (i.e. using as a gold standard) [30]. Other limitations are the sample reduction Altman analyses, where participants who did not report walking as the only mode of commuting for all the journeys were excluded in order to obtain more accurate measurements, and using different types of accelerometers to assess physical activity.
Conclusions
This study covers a current gap in the literature: the need for a valid tool to assess commuting to and from school behaviour in youths. The findings of the present study indicate that the Mode and Frequency of Commuting To and From School Questionnaire shows convergent validity as a tool to assess this behaviour in Spanish children and adolescents. This questionnaire might help researchers to assess this daily behaviour with a valid measurement, allowing appropriate comparisons between studies. Moreover, the comparison between the objective and self-reported time taken from home to school was examined, which has not been extensively analysed. The self-reported time of walking from home to school is comparable with Google MapsTM in adolescents but not in children. Cultural characteristics of the sample do not allow the questionnaire to be validated for cycling as mode of commuting. The study will need to be replicated in a different context in which the use of the bicycle for active commuting to and from school is more usual. Future studies might wish to study the convergent validity of the Mode and Frequency of Commuting To and From School Questionnaire translated to other languages and using other technologies as GPS to cover all the active modes of commuting.
Footnotes
Acknowledgements
We acknowledge the effort and collaboration of the primary and secondary schools and their participants. This study will be part of a PhD thesis of the Biomedicine Program of the University of Granada.
The Up&Down Study Group:
Coordinator: Ascensión Marcos. Principal Investigators: Ascensión Marcos, Oscar L. Veiga, José Castro-Piñero and Fernando Bandrés. Scientific Coordinators: David Martínez-Gómez (chair), Jonatan R. Ruiz (co-chair), Ana Carbonell-Baeza, Sonia Gomez-Martinez and Catalina Santiago. Spanish National Research Council: Ascensión Marcos, Sonia Gómez-Martínez, Esther Nova, Esperanza L. Díaz, Belén Zapatera, Ana M. Veses, Jorge R. Mujico and Alina Gheorghe. Autonomous University of Madrid: Oscar L. Veiga, H. Ariel Villagra, Juan del-Campo, Carlos Cordente (UPM), Mario Díaz, Carlos M. Tejero, Aitor Acha, Jose M. Moya, Alberto Sanz, David Martínez-Gómez, Verónica Cabanas-Sánchez, Gabriel Rodríguez-Romo (UPM), Rocío Izquierdo-Gómez, Laura Garcia-Cervantes and Irene Esteban-Cornejo. University of Cádiz: José Castro-Piñero, Jesús Mora-Vicente, José L. González Montesinos, Julio Conde-Caveda, Francisco B. Ortega(UGR), Jonatan R. Ruiz (UGR), Carmen Padilla Moledo, Ana Carbonell Baeza, Palma Chillón (UGR), Jorge del Rosario Fernández, Ana González Galo, Gonzalo Bellvís Guerra, Álvaro Delgado Alfonso, Fernando Parrilla, Roque Gómez and Juan Gavala. Complutense University of Madrid: Fernando Bandrés, Alejandro Lucia (UEM), Catalina Santiago (UEM) and Félix Gómez-Gallego (UEM).
Declaration of conflicting interests
The authors declare that there is no conflict of interest.
Funding
This work was supported by the National Plan for Research: Development and Innovation (R+D+i) MICINN under Grant (DEP 2010-21662-C04-00 [DEP 2010-21662-C04-01: DEP 2010-21662-C04-02: DEP 2010-21662-C04-03: DEP 2010-21662-C04-04] and DEP2016-75598-R) and by the Spanish Ministry of Education under Grant (FPU13/01088). This study takes place thanks to the additional funding from the University of Granada, Plan Propio de Investigación 2016, Excellence actions: Units of Excellence; Unit of Excellence on Exercise and Health (UCEES).