
Abstract
Aims: We aimed to investigate (a) the association between body mass index (BMI) and self-rated health (SRH) and (b) BMI’s predicted value for SRH within a representative population in the Skaraborg Project. Methods: This was a longitudinal observational study. A random population of 2816 individuals were included in the study between 2002 and 2005, and a representative sample of these individuals were invited consecutively for a follow-up visit between 2012 and 2014. At follow-up, data from 1327 participants were collected concerning anthropometric variables, blood samples and validated questionnaires regarding lifestyle factors. Results: A significant inverse association was observed between BMI and SRH both at baseline and at follow-up, with all p-values for trend being ⩽0.001 in both men and women. This association was observed even after adjusting for confounders such as co-morbidity, age, sex, education, marital status and lifestyle factors. In addition, the longitudinal analyses showed that BMI at baseline was inversely associated with SRH at follow-up in both sexes (odds ratio (OR)=1.1, confidence interval (CI) 1.02–1.16, p=0.017 in men; and OR=1.1, CI 1.04–1.14, p=0.001 in women). These findings remained in participants whose weight increased (p=0.022) or was stable (p=0.004), while it was not seen in individuals who lost weight over the years (p=0.340).
Introduction
Obesity is an epidemic public-health issue. It is a major risk factor for cardiovascular diseases (CVD), hypertension, type 2 diabetes and cancer [1–3]. The World Health Organization (WHO) estimates obesity to be one of the greatest threats to public health in our times [1,4,5]. Body mass index (BMI) is a simple, well-known and frequently used calculation to define overweight and obesity. According to European criteria, overweight is considered to be a BMI ⩾25 kg/m2 and obesity a BMI ⩾30 kg/m2 [1]. However, BMI does not consider abdominal obesity, known to be a serious risk-factor for CVD. Previous studies have found associations between weight loss and health-related quality of life, with improved self-esteem and fewer depressive symptoms [6]. Related results have been reported between weight gain and decreased well-being [7]. The psychological effects of obesity have a considerable impact on quality of life. Not only is obesity associated with low self-esteem, anxiety and depression, but it also decreases life expectancy and has economic and social consequences both for the individual and for society [8–10]. Thus, it is of great importance to find strategies to prevent and treat obesity [1,2].
Self-rated health (SRH) is an easily obtained subjective measure of general health that has been found to be a valid predictor of future health, morbidity and mortality [5,9,11,12]. As a consequence, it is very important to investigate factors that influence SRH, with obesity being one of these factors [13].
Aims
In this study, we aimed to investigate (a) the association between BMI and SRH, and (b) BMI’s predicted value for SRH within a representative population in the Skaraborg Project.
Methods
Study population
This was a longitudinal observational population-based study with a 10-year time span (9.7 years) – the Vara Skövde Cohort population survey within the Skaraborg Project. Baseline data were collected between 2002 and 2005, with a follow-up study in 2012–2014. At baseline, the study included 2816 randomly chosen participants aged between 30 and 75 years, with an oversampling (2/3) of individuals younger than 50 years. The participants were all residents in the municipalities of Vara and Skövde in south-western Sweden. The participation rate at baseline was 81% in Vara and 70% in Skövde. A representative sample of the 2816 participants were invited for a follow-up visit, and information from 1327 individuals was collected following the same protocol as at baseline (70% participation rate). Drop-out analyses did not find any differences between the participants and the drop-outs considering age and sex. However, nine women and three men who did not give information on SRH were excluded from the analyses, leaving 1315 participants for final analyses (Figure 1).
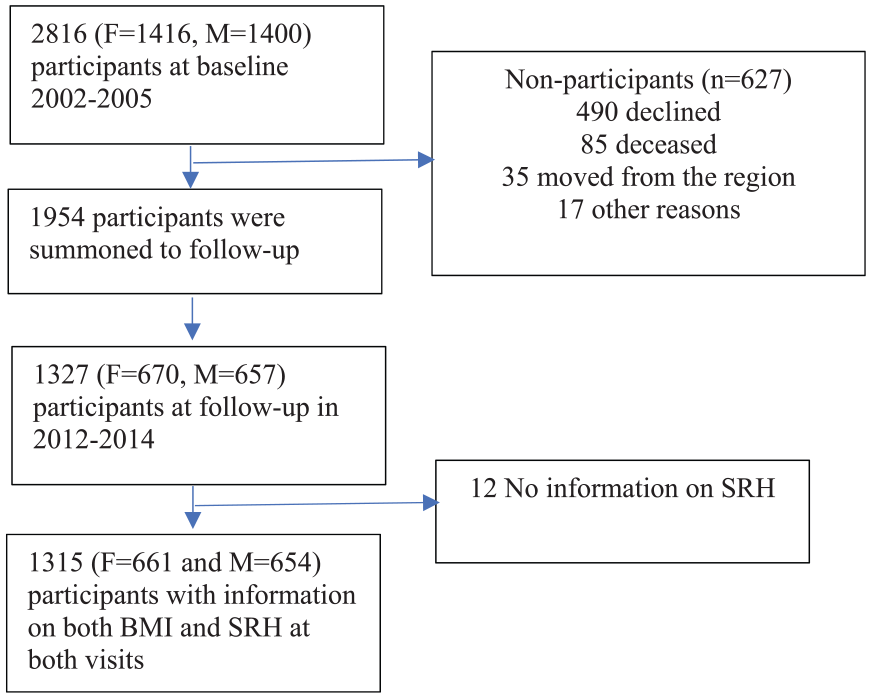
Flow-chart of the study.
Questionnaires
Both at baseline and at follow-up, information on medical history, socio-economic factors and lifestyle, including smoking habits, leisure-time physical activity (LTPA) and SRH, was obtained using validated questionnaires [14,15]. SRH was reported with a single questionnaire item: ‘How do you rate your current health status in general?’ The answers were structured according to a Likert scale of 1–5 where 1=very good, 2=good, 3=fair, 4=poor and 5=very poor [10,16]. SRH was dichotomised into two groups: high SRH (very good and good) and low SRH (fair, poor and very poor). Assessment of LTPA was based on four answers to the question ‘How much physical effort do you engage in during your leisure time per week?’: (a) inactive or mostly inactive (e.g. reading or watching television); (b) slightly active, at least four hours of activity (e.g. walking, cycling, gardening, including walks or cycling to or from work); (c) moderate (e.g. less strenuous exercise such as jogging, swimming or tennis at least two hours a week); (d) strenuous (e.g. intensive jogging, swimming or tennis several times a week) [14,15]. The level of physical activity was dichotomised into two levels: low level of LTPA (where 1=inactive or 2=slightly active) and high level of LTPA (where 3=moderately active or 4=performing strenuous LTPA). Co-morbidity was based on self-reported data using validated questionnaires regarding CVD such as myocardial infarction, heart failure, atrial fibrillation, angina pectoris, percutaneous coronary intervention/coronary artery bypass grafting, kidney failure, stroke, diabetes mellitus and sleep apnoea. Smoking was defined as 1=never smoker or past smoker or 2=current smoker.
Measurements
All measurements were done by two specially trained nurses [17]. A physical examination that included blood pressure, body weight and height in light clothes and no shoes was completed. BMI was categorised into subgroups according to WHO categories [1]: normal body weight <25 kg/m2, overweight 25–<30 kg/m2 (pre-obese), obese 30–<35 kg/m2 (Class I) and severely obese ⩾35 kg/m2 (Class II and Class III combined), respectively. Only five individuals (0.4%) were underweight (BMI <18.5 kg/m2) and were included in the group with BMI <25 kg/m2. Weight gain was defined as increased weight by more than 2 kg between baseline and follow-up. Weight stability was defined as not changing weight more than 2 kg over the follow-up time. Weight loss was defined as decreasing weight more than 2 kg after 10 years. Blood pressure was measured in a supine position. Hypertension was defined when systolic blood pressure was ⩾140 mm Hg and/or diastolic blood pressure was ⩾90 mmHg in three consecutive visits and/or the participant was taking ongoing blood pressure–lowering medication initiated by a physician. In general, the patient visited the study centre twice: first for lab tests and then for a physical examination. However, if the patient’s blood pressure was ⩾140/90 mm Hg, the patient was scheduled to come back for one or two new visits with the aim of diagnosing hypertension based on three consecutive measurements ⩾140/90 mm Hg.
Morning venous fasting blood samples were collected from all participants. Blood glucose was measured at fasting and after an oral glucose tolerance test (75g) that was completed only in subjects without known diabetes. The diagnosis of diabetes mellitus was based on WHO recommendations from 1999 [18].
Statistics
Statistics were computed using IBM SPSS Statistics for Windows v25 (IBM Corp., Armonk, NY). General linear models were used to investigate the association between BMI and SRH at baseline and at follow-up. For the longitudinal study of the association BMI at baseline and low SRH at follow-up, a logistic regression model was used. A logistic regression model was also used to analyse the association between SRH at baseline and the risk of developing obesity at follow-up. Separate analyses were computed for groups with weight gain, weight loss and weight stability. All data were adjusted for age, education level, smoking, sex, physical activity, diabetes mellitus and CVD (ischaemic heart disease, heart failure and stroke). The analyses were also stratified by individuals with and without co-morbidities defined as CVD, stroke, nephropathy, diabetes mellitus, hypertension and chronic pulmonary disease. Significance was considered if p<0.05, and the results are shown in terms of odds ratios (ORs) and 95% confidence intervals (CIs).
Ethics
All participants provided signed informed consent prior to enrolment, and the Regional Ethical Review Board in Gothenburg, Sweden, approved the study.
Results
The mean±SD follow-up time for the 1315 participants (661 female) was 9.7±1.4 years. During the follow-up time, SRH deteriorated by at least one step out of five in 23.6% of men and 22.6% of women, with no significant differences observed between men and women in SRH (p=0.631). After 10 years, 25% (n=334) of the participants lost weight, 31% (n=406) were weight-stable (±2 kg) and 44% (n=575) gained weight. Characteristics of the study population at baseline and at follow-up are presented in Table I. The percentage of individuals rating their health as low was significantly associated with high BMI categories both at baseline and at follow-up (Figure 2).
Characteristics of the study population.

BMI: body mass index (kg/m2); SRH: self-rated health (high=levels 1 and 2; low=level 3, 4 and 5); CVD: cardiovascular disease; SD: standard deviation.
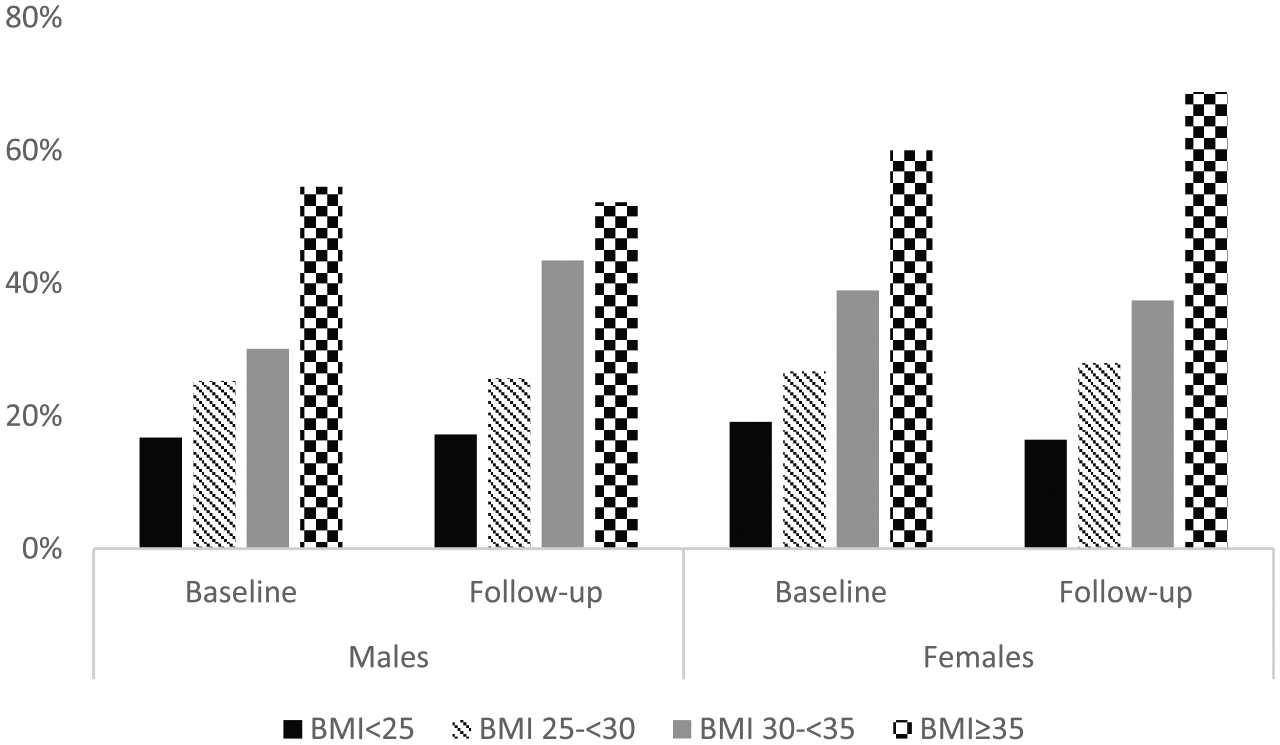
The proportion of low SRH in subjects with normal weight, overweight, obesity and severe obesity at baseline and at follow-up, in men and women, respectively. Normal weight: BMI <25 kg/m2, overweight: BMI 25–30 kg/m2; obesity: BMI ⩾30–<35 kg/m2; severe obesity BMI ⩾35 kg/m2.
At baseline, individuals with low SRH had significantly higher BMI than subjects with high SRH (Table II), and the differences persisted after adjustments for age, CVD, physical activity, marital status, education, hypertension, diabetes mellitus and smoking. Similar results were observed in the cross-sectional analyses at follow-up (Table II). The results were the same for both men and women concerning all variables.
Differences in mean BMI in individuals with high and low SRH at baseline and at follow-up.
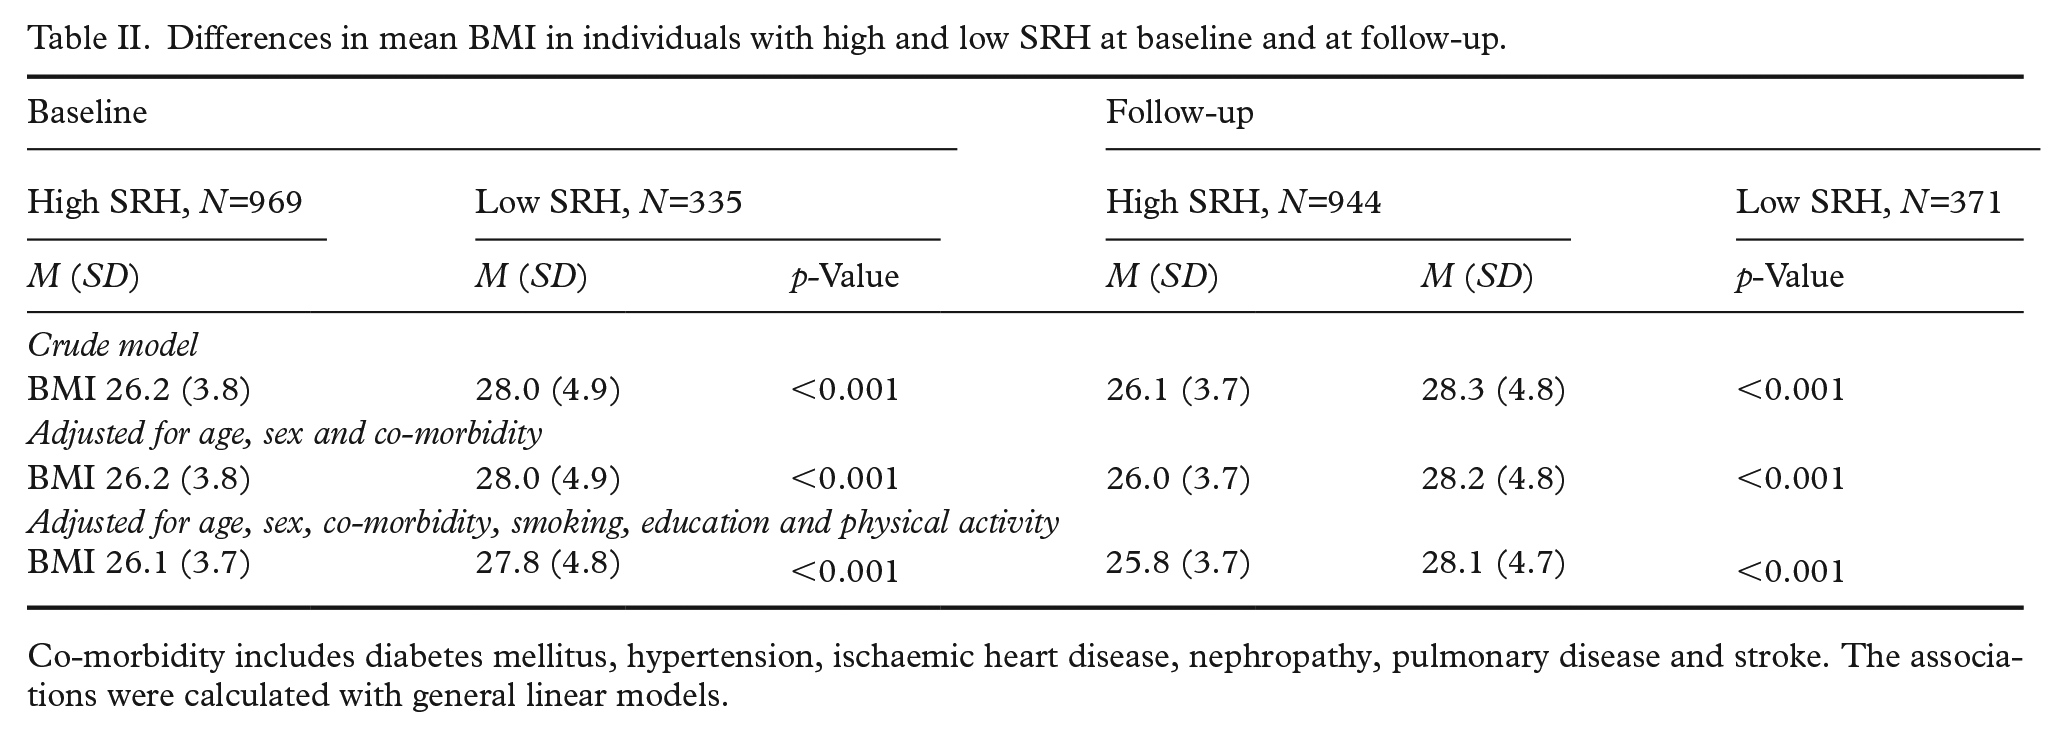
Co-morbidity includes diabetes mellitus, hypertension, ischaemic heart disease, nephropathy, pulmonary disease and stroke. The associations were calculated with general linear models.
High BMI at baseline also predicted low SRH at follow-up in both men and women, even when adjusted for co-morbidities, differences in weight between baseline and follow-up, SRH at baseline, physical activity, smoking, education and marital status, as shown in Table III. The population was also stratified by co-morbidity status at follow-up, and the higher the BMI was at baseline, the lower the SRH was after 10 years in both groups without co-morbidity (OR=1.1, 95% CI 1.03–1.14, p=0.004) or with one or more co-morbidities (OR=1.06, 95% CI 1.0–1.12, p=0.048). The most important factor for the prediction of low SRH at follow-up was low SRH at baseline in both men and women, independent of co-morbidities (OR=3.7, 95% CI 2.9–4.7, p<0.001).
Overweight at baseline as predictor for low SRH at follow-up.
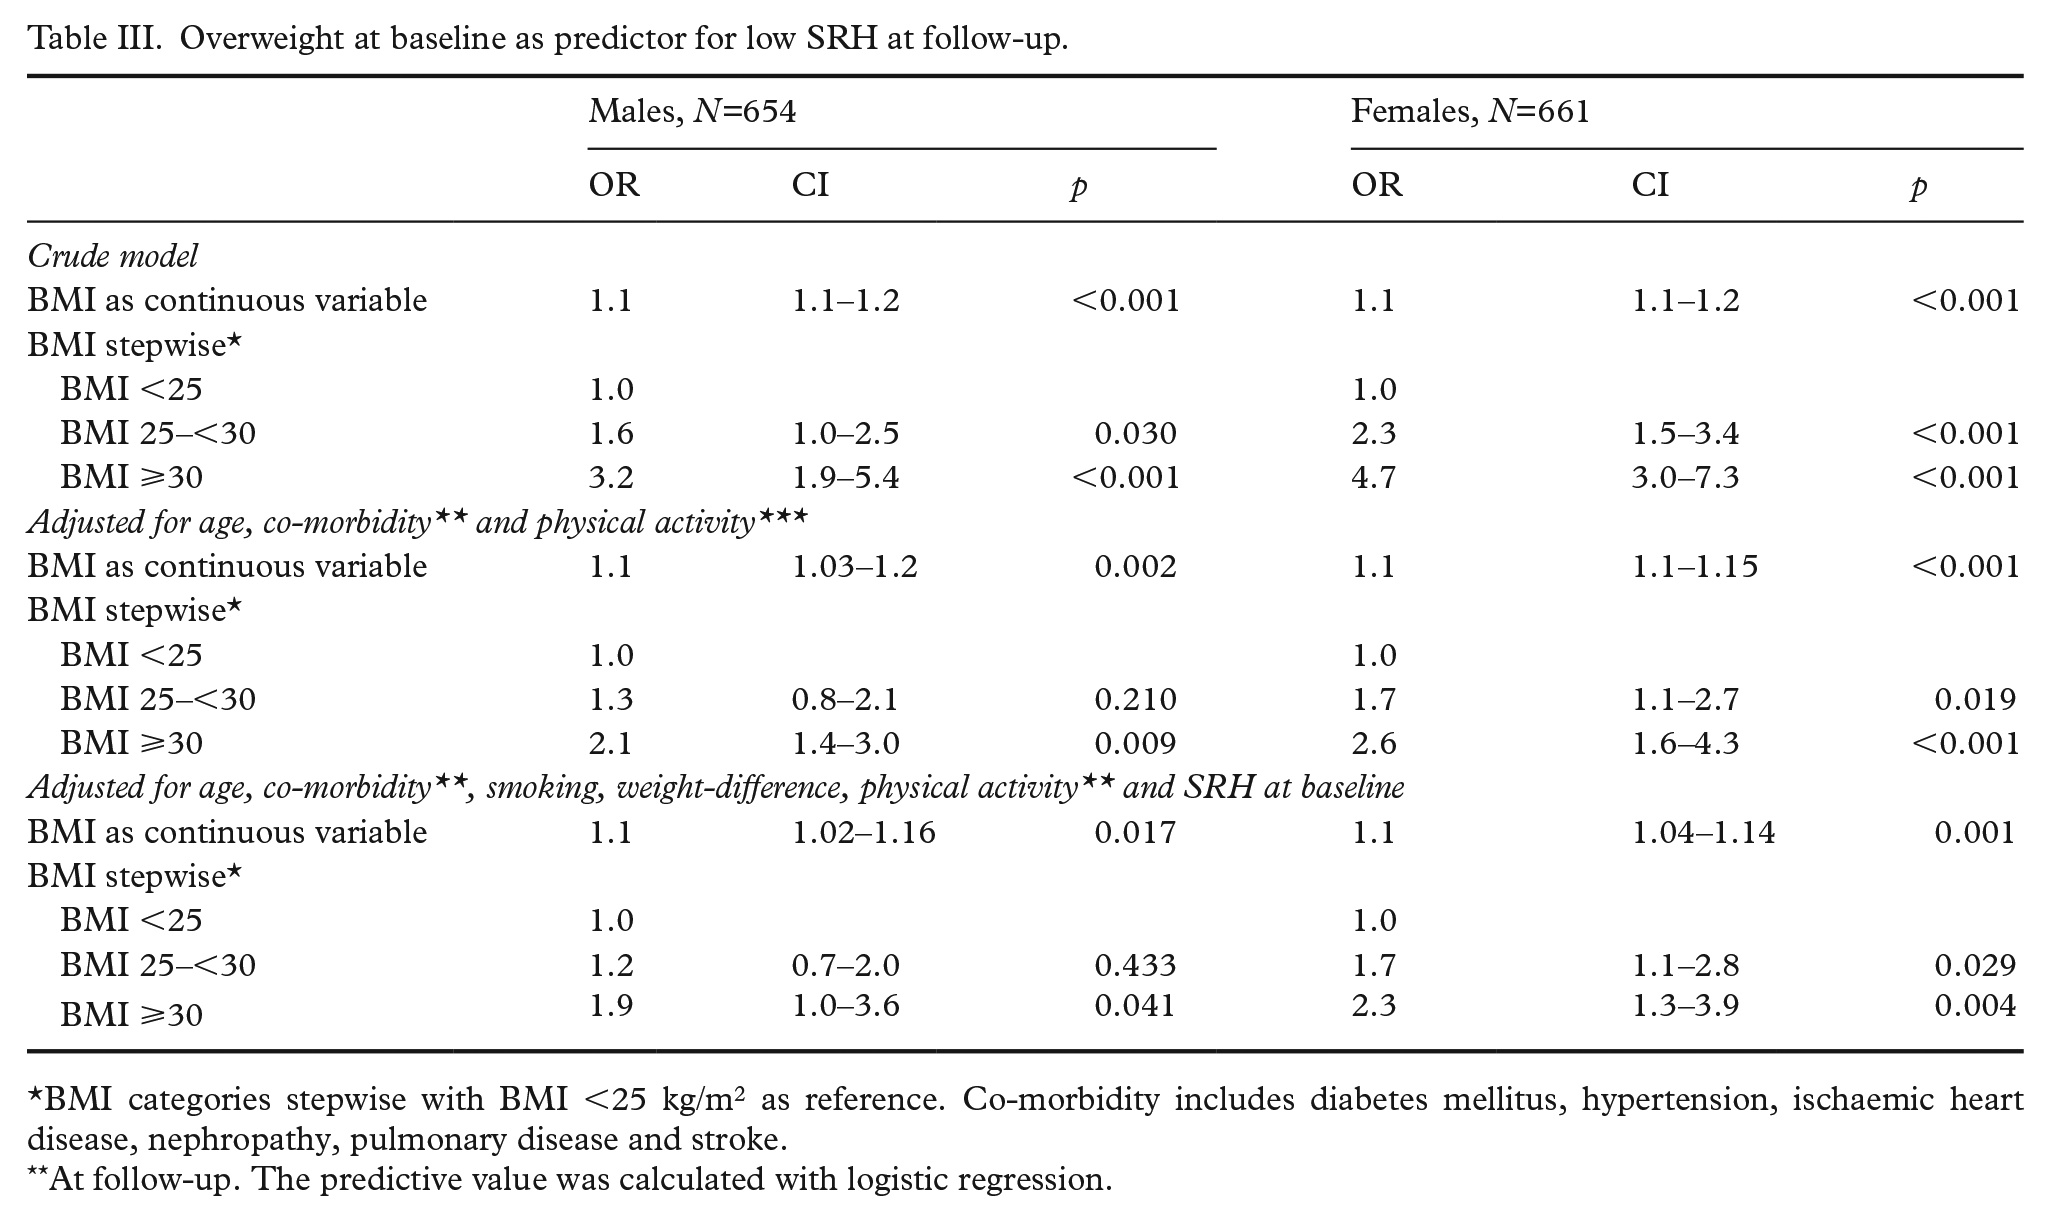
BMI categories stepwise with BMI <25 kg/m2 as reference. Co-morbidity includes diabetes mellitus, hypertension, ischaemic heart disease, nephropathy, pulmonary disease and stroke.
At follow-up. The predictive value was calculated with logistic regression.
When stratified into subgroups according to weight change over 10 years, a significant association was found between BMI at baseline and low SRH at follow-up in those who gained weight and those whose weight was stable (OR=1.1, 95% CI 1.01–1.13, p=0.022 and OR=1.1, 95% CI 1.04–1.2, p=0.004, respectively) when adjusted for age, sex, co-morbidity, smoking, physical activity, education level and SRH at baseline. However, in individuals who lost weight between baseline and follow-up, baseline BMI did not influence SRH at follow-up (OR=1.0, 95% CI 0.96–1.12, p=0.340), even though this group was more obese at baseline (28.2 kg/m2) than those whose weight was stable (25.8 kg/m2) and those who gained weight (26.4 kg/m2).
There was no significant association between SRH at baseline and developing obesity at follow-up either in the entire sample (OR=1.1, 95% CI 0.8–1.5, p=0.58) or in men and women when analysed separately (data not shown).
Discussion
This study in a representative Swedish population showed that overweight and obesity were associated with a low level of SRH, both at baseline and at follow-up, with similar associations shown at different ages in both sexes. Second, it showed that BMI was inversely related to SRH after 10 years independent of co-morbidities. Third, it showed that the ability of BMI to predict low SRH was limited and non-significant in those who lost weight, even in a population with high BMI at baseline, suggesting positive effects of weight loss on SRH.
The findings in this study indicate that not only obesity but also overweight seem to influence SRH, and this applies to both men and women. In contrast, some previous studies have found an association only between SRH and obesity [19,20], or that it varies with age and sex [8,21,22]. In fact, in a study by Imai et al., overweight in men was associated with better SRH [13]. Cultural differences in the study populations are likely to be the explanation for the differences in the impact of overweight [23]. While obesity is considered a sign of wealth in many developing countries, overweight and obesity are so frequent in the USA [24] and the Western world in general that they might be considered as a normal condition and not perceived as a health issue at all, whereas in Sweden, overweight may even be considered a sign of bad character. This might be the explanation for the differences between our study and the observations in the USA. In fact, contrary to some previous papers from the USA [13], we did not find any significant differences between men and women regarding the association between BMI and SRH. In a recent paper, Hastings reported consistent results concerning African American and Caribbean black women, with a significant association between obesity and low SRH [25].
Swedish men and women, irrespective of age, seemed to show the same impact of body weight on SRH, while data from the USA report that the impact of overweight on deterioration of SRH differed with both age and sex [13]. We even found that similar factors, such as physical activity and smoking, seemed to influence SRH in both men and women, while previous studies have indicated that only men showed associations between SRH and physical activity, education and smoking [26–28].
At follow-up, the mean age in both men and women was 59 years. The body composition changes with aging and the significance of BMI measuring the ‘fatness’ might be different in different age groups [29]. Normally, weight increases until the age of 60 years, after which weight stabilises or decreases. On the other hand, waist circumference increases year by year, most likely as a consequence of the loss of muscle mass and an increase in subcutaneous fat mass. BMI may also have another impact in a population with a high prevalence of chronic diseases, such as an elderly population. Obese and overweight women also tend to have greater health risks [8]. Altman et al. divided SRH into objective and subjective SRH, identifying objective SRH as health based on physical health and subjective SRH as health perceived without any known co-morbidities [30]. As expected, the researchers reported that co-morbidities were more decisive for SRH in an elderly population, whereas subjective components were more important in a younger population, such as the population in this study. BMI may thus have a greater impact in this population than in an elderly population with a higher prevalence of severe co-morbidities, which may explain the attenuation of the influence of BMI on SRH in the follow-up in the population with co-morbidities in this study. Moreover, there were no differences in the associations between BMI and SRH at baseline or at follow-up, suggesting that age per se had no modifying effect on the association between BMI and SRH in this population.
From a longitudinal perspective, a positive association between high BMI at baseline and low SRH at follow-up 10 years later was found among individuals who remained at a stable weight and among individuals who gained weight. This association was found in the subgroups both with and without co-morbidities. In the follow-up, the most important predictor for low SRH was SRH at baseline, which in turn was associated with BMI at baseline. Thus, BMI seem to be a decisive factor for SRH, not only cross-sectionally but also from a longitudinal perspective. Interestingly, there was no association between SRH at follow-up and BMI at baseline in individuals who lost weight over the years, in spite of being the heaviest subgroup at baseline. This is positive news, indicating that individuals who are severely overweight are not predetermined to experience their health as poor over the years to come if they lose weight. In this study, the participants who lost weight belonged to the subgroup with the highest BMI at baseline and still at follow-up had a mean BMI ⩾25 kg/m2. Thus, they did not even have to attain normal weight to eliminate the influence of BMI at baseline, as long as they lost weight.
This is the first prospective study with both men and women investigating the predictive value of BMI on low SRH, and even if it is difficult to predict SRH based on this data, the findings indicate that BMI is of importance in people’s lives, not only cross-sectionally but also from the longer perspective.
Strengths and limitations
A strength of this study is that it was designed as a longitudinal study, using the same protocol at baseline and at follow-up. The study also had a high participation rate at baseline and at follow-up (70%) [17]. Moreover, body weight and height were measured at the study centre, thus reducing possible bias due to self-reported weight and height.
BMI is a valid measurement to define body constitution, and due to its strong association with CVD risk, it is largely used in clinical work and research [5]. However, the limitations of BMI must be taken into consideration. The BMI calculation is based on body weight and height and does not account for body composition. There are other ways of measuring fat percentage, for example with a magnetic resonance scan, although this is an expensive and time-consuming method not suited for epidemiological studies. Visceral fat in particular is considered a great risk for future CVD. With this in mind, a misclassification of body composition is possible when BMI is used. However, the strengths of using BMI are that results can be compared to previous findings, are easy to understand and are widely used in clinical practice.
Another limitation of this study is that obesity is culturally dependent, as mentioned above, and is perceived differently in different cultural contexts. That means that the results are probably not generalisable throughout the world but are nevertheless likely to apply to a North European population. Further, although SRH has also been reported as a good indicator of mortality, other studies have questioned the validity of this indicator for international comparisons and among sub-populations due to the influence of cultural and social factors [29]. In addition, we have not stratified for different age groups. Overweight may have a different influence depending on age. However, it is difficult to stratify for particular age groups, as this is also an individual issue.
Another limitation might be that our study population was a rural population with a higher BMI than an urban population in Sweden. However, our results clearly show that low SRH is associated with overweight and not only with obesity, and thus our results should also be applicable to other populations in Sweden.
Conclusions
Overweight and obesity are associated with low SRH in both men and women in Sweden. Furthermore, from a longitudinal perspective, BMI is inversely associated with SRH, independent of co-morbidities, except among individuals who lose weight over the years. From a public-health perspective, this knowledge emphasises the importance of respect for people who are overweight or obese and with low SRH. Efficient help for these individuals, including both support for lifestyle changes and possible medication, is necessary.
Footnotes
Acknowledgements
First and foremost, we want to thank the participants in the Skaraborg Project for their participation in the study. We also thank the sponsors that sponsored our research: ALF grants from the University of Gothenburg, the Swedish Research Council, Research and Development Council in primary care in Gothenburg, the Skaraborg Institute, and the Research and Development Council in Region Västra Götaland that funded our research.
Declaration of conflicting interests
The authors declare that there is no conflict of interest.
Funding
The authors received no financial support for the research, authorship and/or publication of this article.