
Abstract
Objective:
Social inequality in mortality has increased in many countries worldwide and does not appear to be levelling off. Denmark is no exception, and the latest developments are presented in this short communication.
Methods:
Trends in life expectancy and changes in the shape of the age-at-death distribution are calculated from nationwide register data on income and education linked to mortality data.
Results:
Since 1987, the difference in life expectancy between the lowest and highest income quartiles has increased by 5.4 years for men and by 2.0 years for women. The difference in life expectancy (at age 30) between education groups has also increased. The latest developments indicate a decline in life expectancy for men and women in the lowest income quartile and with the shortest education.
Conclusions:
Background
Until the 1970s, life expectancy in Denmark was among the highest in the world – surpassed only by Sweden, Norway, Iceland and the Netherlands (http://data.un.org/). Today, Denmark occupies about 30th place, but part of the lost position in life expectancy seems to be gradually made up in recent years, probably partly due to a lesser impact of the COVID-19 pandemic-related mortality in the Danish population [1]. Life expectancy has increased more among people with long education and high income than among those with short education and low income. This has been recognized in several developed countries. Even in Norway a decrease in life expectancy from 2005 to 2015 has been observed among women in the lowest income quartile [2]. Not only is social inequality in life expectancy widening in the United States, but the overall life expectancy is also decreasing [3]. The examples of these trends in Norway and the United States are not unique [4,5].
In Denmark, social inequality in life expectancy has been observed for many years, regardless of whether education, income or occupation was used as a measure of socioeconomic position [6–8]. In particular, the gap between income quartiles has grown [9].
In addition to life expectancy as an indicator of mortality, it is also interesting to examine the distribution of age-at-death and how this distribution develops [10,11]. At the beginning of the 20th century, one in 10 Danish infants died during the first year of life. Now the infant mortality rate has fallen to 0.3% and today the mortality rate among children, adolescents and young adults is very low. In general, a shift is seen in the age of death, so that more and more people die only at an advanced age. One speaks of compression of mortality. This trend is seen in countries with rising or high living standards. The phenomenon applies when you look at the entire population, but not for all population groups [10]. For the well-off, a clear compression of mortality is seen, but this pattern does not apply to less privileged population groups [12]. Although we may all be living longer in general, the well-off and the less well-off do not gain extra years of life at the same rate.
The purpose of this short communication is to present an update of previous Danish results from studies on social inequality in mortality and life expectancy. The results are shown for men and women divided by social position defined by income or education.
Methods
The size of the Danish population increased from 5,124,800 in 1987 to 5,932,650 in 2023. In 2023, 3,852,340 were 30 years or older. For mortality trends, the population is divided into income quartiles from 1987 to 2023. For education, the period from 2004 is covered.
Statistics Denmark systematically collects data on income from the Danish Tax Agency. From these data equivalized disposable household income is defined using Eurostat’s definition and calculated as the total household income after deduction of taxes and social contributions divided by the number of ‘equivalent adults’, which reflects the size and age composition of the household by weighting all members of the household (https://ec.europa.eu/eurostat/statistics-explained/index.php/Glossary:Equivalised_disposable_income). Income-specific death rates were calculated using the unique identification code assigned to all Danes to link equivalent disposable household income and mortality data. Equivalized disposable household income was divided into quartiles. For each calendar year (from 1987 to 2023), gender and income quartile, period life tables were constructed and life expectancies and age-at-death distributions were derived.
Information on education from the Ministry of Education is also stored at Statistics Denmark and education-specific death rates were calculated by linking individual-level highest educational attainment and mortality data. However, information on education is missing for people born before 1922, so period life tables for calendar years before 2018 were constructed using a redistribution method for deaths and population data that adjusts for this lack of information [13]. For calendar years after 2018 adjustment is assumed irrelevant.
Data on education is primarily based on information from administrative registers that are created and used at Danish educational institutions. In addition, Statistics Denmark has carried out a number of questionnaire surveys on the education brought by immigrants. These questionnaire surveys have been targeted at people where there are no other sources to determine the level of education. For the entire population (15–69 years) in 2017, 7.4% of the information on the highest completed education came from the questionnaire surveys on the education brought by the immigrants.
It is assumed that most people have finished their education at age 30 years and level of education (highest completed) was classified into three categories according to the international standard classification of education (ISCED): short – primary and lower secondary education (ISCED 1–2); medium – upper secondary education (ISCED 3–4); long – tertiary education (ISCED 5–8).
For each gender, period life tables for two-year calendar years (from 2004–2005 to 2022–2023) were constructed and life expectancies calculated.
Results
Inequalities between income quartiles
Figure 1 shows changes in life expectancy divided by income quartile during the period 1987–2023. In 1987, life expectancy at birth differed by 5.5 years between the lowest and highest income quartiles and by 10.9 years in 2023 for men. For women, the gap between the lowest and highest income quartiles grew from 5.3 years to 7.3 years (Figure 1). At the end of the period, life expectancy for the lowest income quartile appears to stagnate for men and decline for women.
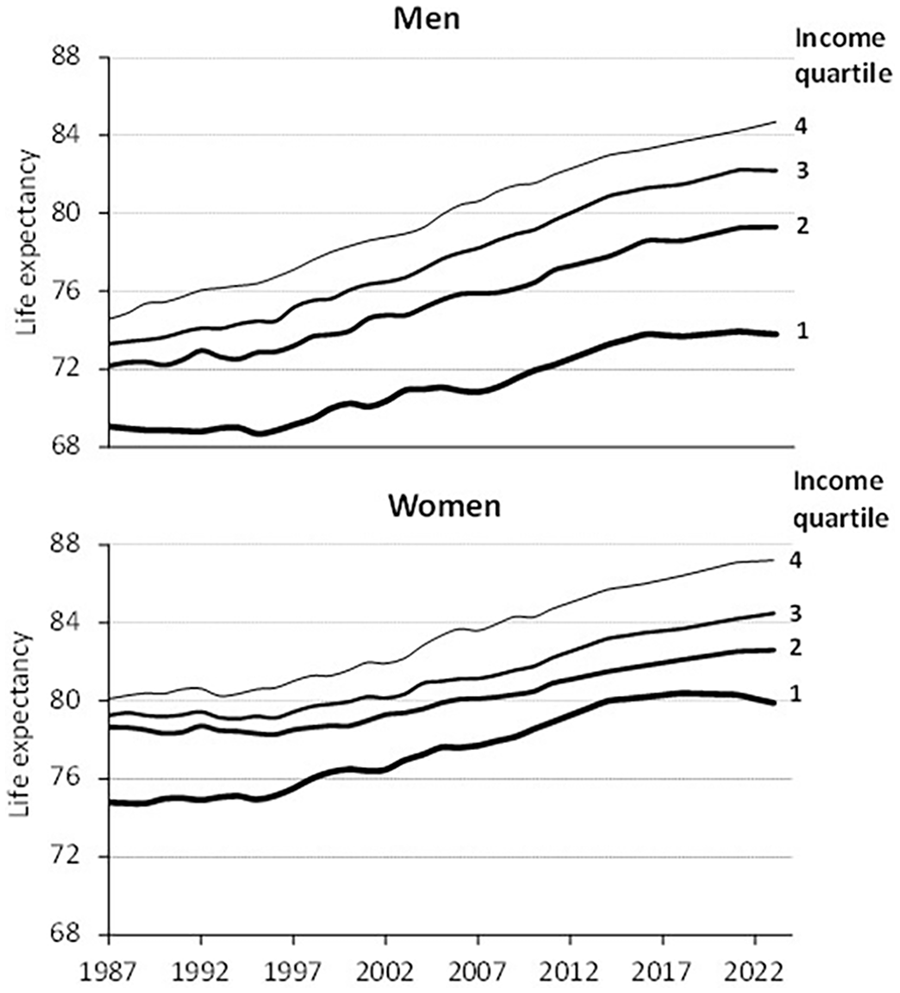
Trend in life expectancy at birth by income quartile.
The age-at-death distributions, d(x), for the highest and lowest income quartiles in 1987 and 2023 are shown in Figure 2. For both genders, the shape of the curves did not differ significantly between the highest and the lowest income quartiles in 1987. However, while the shape was almost unchanged in 2023 for the lowest income quartile, a marked change was seen for the highest income quartile, illustrating that individuals in this income group experienced a clear compression of mortality.
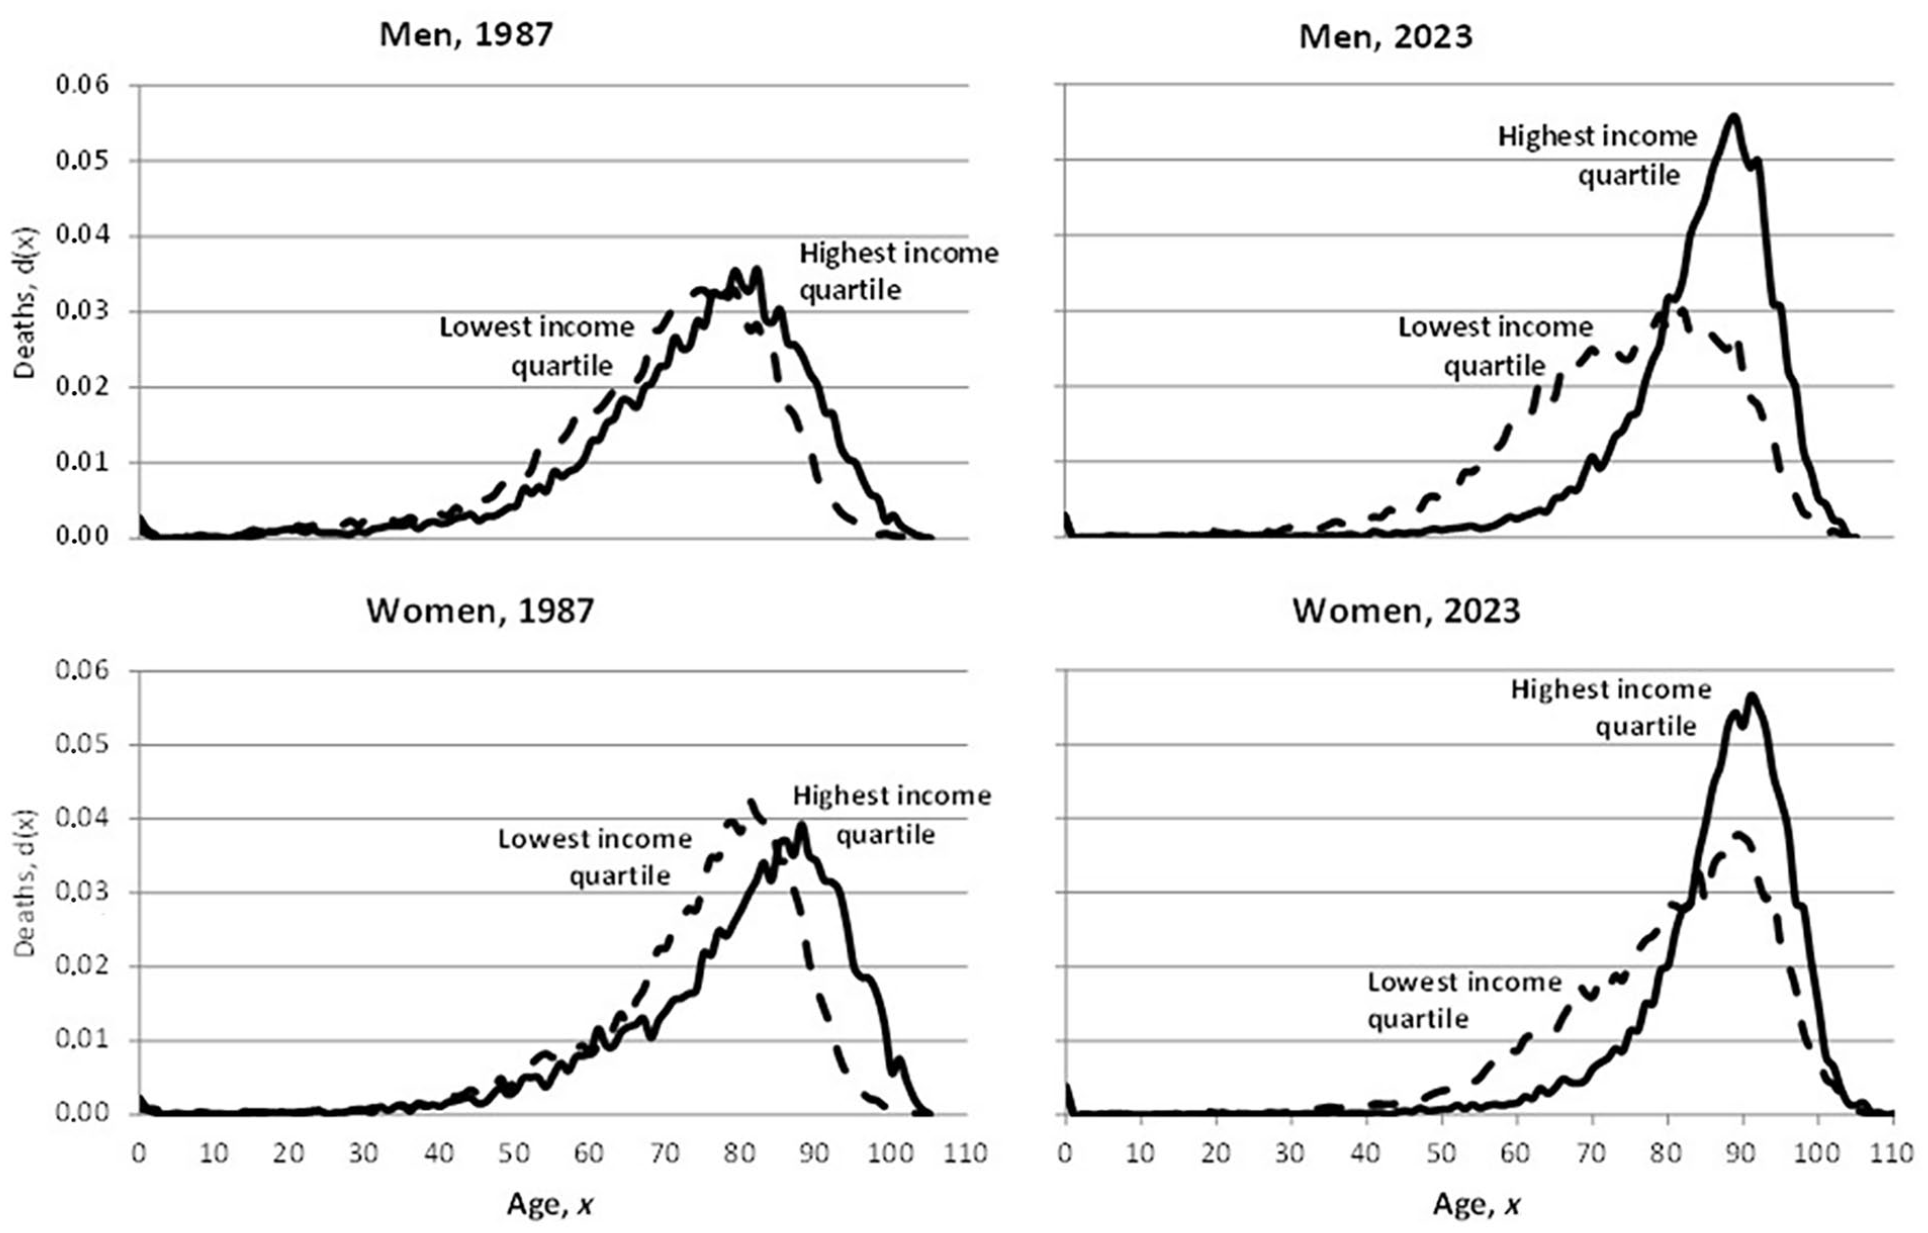
Life table age-at-death distributions in 1987 and 2023 for the lowest and the highest income quartiles.
Inequalities between levels of education
Figure 3 shows the development since 2005 in life expectancy at age 30 years, divided by level of education. The difference in life expectancy between 30-year-old men with short and long education increased from 5.6 years in 2005 to 7.1 years in 2023. For 30-year-old women, the increase was from 4.1 years to 5.6 years (Figure 3). Since 2020, the life expectancy of men and women with a short education appears to be decreasing.
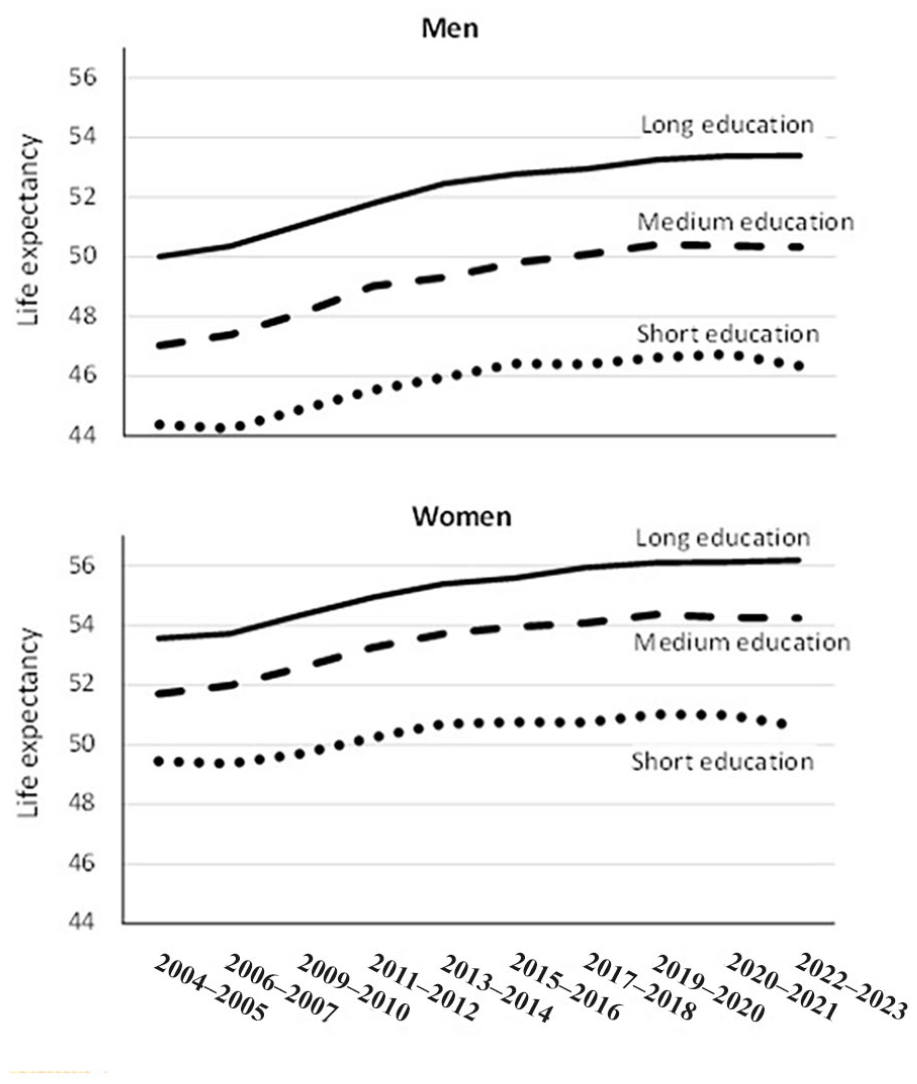
Trend in life expectancy at age 30 years by education.
Discussion
A clear social gradient in life expectancy is found in this study. It is the better-off and older part of the population that contributes the largest decrease in mortality and thus contributes the most to the overall increase in life expectancy. The most important messages, however, are that the gap between socioeconomic groups continues to increase and that Denmark has reached the tipping point where Danes in the lowest income quartile and with the shortest education are losing years of life. While people with medium or long education experience stagnation in life expectancy, people in the three upper income quartiles expect a continued increase in life expectancy.
Although Denmark is a small welfare state of around 43,000 km2 and almost six million inhabitants spread over five regions and 98 municipalities, with tax-financed free educational and healthcare systems and other welfare benefits, there are geographical differences in the country, which manifest as social inequality in welfare and health. Some differences are due to developments in the housing market and the movement from the countryside to larger cities with better opportunities for work. There is also inequality at the local level. For example, life expectancy varies by several years between the 10 districts for the capital’s 660,000 inhabitants.
Disposable household income measured by quartiles provides a consistent definition of income over time, despite shifts in income during the lifetime limiting the interpretation of changes in period life expectancies. But education is generally recommended to define the socioeconomic position of adults due to its stability for the individual, although the distribution of the population’s level of education has changed. However, educational level defined by ISCED is stable over time.
According to Statistics Denmark, the share of men aged 30–69 years with a short level of education fell from 25% in 2005 to 18% in 2023, while the share with medium education fell from 47% to 43%. The share of men with a long education grew from 26% to 37% (2% missing in both years). A similar but even more pronounced development is seen for women, where 48% have a long education in 2023 (it was 30% in 2005). This change is due to a significant higher level of education among younger birth cohorts and especially among women. Thus, the decreasing proportion of the population with a short education experiences increasing mortality and appears to represent a particularly vulnerable group. Along with this development, one can imagine that the advantageous position of the increasing proportion receiving more education is being ‘attenuated’ [14,15].
An analysis (which included Denmark) that decomposed the increases in life expectancy by educational structure and education-specific mortality showed that the structural change in education accounted for a significant part of the improvements in overall life expectancy at age 30 years [16]. However, among older population groups in four Nordic countries the expansion of education has contributed unequally between educational groups [17].
Despite the fact that the labour market has undergone changes during the study period, broad occupational groups can be defined fairly uniformly over time, and trends restricted to working-age population (partial) life expectancy by occupation be estimated. According to Statistics Denmark the average unemployment rate fell from just over 9% of the workforce in 1980–1994 to almost 4% in the period 2006–2020 for the population of working-age interval (18–64 years). Although the Danish welfare state provides social security for unemployed, income will fall for most in the event of unemployment and people with low income are considered more sensitive to unemployment. However, this non-parametric study does not include occupational or employment indicators and does not evaluate trends in occupational inequality in life expectancy. It is speculative how the results from the present study might be affected by changes in occupational and employment determinants; this issue requires specific future analysis.
Because everyone with a residence permit in Denmark is assigned a unique identification code, immigrants are included in the study. The total number of immigrants and descendants previously constituted a smaller proportion of the Danish population than today (3.3% in 1990 and 15.4% in 2023). Immigrants in Denmark are, however, heterogeneous, and adult immigrants with a non-Western background have lower mortality rates than people of Danish origin [18]. Furthermore, according to Statistics Denmark, immigrants with a non-Western background are younger than people of Danish origin; in 2023, the proportion of non-Western immigrants over 50 was only half of the proportion of people of Danish origin. The age distribution of non-Western immigrants might affect the estimation of death rates for the entire Danish population, but mainly among younger people, for whom mortality is very low. Comparisons and interpretations of social inequality in mortality between immigrants and non-immigrants require more advanced analyses. However, the effect of how much Danes with non-Western origin affect social inequality in mortality can be illustrated by excluding this group in the calculations. The result for 2022–2023 shows that life expectancy is thereby reduced by 0.3 years and 0.5 years respectively for men and women with short education. For those with medium or long education, no effect is seen.
This study shows a clear correlation between socioeconomic position and mortality, but cannot reveal the many mechanisms through which socioeconomic position creates inequality in mortality. However, many epidemiological and sociological studies have been published which shed light on a number of determinants and risk factors that contribute to a causal relationship and how socioeconomic circumstances are modifiable by social and health policies [19,20].
Since period life expectancy is based on the assumption of no change in mortality rates in the future, life expectancy should be interpreted as an indicator of mortality in a given year or period rather than an estimate of length of life. Furthermore, the division of the population into socio-economic groups introduces a further limitation of interpretation, because individuals may shift socioeconomic group during the lifetime, especially when divided into income groups, and if these shifts change over time. Nevertheless, as an overall measure of mortality, the trend in life expectancy provides an important and simple description of mortality changes in a population or population groups. Monitoring socioeconomic inequality in life expectancy, health expectancy and other indicators provides important insights into changes in population health.
As in other countries, socioeconomic inequality in mortality is a major issue for public health policy in Denmark, and successive governments have proclaimed that efforts should be made to address this challenge. Several reports have been prepared to support the efforts to achieve the goals [21–23]. The focus has been on reforms within the organization of the healthcare system and preventative efforts to change lifestyle behaviour, but also on structural social and labour market reforms that can improve the living conditions of the least privileged population groups [21–23].