
Abstract
Introduction:
Sexual harassment is a major problem in higher education systems worldwide with major impacts on students. This study aims to describe and synthesise quantitative data on sexual harassment prevalence among higher education students.
Methods:
We searched seven databases. We included studies published in English and French from 2000 until 2023 if they measured sexual harassment prevalence on students attending higher education, and they were quantitative cross-sectional studies. Prevalence estimates disaggregated by gender identity and world region were meta-analysed using a random effects model and reported following Preferred Reporting Items for Systematic Reviews and Meta-Analyses (PRISMA) guidance.
Results:
We identified 53 articles, from six different world regions. The meta-analysed prevalence of sexual harassment was 43.7% for women, 16.8% for men, 33.4% for transgender and gender diverse people and 38.2% for healthcare students. The Eastern Mediterranean region had the highest prevalence estimates for women’s sexual harassment, and the Region of the Americas had the highest prevalence estimates for men’s sexual harassment.
Conclusions:
Introduction
Sexual harassment (SH), defined as unwanted, unwelcomed, inappropriate, and offensive behaviour [1 –3], is a serious problem on college and university campuses. SH can include verbal harassment (e.g., sexual expressions, comments), non-verbal harassment (e.g., intrusive eye or body movements) [4]; cyber harassment [5,6]. Students of all genders are affected by SH, although female and non-binary students experience higher rates compared with their male counterparts [7 –10]. For instance, research has shown that 40% of female students, 11% of male students, and 80% of non-binary students report experiencing SH during their time at university [11]. This behaviour not only violates individual rights but also disrupts the educational environment, with significant consequences for the wellbeing and academic success of those affected [7,11 –15].
The prevalence and reporting of sexual harassment vary considerably across countries and institutions, depending on cultural norms, legal frameworks, and institutional practices [12]. In contexts where gender equality policies are strong and reporting mechanisms are well established, students may feel more empowered to report incidents [12,16]. Conversely, in societies characterised by patriarchal norms or weak institutional safeguards, cases of sexual harassment often remain underreported due to stigma, fear of reprisals, or mistrust of formal procedures [13,17]. Furthermore, higher education systems differ in their structure, ranging from centralised public institutions with standardised anti-harassment policies to decentralised or private systems where responses may be inconsistent [18]. These variations influence power dynamics, institutional accountability, and the experiences of victims of SH [19].
Several reviews have synthesised findings on SH in higher education (HE). For example, Bondestam and Lundqvist (2020) reported international prevalence rates ranging from 2% to 93%, reflecting significant methodological variation [12]. Similarly, a systematic review of US college studies found prevalence estimates between 9% and 97% [20]. However, previous systematic reviews with meta-analyses have primarily examined sexual assault rather than SH [21,22], and existing reviews on SH in higher education remain limited in scope. Most focus on single countries or populations, use qualitative designs, or do not include quantitative syntheses across regions and gender identities [17,20,23 –25].
Despite the growing body of research on SH in HE, significant discrepancies remain between studies. These discrepancies stem from differences in definitions, measurement tools, recall periods, and institutional or cultural contexts, making comparisons between countries particularly difficult [10]. For example, while some studies conceptualise SH narrowly, focusing only on physical or verbal behaviours, others take a broader perspective that includes gender-based harassment or online harassment. Similarly, the reference period used to assess SH (e.g., in the past year, since enrollment, or in the lifetime) can significantly influence prevalence estimates. Yet few studies have systematically examined how these methodological and contextual variations influence reported SH rates (Supplemental Tables I–V).
These gaps highlight the need for a comprehensive meta-analysis that considers methodological and contextual diversity across studies, including variations by gender identity and world region. This systematic review and meta-analysis therefore aims to fill these gaps by:
Quantifying the global prevalence of SH among higher education students.
Examining differences in prevalence between gender identities and geographical regions.
Exploring how measurement and contextual factors, such as definitions, recall periods, and cultural contexts, contribute to discrepancies between studies.
By synthesising findings from multiple countries and contexts, this study provides a comprehensive and comparative understanding of how SH manifests in various higher education settings around the world.
Methods
Identification and selection of studies
We conducted a systematic review conducted in accordance withthe Preferred Reporting Items for Systematic Reviews and Meta-Analyses (PRISMA) statement and the Joanna Briggs Institute (JBI)’s XYZ (S1) [26]. We did not register our systematic review protocol in a database. However, we specified our search strategy, inclusion criteria, data extraction, and data analyses in advance of writing our manuscript. Several search engines, including ‘(CINAHL, PubMed/Medline, ERIC, Google Scholar, Web of Science and Dimensions)’ were used to search for studies published within the last years 2000 to December 2023. The search was based on a combination of keywords and medical subject headings (MeSH), for example, (‘Sexual Harassment’ [Mesh] ‘Sex Offences’ [Mesh] ‘Gender-Based Violence’ [Mesh]), (‘Students’ [Mesh]), (‘Universities’ [Mesh]), (‘Prevalence’ [Mesh]), (‘Incidence’ [Mesh]), as well as the relevant Boolean operators (AND, OR). Keywords were applied to the title, abstract and text. For more details on how the search strategy was executed, see Supplemental Table II.
Inclusion and exclusion criteria
The following criteria were used for the inclusion of studies:
1) Studies had to be written in either English or French.
2) They must have included a measure of non-contact SH, defined as unwanted behaviours of a sexual or sexist nature without physical contact, including:
(1) Verbal harassment (unwanted verbal comments with a sexual or sexist connotation);
(2) Non-verbal harassment (unwanted sexual conduct that does not involve physical contact (e.g., intrusive gestures or body movements));
(3) Cyber harassment (unwanted sexually explicit emails, text or online messages); or (4) gender-based harassment (sexist behaviours and remarks) (see Supplemental Table I).
(4) Studies were eligible regardless of whether a validated or non-validated measurement instrument was used.
3) The study population had to comprise students attending university or higher education during the data collection period.
4) Data collection had to be conducted using a quantitative cross-sectional survey to estimate the prevalence of SH.
5) There were no geographical restrictions on the location of included studies.
Studies were excluded if they met any of the following criteria:
1) Solely measured sexual assault or physical sexual contact without addressing SH.
2) Concentrated on young adults or solely examined the SH experiences of educators or higher education staff.
3) Only assessed lifetime prevalence of SH.
4) Were prospective studies, book chapters, reviews, or qualitative articles.
Screening and data extraction
Search results from each database were imported into the Rayyan systematic review software [27]. All studies were then combined and duplicates removed. The titles and abstracts of these studies were reviewed blindly by the two reviewers using a predefined set of inclusion and exclusion criteria, and then one reviewer examined the full text of the selected studies. Following best practice guidance, a second reviewer (MPT) also screened a random 10% of the articles at both stages [28]. Interrater reliability was 90%. Any discrepancies or uncertainties concerning the inclusion or exclusion of a study were resolved by discussion between the reviewers.
The following information was extracted from each article: the definition of SH used; the measurement tool; the country where the study was conducted; the World Health Organization (WHO) global region in which the country is located (Africa; Eastern Mediterranean; European; Americas; Southeast Asia; Western Pacific) [29]; sampling method; study design; sample size; response rate; recall period; SH prevalence estimates and prevalence estimates disaggregated by gender identity. When studies reported gender identities that were not male or female, such as transgender [30,31], gender minority [32], non-binary [11,33] or genderqueer or gender non-conforming [30], these prevalence estimates were meta-analysed together in the transgender and gender diverse category due to the small number of studies that reported on this subgroup.
When studies presented a cumulative estimate of SH or a singular estimate specifically for SH, such as cyber harassment [5], it was included in the overall prevalence meta-analyses. In instances where studies offered estimates categorised by different types of SH (see Table I), multiple estimates were extracted for inclusion. Prevalence estimates were recorded as the percentage of participants within the study sample who faced each type of SH. Whenever these proportions were explicitly provided in a study, they were directly extracted. In instances where the proportions were not explicitly reported, they were calculated by dividing the number of participants who experienced SH by the total number of participants, as prevalence is defined as the number of cases divided by the population number [34]. To enhance the reliability and replicability of the data extraction process, two reviewers independently extracted data from 10% of the included studies. No discrepancies were identified during this process.
Summary of study characteristics.
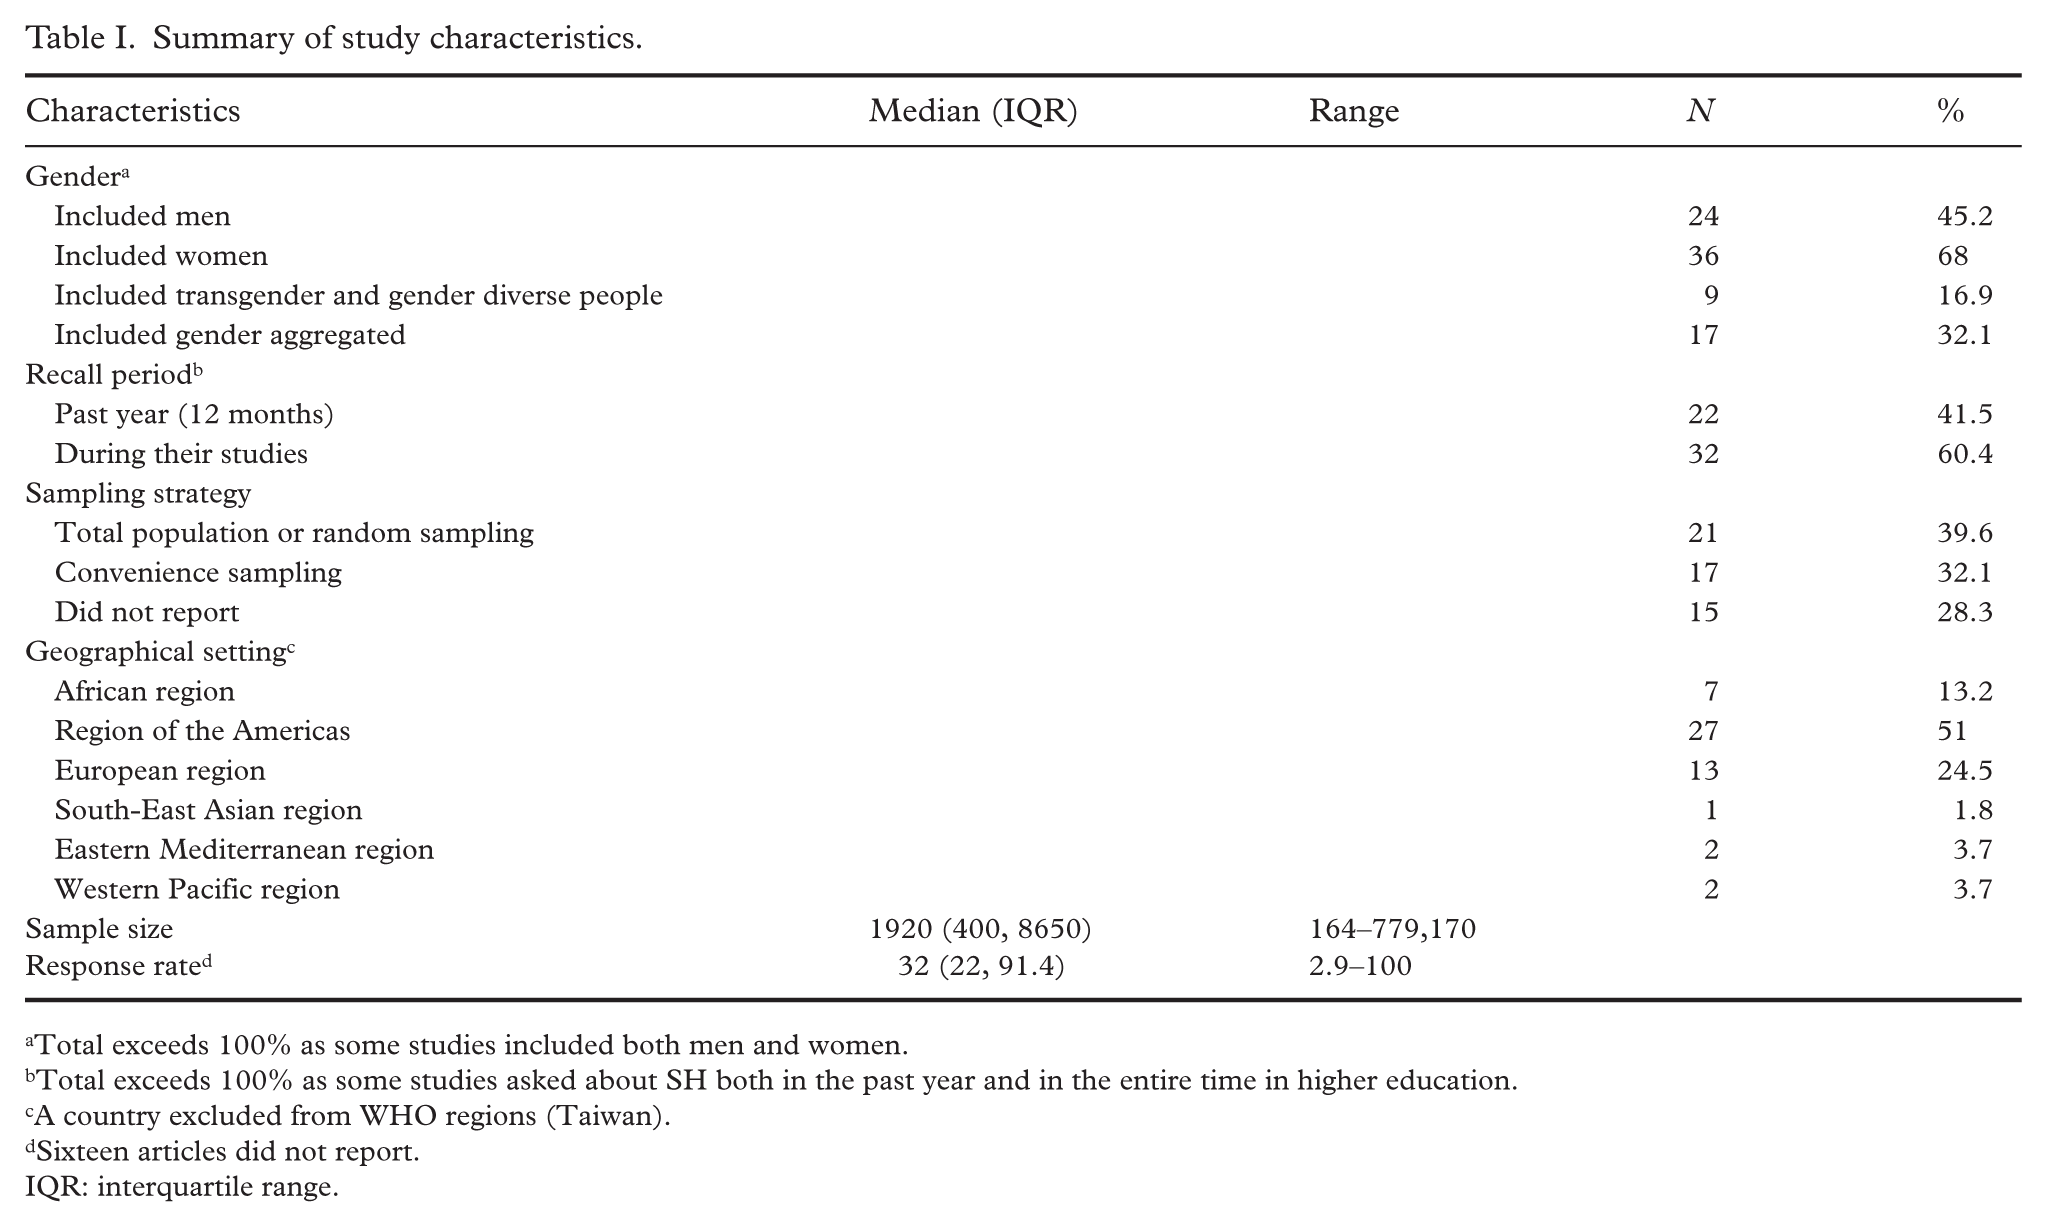
Total exceeds 100% as some studies included both men and women.
Total exceeds 100% as some studies asked about SH both in the past year and in the entire time in higher education.
A country excluded from WHO regions (Taiwan).
Sixteen articles did not report.
IQR: interquartile range.
Risk of bias assessment
The risk of bias in the included studies was evaluated using the Joanna Briggs Institute’s Checklist for Prevalence Studies (2017). The following nine criteria were assessed:
1. Was the sample frame appropriate to address the target population?
2. Were study participants sampled in an appropriate way?
3. Was the sample size adequate?
4. Were the study subjects and the setting described in detail?
5. Was the data analysis conducted with sufficient coverage of the identified sample?
6. Were valid methods used for the identification of the condition?
7. Was the condition measured in a standard, reliable way for all participants?
8. Was there appropriate statistical analysis?
9. Was the response rate adequate, and if not, was the low response rate managed appropriately?
Each criterion was given a score of 1 if the criterion was met, 0 if the criterion was not met or not applicable. The risk of bias was assessed independently by two reviewers, and any disagreements were discussed, resolved and recorded.
Analyses
Meta-analyses were conducted to synthesise the results of the included studies. Pooled prevalence estimates were determined using a generalised linear mixed random-effects model with Freeman–Tukey double arcsine transformation, following the approach outlined by Barendregt et al. [34]. This transformation addresses both the problem of confidence limits outside the 0–1 range and that of variance instability [35]. The overall prevalence estimate for SH was assessed for each gender identity. Subsequently, for each gender identity, estimates were stratified based on recall period, type of harassment, and geographical location. In cases where studies did not stratify estimates by gender identity, the estimates were pooled separately. To prevent duplication of data, each participant was included only once in each meta-analysis. Consequently, in cases when studies presented results from the same samples, the study providing the most exhaustive information was first included in the meta-analysis.
Results were presented with 95% confidence intervals (CIs) [36]. All meta-analyses were carried out using the R statistical software (v4.2.1) using metafor [37] and lme4 packages [38]. To evaluate heterogeneity between studies, the I2 index was employed. Recognising the potential for high heterogeneity, meta-analyses were performed using subgroups. The risk of bias in the study was assessed using the Joanna Briggs Institute (2017) checklist for prevalence studies.
Results
Overview of included studies
Included articles were published from 2000 to 2023. The search methods retrieved 3263 articles with 2038 remaining after duplicates were removed. The articles’ titles and abstracts were screened using study inclusion criteria, with 1722 being excluded and 316 left for full-text review; of which, 53 articles were included with 36 reporting on women, 24 reporting on men, 10 reporting on transgender or gender-non-binary people, and 17 reporting only gender aggregated victimisation. The most common reason for excluding articles was wrong study design (e.g., Albert, [39]). The PRISMA flowchart (Figure 1) outlines the study selection process.
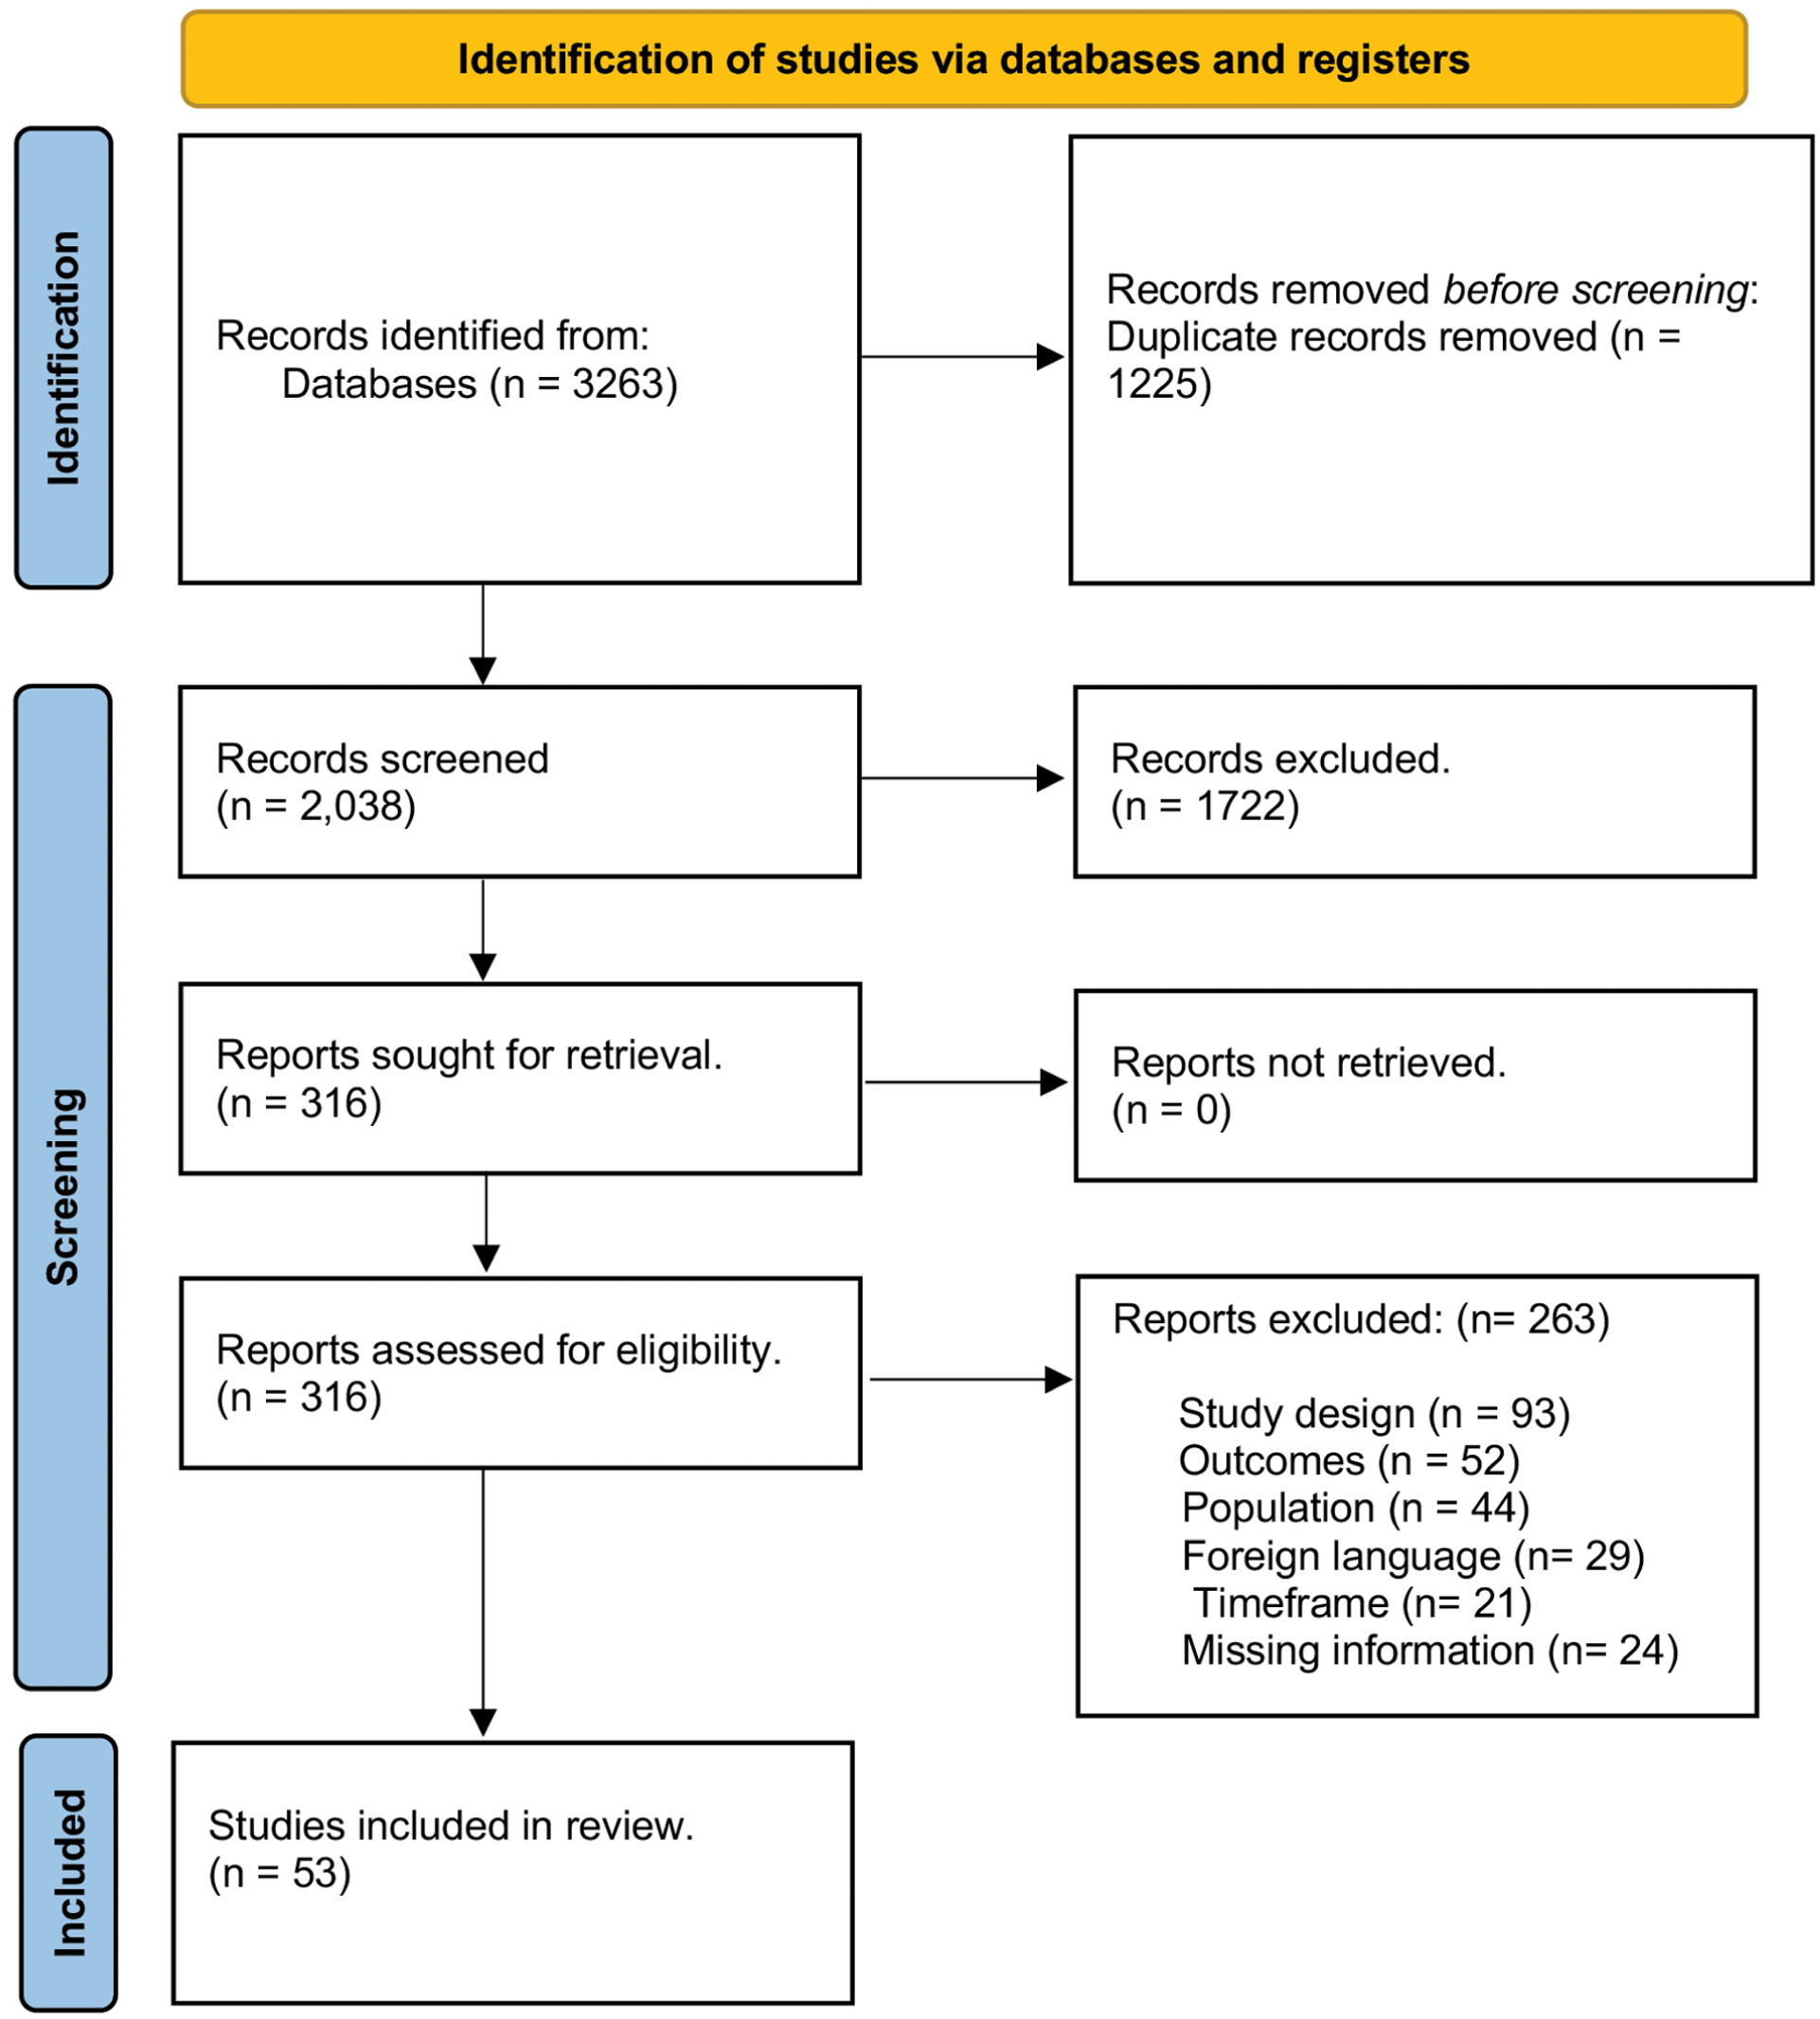
Preferred Reporting Items for Systematic Reviews and Meta-Analyses (PRISMA) flow diagram.
Fifty-one (94%) of the 53 studies used quantitative methods and two (6%) used mixed methods (e.g., Kelley and Parsons, [40]). Seventeen (32%) studies used convenience or purposive sampling, 21 (39%) used random sampling, and 15 (28%) did not specify their sampling strategy. Sample sizes ranged widely from 164 to 779,170, with a median sample size of 1920. Thirty-seven studies reported response rates, which ranged from 2.9% to 100%. The most frequently used SH measurement tool was the sexual experience questionnaire (SEQ) (22.2%), either in the original or adapted form. Adapted SEQ measures included the Latina version [41] and the Department of Defence version [42,43].
Table I provides information on the characteristics of the articles included (see Supplemental Tables III–VI for detailed study characteristics disaggregated by gender identity). Most articles (45%) used samples from the United States (n=24) while Canada and France each contributed 5% of the articles included. Sixteen countries contributed only one study. In terms of WHO regions, only one study was from the South-East Asian region, two were from the Eastern Mediterranean region and two from the Western Pacific region. One study was excluded from the WHO regions (Taiwan). The recall periods measured in each article ranged from within the past year (n=22) to throughout the entire time in HE (n=32).
Prevalence
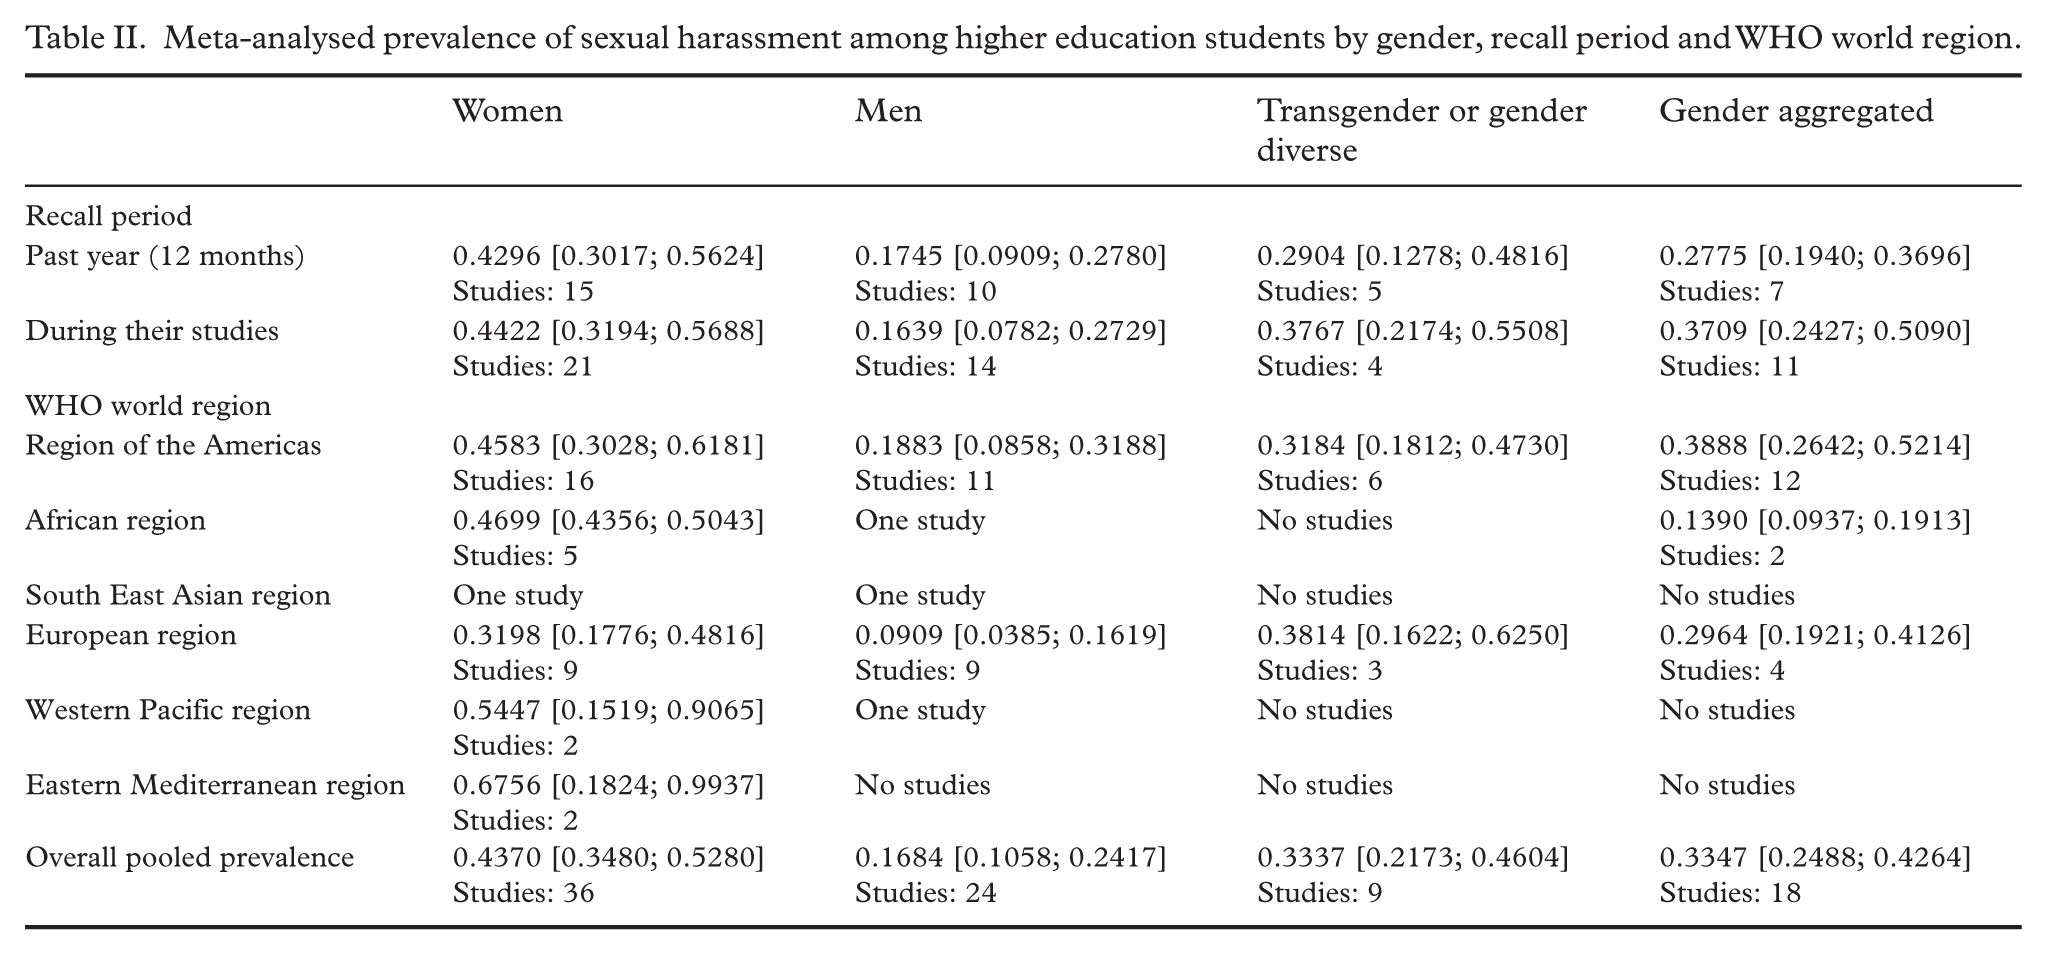
Globally, the prevalence of SH was 36.9% (95% CI [30.6, 43.6]; prevalence varied by gender with 43.7% of women experiencing any type of SH ([34.8, 52.8]), compared with 16.8% of men ([10.6, 24.2]; see Table II and Figure 2). Transgender and gender diverse students experienced 33.4 % SH victimisation ([21.7, 46.04]). Studies using validated tools report a prevalence of SH around 14% higher (46.72% vs. 32.24%, P=0.0353) than those using non-validated tools. All meta-analyses had considerable heterogeneity (I2>95%).
Meta-analysed prevalence of sexual harassment among higher education students by gender, recall period and WHO world region.
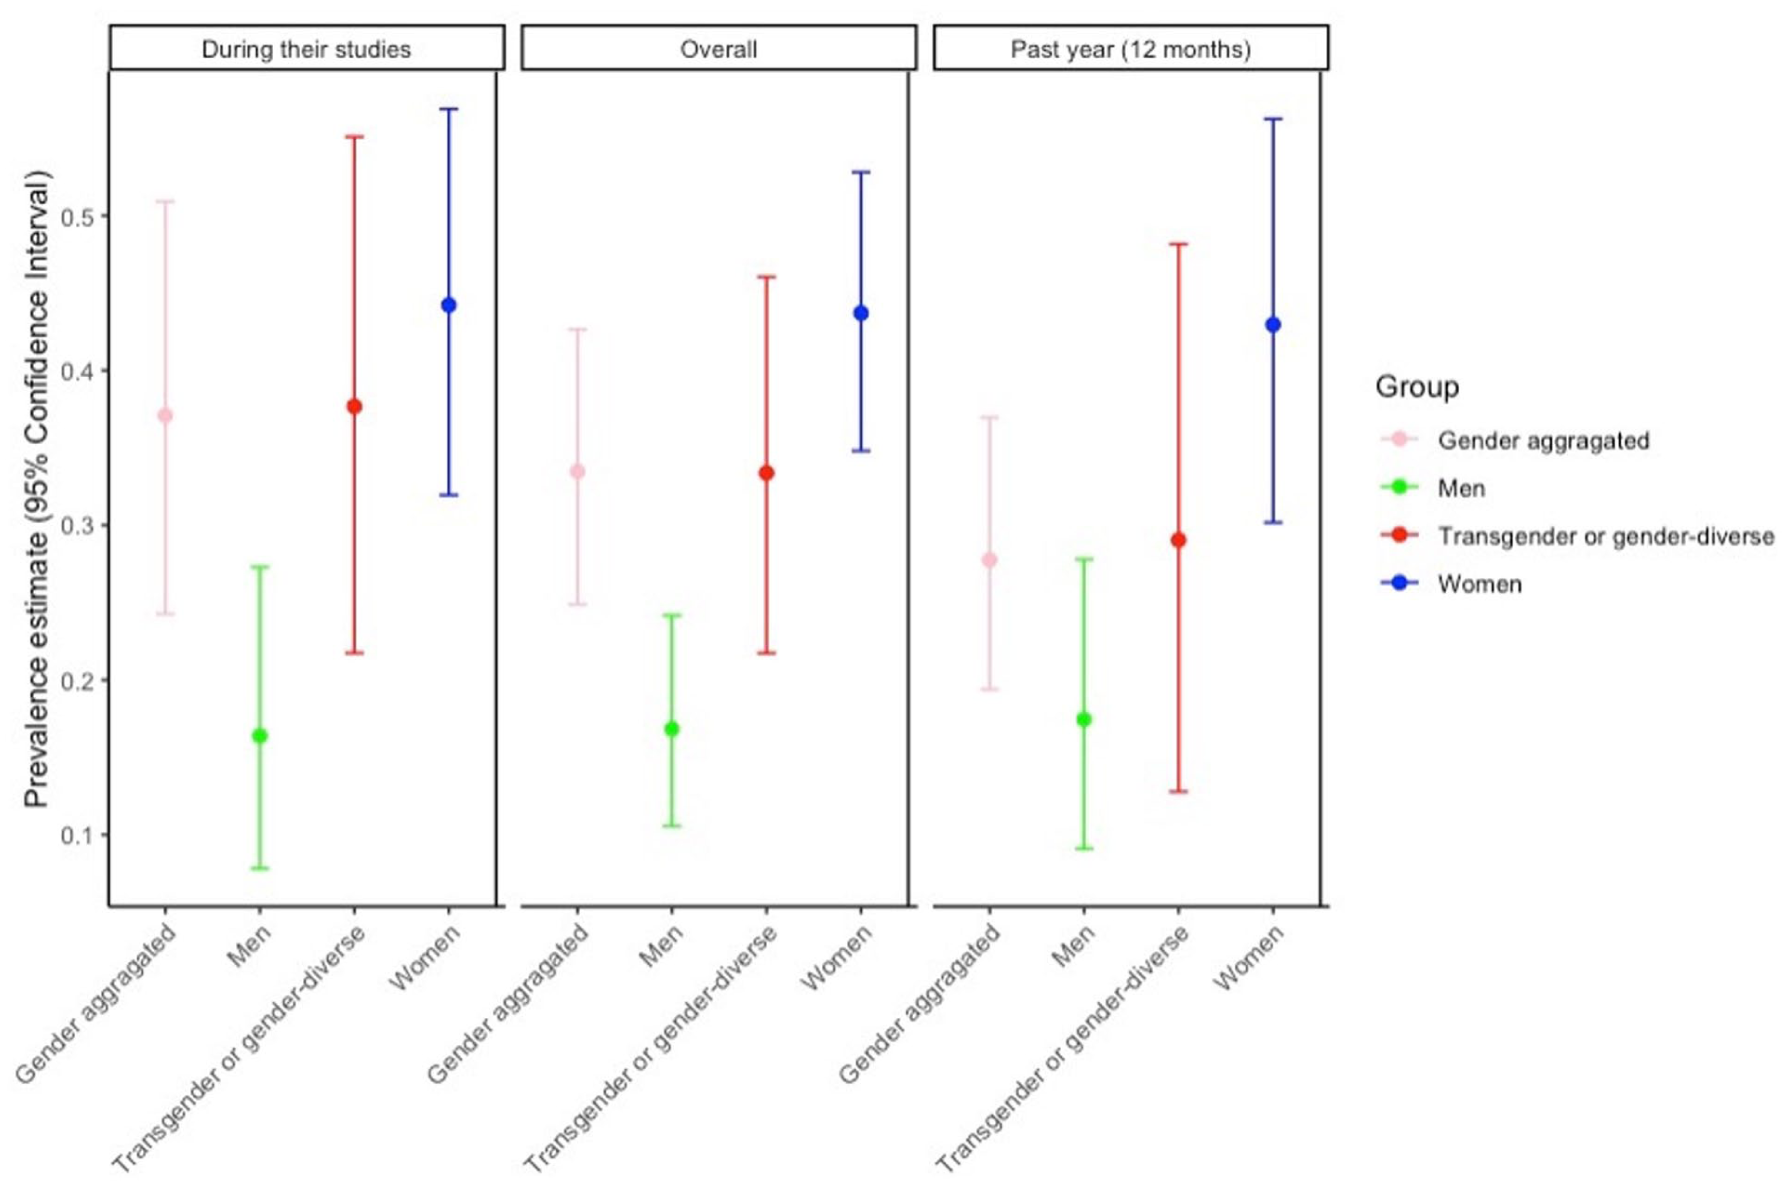
Sexual harassment prevalence disaggregated by recall period.
The prevalence of SH also varied based on the world region where students attended HE (Figure 3 and Table II). We found that the prevalence among women in the Americas was 45.8% ([30.3, 61.8]), which was the region with the highest number of studies (n=27). The prevalence of SH among men was double in the Americas, 18.8% (95% CI [8.6, 31.8]), compared with the European region (9.1% (95% CI [3.8, 16.2])) (Table II).
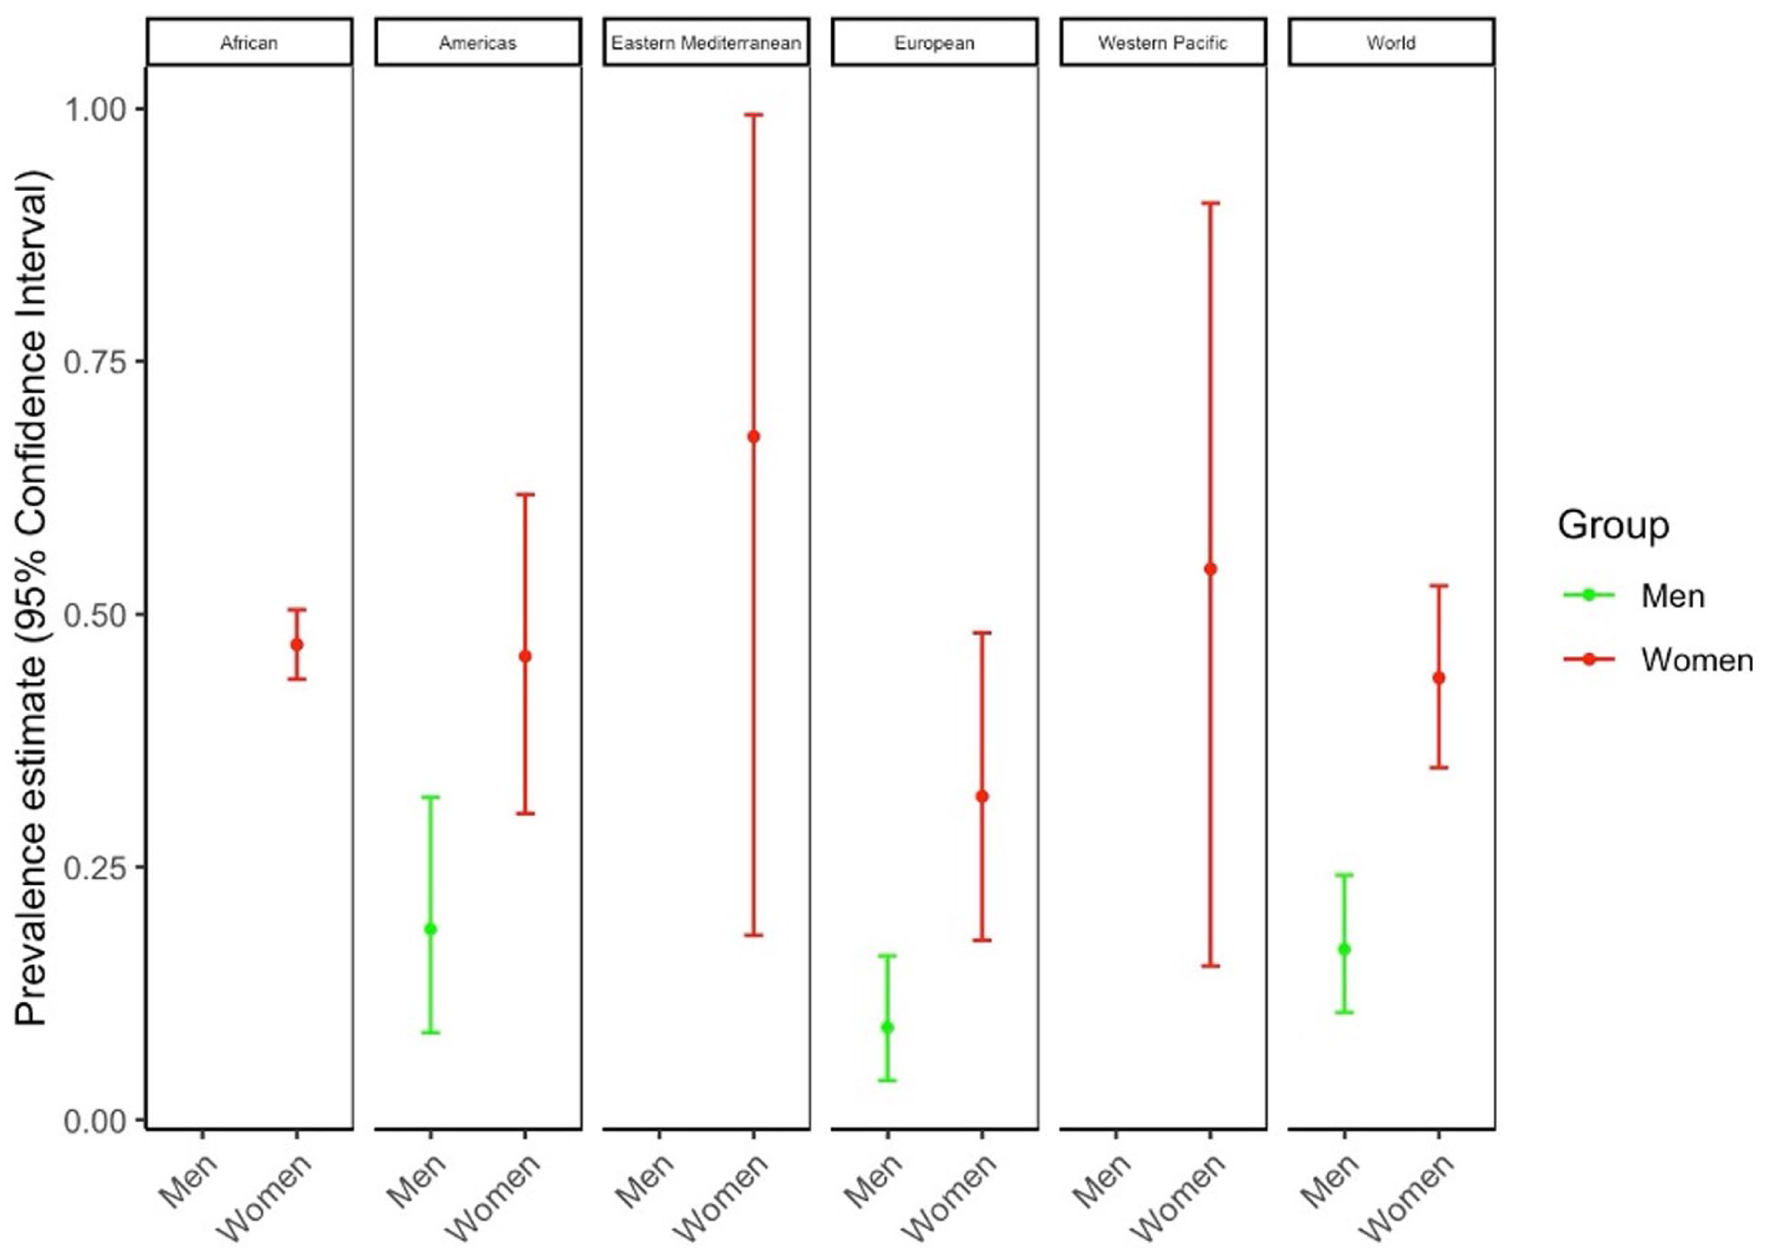
Sexual harassment prevalence disaggregated by World Health Organization world region.
Risk of bias
We have identified some bias in the articles included (Supplemental Table VIII). The primary factor increasing the risk of bias was the sampling strategy. Many studies used appropriate random sampling methods, while 17 studies opted for convenience sampling. Low response rates were also a problem, with 23 studies reporting rates below 50%. Some studies showed an over-representation of women [7,43]. Some subgroups, such as transgender and genderqueer people, had small sample sizes, limiting analyses of important social identities. In 30 studies, the way SH was measured was not specified, or authors created their own questionnaires. In addition, authors often relied on self-reported information or participation based on voluntary involvement. These factors may limit the overall quality and interpretability of the effect sizes pooled.
Discussion
Our systematic review of 53 articles that met the study's inclusion criteria revealed a concerning SH profile among students in HE. In our analysis, we found a significant prevalence of SH in this population. Specifically, we found that 43.7% of women and 16.8% of men enrolled in higher education reported having experienced SH. These findings reflect previous research conducted in the US, highlighting the persistent presence of SH in higher education settings. Although the prevalence of SH was 36.9%, our analysis did not identify the most common types of SH among different gender identities. This is because not all the studies included in our analysis provided information on the specific types of SH experienced. There is therefore an urgent need for more comprehensive studies to investigate deeper into the nuances of SH experiences within different gender identity groups.
While only a small number of included studies reported on SH among transgender and gender diverse samples, we found that this population experienced a high rate of SH (33.4%). This highlights the critical need for adapted prevention and response strategies in higher education institutions, particularly those that unintentionally overlook the experiences of transgender and gender diverse communities [44]. Extending our focus to international research beyond the borders of the US and Western Europe, we find that certain population groups face a disproportionate risk of SH. These include students, young women, people in precarious employment and specific minority groups (ethnic and sexual minorities), as previous studies show [45,46].
Although less prevalent than among women and gender diverse individuals, a considerable proportion of men in higher education (16.8%) reported having experienced SH. Future research efforts should aim to gain a comprehensive understanding of men's experiences of SH, to contribute to the currently limited database on this topic within HE. However, due to a lack of data in four of the six WHO regions, it was not possible to provide regional estimates for men in this study. In fact, there is an urgent need for further research into male SH, particularly in low and middle-income countries. Even so, this paper represents a valuable addition to the existing literature on SH in higher education institutions by conducting a meta-analysis of men's experiences of SH.
Meta-analysed estimates consistently demonstrate that women report higher rates of SH victimisation in all regions, with the greatest risk observed in low-income countries. The Eastern Mediterranean region had the highest estimates for women’s SH, but only two studies were included in the analysis. This finding contributes significantly to our understanding of SH within higher education institutions in all regions. For example, a meta-analysis on the prevalence of SH in low and middle-income countries revealed alarming rates, with up to 73% of students experiencing SH in 2021 [17]. The variation in the prevalence of SH across countries could be related to the differences in economic and education levels as well as cultural factors [47].
The results of this meta-analysis reveal a significant difference in the reported prevalence of SH depending on the type of measurement tool used. Studies using validated tools reported a prevalence around 14% higher than studies using non-validated tools. This difference underlines the essential role of standardised instruments in capturing the true extent of SH experiences.
Validated tools, such as the SEQ [48], offer standardised definitions and a structured framework for measuring SH, ensuring greater sensitivity to the various types of harassment. These tools are designed to reduce misclassification and cover the full range of behaviours, which may explain the higher prevalence rates observed in studies using them. The results suggest that non-validated or customised tools may underestimate the true prevalence of SH due to inconsistent definitions or less thorough investigations.
Limitations
There are several limitations to this review. Firstly, while there were no geographical restrictions, the search was confined to articles published only in English and French. This language limitation may have led to the exclusion of relevant studies published in other languages. Future research could consider expanding the search scope to include other global regions and languages not covered in this review. Secondly, there were potential biases due to low response rates and non-representative samples. Thirdly, variations in assessment tools and definitions of SH across studies contributed to high heterogeneity in the results. All meta-analyses demonstrated substantial heterogeneity (I2>95%), which could impact the reliability and generalisability of pooled estimates. Despite this, evidence synthesis was deemed necessary given the abundance of studies available worldwide, notwithstanding differences in study characteristics. Moreover, it is important to acknowledge that heterogeneity cannot be eliminated in epidemiological surveys, even with subgroup analyses to adjust for it. These limitations highlight the complexity involved in synthesising findings from diverse sources. Despite these limitations, the findings of this study underscore the need for immediate action to prevent SH on university campuses.
Conclusions
Overall, this review provides a summary of the evidence on sexual harassment in higher education. Despite the increasing prevalence of sexual harassment over the past decade, definitions remain unclear, and rigorously designed prevalence studies using validated measures of sexual harassment are limited. This kind of meta-analysis represents the most valuable studies in the larger context, yet they are difficult to conduct without more systematic use of validated measures and consistent definitions. Nevertheless, this analysis confirms that the prevalence of sexual harassment is high in higher education and that women are more affected than men (Supplemental Table VII). As there is no evidence that sexual harassment is decreasing, there is an urgent need to improve the measurement of sexual harassment, and better measures are particularly essential for large-scale, repeated, and representative surveys (Supplemental Table IX). Also, with better measurement and understanding of this problem's prevalence, policies and programmes can be designed accordingly.
Supplemental Material
sj-docx-1-sjp-10.1177_14034948261450775 – Supplemental material for Sexual harassment among higher education students: a systematic review with meta-analysis
Supplemental material, sj-docx-1-sjp-10.1177_14034948261450775 for Sexual harassment among higher education students: a systematic review with meta-analysis by Rodeline Telfils and Marie-Pierre Tavolacci in Scandinavian Journal of Public Health
Footnotes
Acknowledgements
The authors would like to thank all the participants in the primary studies included in this review who reported their experience of sexual harassment.
Declaration of conflicting interests
The authors declared no potential conflicts of interest with respect to the research, authorship, and/or publication of this article.
Funding
The authors received no financial support for the research, authorship, and/or publication of this article.
Supplemental material
Supplemental material for this article is available online.
References
Supplementary Material
Please find the following supplemental material available below.
For Open Access articles published under a Creative Commons License, all supplemental material carries the same license as the article it is associated with.
For non-Open Access articles published, all supplemental material carries a non-exclusive license, and permission requests for re-use of supplemental material or any part of supplemental material shall be sent directly to the copyright owner as specified in the copyright notice associated with the article.