
Abstract
It is uncertain if current Danish legislation regarding emission of formaldehyde from wood-based panels could assure that concentrations of formaldehyde in the indoor air of buildings containing the material would meet the World Health Organization (WHO) guideline. This is of particular concern since the recent recognition by International Agency for Research on Cancer that formaldehyde is carcinogenic to humans. Therefore, the purpose of this study was to determine whether residents of newly built Danish residential houses could be exposed to safe levels of formaldehyde. Geometric mean concentration of formaldehyde measured in 20 residential buildings was 0.04 mg m−3. Formaldehyde concentrations in two buildings (10%) exceeded the WHO guideline value. In order to explain the relatively high concentrations, a second phase was performed. The aim was to identify the significant formaldehyde sources and to discuss the source strength in relation to field measurements and WHO guidelines. The results showed wide differences between the materials tested, but all steady-state concentrations were below the European standard requirement for class E1. These measurements formed the basis for model calculations of possible resulting concentrations in residential rooms, suggesting that indoor concentrations above the WHO maximum limit could occur. The calculations applied a worst case scenario with all surfaces covered with materials emitting the maximum permissible amount of formaldehyde show indoor concentrations as high as 0.6 mg m−3.
Introduction
Building and finishing materials comprise some of the major sources of pollution in residential buildings. Formaldehyde is one common indoor pollutant with a wide range of sources. Annual world production of formaldehyde was about 32 million tonnes in 2006 [1]. Formaldehyde is used in the production of phenolics, urea, melamine and polyacetal resins for adhesives and binders in wooden products, paper and synthetic fibre products. It is also directly used in aqueous solutions (like formalin) as a disinfectant and preservative. Such formaldehyde applications make wooden products, carpets, paints and varnish the main indoor sources of formaldehyde. Furthermore, it is released in burning processes (including wood-burning fireplaces, gas cookers and tobacco smoke) [2] and it is generated during oxidation of compounds with terminal double bonds [3]. Moreover, fungicides added to construction products may release formaldehyde as part of their functional toxicity.
Formaldehyde has been known as a major irritant in indoor air for many years. It causes irritation of the eyes, nose and throat. Exposure to higher concentrations of formaldehyde may provoke asthma attacks in unsensitized individuals [2]. In 2006, International Agency for Research on Cancer has classified formaldehyde as being carcinogenic to humans [2], while the European Union (EU) still classifies formaldehyde as suspected human carcinogen [4]. Sensitive subjects may detect formaldehyde odour at concentrations as low as 0.03 mg m−3 and concentrations above 0.1 mg m−3 may cause irritation of the eyes and nose [5]. The last value was set as the indoor air quality maximum guideline value for 30 min average exposure recommended by World Health Organization (WHO) [5].
Levels of formaldehyde in outdoor air are generally below 0.001 mg m−3 in rural areas and 0.02 mg m−3 in urban areas [2]. Indoor concentrations of formaldehyde measured in the 1970s and the 1980s varied from below 0.01 mg m−3 up to even 10 mg m−3 [6]. Since the late 1980s, indoor concentrations of formaldehyde have declined as a result of an effort among producers of construction products in response to standards requiring that building materials emit less formaldehyde. The current regulation in Denmark for formaldehyde emission from wood-based construction products indicates that the indoor air concentration in an emission chamber should not exceed 0.124 mg m−3 [7]. But, though the formaldehyde content is regulated in many countries, recently reported concentrations of formaldehyde in residential buildings still exceed the WHO guideline value [8–10]. The regulations have probably induced a development where traditional sources such as wood-based construction boards less often emit high amounts of formaldehyde. Instead, indoor concentrations of formaldehyde are probably affected by many small contributions from other sources, including formaldehyde releasers often used as antimicrobial preservatives.
It is uncertain if current standards of Danish legislation and European Committee for Standardization (CEN) regarding emission of formaldehyde from wood-based panels assure that concentrations of formaldehyde in indoor air are below WHO recommendations. Therefore, the purpose of this study was to investigate if indoor environments in newly built Danish residential houses fulfil the WHO requirements regarding concentrations of formaldehyde and thereby do not pose health risk for residents. Since the WHO recommendation was not met in 10% of the houses, the second part was designed with the objective to look for possible causes of these relatively high concentrations by measuring emission rates from a number of possible formaldehyde sources, to identify the significant sources and discuss the source strength in relation to field measurements and WHO recommendations.
This paper presents the results from both parts.
Methods
Measurements in Residential Buildings
Selection of Buildings
The concentration of formaldehyde was measured in 20 residential buildings (single-family houses) in Denmark in the period from May to June 2007, with one house being measured in February 2007. The buildings included in the study were all erected and occupied within 6 years prior to the measurements and they were only included if they had wooden floors. It was also attempted to include houses with some additional indoor surfaces covered with wood-based panels. Only a limited sample of convenience was chosen because a demonstration of high formaldehyde concentrations was sufficient to show if current Danish legislation regarding emission of formaldehyde from wooden panels assures that concentrations of formaldehyde in indoor air are below WHO recommendations.
The houses were occupied by families but no detailed information on how the buildings were used before the measurements was collected. Occupants agreed to take part in the study.
None of the houses had extensive use of wooden panels, including use of panels in all of ceilings or walls.
Procedure of Measurements
Concentration of formaldehyde, air change rate (ACH), temperature, humidity and concentration of CO2 were measured. During the investigation, inspectors collected information on erection year, ventilation principle, total floor area, area of the room in which measurements took place and smoking habits of its occupants. The measurements took place in the smallest room suitable for habitation. During the measurements, the building was in normal use, but all windows and doors were closed. Other ventilation options were left as they were found at the beginning of measurements. During the measurements, two desk fans were operating in the room in order to ensure good mixing.
Formaldehyde was sampled on DNPH tubes (C18 polymer coated with 2,4-dinitrophenylhydrazin), connected by Teflon tubes to SKC type pumps. Sampling was done for 30 min, with a flow of 1 L min−1 (0.06 m3/h). The tubes were sent to the laboratory and analysed by means of high-pressure liquid chromatography with UV detection according to DS/EN ISO 16000-3:2001 standard [11]. The detection limit was approximately 0.03 µg tube−1, which was equivalent to 1 µg m−3. Estimated uncertainty based on double extractions (two injections of elution from one tube) was 15% of the reported values.
Temperature was measured with an H. Blichfeldt Electronic APS Thermometer T301c No. 840622. Humidity, concentration of CO2 and concentration of N2O (for air change rate assessment) were measured by infrared spectrometry using the gas analyser INNOVA 1312. The air change rate was later calculated on the basis of the decay of tracer gas (N2O).
Emission from Materials and Model Calculations
The measurements included nine wooden boards (three plywood boards, two chipboards, two medium-density fibreboards (MDF) and two oriented strand boards (OSB); used as roof, flooring or furniture materials), two commercially sold pieces of furniture (bookcase and chest of drawers made of chipboard), two types of insulating material (synthetic glassy silica fibre; used as heat insulation for ceiling, walls and floor), two types of paint (both for indoor use; non-glossy and glossy, used, e.g. in bathrooms or kitchens), three types of cleaning agents (one ammonium chloride product for use in kitchen or bathroom and soap and oil–soap for cleaning and maintenance wooden floors), two types of carpet, a roller blind (made of cotton) and a curtain (made of 50% cotton and 50% polyester).
Sample Preparation
After purchasing the wooden boards from construction supply stores, they were placed in a large ventilated room at 20–24°C and 30–50% relative humidity (RH) for 2–3 weeks. Later, they were cut into smaller pieces and wrapped in aluminium foil for transportation to the laboratory. Immediately before testing, they were unwrapped and cut to size [12]. The edges of the wooden boards were partially sealed. The ratio of open (unsealed) edges to surface area of test piece was 1.5 m m−2, which was in agreement with requirements in EN 717-2004 [13].
Test pieces of wooden boards were put into the chamber in such a way that both parts of the panels were exposed. The pieces of furniture were kept and shipped to the laboratory in their original packaging. They were treated the same way as the wooden boards. Since the chest of drawers consisted of several different materials, all parts were included in the testing and their area was calculated by their proportion to normal use.
Insulating materials were kept and shipped to the laboratory in their original packaging. Since sealing of the edges was difficult, the area of the edges was included in the calculation of the total area of each test piece. The pieces were placed in the chamber in a horizontal position, and the area of the bottom part was not included in the total area calculations.
Paints were applied on gypsum board (one side), which was assumed to be free of formaldehyde. The amount of paint applied to the board was calculated on the basis of the manufacturer’s directions (amount of paint per square metre). Two coats were applied. Painted gypsum boards were placed in the chamber immediately after painting and the way they were placed in the chamber horizontally.
Cleaning products were applied on polyvinyl chloride. Since the dilution for normal use was very high, the amount applied was 2–10 times bigger than recommended by the producer. For the product used to clean kitchens or bathrooms, 1:100 dilution was used (instead of 1:1000), and for products for wooden flooring, the dilution used was 1:10 (instead of 1:100 and 1:20). The materials were placed horizontally in the chamber immediately after application.
Carpets were wrapped in aluminium foil immediately after purchasing. They were stored under the same conditions as wooden boards before being sent to the laboratory. They were cut to size at the laboratory and placed in the chamber in a horizontal position. The area of the bottom part was not included in the calculation of the total area of the sample piece.
The roller blind and curtains were kept and shipped to the laboratory in their original packaging. After cutting to size, they were placed on a grill in the chamber, so that both parts were exposed.
Measurement Procedure
The set-up was prepared according to standard DS/EN 717-1:2004 [13], Annex A3. Measurements were made in polished stainless steel chambers with a volume of 0.225 m3. The temperature was kept at 23°C (± 0.5°C) and RH at 45% (± 3 %). The air exchange rate was 1 h−1 (± 0.05 h−1) and the area-specific ventilation rate was 1 m3 m−2h−1. The concentration of formaldehyde was recorded continuously using a Skalar SA 9101 online process analyser (www.skalar.com, Breda, The Netherlands, special model with possibility of formaldehyde measurements, purchased in 2008) with a detection limit of 0.01 mg m−3. In the online process analyser, air sample is mixed with reagents in a reaction vessel and then the sample streams are measured in a two-channel photometer. Here, two light beams pass a flow-cell with sample, where part of the light is absorbed. The transmitted light then passes an interference filter of a specific wavelength and enters a photocell. The signal produced by the photocell is send to electronic section of the instrument, where the signal is treated according to principles of colourimetry in which the transmission of the sample colour is measured by the relative absorption with light compared to a known concentration of the liquid. The Skalar analyser was used to monitor concentration decay and to determine steady state. According to the standard [13], the measurements should be continued until steady state was reached. However, in order to limit expenses, measurements were shortened to 5–6 days if the concentration dropped to 0.01 mg m−3. For samples with higher concentrations, measurements were continued until steady state was achieved (Annex C of DS/EN 717-1:2004 [13]). The final concentration of formaldehyde was also determined manually using the acetyl-acetone method as described in the standard [13] and this value was taken as the final steady-state concentration.
Model Calculations
The maximum expected concentrations of formaldehyde in a model room [14] were calculated based on equation (1)
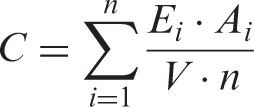
This formula has several assumptions including steady-state emission from the products, which among other things require some ageing of products and constant air temperature and humidity. Moreover, houses are assumed to be single well-mixed zones. Outdoor concentrations of formaldehyde were omitted.
Data Analyses
Characteristics of 19 buildings
One building was excluded from all analyses due to an unusually high air change rate in comparison with other buildings.
Results
Measurements in Buildings
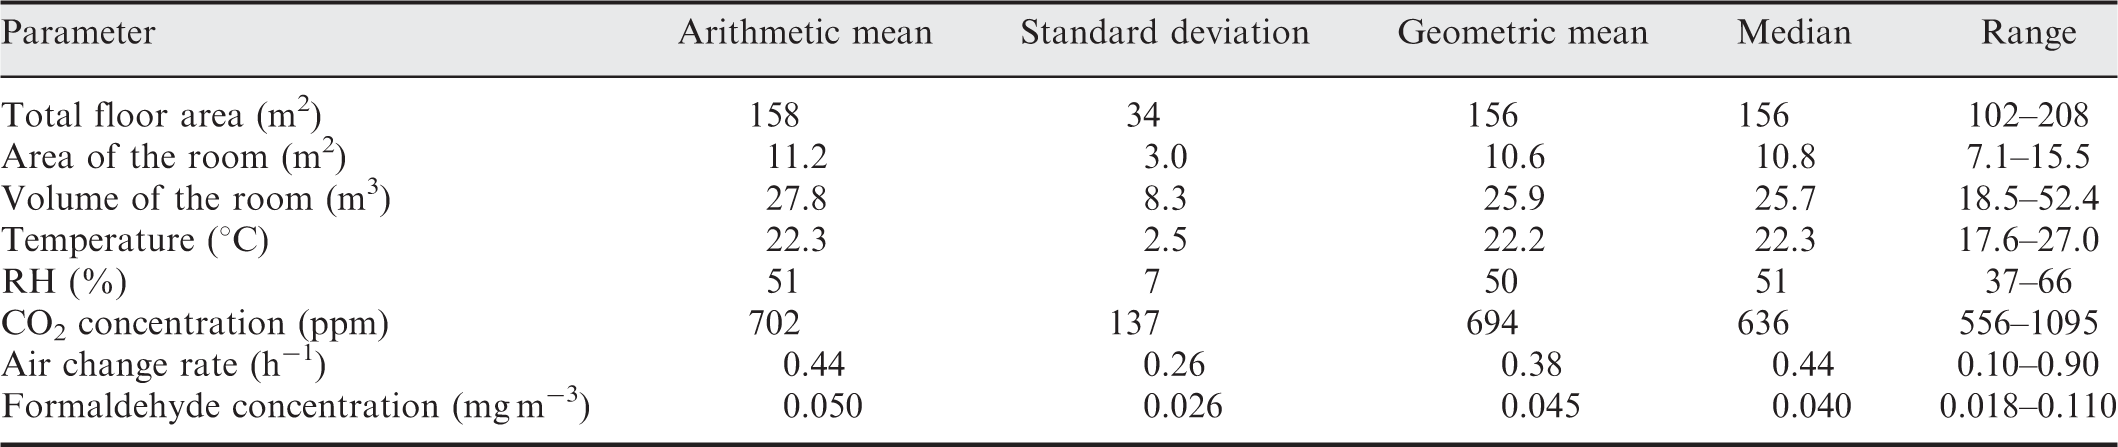
Sixteen detached houses and three row houses were investigated. All the buildings were erected between 2001 and 2007; seven of them were erected before 2004. The air change rate was lower than the required 0.5 h−1 in 13 out of 19 buildings investigated (measured ACH in each room were as follows: 0.10, 0.11, 0.18, 0.20, 0.23, 0.24, 0.27, 0.31, 0.38, 0.44, 0.45, 0.45, 0.49, 0.52, 0.64, 0.73, 0.86, 0.86 and 0.90 h−1). Concentration of CO2 exceeded 1000 ppm in one building. Building characteristics and results of measurements are presented in Table 1.
Geometric mean of formaldehyde was 0.04 mg m−3 (95% CI: 0.02–0.12). Almost half of the buildings had concentrations within the range 0.02–0.04 mg m−3 (Figure 1). In two buildings, the concentrations of formaldehyde were higher than the WHO guideline value of 0.1 mg m−3 [5].
Number of buildings at six intervals of formaldehyde concentration.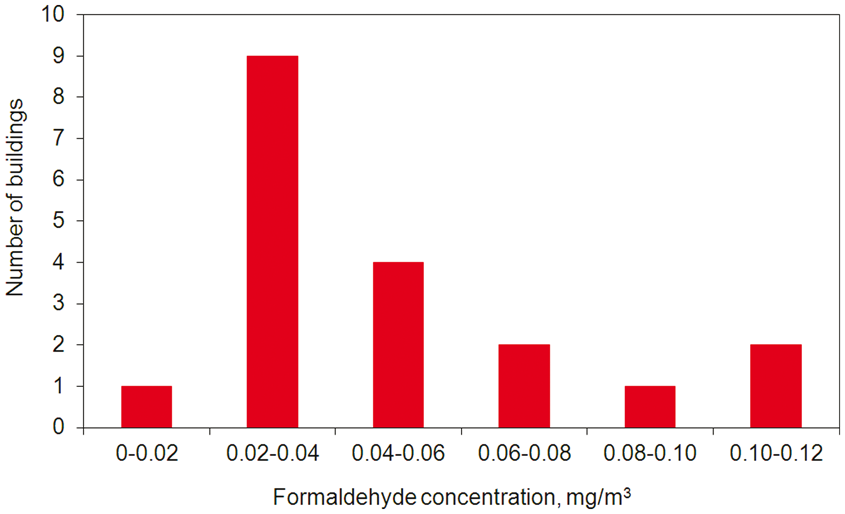
No correlation between concentration of formaldehyde and air change rate was found. Formaldehyde concentration was also not correlated with other parameters measured.
Analyses stratified for total floor area showed notable differences (formaldehyde concentration was 0.043 mg m−3 in buildings with a total area smaller than median and 0.055 mg m−3 in buildings with a total floor area bigger than median), however not significant (p = 0.400) probably due to small sample size. A similar observation was made for year of construction. The mean concentration was 0.042 mg m−3 in buildings built in 2001–2004 and 0.056 mg m−3 in buildings built in 2005–2007 (not significant; p = 0.211). No significant difference was found between either smoking or non-smoking homes (p = 0.661); however the concentrations were higher in buildings where indoor smoking was reported (0.058 vs. 0.047 mg m−3). Smoking did not occur during the sampling period in any of the buildings.
Emission from Materials and Model Calculations
Emission from Materials
Initial and steady-state formaldehyde concentrations (mg m−3) in emission chamber
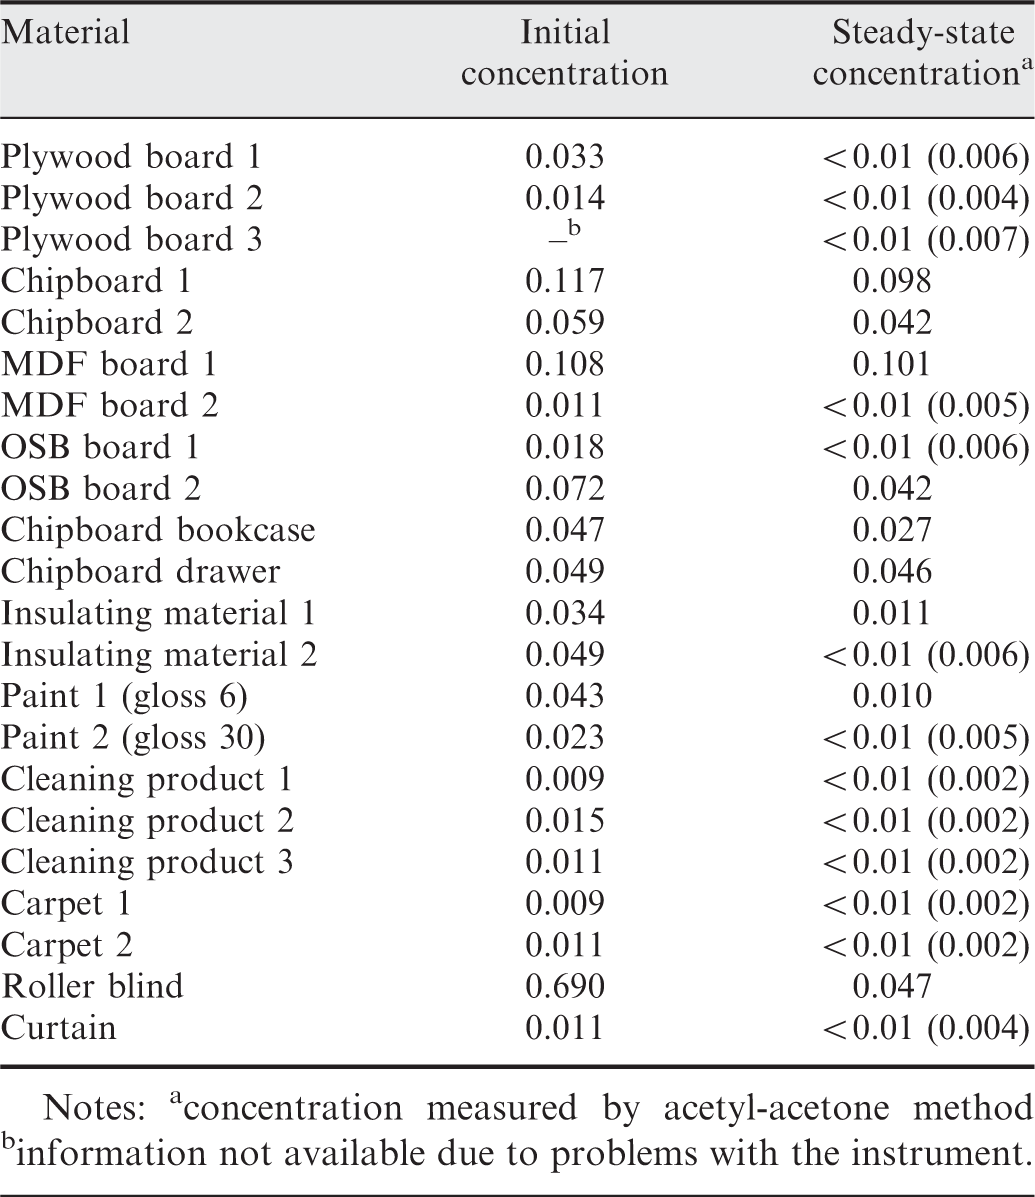
Notes: aconcentration measured by acetyl-acetone method binformationnot available due to problems with the instrument.
Plywood boards, insulating materials, paints, carpets and cleaning products were among the products with very low steady-state concentrations. Chipboard panels as well as chipboard products (bookcase and drawer) had a higher formaldehyde emission; the maximum steady-state emission was 0.098 and the minimum 0.027 mg m−2 h−1. Differences were found between individual MDF boards. One board emitted very little formaldehyde whereas the other had the highest emission rate of formaldehyde measured in this study (0.101 mg m−2 h−1). Similar observations were made for OSB panels and textile solar shadings.
None of the products tested in this study exceeded the permissible maximum concentration of formaldehyde in the chamber for E1 class materials [7].
The shape of a curve showing formaldehyde concentrations over time of measurement differed across investigated products (Figure 2). While first-order exponential decay was observed for plywood boards and insulating materials, MDF and OSB boards showed a relatively constant emission during the whole duration of the measuring period. The data recorded for wet products (paints and cleaning agents) were spread very widely; however, they oscillated around a constant value rather than decayed.
Formaldehyde emission from insulating material 2 and OSB 1.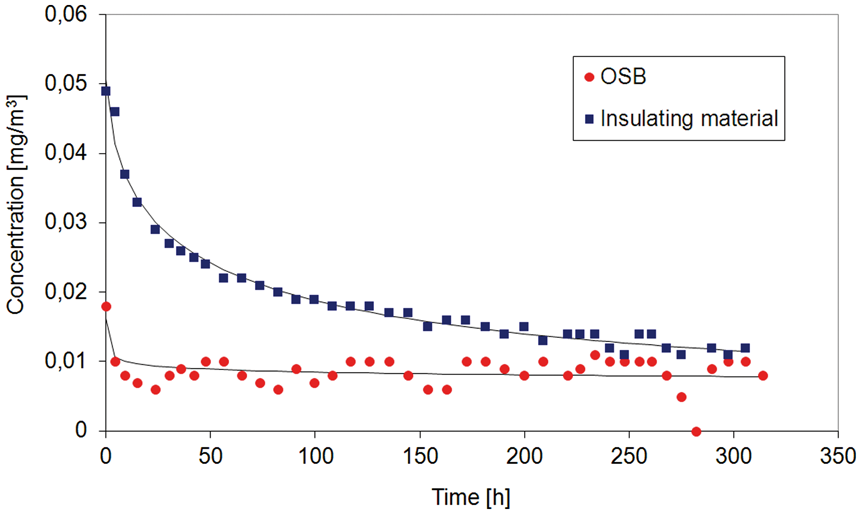
Model Calculations

In the model room [14] with a floor area of 7 m2, wall area 24 m2 and volume 17.4 m3, ventilated by 0.5 h−1 of outdoor air, formaldehyde concentration could be as high as 0.12 mg m−3 if the ceiling and walls were painted with paint 1 (formaldehyde steady-state emission 0.01 mg m−2 h−1) and floor covered with MDF 1 (formaldehyde steady-state emission 0.1 mg m−2 h−1). Similar concentrations were obtained when the calculations were made for the actual rooms measured in the first part of the project (the smallest and the largest rooms, mean air change rate measured in the first part of the project). Moreover, if these calculations were based on the highest possible emission for E1 products (0.124 mg m−3, [7]) and all surfaces (ceiling, walls and floor) were made of products emitting formaldehyde at this level, the concentration was estimated to be up to 0.58 mg m−3, which is almost six times the WHO limit. This calculation did not include emissions from furniture, textiles, carpets, cleaning products, etc., thus, the real value could be even higher.
Discussion
Measurements in Dwellings
Ten per cent of the residential buildings investigated in the first part of this study had formaldehyde concentration in indoor air higher than the maximum concentration recommended by WHO. In this study, concentrations of formaldehyde were measured in 20 new residential buildings, all having wooden floors. The selected new buildings are not representative for the whole population of Danish residential buildings. However, the results show that the current restrictions for formaldehyde emission could not assure safe formaldehyde exposure levels for residents.
Not any previous studies with measurements of formaldehyde concentrations in indoor air in Danish dwellings have taken place. In 1989, the mean formaldehyde concentrations over 7–12 days was measured by passive sampling in 102 houses in eastern part of Zealand, Denmark [15]. The houses were built between 1982 and 1989 and all had mechanical exhaust. Formaldehyde concentration in the single-family houses was on an average 0.009 mg m−3 while in the apartments 0.010 mg m−3. The study showed no correlation between formaldehyde concentration and smoking, total floor area, air exchange rate or number of inhabitants per square metre. The concentrations measured in the study were surprisingly low in comparison to other studies performed in that period of time. Recently, concentration of formaldehyde was measured in bedrooms of 378 children, by means of passive sampling [16]. Three measurements were taken in each house during 18 months, each lasting 10 weeks. The average concentration was 0.020 mg m−3, with 95% confidence interval 0.037 mg m−3.
Formaldehyde concentrations measured in buildings in previous recent studies (publication year not older than 2000)
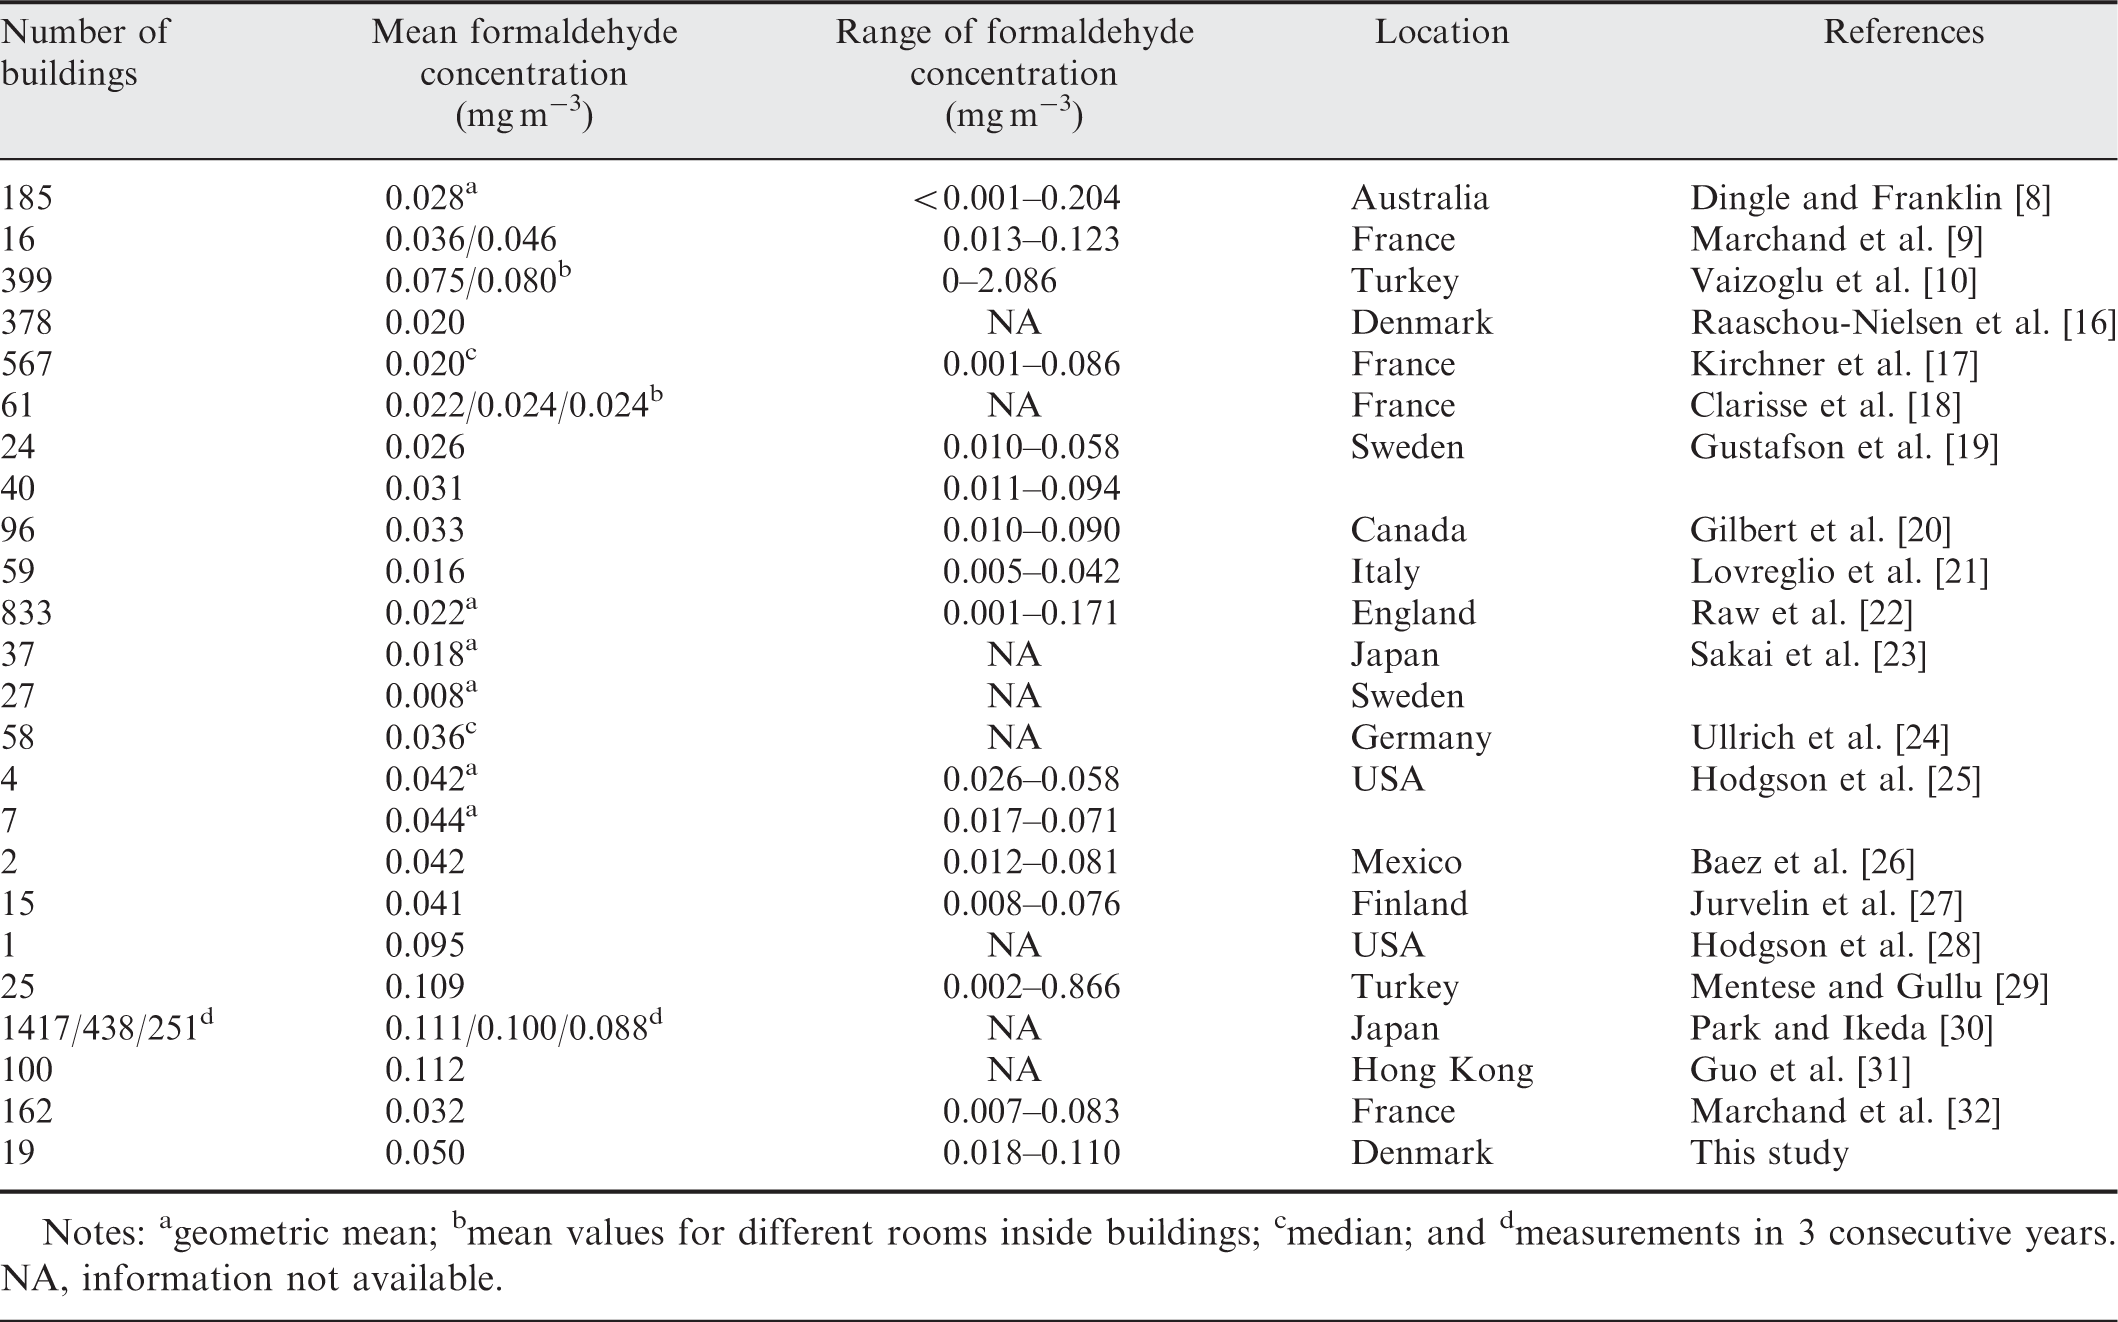
Notes: ageometric mean; bmean values for different rooms inside buildings; cmedian; and dmeasurements in 3 consecutive years. NA, information not available.
Relatively high concentration of formaldehyde (0.095 mg m−3) was measured in a new manufactured house in Florida, USA [28], approximately 3 months after installation. Hodgson et al. [25] measured concentrations of formaldehyde in four newly manufactured houses over 2–9.5 months following installation and in seven new site-built houses 1–2 months after completion. The sampling time and measuring methodology were similar to this study. Mean concentrations measured in both studies were similar. However, none of the US houses had formaldehyde concentrations higher than maximum concentration recommended by WHO. The Danish houses were all with structures made by concrete or brick, while most of the US houses had structures made by wood and steel. These important differences apparently did not result in differences between formaldehyde readings.
The weak correlation between concentration of formaldehyde and age of residential buildings found in this study is in agreement with some previous findings. Investigation of environmental conditions, including measurements of formaldehyde concentration over a period of 3 years, was conducted in Japan [30]. In the first year, the samples were collected in 1417 homes, from which 483 homes were selected for measurements in year 2 and 251 in year 3. The homes were divided into two groups: new homes (<6 months) and older homes (>6 months). In the first 2 years of measurements, concentrations of formaldehyde were higher in the new homes than in the older ones (0.134 vs. 0.088 mg m−3 in year 1 and 0.112 vs. 0.089 mg m−3 in year 2). Moreover, for the new homes, there was a statistical tendency for levels of formaldehyde to decrease in the period, which was not found for the older homes.
Statistically significant negative correlation between the age of the buildings and formaldehyde concentration was also found in 185 buildings located in Perth, Australia [8] and in 833 English homes [22]. Concentrations of formaldehyde were significantly higher in dwellings aged 10 years or less than in those aged 11 or more in Nagoya, Japan [23], and significant effect of building ageing on levels of formaldehyde was also found in Hong Kong [31].
Marchand et al. [32] found significantly higher concentrations in homes built after 1995 (n = 28) than in homes built before 1995 (n = 129). Moreover, concentrations of formaldehyde tend to decrease with increasing furniture age in the room where measurements were performed. This tendency was however not significant (p = 0.11). Similarly, Clarisse et al. [18] reported negative correlation between concentrations of formaldehyde and the age of floor covering in a study conducted in 61 flats in Paris, France and significantly higher concentrations of formaldehyde were also found in Italian homes where furniture had been bought or restored less than a year before [21].
On the contrary, no correlation between formaldehyde levels and the age of the buildings was found in 399 buildings in Ankara, Turkey [10], in 96 dwellings in Quebec City, Canada [20], in 64 houses in Sweden [19] and in 22 buildings in Strasbourg, France the relationship between formaldehyde concentration and age was not clear [9]. High concentrations were measured in one of two newly erected buildings (<2 years), while the second building showed lower formaldehyde levels.
Emission from Materials and Model Calculations
In the second part of our study, emission of formaldehyde was measured from a range of building and finishing products. It was done in order to check whether current Danish requirement for emission from wooden panels is fulfilled and to look for other possible strong sources of formaldehyde among products that are not under the regulation for wooden panels and which could explain the relatively high concentrations that we measured in real buildings.
Our results were comparable to or lower than concentrations measured in earlier studies. Kelly et al. [33] investigated formaldehyde emission rates from a wide selection of materials, including both dry and wet products. The concentrations varied from below 0.001 mg m−3 for melamine laminated products up to 0.73 mg m−3 for urea–formaldehyde bonded chipboard. For non-laminated products, the lowest emission was measured from plywood boards (4.1–170 µg m−2 h−1, which corresponded to 0.002–0.078 mg m−3) and the highest from chipboard (104–1580 µg m−2 h−1, which corresponded to 0.048–0.727 mg m−3). Low emission from plywood and higher from chipboard was also measured in this study; however, the maximum steady-state concentrations was seven times lower than in Kelly et al. [33]. Paints investigated by Kelly et al. [33] were characterized by relatively high initial concentrations (up to 0.53 mg m−3) and up to 65 times lower than steady-state concentrations. In our study, the difference between initial and steady-state concentrations was much smaller, which indicates a much smaller content of formaldehyde in paints today than in the late 1990s.
Brown [34] measured formaldehyde emission from MDF and chipboard panels. The measurements started 7 days after the materials were manufactured and continued for 20 days. After completion of the emission experiments, the panels were stored in a controlled environment for several months, after which long-term formaldehyde emission was measured for 2 days. Brown [34] reports initial concentration to be higher for chipboard panels (0.159–0.219 mg m−3) than MDF panels (0.131–0.156 mg m−3). Formaldehyde emission in the first weeks after manufacture was well described by a first-order exponential decay model, but the decay was more pronounced for chipboard panels. When the results from the long-term measurements were included in the model, decay rates became much slower and emissions were consistent with a double exponential decay model; initially, the decay was quick but much slower after some weeks. We do not know the date of manufacture of the materials that we investigated in the present experiment, neither were the materials specially selected, but purchased as they would be by an ordinary customer. The gentle slope of the decay curve for some of the products could, therefore, be probably explained by the long storage time. Furthermore, rather quick first-order decay might indicate the release of a constant amount of formaldehyde diluted in the material, while more constant emission rates might indicate production of formaldehyde based on decomposition of more complex chemicals in the material.
Formaldehyde emissions from all the products investigated in this study were below the limits for emission from wooden panels that are mandatory in Denmark. Thus, the results did not identify any other strong potential sources of formaldehyde in Danish residential buildings. Since unknown sources could not explain the relatively high concentrations that we measured during the first part of the project, we put forward a hypothesis that the high concentrations were not due to one strong source but rather due to small contributions from many regulated sources. Based on emissions measured in this study as well as the highest permissible emissions for E1 products [7], we performed calculations of maximum expected formaldehyde concentration in different room types. These calculations seemed to confirm our hypothesis (Table 3). The calculations show that just by painting the walls and ceiling with one of the paints investigated in our study (paint 1, formaldehyde steady-state emission 0.01 mg m−2h−1) and by covering the floor with either MDF or chipboard panels (formaldehyde steady-state emission 0.1 mg m−2h−1), concentrations of formaldehyde in indoor air up to 1.2 mg m−3 can be explained. Moreover, using materials with the highest possible emission for E1 products (0.124 mg m−3, [7]) can increase the concentration of formaldehyde by a factor of 6.
Similar formula has been used to calculate minimum ventilation rates for dwellings based on formaldehyde concentrations measured in newly manufactured and site-built houses [35]. As discussed in Sherman and Hodgson [35], this formula has certain number of simplifying assumptions. Formaldehyde emission factors are treated as if they are independent concentrations and the effects of temperature and humidity are ignored and houses are treated as single well-mixed zones. In additions to it, outdoor concentrations have not been measured in our study; thus, they were also omitted in the calculations. However, as shown in other studies [19,23], outdoor concentrations of formaldehyde are usually negligible in comparison to indoor concentrations.
Sherman and Hodgson [35] calculated 0.28 h−1 as a minimum ventilation rate, which would be sufficient to keep average exposure to formaldehyde below 100 ppb in 99% of the US population of new houses. Using data from the first part of this study, a minimum ventilation rate would be sufficient to keep the average exposure to formaldehyde below 100 ppb in 99% of the population of new houses in Denmark and this would be about 0.49 h−1, while aiming at concentrations lower than maximum concentration recommended by WHO would give a minimum ventilation rate of 0.60 h−1. Moreover, if all the surfaces would be covered with materials emitting maximum allowable formaldehyde emission (0.54 mg m−3 as calculated for model room), the air change rate required to decrease the concentrations to WHO level would be 2.8 h−1. All these calculations clearly show that recent regulations for minimum ventilation in Danish dwellings (0.35 L s−1 m−2, which for a room with a 2.5 m height gives 0.5 h−1) together with the highest permissible emissions of formaldehyde for E1 products in Denmark (0.124 mg m−3) would not meet the WHO recommendations for formaldehyde exposure in non-industrial buildings.
Conclusions
Although emissions from all tested building materials fulfilled the Danish and EU requirements, concentration of formaldehyde in two of the investigated buildings (10%) exceeded the WHO guideline value of 0.1 mg m−3.
Geometric mean concentration of formaldehyde in the indoor air of the 19 new residential buildings was 0.04 with 95% CI being 0.02–0.12.
The emission of formaldehyde measured in the second part of the study was found to be the highest from the investigated samples of chipboard and MDF; however, both initial and steady-state concentrations of formaldehyde emissions were below limits for wood-based panels that are mandatory in Denmark and EU.
Model calculations of maximal formaldehyde concentration in a room finished with the investigated materials resulted in concentrations far above 0.1 mg m−3. This could explain the high concentrations measured in the new residential buildings. It also demonstrated that European requirements regarding maximum allowable emission of formaldehyde from wooden products could not assure concentrations in indoor air to be below the WHO guideline value.
Footnotes
Figures 1 and ![]() appear in colour online
appear in colour online
Acknowledgments
This study was supported by Danish Enterprise and Construction Authority. We gratefully acknowledge Solveig Nissen for revising the language.