
Abstract
Transport of infectious particles through the air has the potential to contaminate the indoor environment creating reservoirs of infectious material on surfaces. There is evidence that typical nursing activities can release large quantities of bacteria including MRSA into the hospital air, which may lead to surface contamination thereby increasing opportunities for further spread. Air sampling studies were conducted over a period of 5 days on a four-bed bay in a respiratory ward. Results showed that sampled bioaerosols are more likely to be carried on large particles >5 µm in diameter, and that the relationship between bioaerosols and particle size varies when respiratory interventions are in use. Increased activity in the hospital bay was shown to correlate to increased concentrations of bioaerosols whereas sedentary visitors did not. In particular, the occurrence of patient washing that occurred behind closed curtains correlated to large values of bioaerosol release. Floor cleaning generated large number of particles, but with no significant increase in sampled bioaerosols. This provides valuable information for understanding when and where bioaerosols are released on a hospital ward which may inform future research into physical segregation of patients and the definition of bioaerosol sources in computer simulations.
Introduction
Health care environments are notorious for enabling the proliferation of certain diseases due to the close proximity of infected individuals and immunocompromised persons [1]. Contact spread is well accepted to be the principle mode of transport for most pathogens in the health care setting and handwashing provides an important role in reducing the spread of infection [2]. However, there is also evidence that airborne dispersal can contribute to this spread, both through true airborne infection and through deposition on surfaces to create environmental reservoirs of pathogens [3]. Indeed, the use of air cleaning devices has been shown to reduce the levels of methicillin-resistant Staphylococcus aureus (MRSA) contamination on surfaces [4]. Although the role a contaminated environment plays in infection outbreaks is hard to prove, bacteria is known to transfer from surfaces to the hands of health care workers’ (HCW’s) [5–7] and outbreaks of MRSA have been shown to only become controlled once the pathogen has been completely removed from the environment [8].
Airborne dispersal of bacteria can occur by a variety of means within a hospital ward. Direct release from people can occur during coughing, sneezing, vomiting or diarrhoea [9]. They may also be generated through tracheostomies and bronchoscopies and the use of oxygen masks or nebulisers [10]. Some pathogens, in particular S. aureus [11,12] and MRSA [13], may also be released on skin squame due to common nursing activities such as bedmaking, undressing and washing [14–16]. Curtains have been found to be contaminated with bacteria such as Acinetobacter [17] and have been shown to release S. aureus upon vigorous movement [11]. Other specific bacteria to be sampled from the air include Pseudomonas aeruginosa and Burkholderia cepacia, which have been shown to be released into the air on respirable sized particles [18] from patients coughing as well as after nebuliser use [19].
Although there are many studies indicating the dispersion of bacteria during individual activities, these tend to concentrate on only the short periods during the activity [11,20] or take place in individual side rooms [12,13] rather than consider the overall activity within a ward. The most general study was conducted by Greene et al. [21]; however, this was mainly concerned with comparing bioaerosol concentrations between two hospitals and different areas within the hospital rather than the effect of individual activities on bioaerosol fluctuations over time. It should also be noted that the study took place in 1962 and medical interventions, cleaning methods and curtain and bedding materials have changed in the intervening years. In addition, the ability to measure particles in the built environment has moved on substantially. As such, the aim of the study reported here was to monitor the daily fluctuations of airborne particles and bioaerosols on a hospital ward whilst observing the activity taking place, with the objective of correlating bioaerosol concentration with specific activities.
A brief pilot study on two bays of a respiratory ward showed that the movement of people and bedmaking contributed to the airborne counts of particles >3 µm in diameter [22]. The current study expands on this work, sampling over 5 days and incorporating statistical analysis of the results to correlate concentrations of airborne particles and bioaerosols to the daily activities within the ward.
Methods
Air sampling and simultaneous observations were carried out on 5 days, between 8 am and 11 am on day 1 and between 8 am and 4 pm on the remaining days. The study took place in a four-bed, high-dependency bay on a respiratory ward during August 2007. Information on the patients’ health and infectivity is not known. The bay housed a mix of patients, with some bed-bound, some sitting out in the bedside chair during the day and some moving around the ward independently. The individual patients varied across the different study days. A plan of the ward and location of sampling equipment is shown in Figure 1. The ward has a hybrid ventilation system with air entering through windows facing east and leaving via windows and mechanical extracts located in the corridor. Ventilation extracts are indicated in Figure 1; however, the air flow rate and direction is difficult to quantify due to high levels of air leakage and unknown use of windows in adjacent bays. Temperature and relative humidity were measured at six locations in the bay and on the corridors during the study.
Plan of study bay and surroundings.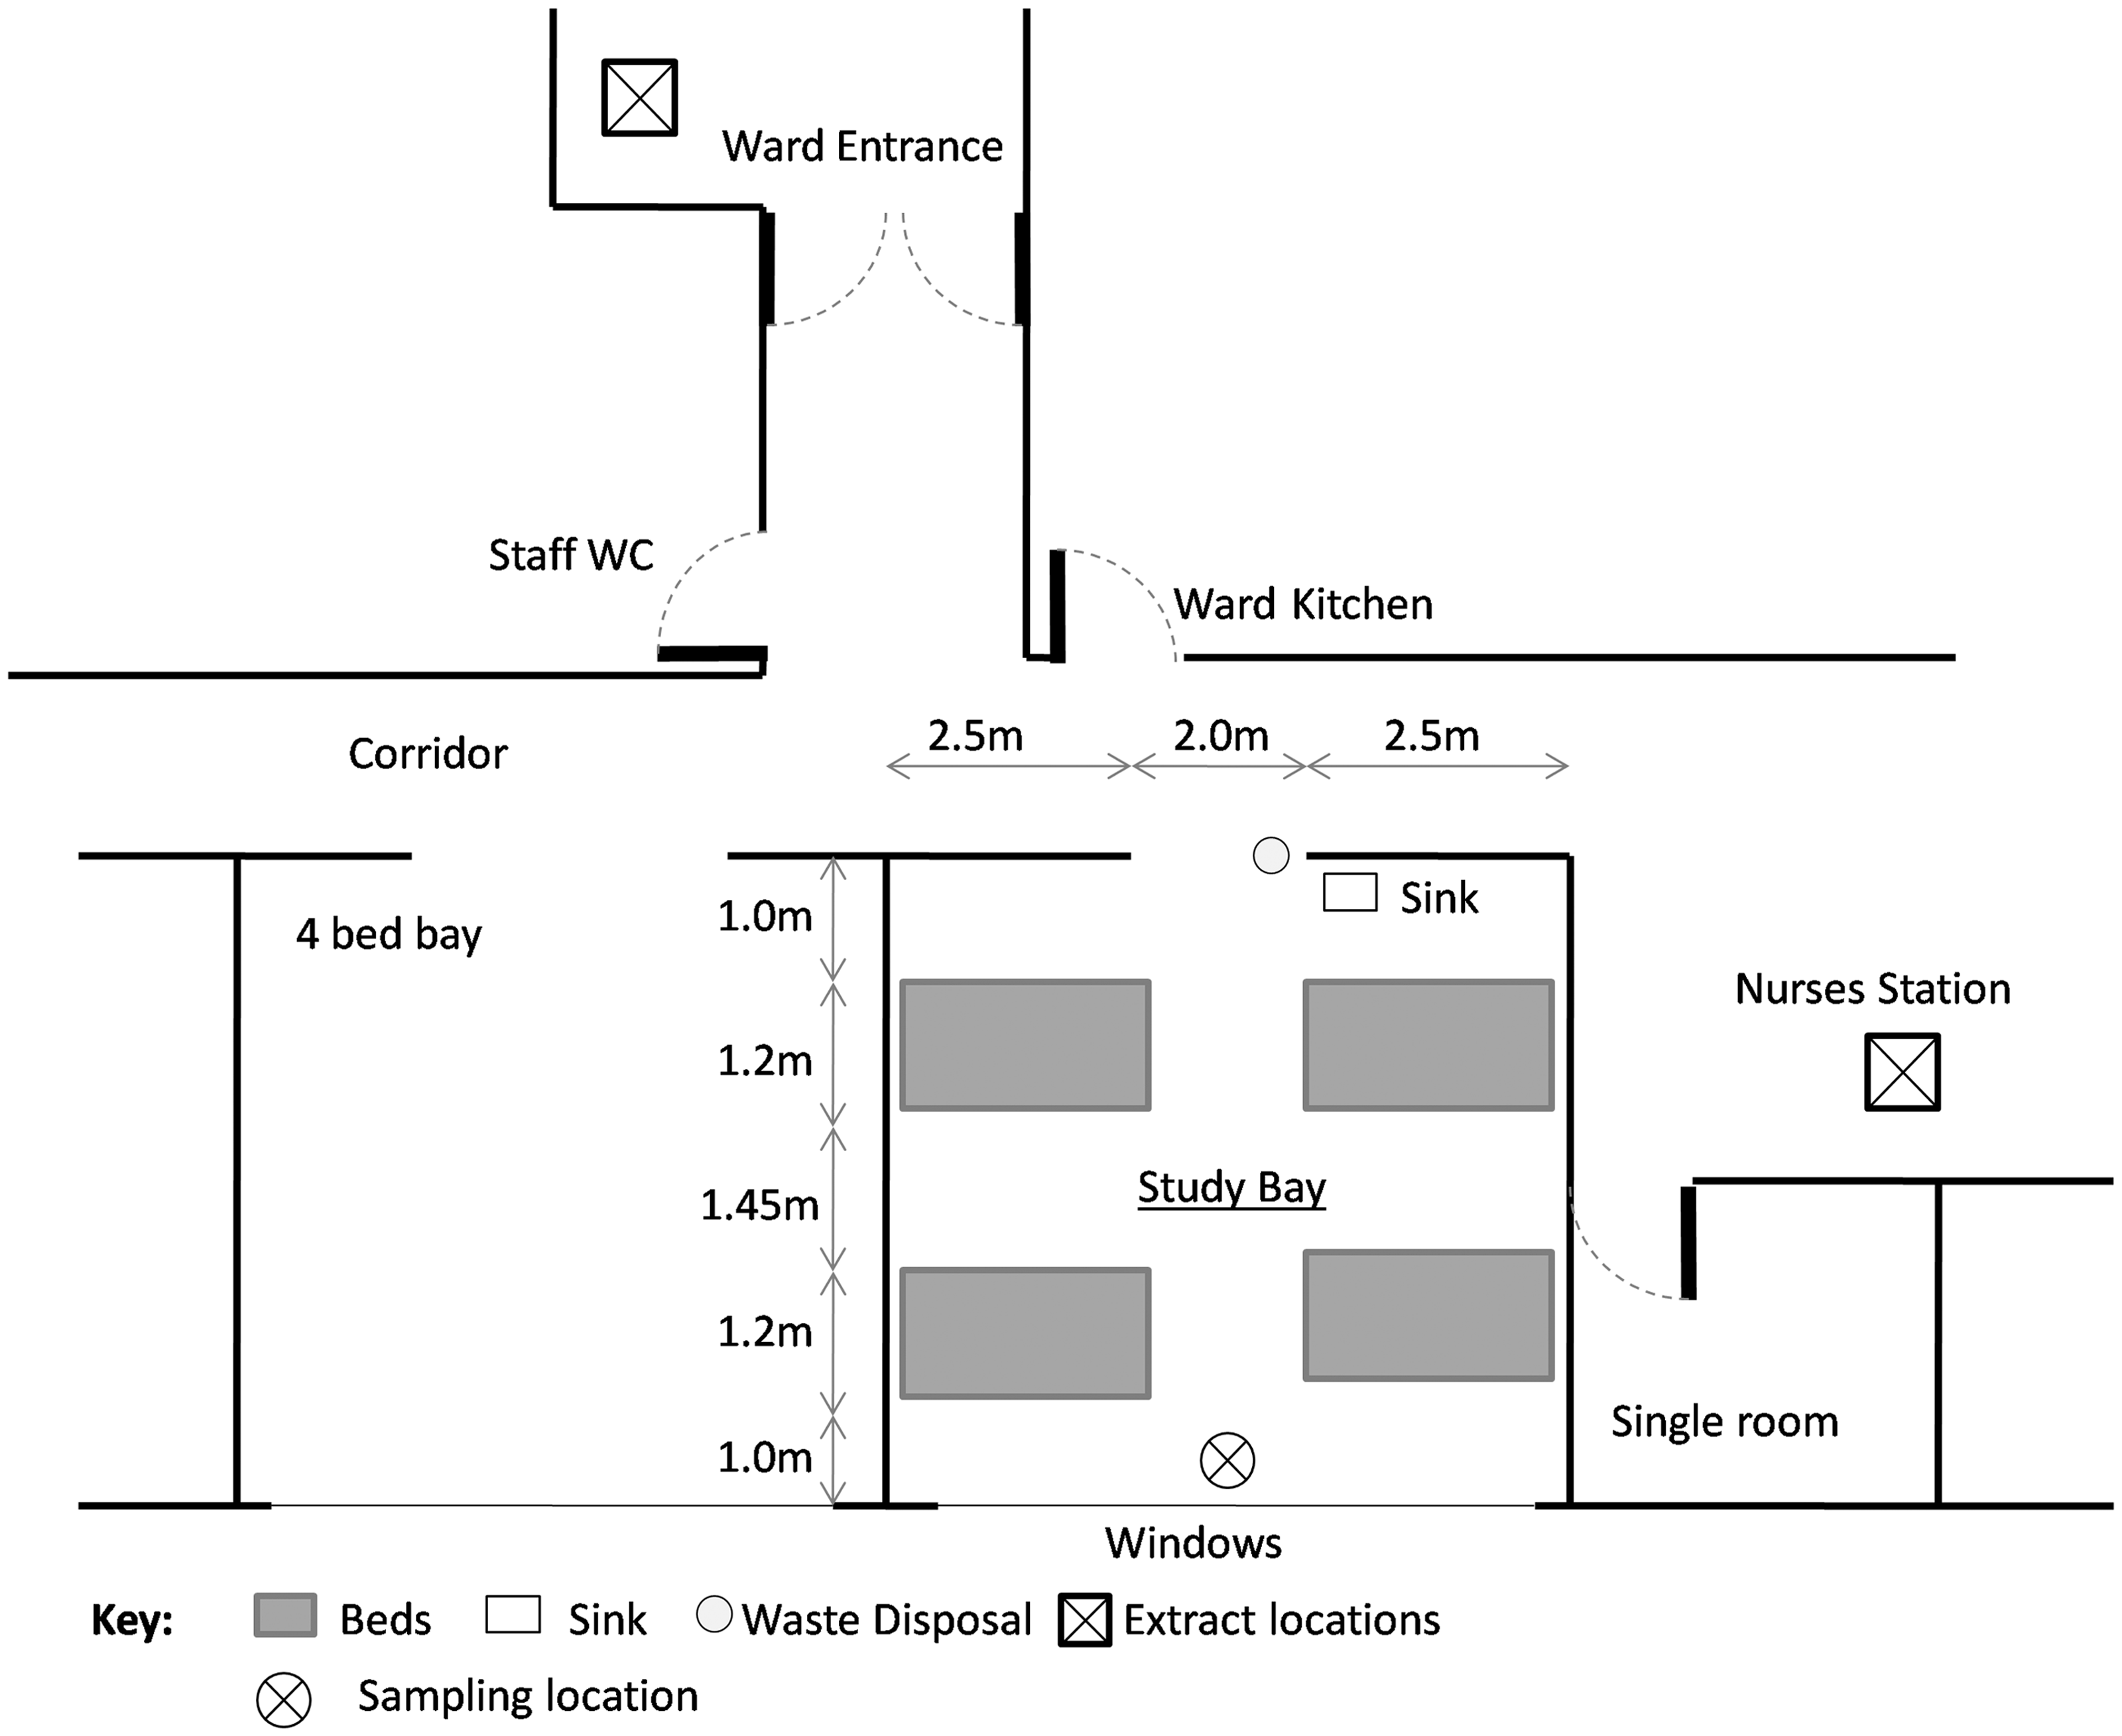
Air sampling was carried out to enumerate inert particles and viable bioaerosols. Air was sampled every 15 min using a Microbio MB2 bioaerosol sampler (Fred Parrett UK) to determine a total viable count (TVC). The sampler was run at 500 L/min for 5 min on each occasion. On two of the study days, a second identical sampler was used to sample for Staphylococcus spp and to differentiate for S. aureus.
Air was sampled onto Tryptone Soya Agar for TVC and incubated for 24 h at 37°C. Positive hole correction was applied to the resulting counts [23]. For S. aureus, air samples were taken on Mannitol Salt Agar and incubated for 24 h at 37°C. Yellow colonies were sampled and Gram stained, checked to be cocci using a microscope at ×1000 magnification and the presence of coagulase was ascertained using the Staphylase test (Oxoid, UK).
Airborne particle concentration was measured using a Kanomax 3886 laser particle counter (Optical Sciences Ltd. UK). This was run continuously over the study period summing particles over 5-min intervals in five distinct size ranges; 0.3–0.5 µm, 0.5–1 µm, 1–3 µm, 3–5 µm and >5 µm. Correlations between each size range in the pilot study [22] showed that the two smallest size ranges (0.3–1 µm) correlated strongly to particles 1–3 µm. However, particles >5 µm did not show strong relationships to the smaller particles and hence appeared to either be produced from separate sources or were transported via a different mechanism through the air. Similar results were found in this study and hence the following work will only discuss particles in the 1–3 µm and >5 µm ranges, termed “small” and “large” particles, respectively.
Nursing activities were recorded continuously throughout the day. Observed activities included: number of hospital staff in the bay, number of HCWs at the bedside, washing of patients, bedmaking, use of commode, curtain movement, cleaning, use of nebulisers and ventilators and presence of visitors in the bay. These were all quantified by occurrence and time into an activity level by summing the number of people performing an activity multiplied by the duration over 5-min periods. For example, if two nurses were making beds for 3 min, the level for “bedmaking” would be quantified as six. This allows comparison within an activity at different times of the day, but levels cannot be directly compared between distinct activities. The number of HCWs at a bedside was quantified separately from generic hospital staff activity to differentiate between specific nursing activities and other activities such as handing out meals. For the purposes of this paper “hospital staff” includes all employees in the building including doctors, nurses, porters and housekeeping staff. The HCWs category only considered a person directly dealing with a patient at their bedside for longer than 1 min. This only included clinical staff such as nurses, doctors and physiotherapists and deliberately excluded activities such as drug rounds or handing out meals. Therefore, this “activity” accounted for times when HCWs were interacting with a patient, and not just their presence in the ward. Events that may impact on the results, such as the windows being opened, were also noted during the observations.
Times when window was opened or ventilator was in use

Analysis of the results took place in three stages:
Non-selective bacterial TVC samples were compared to selective samples for Staphylococcus spp and S. aureus to establish if the patterns were similar, and hence if relationships between activities and TVC could be used as a marker for likely release mechanisms for S. aureus. Particle fluctuations were compared to bioaerosol TVC data to evaluate which particle size was most likely to be responsible for carrying sampled viable microorganisms both during patient ventilation and at times when ventilators were not in use. This analysis also included data from the pilot study [22] as it was directly comparable. Fluctuations in bioaerosol and particle concentrations were compared to observational data. In each case, a detailed review of all activities in the hour preceding a large increase in sampled particles or bioaerosols was carried out.
Monitored temperature and humidity from six locations in the bay and adjacent corridor was also consulted; however, the only significant changes were when the window was opened, which was accounted for in the statistical analysis. Following this, activities identified as being potentially responsible for increase in bioaerosols were analysed using correlation analysis. The Kolmogorov-Smirnov test for normality and histograms indicated that the data was not normally distributed. As such, the non-parametric test, Spearman’s Rho, was applied to evaluate correlation [24]. This gives a statistic, r, between −1 and 1, indicating the strength of the relationship and whether it is positive or negative. In order to evaluate combined activities, such as the effect of washing from the movement of curtains, partial correlation was carried out using the rank scores of the activities (rather than the counts) due to the non-normal distribution of the data.
Results and Discussion
Comparisons between TVC and Staphylococci
The correlation between TVC and both Staphylococci and S. aureus was significant and positive with r = 0.770; p<0.01; n = 31 and r = 0.535; p<0.01; n = 31, respectively. Figure 2 shows the fluctuations of TVC alongside Staphylococci and S. aureus over the 2 days when all three were sampled. Although values of Staphylococci are lower, they increase at the same time as peaks in TVC. The correlation between S. aureus and TVC is understandably lower than between Staphylococci and TVC as the number of S. aureus colonies per sample plate was between one and four as opposed to hundreds for TVC and Staphylococci. Although the correlation to S. aureus was not as strong, there is nevertheless a positive correlation and the presence of S. aureus corresponded to high levels of TVC being sampled (Figure 2). As such, it is reasonable to treat activity-bioaerosol correlations as a marker for the likely behaviour of S. aureus.
Fluctuations of total viable count (TVC), Staphylococci and S. aureus on days 4 and 5.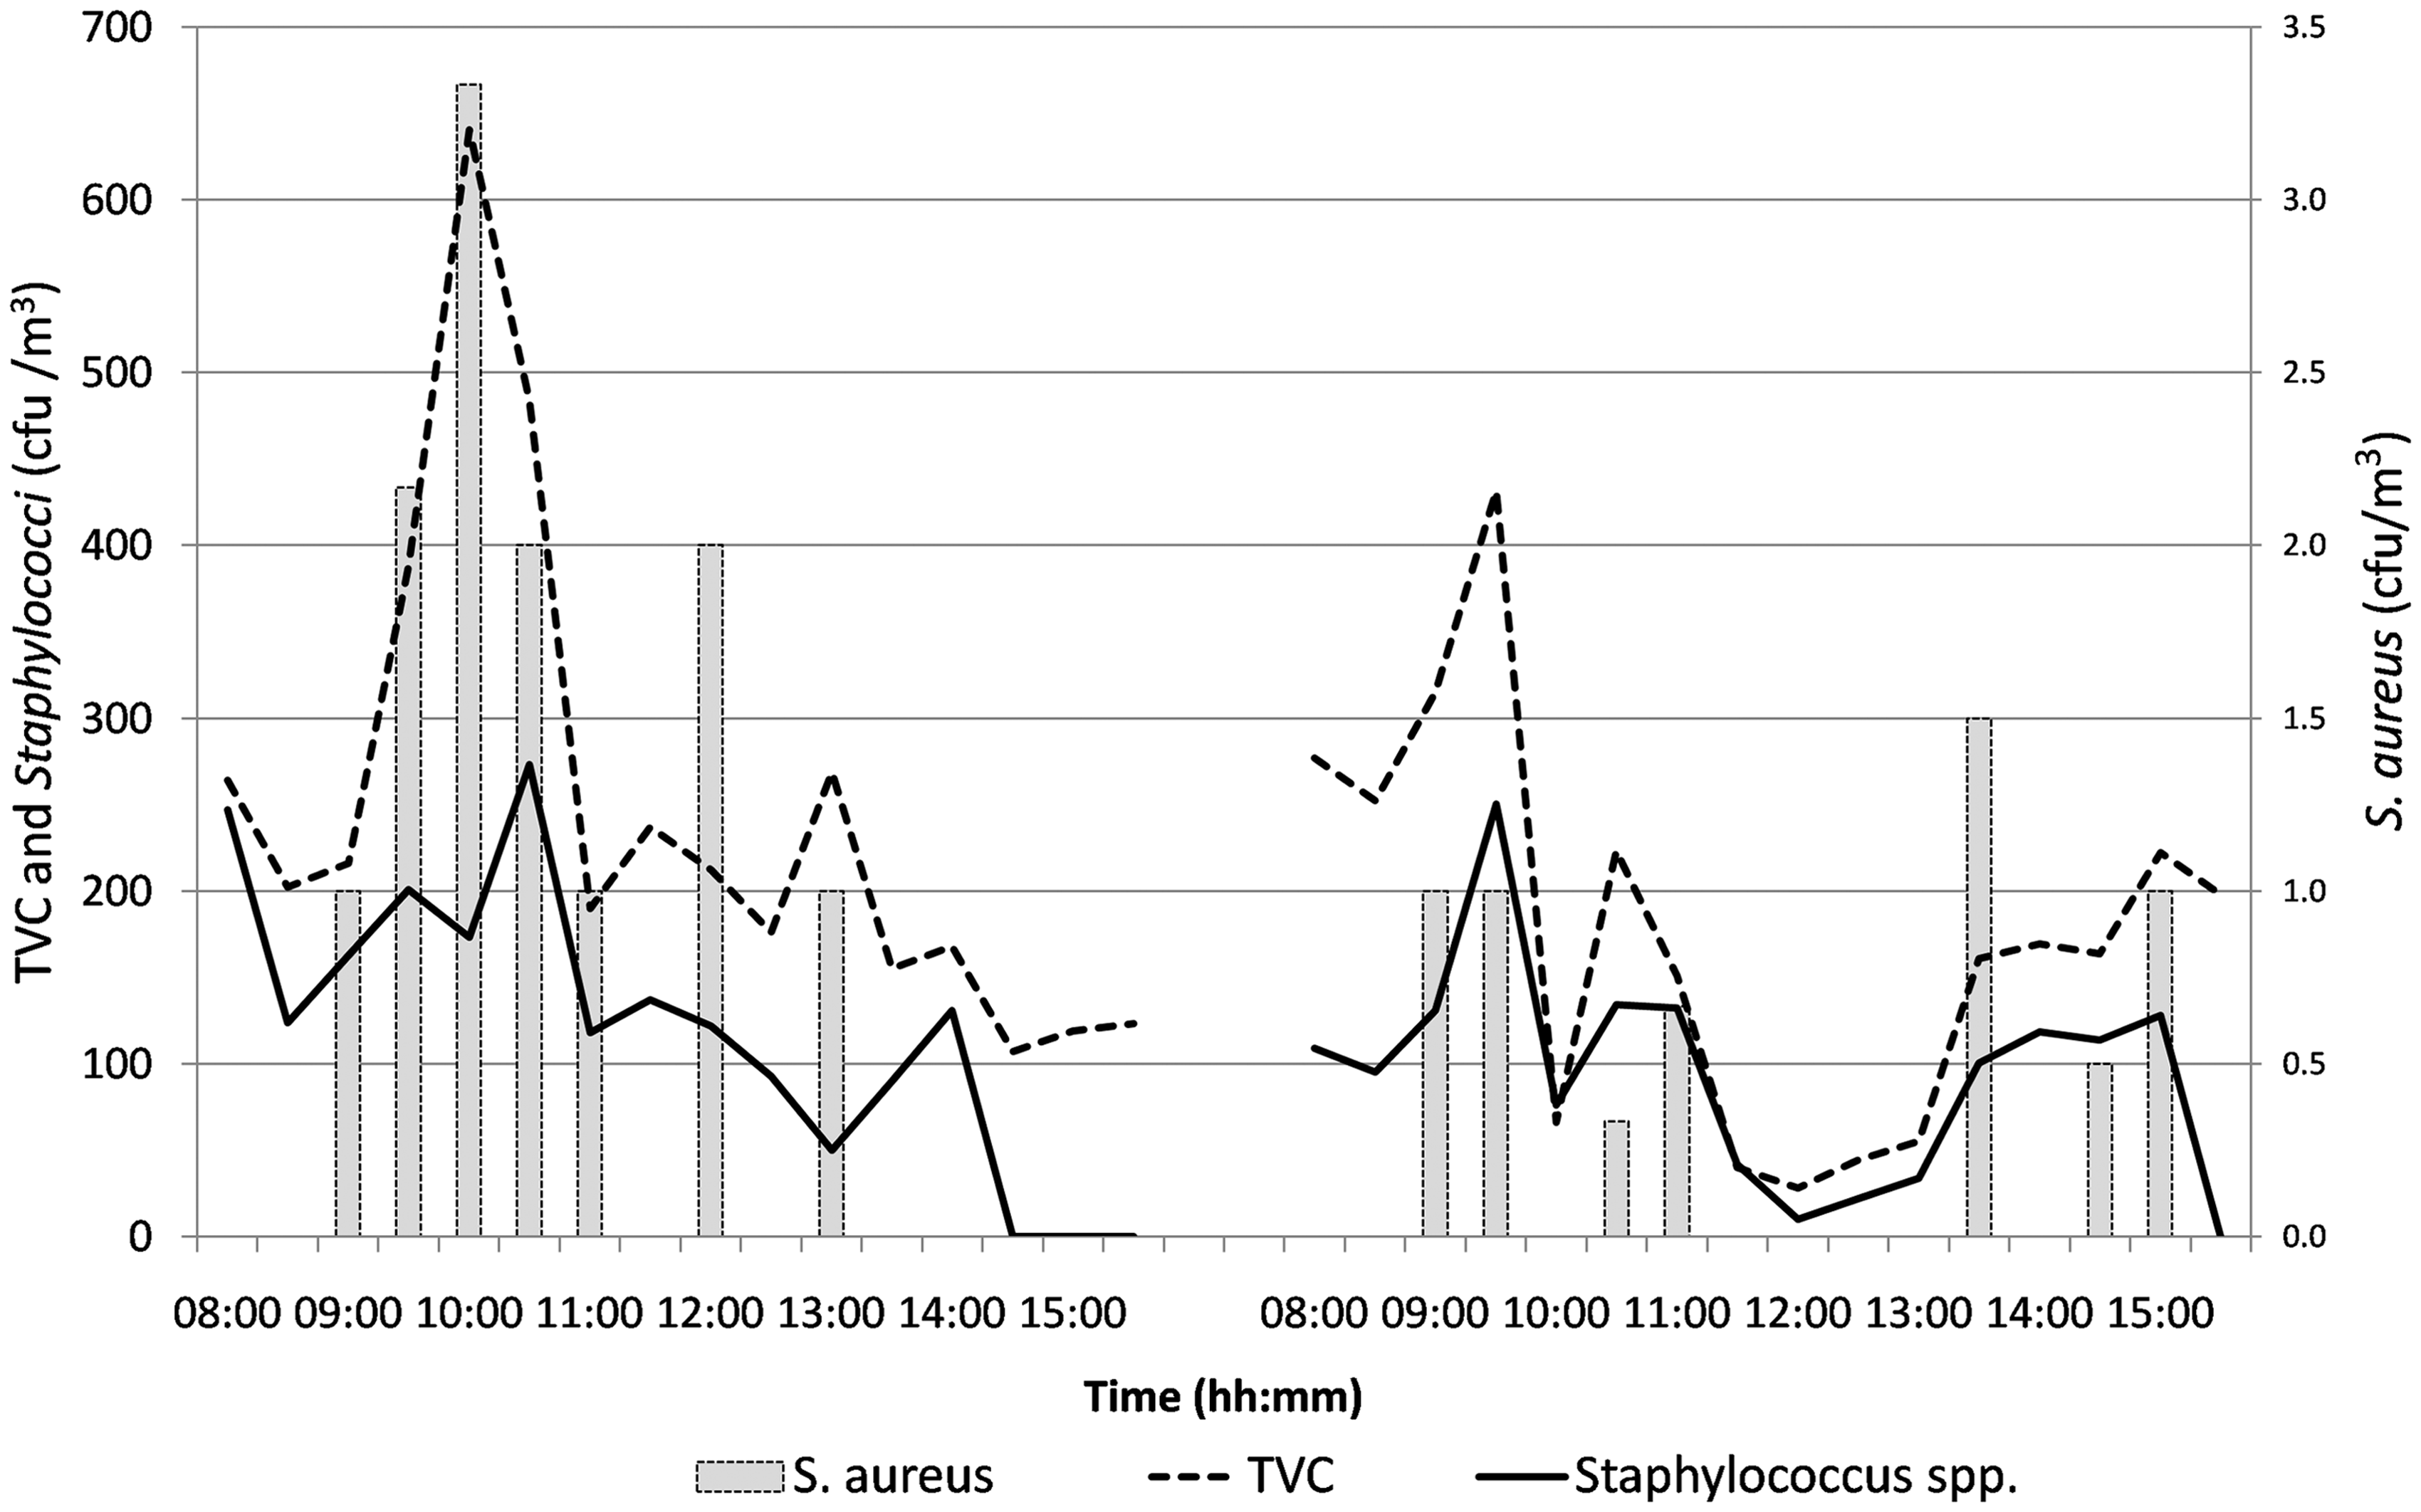
Size Range of Particles Carrying Sampled Bacteria
Figure 3 shows the fluctuation of TVC and the two different particle size ranges over the 5 study days. Table 2 provides the results of correlation analysis between the different-sized particles and TVC during periods when no respiratory equipment was in use, and when ventilators and nebulisers were independently in use. These results are based on the data from this study and that collected previously in December 2004.
Fluctuations in bioaerosol TVC and 1-3 µm and >5 µm diameter particle concentrations over all 5 study days. Spearman’s rho correlation coefficient between total viable count and either large or small particles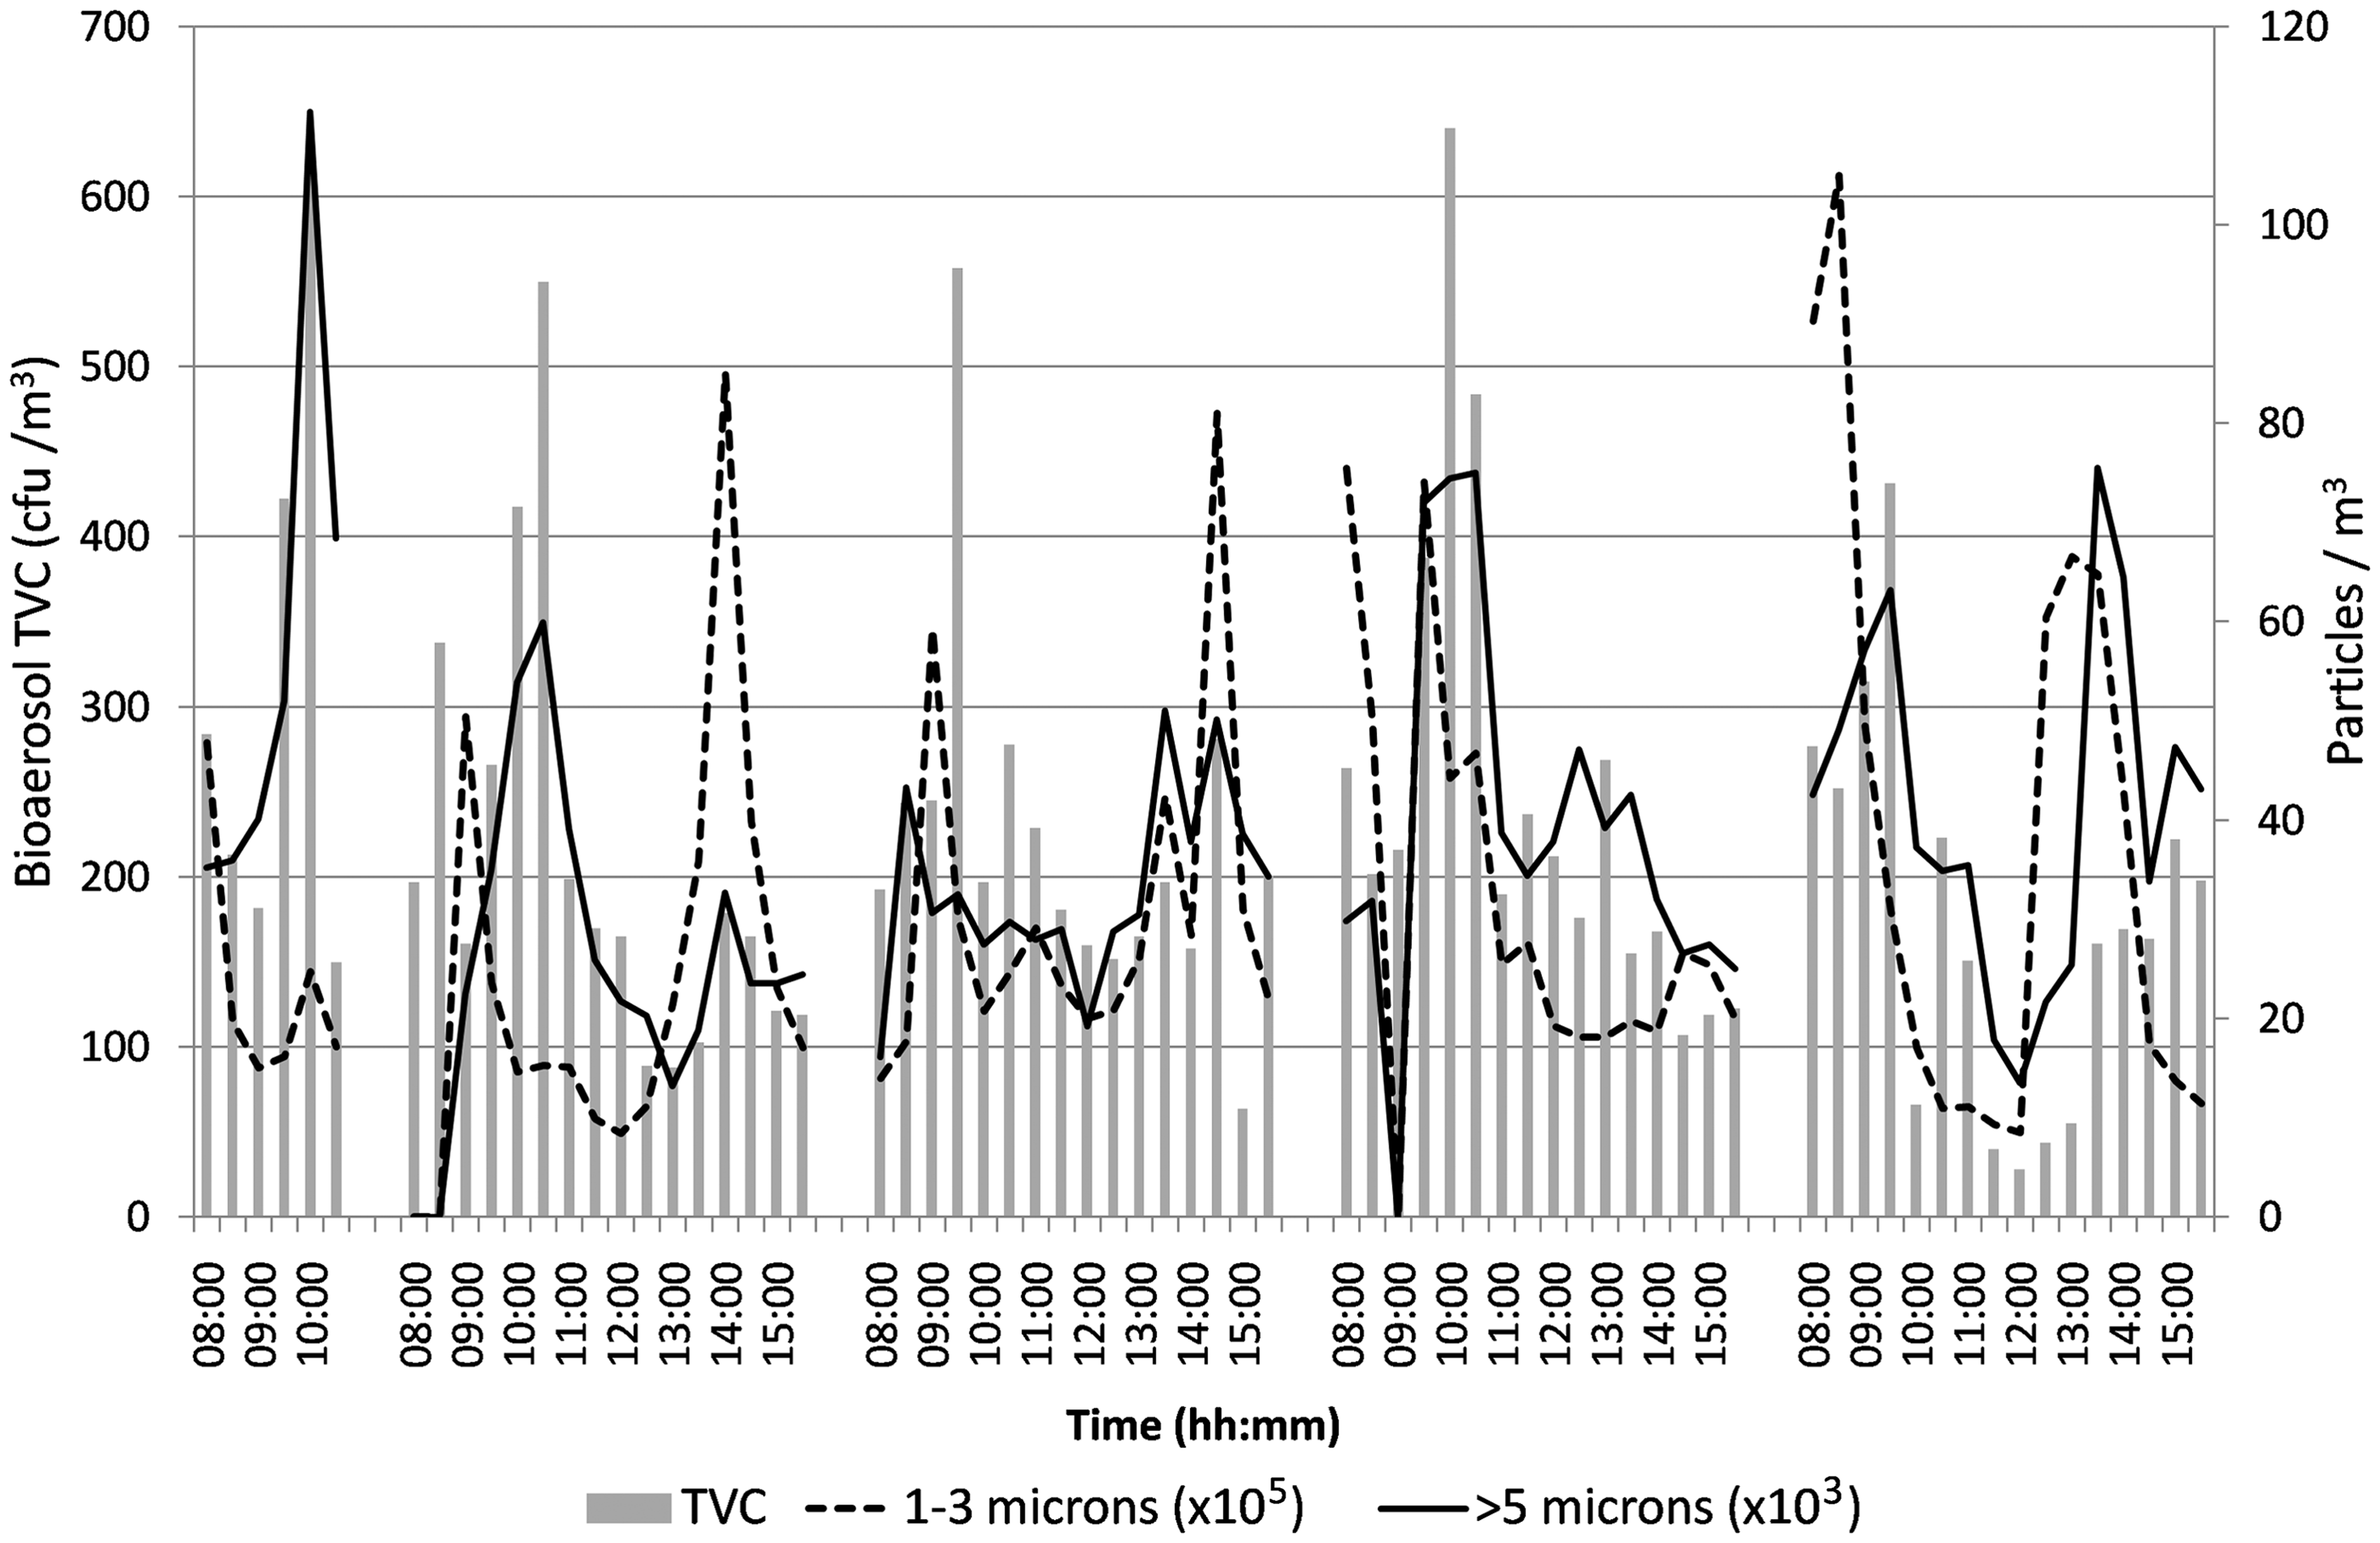
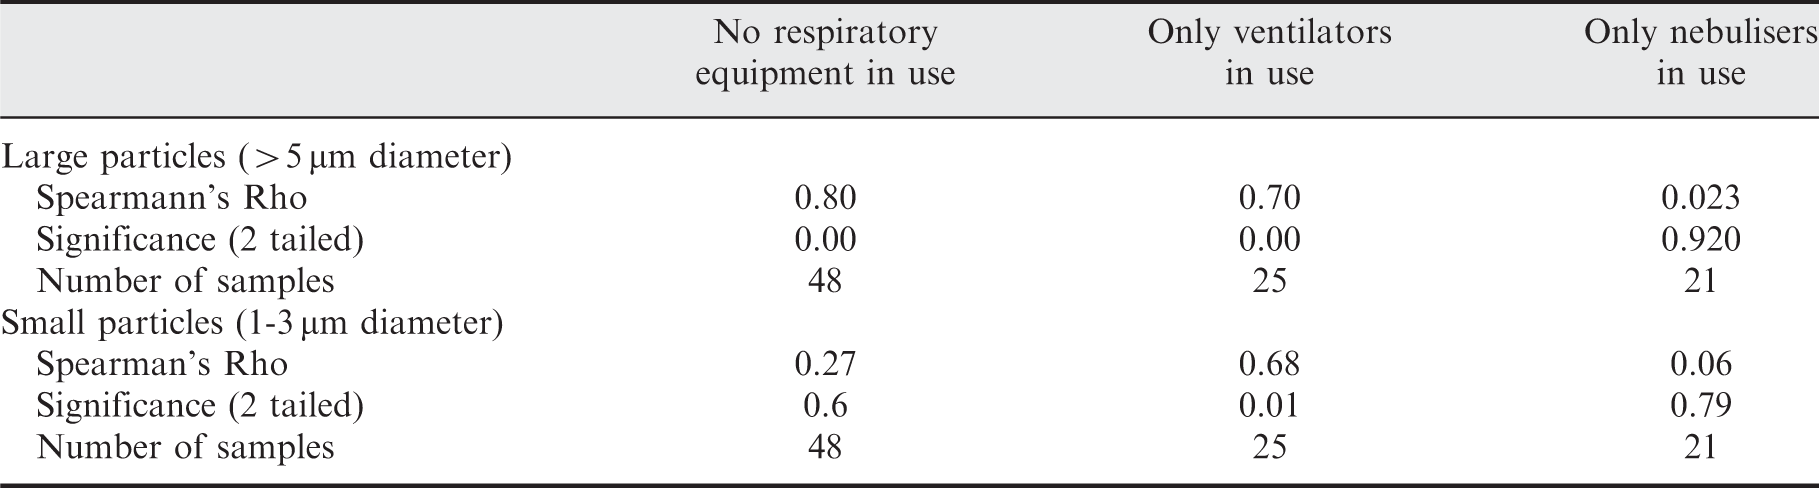
When no respiratory interventions were in use, the study showed clear trends between counts of large particles and sampled TVC. This concurs with previous studies such as in ref. [16], which found most airborne bacteria were released on particles 8 µm in aerodynamic diameter. During the time when ventilators were in use, there was still a positive correlation between large particles and TVC. However, there is also a significant correlation between smaller particles and TVC, indicating that the use of ventilators, or the presence of patients requiring ventilation, affects the size of airborne particles related to viable bacteria. The scatter plots in Figure 4 show quite clearly the change in relationship between particle size and bioaerosol count when respiratory interventions are in use. As can be seen in the figure and Table 2, when nebulisers are in use, the correlation between large particles and TVC no longer holds. The use of nebulisers was implicated in the spread of SARS [25] and high airborne counts of Pseudomonas aeruginosa have been found after their use [19]; however, although nebulisers and ventilators are suspected to generate aerosols, there is a lack of evidence to corroborate or reject this suspicion [26]. Although this study did not go into enough detail to identify the mechanisms behind the changing relationship to particle size, it does highlight the potential for respiratory interventions to alter the bioaerosol characteristics on a ward. This has implications for the effectiveness of interventions to control airborne transport of infectious particles
Scatter plots showing the relationship between TVC and large (>5 µm) and small (1–3 µm) particle concentrations when no respiratory interventions are in use (top), when patients are using ventilators (middle) and when patients are using nebulisers (bottom).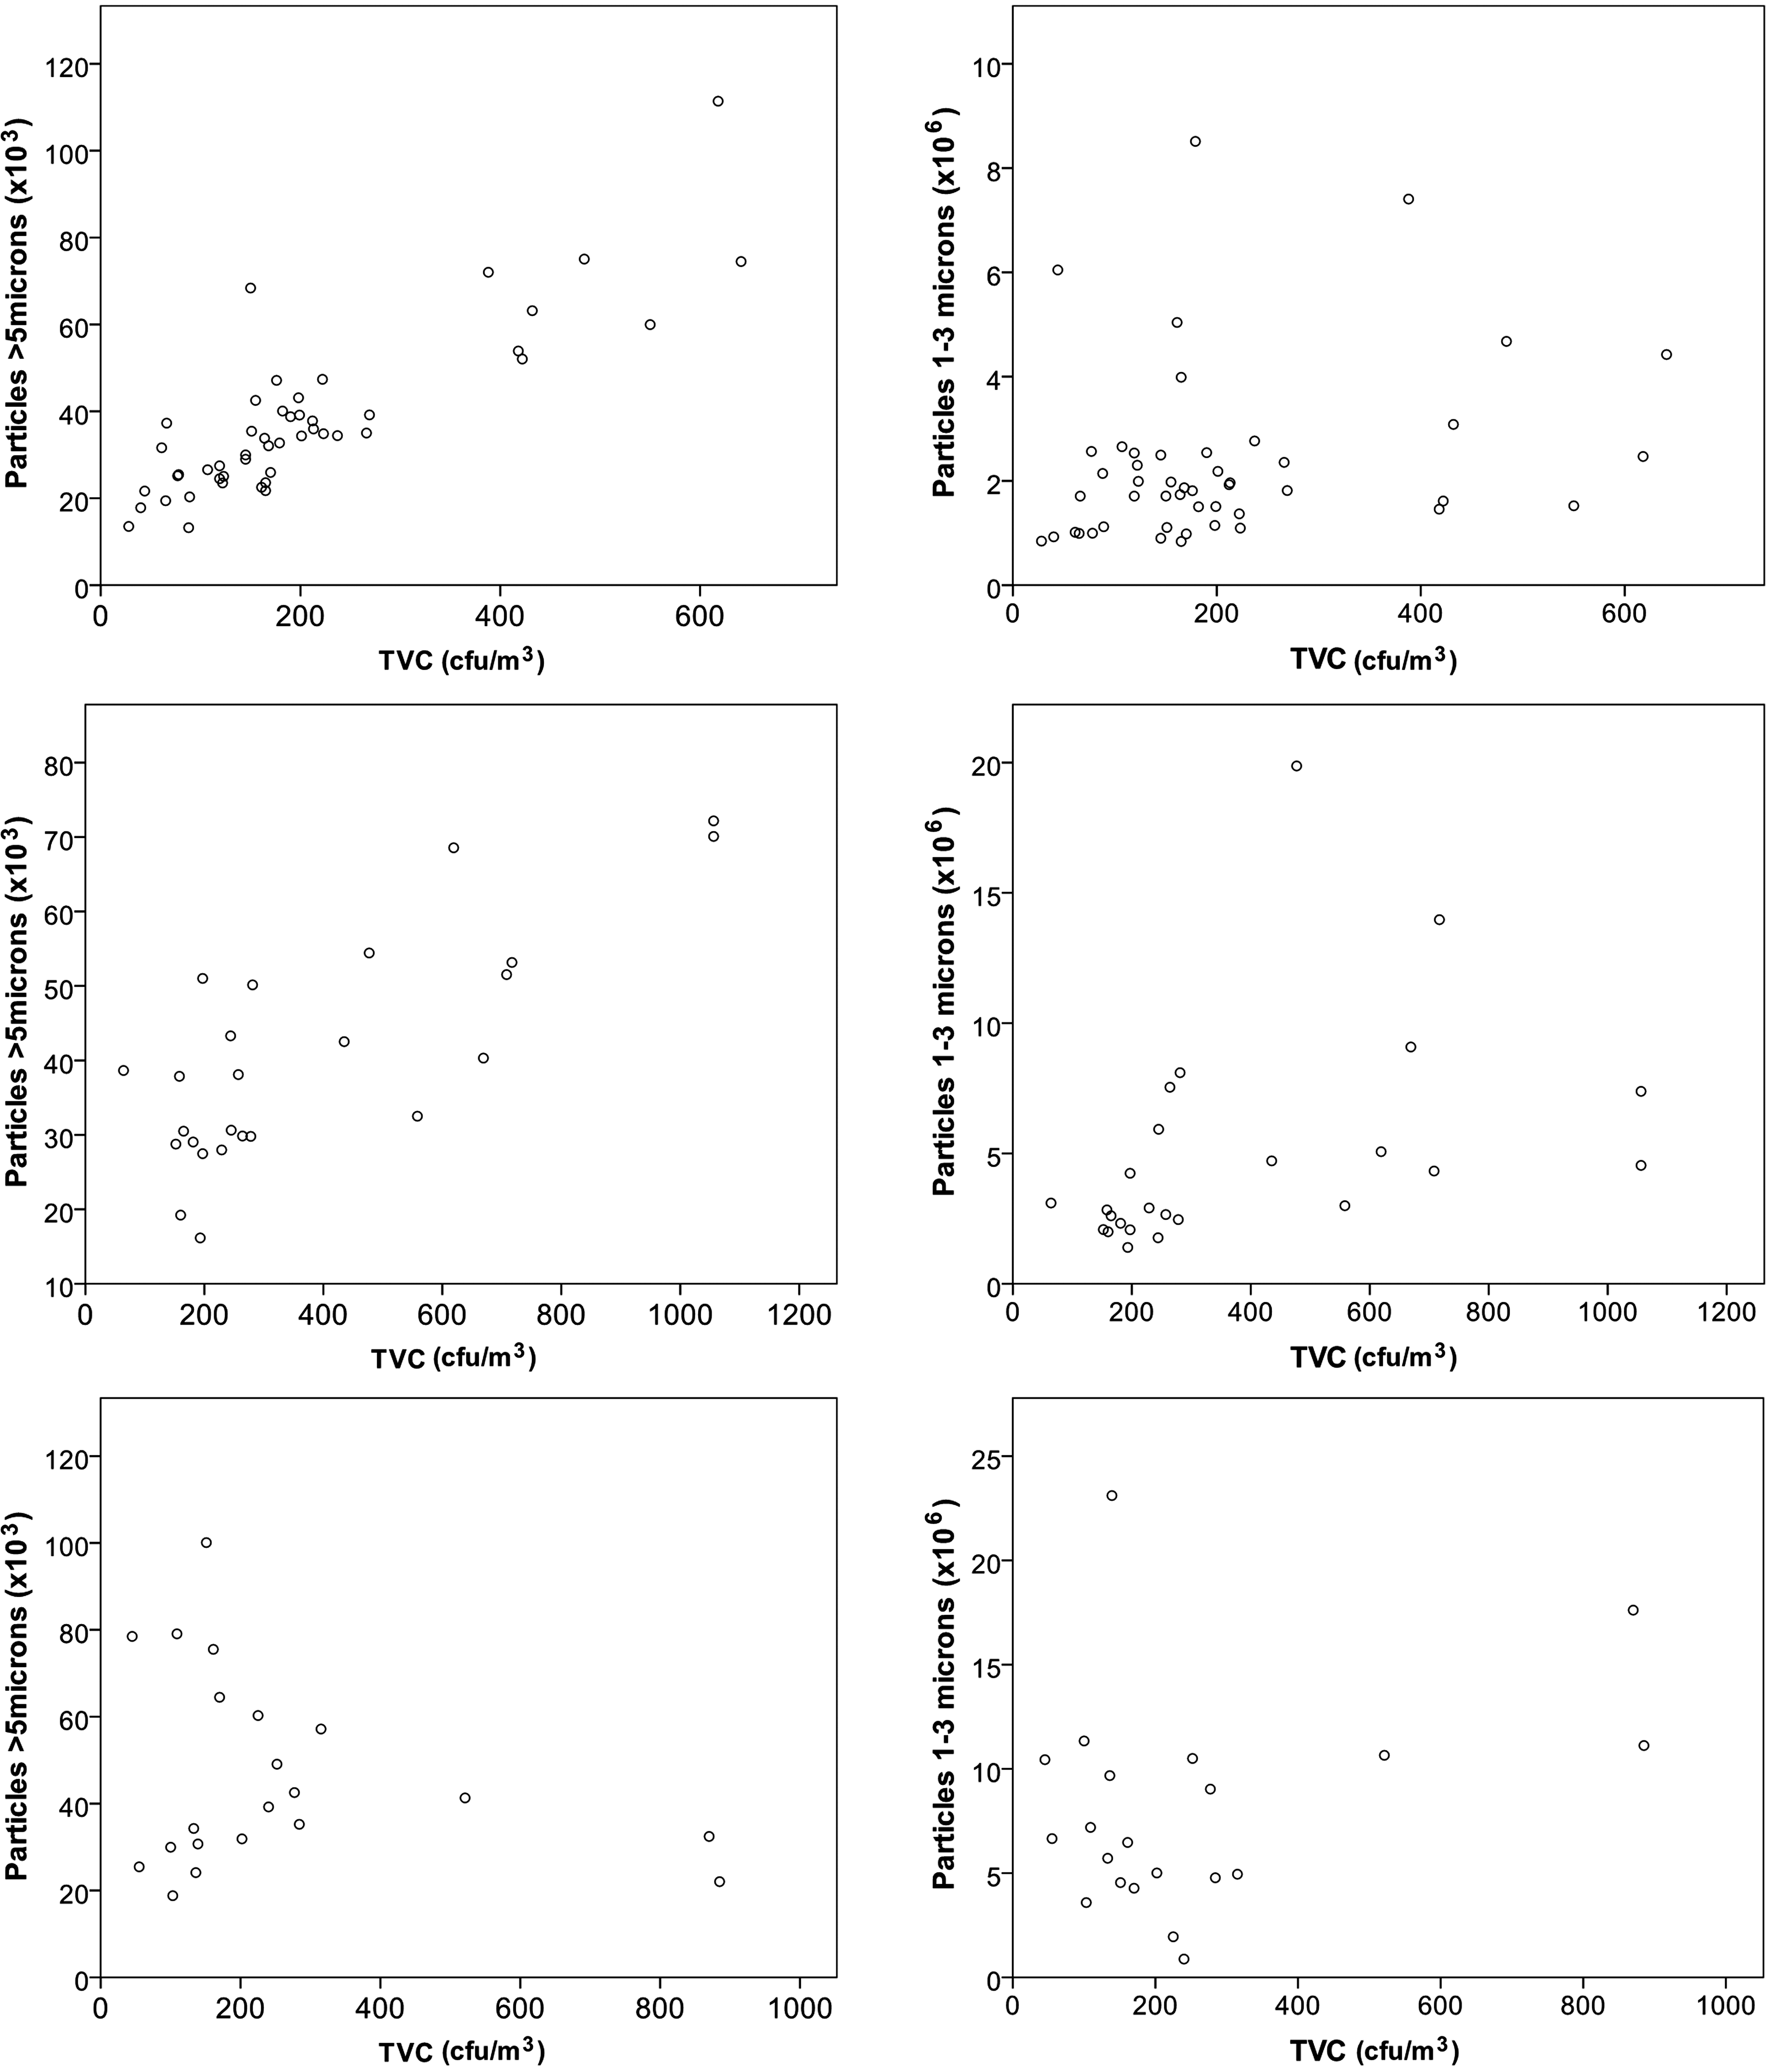
The strong correlation between large particles and sampled bacteria when ventilators are not in use is most likely indicative of the type of bacteria present and the mechanism of release; however, it may also be influenced by survival and sampling methods. If the larger particles originate from the skin, they may be more capable of surviving outside the body than those originating from the respiratory tract, which are likely to be smaller particles. This could also be influenced by the bio-efficiency of the sampler whose impaction method may result in the loss of viability of less hardy bacteria from certain sources. In addition, the physical sampling efficiency varies for different particle sizes. For 3–5 µm particles, it is likely to be high with a theoretical 100% efficiency [27], this reduces sharply to only 22% for 1 µm. However, because the sampling efficiencies will remain the same throughout the study, an increase in airborne count should be detectable even if only a small fraction of the bioaerosols are sampled. As large peaks in the smaller particle fluctuations did not generally equate to increases in sampled TVC, the results suggest that most small particles are not associated with viable micro-organisms for patients in this study when ventilators are not in use.
Correlation between Particle Release and Activities
Figure 5 presents the bioaerosol TVC and large particle fluctuations over the course of the study alongside the presence of people in the bay. The occurrence of window opening is annotated on the figure. The people are categorised as all people (staff and visitors) and HCWs. It is clear from Figure 5 that people alone do not correlate to peaks in bioaerosols, but the presence of high numbers of HCWs that relates to greater levels of activity occurs at times when there are increased values of TVC sampled. The results from the correlation analysis are shown in Table 3 for these and the other specified activities within the ward which are discussed below.
Fluctuations in particles >5 µm (top) and total viable count (TVC) level (bottom) compared to total number of people in the bay (staff and visitors) and number of healthcare workers over all 5 study days. Spearman’s rho correlation coefficients of activities to particles and total viable count (TVC)
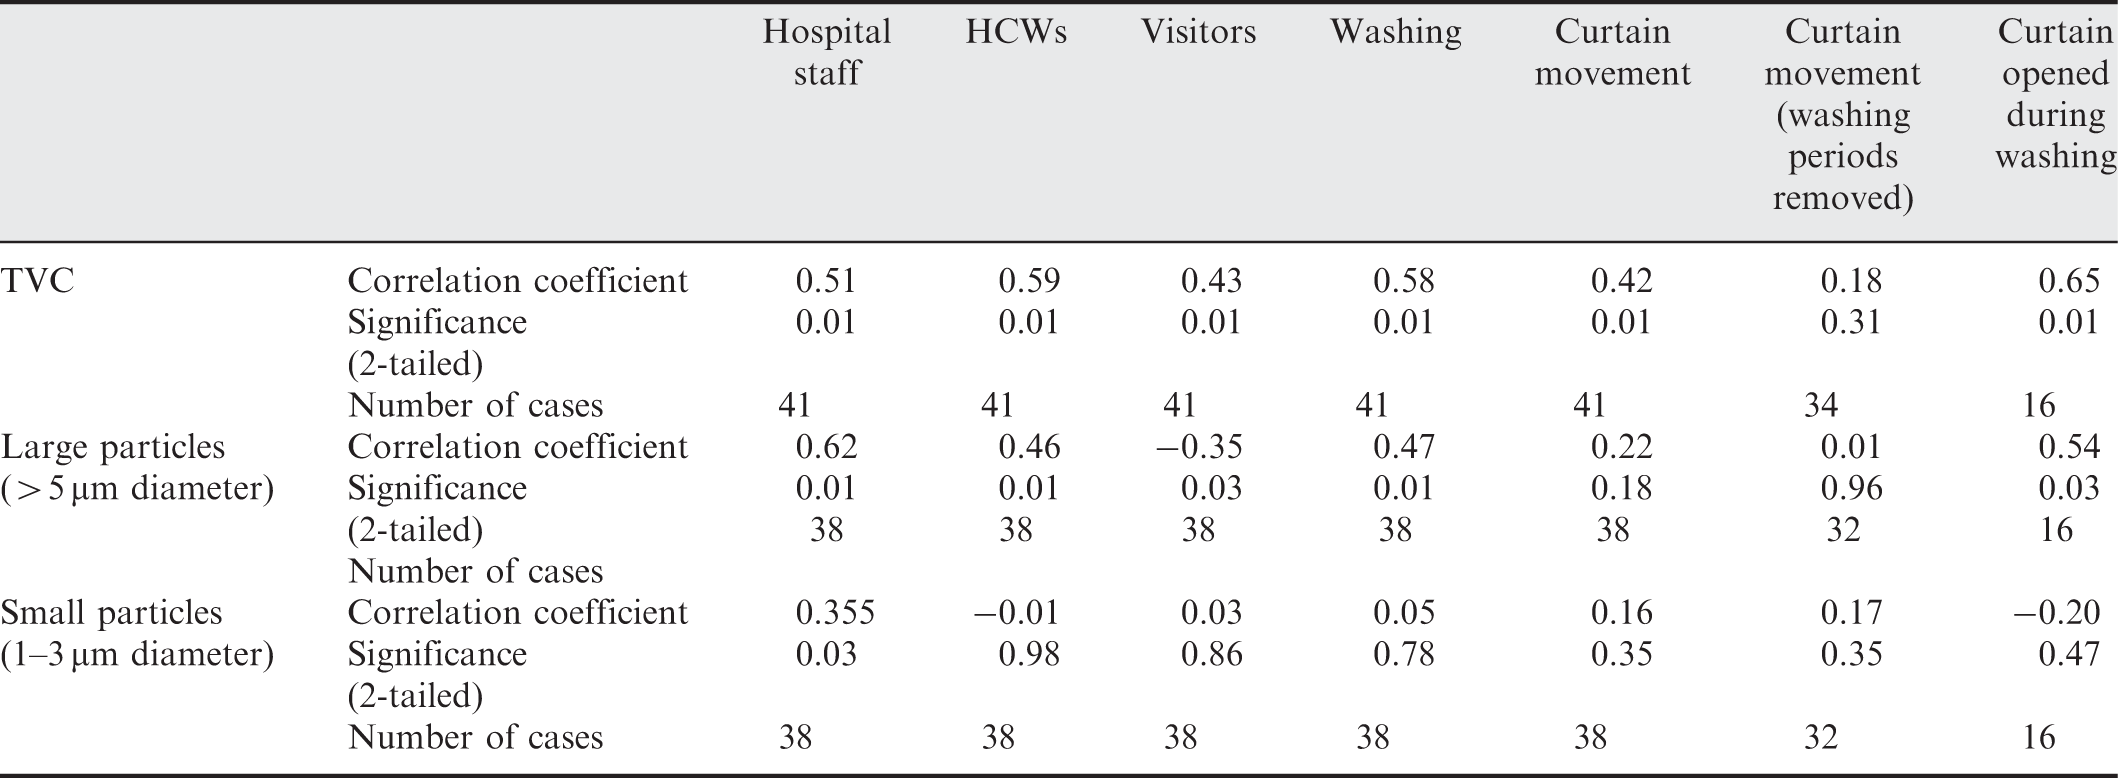
General Staff, Health Care Workers and Visitors
As described in the methods, HCWs is a more specific activity quantifying those staff directly dealing with a patient at their bedside. This included interaction between the staff and the patient which often, but not always, occurred behind closed curtains. Examination of the data found periods when very high levels of HCW activity did not correlate to high concentrations of bioaerosols or large particles. However, these often occurred at times when TVC values are still increasing; as can be seen in Figure 5, the highest values of bioaerosol TVC concentration occurs a short time after the activity, suggesting a lag between activity and detection. This is also apparent in the particle data. On the one occasion when a high level of HCW activity (see Figure 5 Day 2, 09:30, HCW activity = 14.7) equates to low numbers of particles, the subsequent samples show an increase to above 50 × 103 particles/m3. Since the ward is predominantly naturally ventilated, and comprises a number of open bays, it was not possible to accurately identify the delay between particles being released and reaching the sampler and direction of air flow is not known. However, comparing average data for 30-min periods will account for some delay between aerosol generation and sampling and the increased activity levels will promote mixing in the space [10].
In contrast to the HCW and general hospital staff, the presence of visitors showed a very low correlation to sampled TVC and no significant correlation with small or large particles. Visiting time occurred in the afternoon when the sampled values of TVC dropped and there was generally very little nursing activity on the wards. The visitors were generally adults and sedentary when they were present.
Patient Washing
The fluctuations in TVC in Figure 3 show the occurrence of the peak concentrations in the morning. This generally relates to the busy period of the day during which time washing of the patient occurred. Table 3 indicates a significant positive correlation between patient washing and both TVC and large particles. As with HCWs above, there are several occasions with high levels of activity but lower values of TVC, and these all occur during a period when the values of TVC are increasing up to peaks of 614 and 550 cfu/m3 within the hour. The lowest value of TVC measured when washing was occurring (216 cfu/m3) is still in the top 35% of all sampled values of TVC.
There is a significant correlation between curtain movement and sampled TVC. However, many of these occurrences overlap in time with patient washing since this always occurred behind curtains. Curtains have been shown to harbour microorganisms [17,28], which causes a reservoir of infectious material that may be released into the air upon vigorous movement. Therefore, the correlation between washing and TVC may be related to the curtain movement rather than the activity of washing occurring within.
In order to attempt to clarify which activity had the greatest contribution to the sampled TVC levels, the correlations were considered in more depth. Table 3 includes correlation values for TVC against curtain movement both during washing, and at times when washing is not occurring. It is clear that the movement of curtains at times when washing is not occurring does not correlate to increases in viable bioaerosols. Fluctuations of TVC during curtain movement and washing patients are shown in Figure 6. The use of curtains in the afternoon occurs at times when there are small increases in bioaerosols; however, these counts are not as high as those sampled during the peak morning activity. The occurrence of curtain opening does appear to correspond to peaks in bioaerosol TVC, however, this is much greater when combined with washing, indicating that the period during which washing is undertaken results in greater release of bioaerosols.
Fluctuation of total viable count (TVC) shown alongside the occurrence of patient washing and curtain movements over all 5 study days.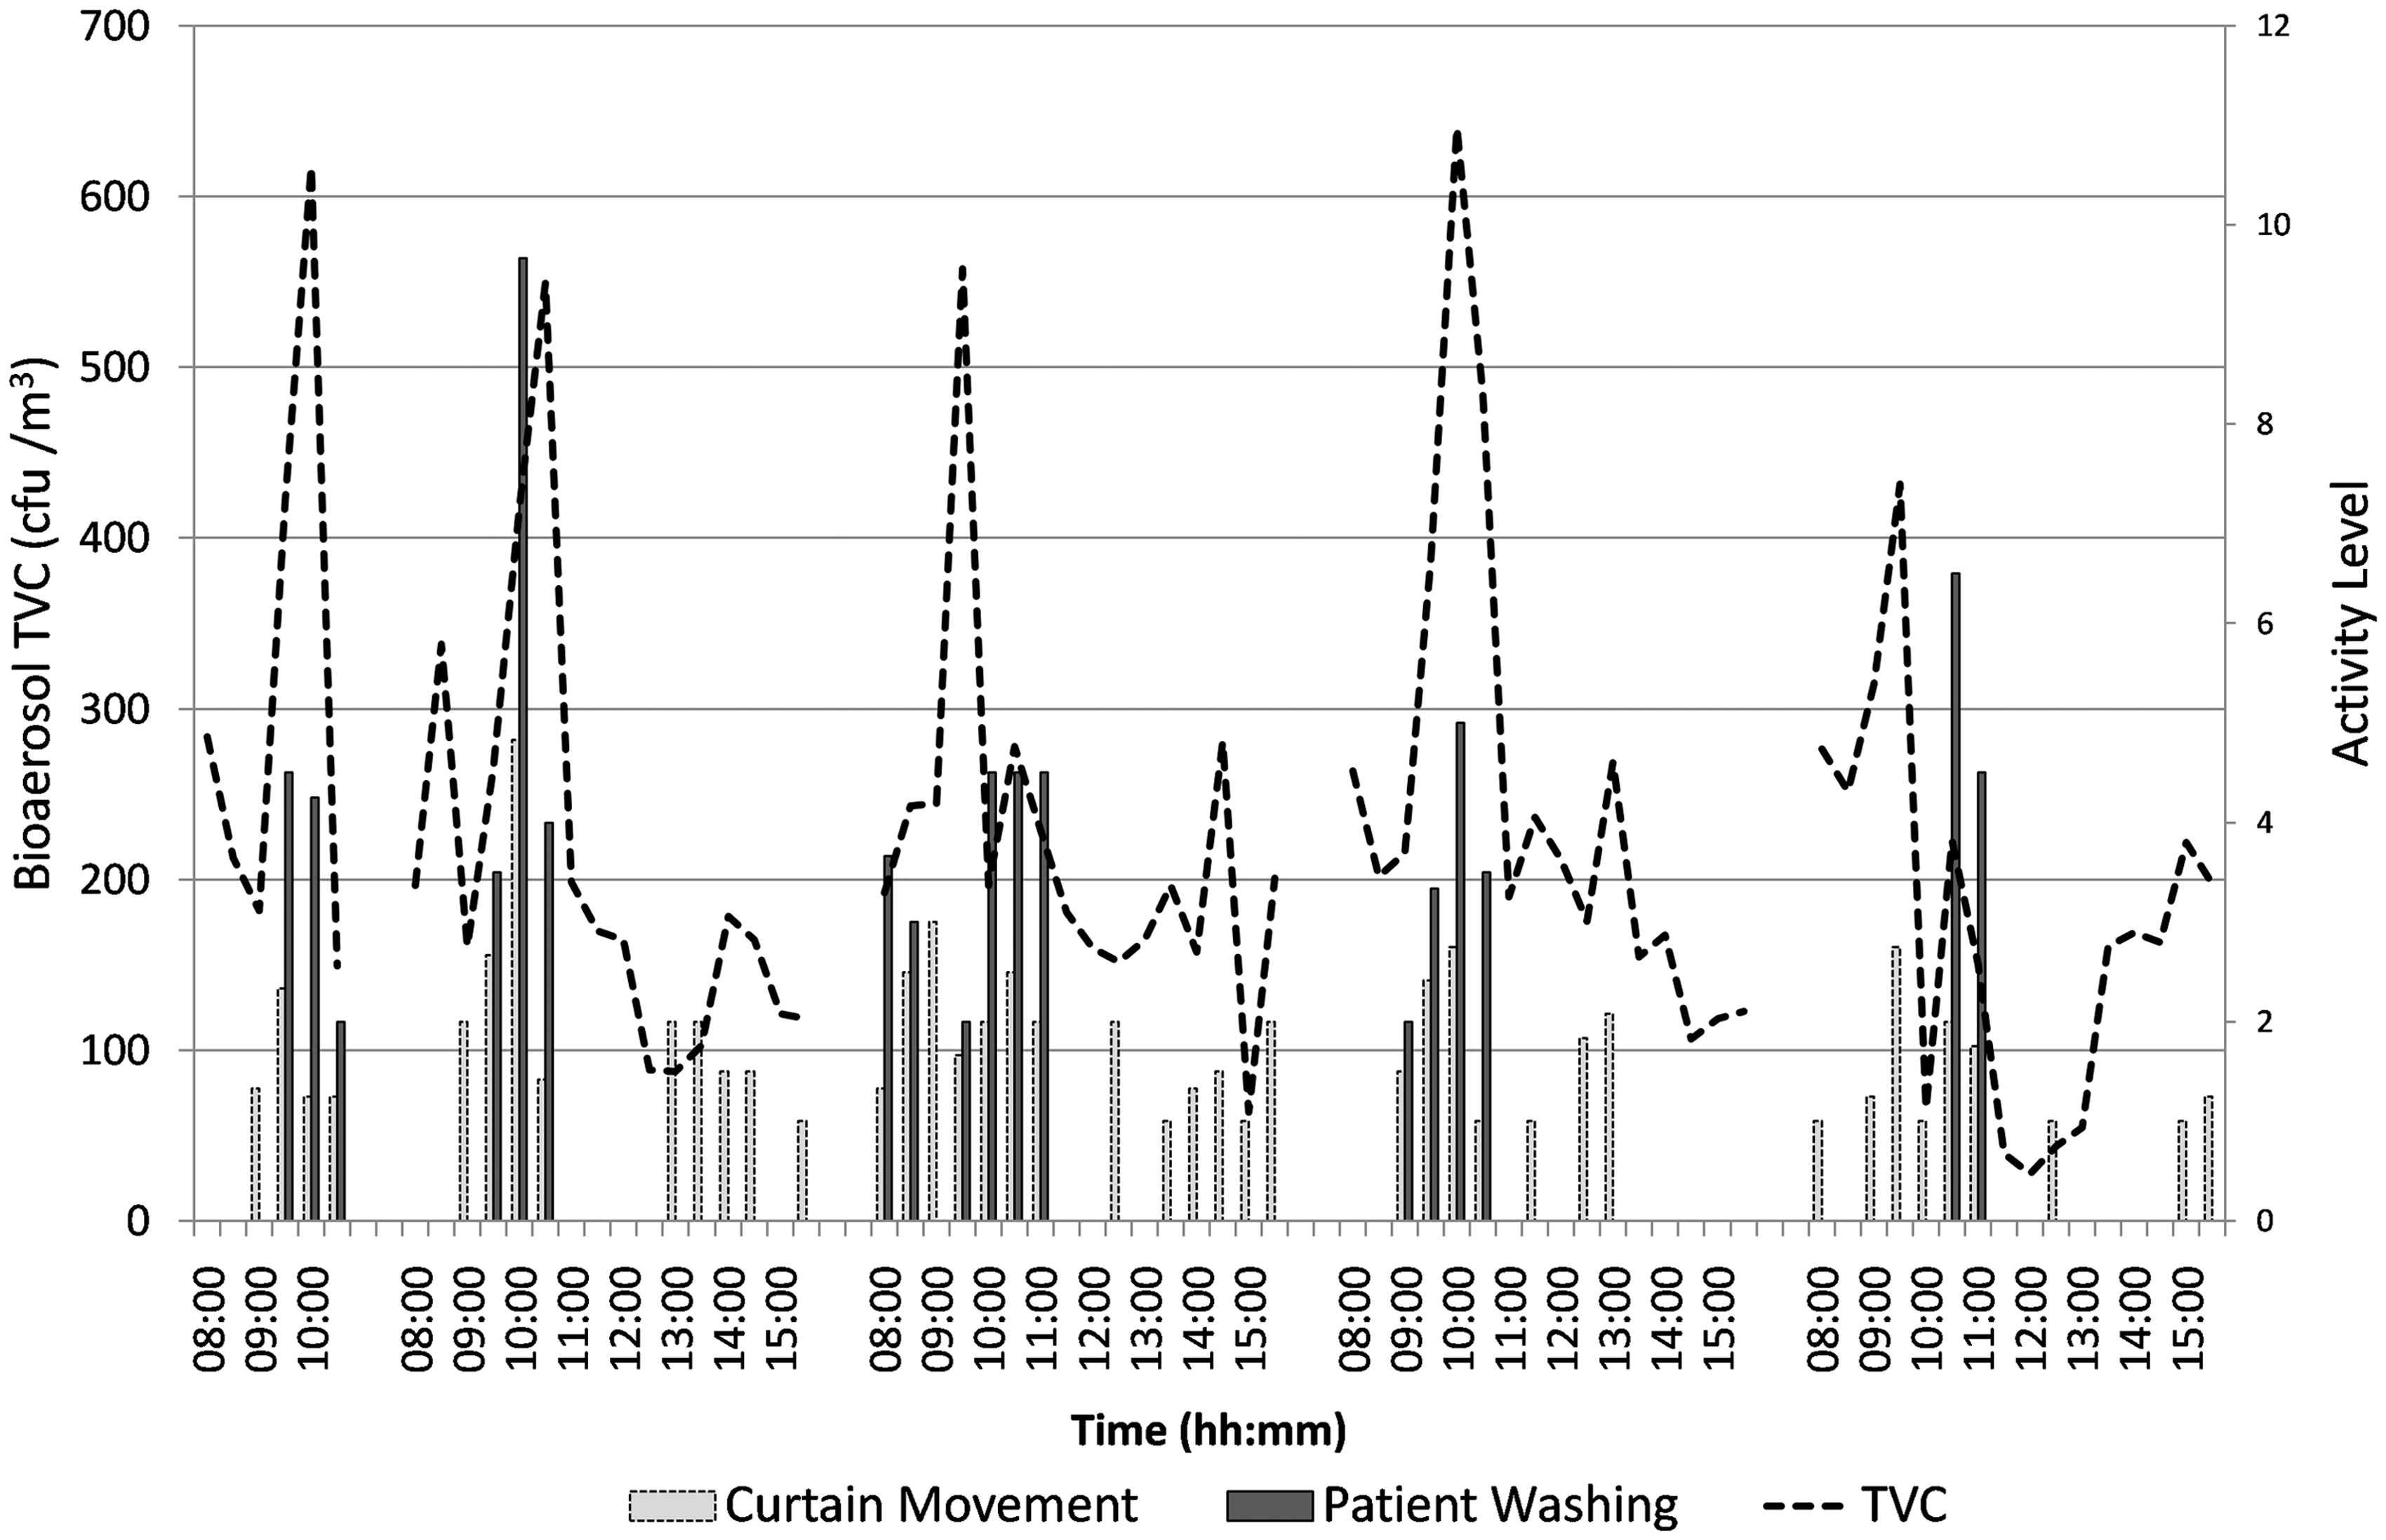
Partial correlation was carried out on the ranks of washing controlling for curtains, to remove the effect of curtain movement from the correlation analysis, and vice versa. The partial correlation results show clearly that the correlation between washing and TVC (r = 0.656, p<0.01, df = 38) is still strong when controlled for the movement of curtains, whereas when controlling for washing, the correlation to curtains is removed (0.162, p = 0.318, df = 38). This is further demonstrated through the correlation values given in Table 3. It was not possible to consider washing independently as washing always occurred during periods of high curtain movement.
Although several authors have indicated that curtains become contaminated with bioaerosols potentially providing a significant route for infection transport via contact route and to release bioaerosols into the air [17,11], this analysis indicates that the activity behind the curtains has a greater effect on the airborne bioaerosol levels than the curtain movement alone. However, it should be noted that the curtain activity levels are also generally higher during washing periods than at other times.
Bay Cleaning
Cleaning occurred in the afternoon on two of the study days over a period of approximately 1 h. Since this results in only two data points for analysis, statistical correlations are not carried out. However, the time cleaning occurred is indicated on Figure 7, which shows an increase in large particles but only a small variation in TVC. This is possibly due to the polishing which created visible generation of airborne particulates. Due to the disruption cleaning caused in the ward, that is moving beds and furniture to mop, there was very little other overlapping activity so there is some confidence that cleaning is the one activity that is affecting TVC and particle fluctuations at this time.
Fluctuation in large particles and total viable count (TVC) alongside bedmaking, commode use and bay cleaning over all 5 study days.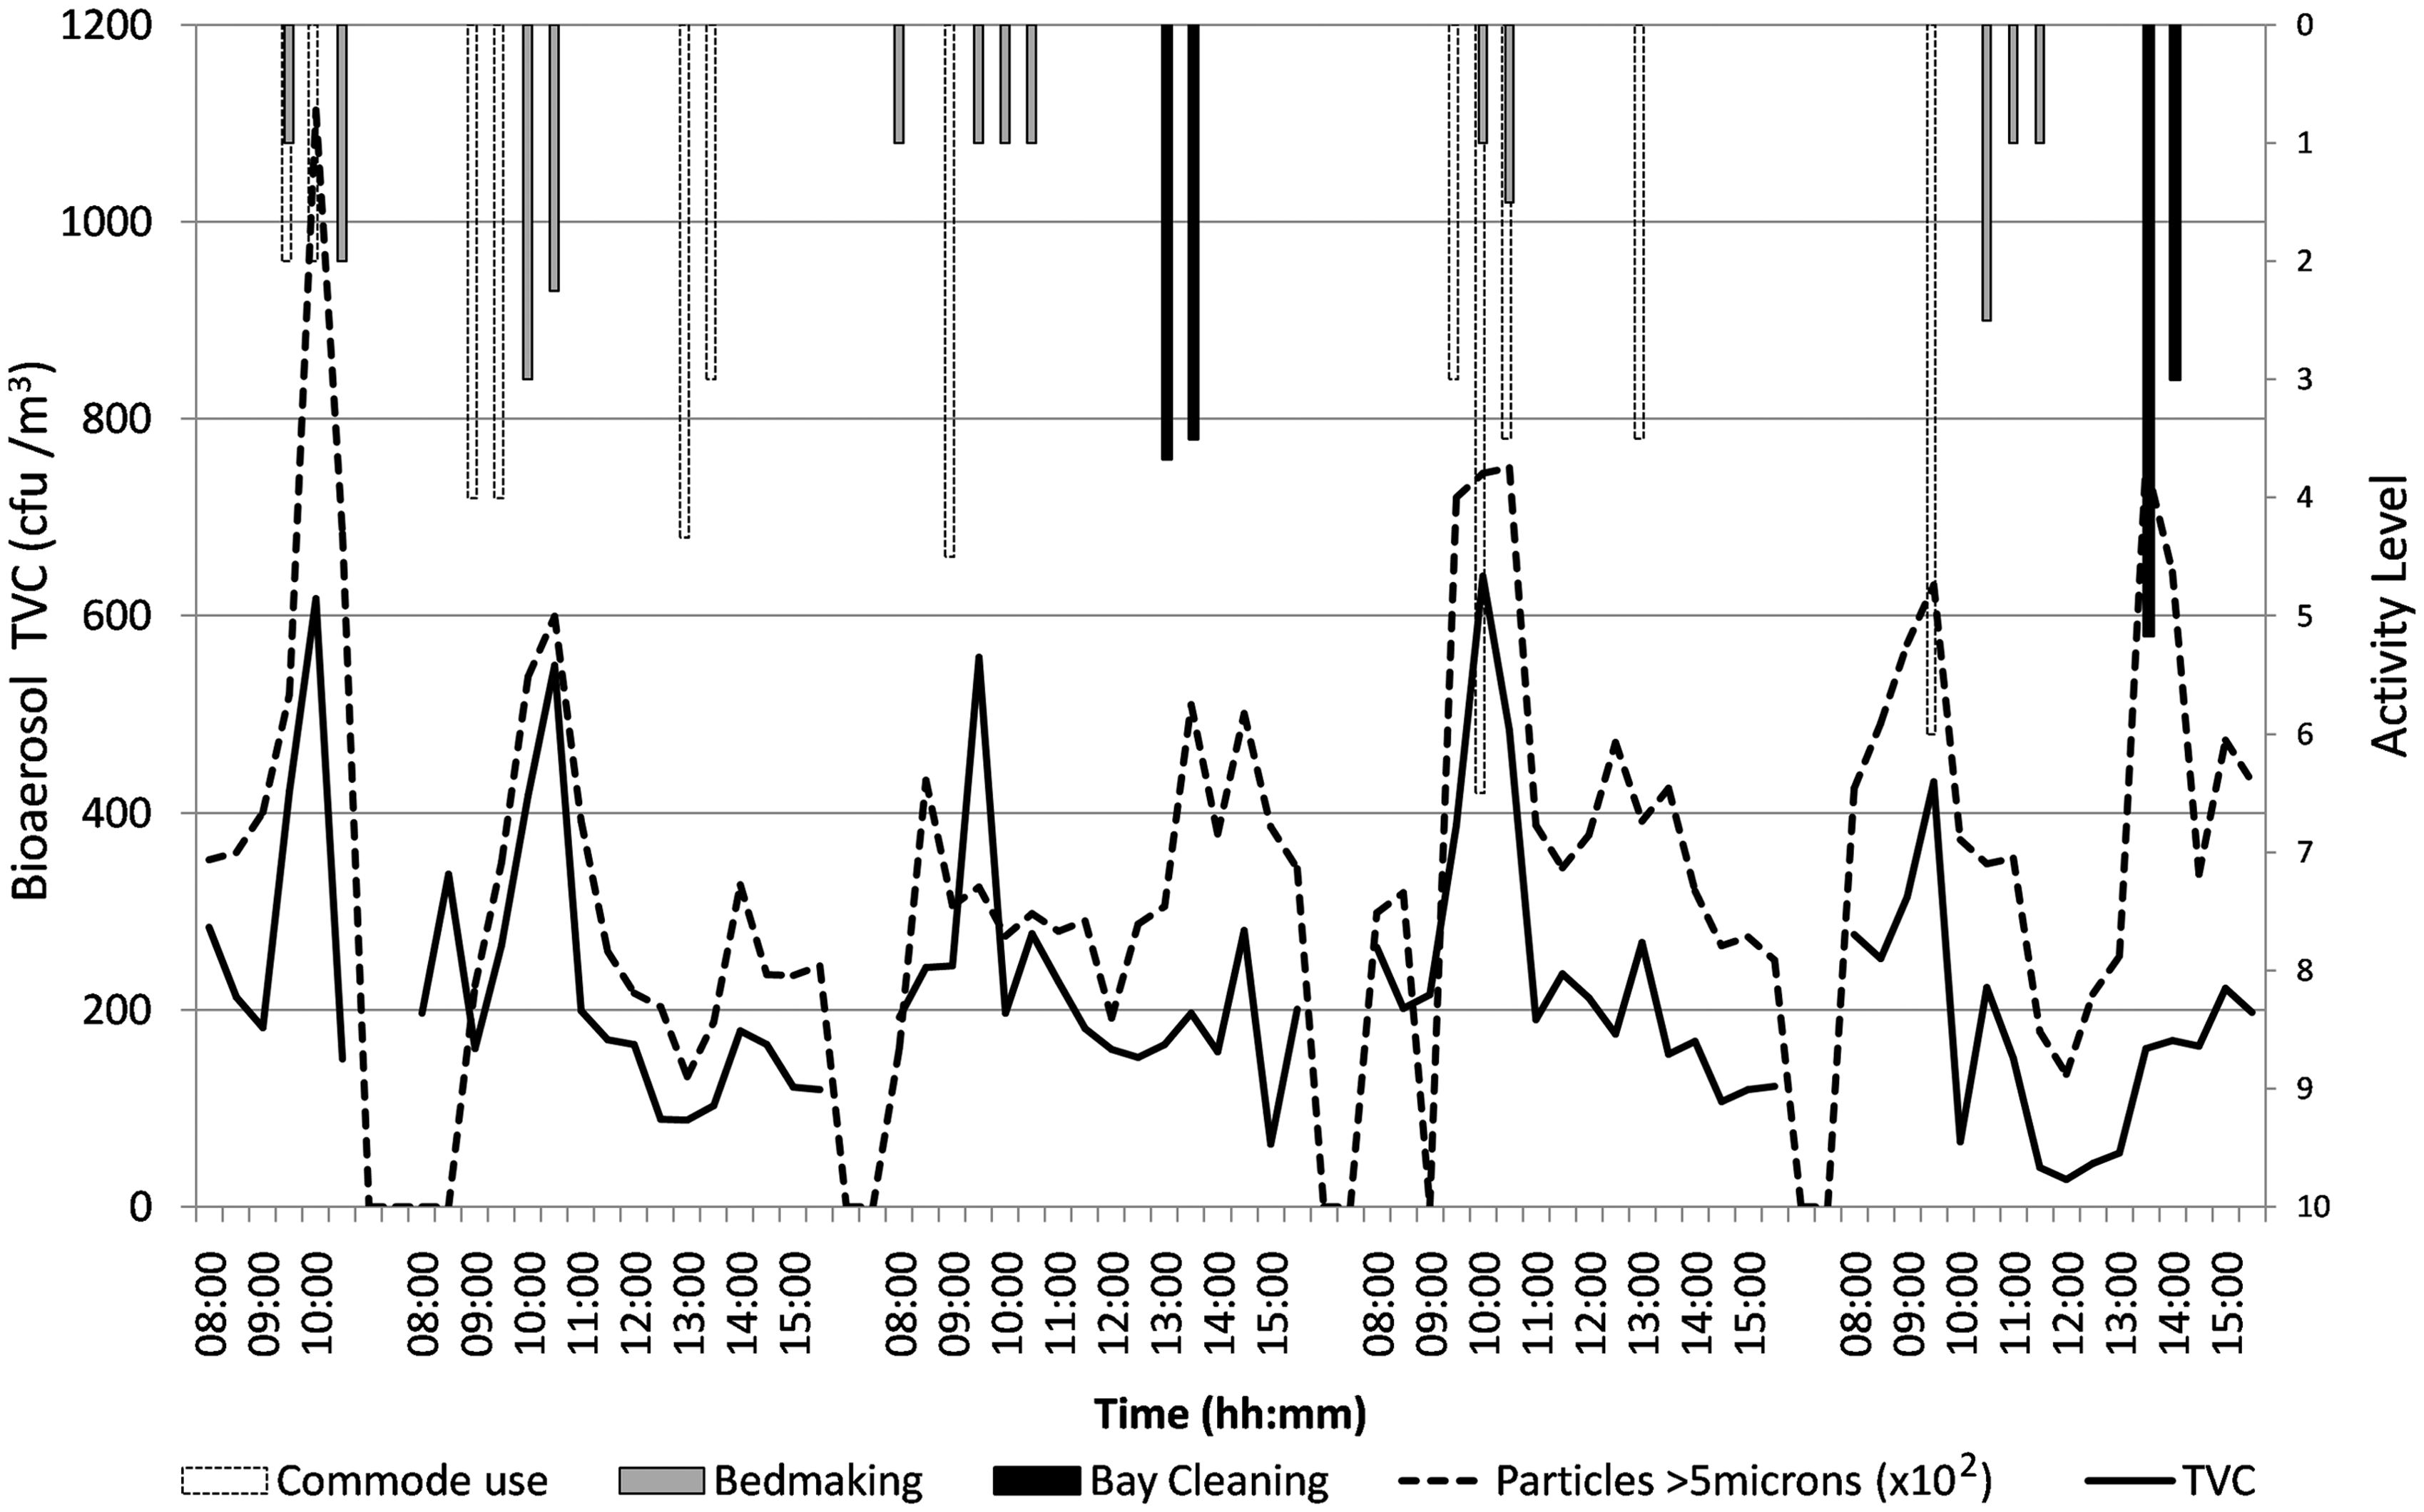
Interestingly, this study showed only minor increases in bioaerosols during cleaning (Figure 7). This may be due to the use of detergent and wet mopping before polishing that may be more effective at killing or constraining microorganisms on surfaces than techniques such as sweeping. It should not be assumed that this would be the case for all cleaning methods. Pathogens such as MRSA do have the ability to survive for months on surfaces [29] and it is possible for cleaning methods to enable particles to become resuspended in the air as other authors have found increased levels of airborne bacteria after mopping [30].
Bedmaking
Figure 7 indicates commode use and bedmaking, both of which occurred infrequently compared to more general activities such as washing and HCW activity. There are only four independent occurrences of bedmaking across the study days, therefore statistical analysis is not carried out. However, it should be noted that bedmaking corresponds to time of high bioaerosol concentrations and large particles. This concurs with previous work which has demonstrated the release of bioaerosols, Staphylococci and MRSA into the air [11–13]. It should be highlighted that bedmaking usually occurred in the morning period during which time washing was also occurring and there were high levels of HCW activity.
Commode Use
Commode use occurred behind curtains, mainly during the same period as washing and bedmaking. Again there are too few occasions of commode use across the days to perform statistical analysis of the data, there are also several occasions when a commode was used and there was no discernable rise in bioaerosol concentrations in the ward air. As such, the data is regarded as insufficient to be conclusive and further study is required to establish any clear relationships.
Overall, the highest correlations with TVC were associated with activities generally carried out behind closed curtains suggesting that the processes of patient washing are key generators of airborne microorganisms. Since so many bioaerosol-generating activities occur behind closed curtains, it is possible that curtains may provide a temporary barrier to the transport of potentially infectious particles to other patients, as found by researchers in Hong Kong [31]. Simply keeping curtains closed until particles have settled may thereby limit transfer to other patient areas. However, even with particles as large as 5 µm, this could take several hours which is unfeasible. There may therefore be a case for considering physical partitions between beds or using air cleaning or local ventilation extract devices within curtained areas during high-release activities as a means of minimising transfer without impacting on nursing regimes. However, further research is necessary in order to understand the full potential of such strategy.
Conclusions
Although this is only a short study, it gives some valuable insights into the activities that may be responsible for airborne dissemination of microorganisms in a ward environment. Despite conducting the study on a respiratory ward, the majority of results presented quantify the impact of general nursing activities on the airborne microflora. As such, the results are likely to be applicable across a range of ward environments. Although correlation to activities were only carried out for TVC and inert particle data, the similarities between TVC and Staphylococci samples mean that activities that result in an increase in TVC are also likely to increase concentrations of Staphylococci in the air.
This paper provides valuable data for future research, including source definition in computer models for studying the airborne transport of bioaerosols. This indicates that the largest release of bioaerosols occurs during the period of patient washing behind closed curtains and that the bioaerosols may include S. aureus a potentially significant hospital pathogen when it is a variety with drug resistance. Secondly, the size of particles associated with viable matter is generally found to be greater than 5 µm. Interestingly, this relationship varies when respiratory equipment is in use. When ventilators are in use, the aerodynamic diameter related to viable particles also includes much smaller particles down to 0.5 microns. This clearly has implications for the transport dynamics of the bioaerosols.
Key bioaerosol generating activities tended to occur behind closed curtains, during the busy morning period. High levels of nursing activity, particularly related to patient washing correlated to increased levels of bioaerosols and large particles in the ward air. Bedmaking also related to increases in airborne microflora. This has implications for the definition of bioaerosol sources in computer simulations of airborne transport of infectious diseases as well as the location and design of interventions to reduce the spread of general microflora in hospital air.
Footnotes
Acknowledgments
This study was carried out as part of a PhD studentship funded by Engineering and Physical Sciences Research Council through a departmental training account and had ethical approval from Leeds East Ethics Committee. The authors would like to acknowledge the assistance of Dr Katherine Roberts, and Professor Clive Beggs in undertaking the initial pilot study. Thanks is also extended to the staff and patients of the Respiratory Wards at St. James’s University Hospital, Leeds.