
Abstract
This work investigated the personal exposure to indoor particulate matters using the intake fraction metric and provided a possible way to trace the particle inhaled from an indoor particle source. A turbulence model validated by the particle measurements in a room with underfloor air distribution (UFAD) system was used to predict the indoor particle concentrations. Inhalation intake fraction of indoor particles was defined and evaluated in two rooms equipped with the UFAD, i.e., the experimental room and a small office. According to the exposure characteristics and a typical respiratory rate, the intake fraction was determined in two rooms with a continuous and episodic (human cough) source of particles, respectively. The findings showed that the well-mixing assumption of indoor air failed to give an accurate estimation of inhalation exposure and the average concentration at return outlet or within the overall room could not relate well the intake fraction to the amount of particle emitted from an indoor source.
Introduction
Many epidemiological studies have shown a positive association between increased concentration of particulate matter and respiratory and cardiovascular health effects.1,2 People spend approximately 89% of their time in indoor environments, 3 therefore controlling indoor exposure to particles from indoor sources is critical to maintain a healthy and safe indoor environment. Studies of indoor particle dispersion under various ventilation systems have been very attractive in the recent years.4–7 However, few studies reported the quantitative relationship between human inhalation and the characteristics of indoor sources, i.e., source–receptor relationship, which is the core of source-oriented exposure and risk assessment. To describe the source–receptor relationship, the concept of intake fraction (IF) was first introduced by Bennett et al. 8 as the attributable pollutant mass taken in by an exposed population per unit mass emitted from a source. The risk could be therefore estimated by multiplying the quantity of pollutant emissions, IF number and a health-risk factor. This IF metric was originally suggested and widely used for the assessment of population exposure to the outdoor pollutants in an urban area.9,10 For a typical US urban environment, IF of typical airborne vehicular pollutants was within the range of 0–50 per million. 9 However, it was as large as ∼300 per million in a densely compact high-rise city such as Hong Kong. 10 For an indoor environment, Lai et al. 11 reported that indoor emissions in residences or office buildings could produce IF of 1000 to 100,000 per million, which was much higher than that in urban environment.
The estimation of IF would require the information of exposure concentration of specific pollutant, total emission and population, of which the exposure concentration is mainly obtained either by measurement or mathematical modelling. Indoor particle dynamics produce concentration patterns under different emission dynamics and different kinds of air distribution, and inhalation intake can be assessed by the detailed description of particle transport and distribution through the mathematic models, such as computational fluid dynamics (CFD). Such kind of work is able to illuminate source-to-receptor relationships and prioritise control efforts of indoor particle pollution. 12 Very recently, some efforts have been made to estimate the indoor IF from a steady emission source by CFD.13,14 There are also studies15–18 addressing an episodic release such as smoking, cooking, coughing, etc. Nazaroff 12 first associated the inhalation IF with episodic activities that release air pollutants indoors, and built a simple mathematical model to relate the IF to such building-related factors as ventilation rate and mixing of room air. Much work remains to be done before the dependence of IF of particle sources on indoor environment could be clearly understood.
This article describes the personal exposure to indoor particulate matters using the IF metric and provides a possible way to trace the particle inhaled from different kinds of indoor releasing sources. A CFD model was first constructed to model the particle dispersion from a steady source within a room equipped with underfloor air distribution (UFAD) system19–21 and the simulation results were validated against experimental data. An episodic release of particles from coughing was further investigated with the validated CFD model and finally the IF could be evaluated. Such work could improve the assessment of source-oriented health risk due to indoor particle pollutants.
Intake fraction of indoor particles
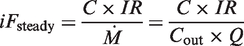
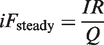
IF of particles from an indoor source can be expressed as the ratio of the inhaled mass taken by person across the interface to the mass emitted from the source. According to a path-breaking study by Nazaroff
12
for the IF of pollutants from indoor emissions, IF of indoor particles from a specified source with continuous emission rate can be written as follows:
Particle dispersion and concentration
Numerical modelling
Exposures to indoor particles are attributable to many factors, such as air distribution, source location, emission dynamics, etc. Material-balance models with the embedded well-mixing assumption 25 are used for particle transport in multi-zonal buildings but they are incapable of capturing the spatial distribution of particles indoors. Indoor airflow has been shown to contribute to high levels of personal exposure, and they should be explicitly solved to determine the impact of airflow pattern and turbulent characteristics on particle transport and concentration. Meanwhile, particle volume fraction is sufficiently small in the indoor air and the impact from discrete phase to fluid phase is negligible. As for the UFAD system concerned in this work, an improved RNG k−ɛ model together with a revised non-equilibrium wall function 26 is applied, which is more adapted to indoor thermally stratified flow and attenuated turbulence. This revised RNG turbulence model has been proven to be better representative of low-Reynolds-number effects in the displaced indoor environment compared with the original one. The improved wall function is a hybrid wall function with one three-layer pattern of non-dimensional velocity, and two-layer patterns of non-dimensional temperature and turbulent kinetic energy.
The Lagrangian method is used to model the discrete phase as it is able to predict the particle dynamics and the temporal development of particle dispersion.
27
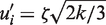
It well responds to the exposure and intake of particles from specified indoor sources through tracking and analysing a certain number of trajectories. The Lagrangian method tracks particles in the predicted airflow as:
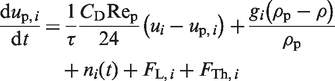
When particles reach air supply inlets or exhaust outlets, they will escape and the trajectories terminate. When reaching a rigid surface, particles will most likely attach to the surface since they usually cannot accumulate enough rebound energy to overcome adhesion. 32 Particle source in-cell (PSI-C) scheme 33 is applied to correlate the concentration with the trajectories on a computational cell basis.
Validation with experiments
Numerical modelling of the turbulence airflow model and Lagrangian particle model is validated by the experiments in a room with UFAD conducted by Zhang and Chen. 34 Experimental measurements are regarded as reliable but expensive, and hard to capture the particle dynamics. However, a well-validated numerical modelling would be a good alternative. Such validation helps to confirm that the numerical modelling could reliably present the required partial/time-dependent information for the assessment of the inhalation IF.
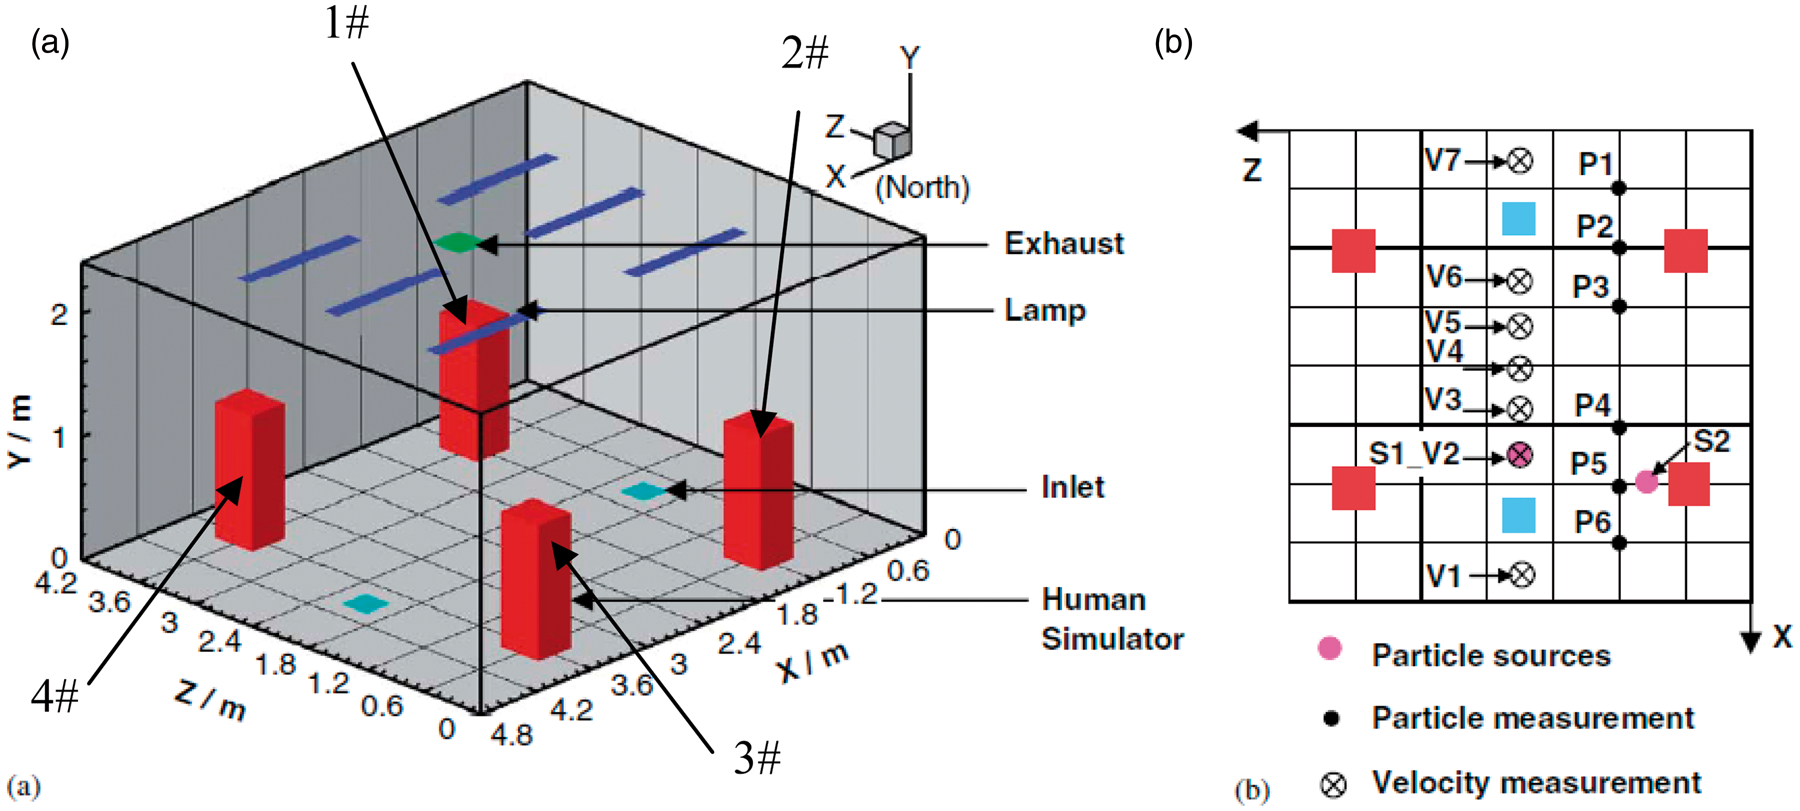
As shown in Figure 1, experimental measurements were carried out in a full-scale environmental chamber with UFAD. The chamber dimensions in the x, y and z directions are 4.91 m, 2.44 m and 4.31 m, respectively. Two air supply openings were located on the floor, and the exhaust outlet was located on the ceiling. Total air flow rate was set to 0.0944 m3 s−1, which was decided through designing the UFAD system for the experimental room. Four heated human simulators were placed on the floor and six lamps were installed on the ceiling. In the experiment,
34
a condensation monodisperse aerosol generator (TSI 3475, TSI Inc.) was used to generate fine Di-Ethyl-Hexyl-Sebacat (DEHS) particles with a density of 912 kg m−3. The generator could generate monodisperse spherical particles with a geometric standard deviation less than 1.2, and the mean particle size 0.7 µm was obtained in the experiment. As shown in Figure 1, the particle source was located 0.3 m above the floor at position S1 or S2 (referred to as Case_S1 or Case_S2), which could represent some particle releasing scenario at the low-level indoors. Particles were introduced into the room by a carrier gas (nitrogen) at a low flow rate. In the experiment, the nominal concentration (steady-state concentration at the exhaust) was two magnitudes higher than the background concentration, so the background noise on the measurement data was negligible. Airflow and particle concentrations were measured at six positions of five different heights as shown in Figure 1(b).
Experimental setup and particle concentration measurements in a room with UFAD, by Zhang and Chen.
34
The improved non-equilibrium wall function applied has been widely tested for the cases of natural convection, forced convection, and mixed convection in Gao et al. 26 A first grid size of 0.005 m was used in this study to cover the range of natural and mixed convection. For the experimental space, the numerical modelling used a structured grid consisting of 68,234 cells, which predicted results of temperature and velocity very close to those by 5 times of cell number. After the airflow field has been predicted by the turbulence model, the particle trajectories were then simulated using the Lagrangian method and particle concentration results were finally transferred from the Lagrangian results through using the PSI-C method. The time step for Lagrangian tracking was 0.001 s. The simulations were carried out using the FLUENT software.
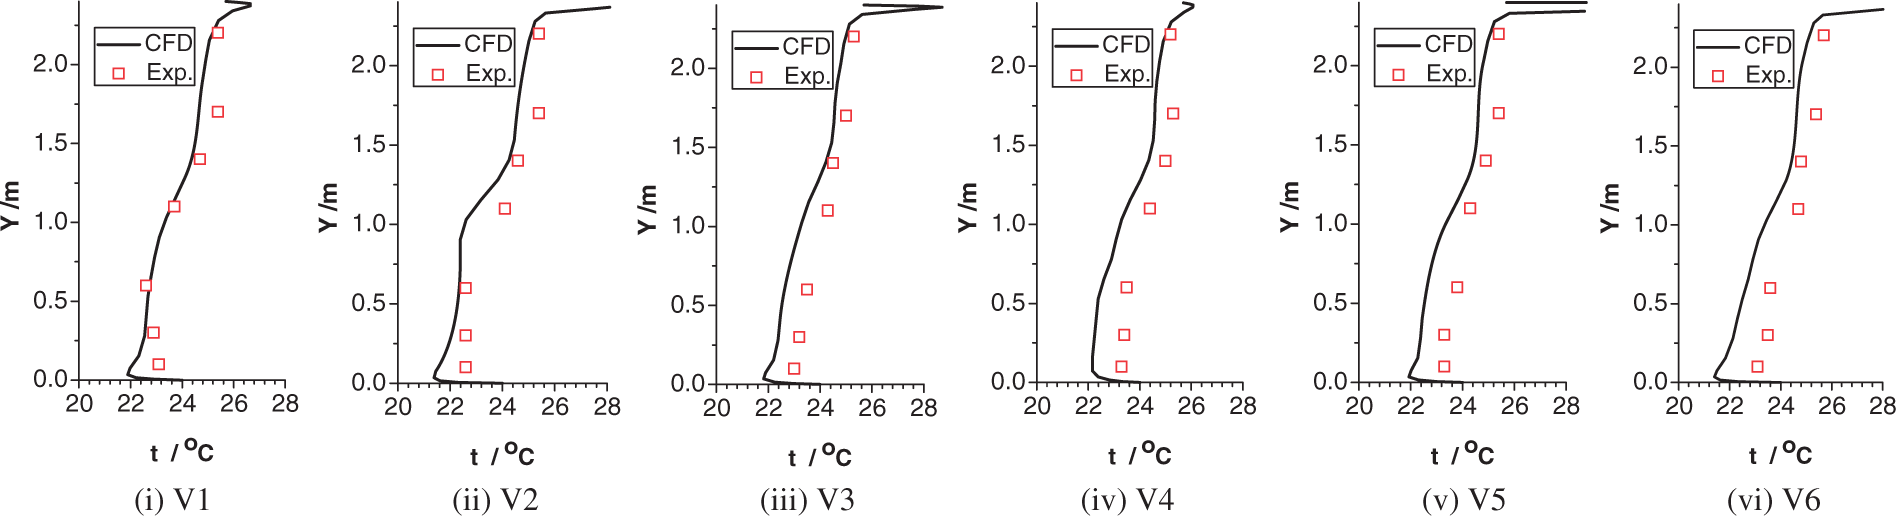
As shown in Figures 2 and 3, the simulated profiles of velocity and temperature agree well with the measured data. It means that the improved RNG k−ɛ model together with the hybrid wall functions is capable of capturing the mean flow characteristics in the room with UFAD, which makes up the basis of particle concentration prediction.
Predicted velocity profile at six locations and the comparisons with experimental data: (a) V1, (b) V2, (c) V3, (d) V4, (e) V5, (f) V6. Predicted temperature profile at six locations and the comparisons with experimental data: (a) V1, (b) V2, (c) V3, (d) V4, (e) V5, (f) V6.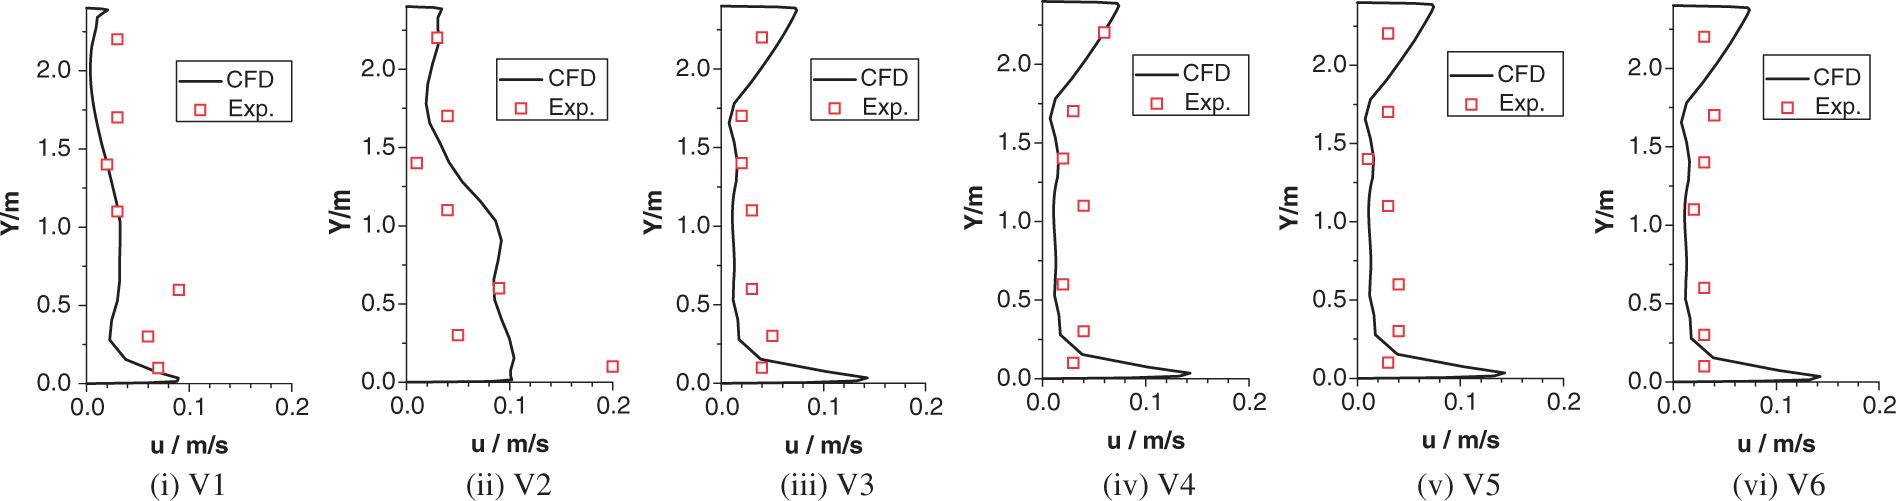
To achieve statistically stable results of particle concentration, the number of particle tracks was tested. 1000, 10,000, 50,000 and 100,000 trajectories were used in the same mesh as the airflow modelling to check the uncertainty caused by the turbulent disperse and the Brownian force (not understand). Calculation was repeated 5 times under each number of trajectories. Figure 4 presents the comparisons of particle concentrations predicted by the CFD under different number of trajectories with the experimental data for Case_S1. All curves tended to converge to the nearly same result except for the study using 5000 trajectories. The number of 10,000 trajectories with 5 repeats was sufficient to obtain a stable result of particle concentration for each case.
Particle concentrations under different number of trajectories at the six locations for Case_S1, predicted values and their comparison with experimental data (the particle concentration was normalised by the steady-state nominal particle concentration at the exhaust): (a) P1, (b) P2, (c) P3, (d) P4, (e) P5, (f) P6.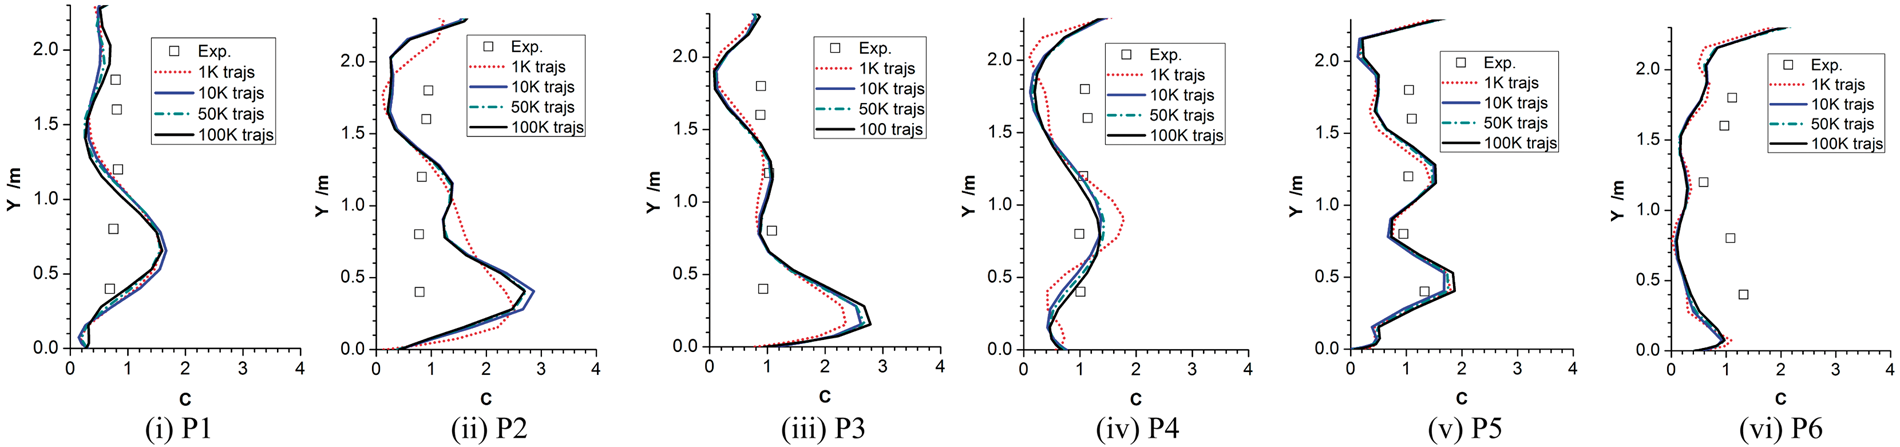
Figure 5 depicts the comparisons of experimental and simulation results for Case_S2 using 10,000 trajectories. A reasonable agreement was also obtained in most locations for Case_S2; however, high difference occurs at P5-P6. Such discrepancy should result from the strong flow fluctuations from the particle generator as discussed in Zhang and Chen.
34
Particle concentrations under different number of trajectories at the six locations for Case_S2, predicted values and their comparison with experimental data (the particle concentration was normalised by the steady-state nominal particle concentration at the exhaust): (a) P1, (b) P2, (c) P3, (d) P4, (e) P5, (f) P6.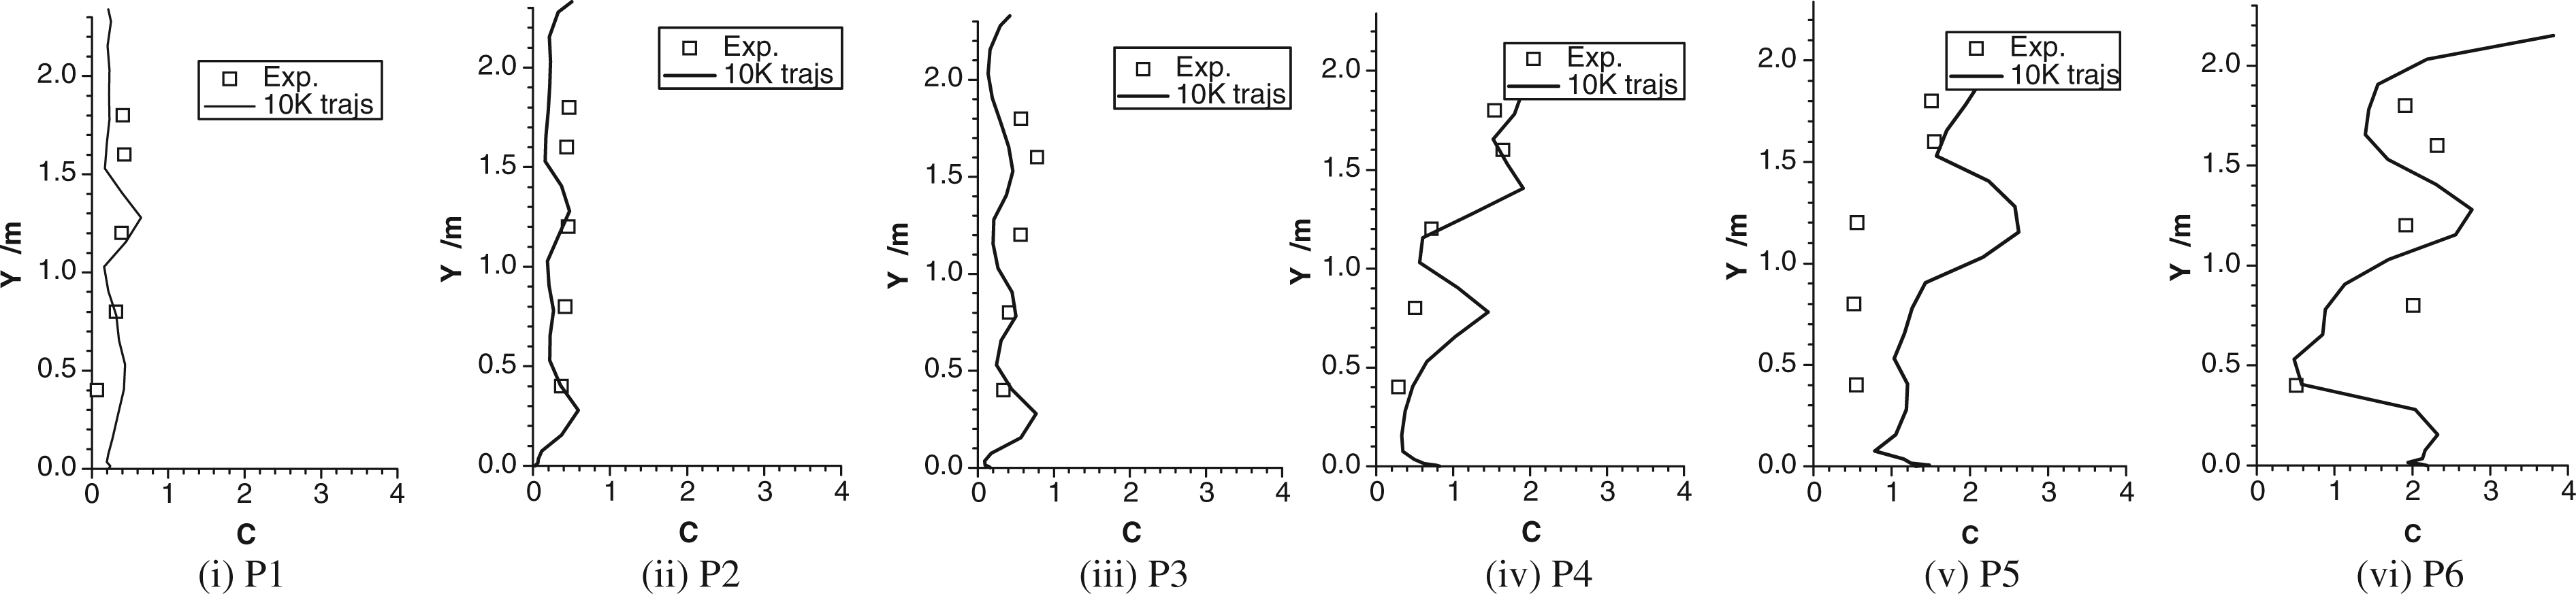
Figure 6 further derives the temporal development of particle concentration at exhaust by the numerical modelling and its comparison with the experimental observation under Case_S1. The concentration measured at the exhaust became stable after about 30 min of launching the particle release, both during the prediction and experiment. The development process was resulted from the mixing time of indoor particles and the moving time of bottom-up airflow. Such temporal process recorded during the experiment and simulation has helped to determine when the stable particle concentrations occur in the space and its stable value would represent the well-mixed level of particle concentration throughout the whole space.
Normalised particle concentration at the exhaust inlet for Case_S1, predicted values and their comparison with experimental data.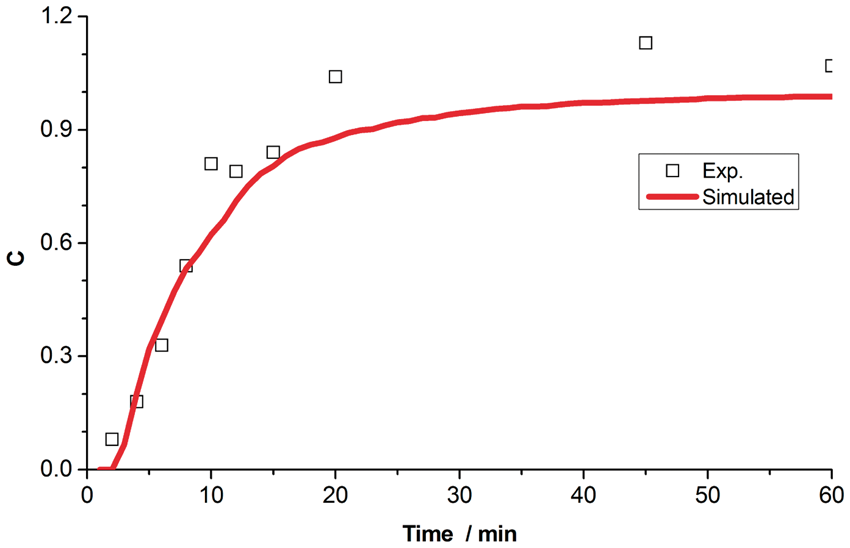
Assessment of intake fraction
Continuous emission scenario
In the experiments by Zhang and Chen, 34 particle counter took measurements inside the room when the concentration at exhaust became stable under the steady-state condition. Therefore, the particle dispersion and concentration in the experiments were approximately under the steady state. IF of particles emitted from a continuous source can be assessed through the four human simulators in the room. Taking Case_S1 as an example, ventilation rate of the room was 358 m3 h−1 and respiratory rate was assumed to be 0.5 m3 h−1. 22 A breathing mode of continuous inhalation was applied in the present work. Since the effect of inhalation on local airflow field was not considered, particle concentration was sampled in the numerical results at a location 0.05 m away from the human surface and at a height 0.1 m lower than the top level of the human. A normalised concentration was used by setting the concentration at exhaust as one unit.
According to Equation (2), if the room air is assumed well-mixed, IF would be derived as 1.4 × 10⁻³. However, the values of IF under the real exposed concentration are very distinct, as shown in Figure 7. Therefore, IF of indoor particles in Case_S1 ranged from 25% to 250% as the one with the well-mixing assumption. The averaged value of IF among the four human simulators was 78% of the value based on well-mixed air, which indicates that the well-mixing assumption may have resulted in an acceptable deviation for the total population IF of indoor particles, but was incapable of representing accurate IF for the individual exposure. Results under continuous emission condition in Case_S1 ensured that a person at the four locations may have inhaled about 3/10,000–4/1000 of the total number of particles released at S1. Therefore, health risk could be further assessed by multiplying the IF by a usage factor, emission factor and the toxicity of particle pollutant would be considered. Thus, the numerical modelling was validated to assess the IF of indoor particles.
Inhalation fraction calculated based on the well-mixing assumption and derived using CFD for Case_S1.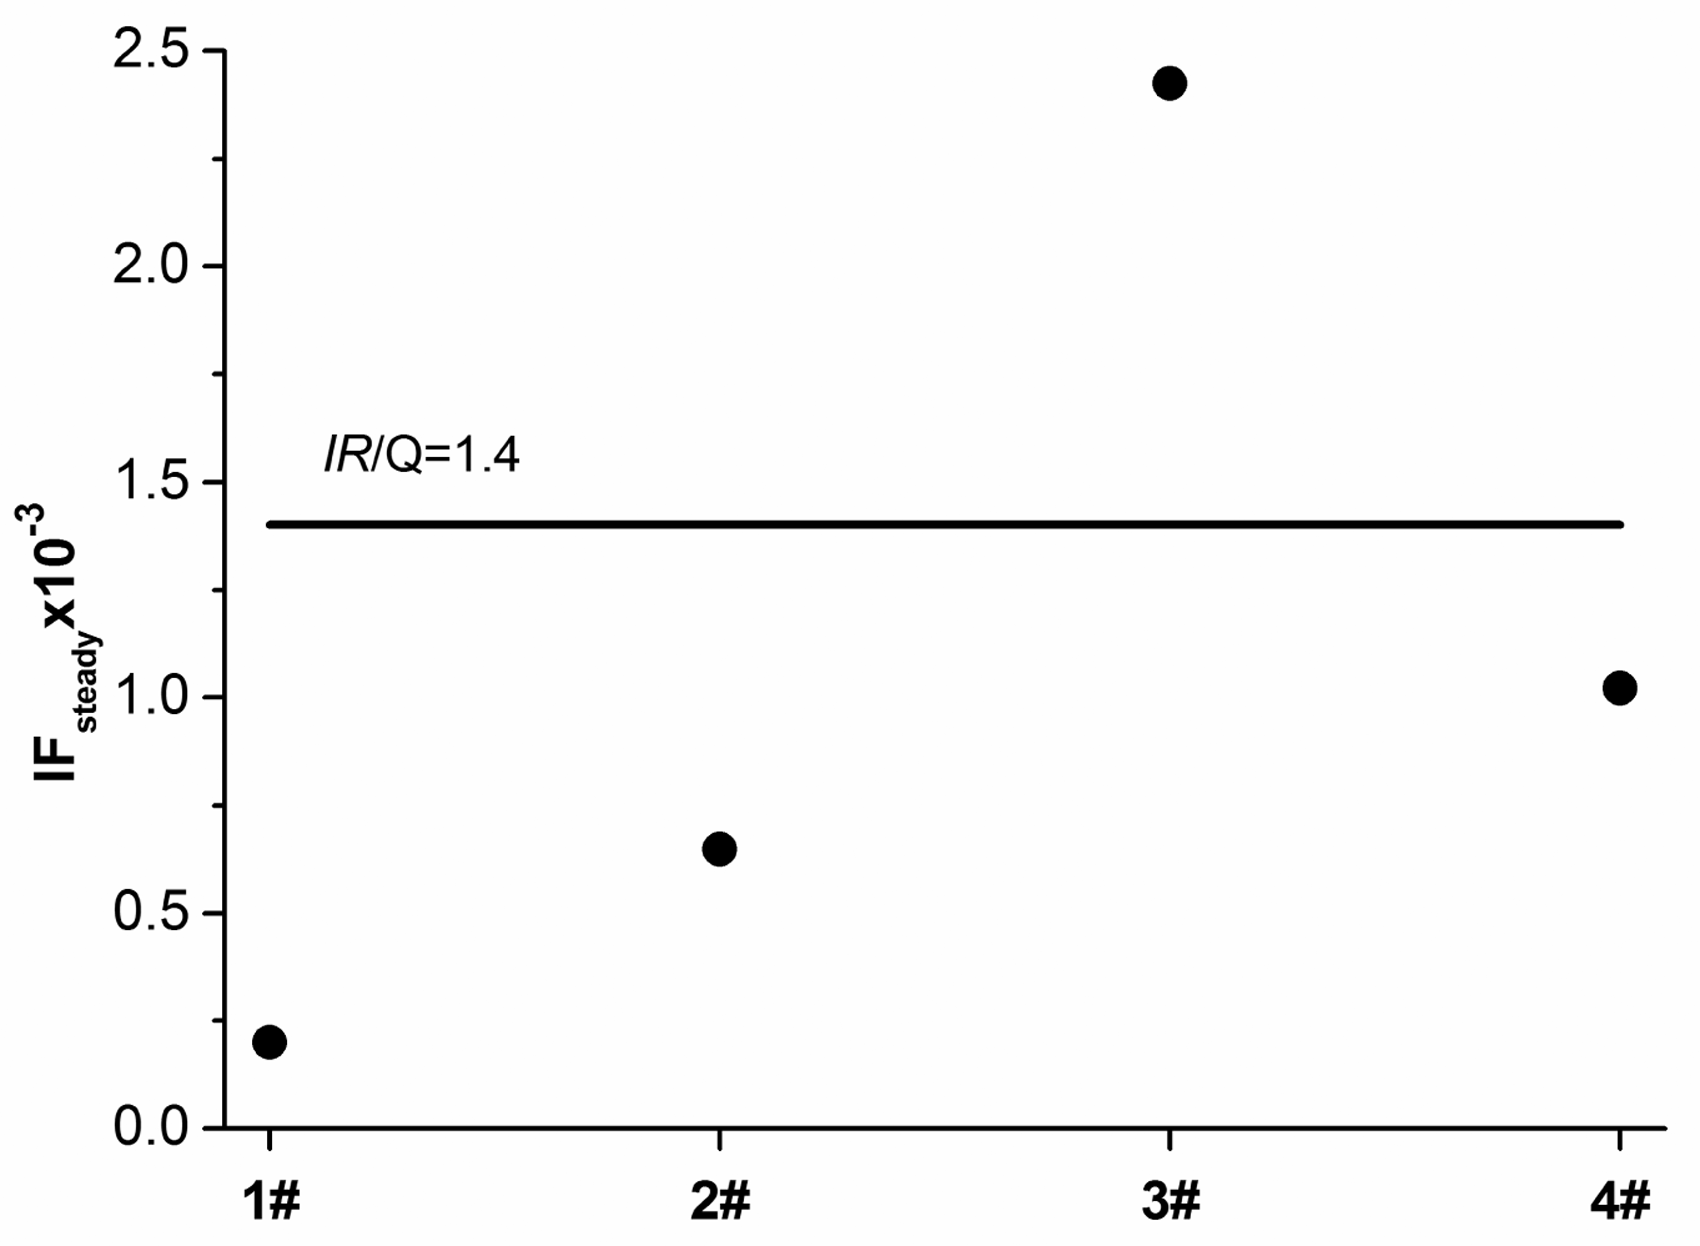
Episodic emission scenario
Since interpersonal spreading of certain infectious disease is strongly associated with the transmission of human exhaled particles, this work further assessed the IF of coughing particles in indoor environment with UFAD. The computational domain, 4.2 m (length) × 3 m (width) × 3 m (height), was described in Figure 8, where two persons were placed facing to each other with a distance of 1.4 m, one sitting and the other standing. This case was defined based on a real office room. Prediction of IF for this case presented some representative process for assessing the inter-person particle exposure in the real indoor environment. The episodic emission of coughing particles was assumed to occur between the two persons. Nevertheless, parameters relative to the coughing particle emission were well decided based on the experimental results in the literature.
Interpersonal exposure of cough particles in an office room.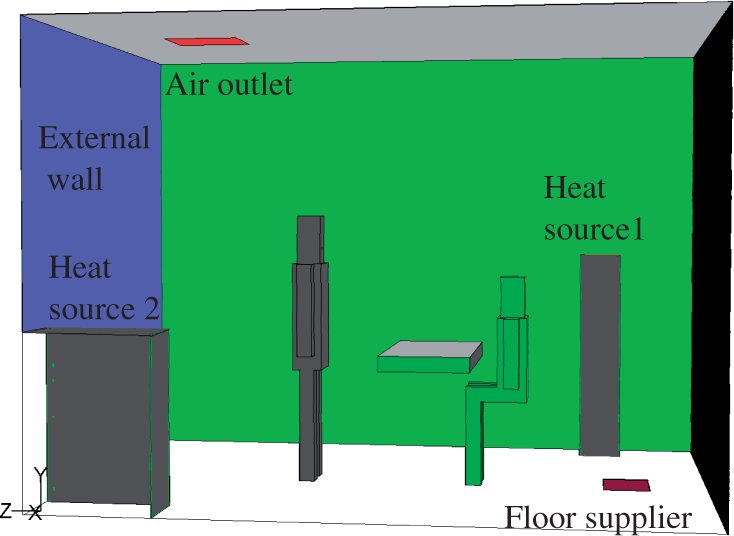
According to the study by Zhu et al., 35 the sitting person has a single cough within a duration of 200 ms, would exhale 10,000 particles and 1.7 L air. Morawska 36 showed that saliva droplets produced by a cough may quickly evaporate and only their kernels would spread out. The diameter of particles of a cough, dispersing in the space, can be assumed to be 1 µm. The standing person has a respiratory rate 0.5 m3 h−1 15 with continuous inhalation.
The sitting and standing person were set to have sensible heat 33.5 W and 38.5 W, respectively. The heat emitted from sources 1 and 2 were assumed to be 100 W, respectively, to produce two thermal plumes which driven some recirculation airflow in the space to affect the particle dispersion. The external envelope had an averaged heat flux of 5 W m−2 to represent the heat transfer from outdoors through the envelope. Other three walls were set to be adiabatic to represent the zero heat transfer between the adjacent office rooms. The floor suppliers delivered 144 m3 h−1 of air at 23℃ into the room, which were determined on the heat balance and cooling load for the office room. The exhaust was a pressure outlet.
A steady-state simulation was first executed to obtain the airflow and temperature field without a cough disturbance. As shown in Figure 9, two profound thermal plumes were observed along the simulated manikins and the space was thermally stratified. An unsteady-state simulation for the cough process started afterwards and the coughing particles were released. Finally, the IF for the standing person was calculated at each time step after the coughing.
Airflow field predicted on the centre pane in x-axis before a cough disturbance: (a) velocity field (m/s), (b) temperature field (℃).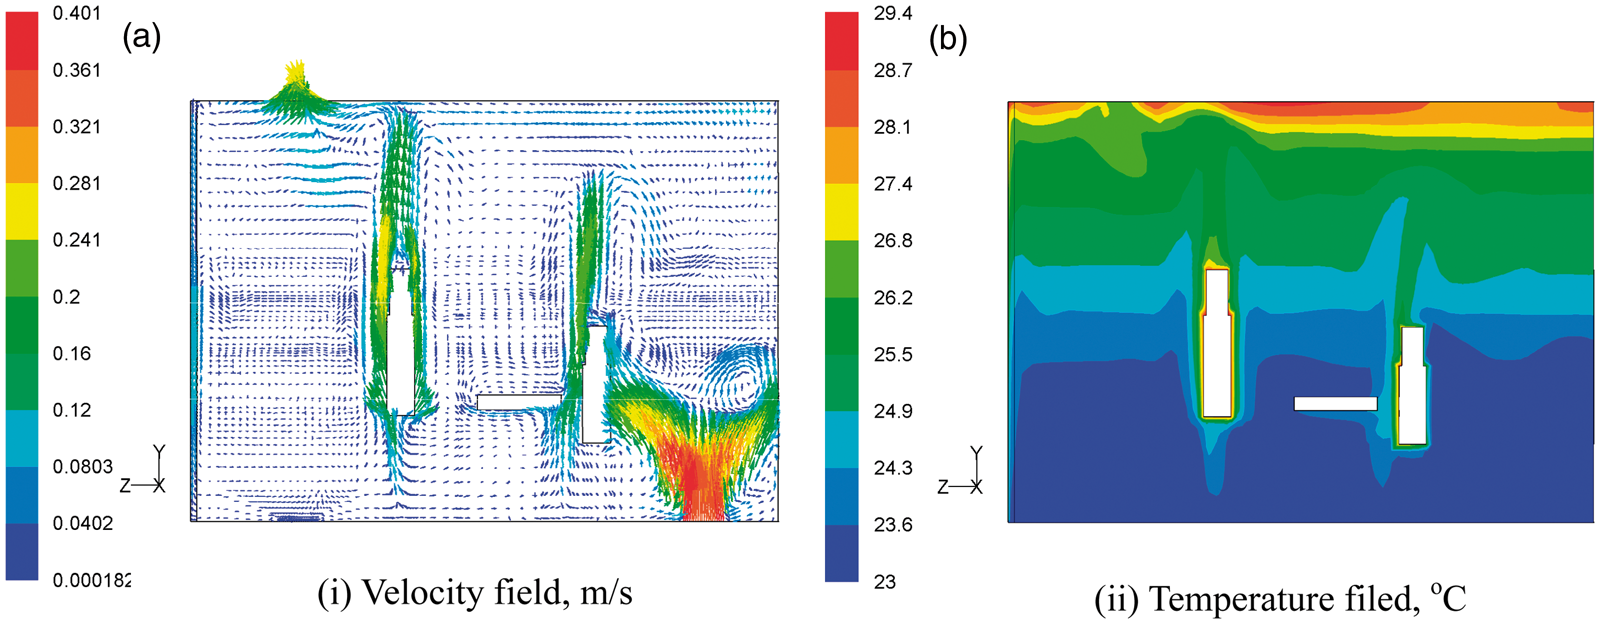
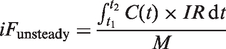
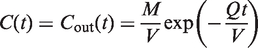
Figure 10 shows the particle concentrations around the persons after a cough process of 0.2 s. In less than one second, the cough particles reach the standing person due to high-speed cough flow. Thereafter the particles gradually move upward along thermal plume of the standing person. Figure 11 further presents the iso-surface of particle concentration of 100 m−3 at 1 and 2 min after the cough, confirming that cough particles released within 0.2 s could disperse and suspend in such a ventilated room for quite a long period. For such an episodic exposure, Equation (5) calculated the dynamic IF for any person in the room based on the mixing assumption. With the temporal and spatial variations of particle concentration predicted, however, Equation (3) could be used to obtain the real dynamic IF for the standing person when relaxing the well-mixing assumption.
Concentrations of cough particles after the single cough process (numbers/m3). Iso-surface of particle concentration of 100 m−3 at: (a) 1 min and (b) 2 min after the cough.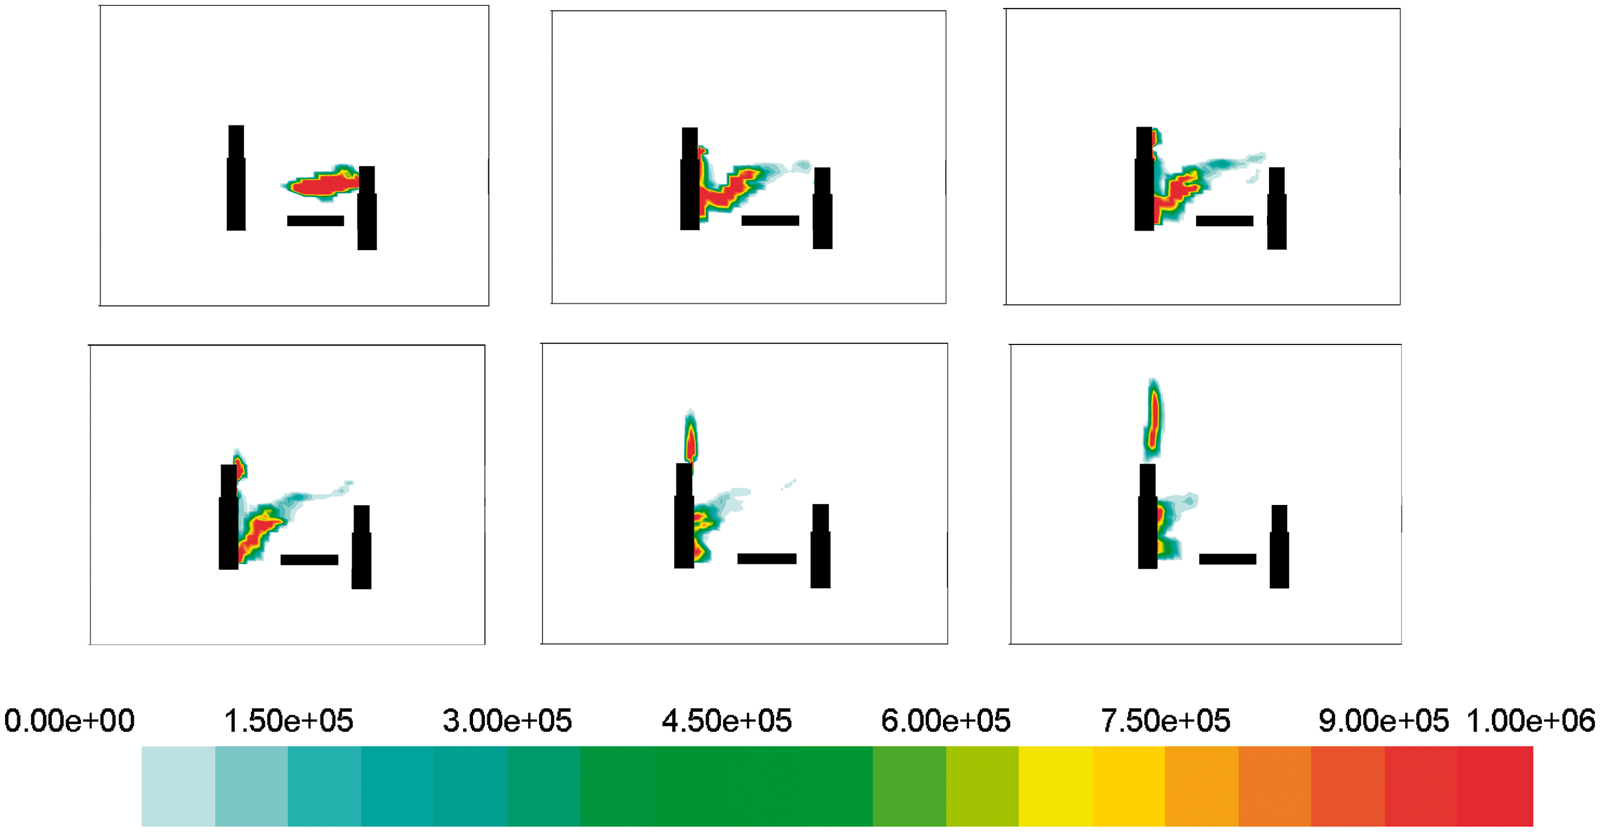
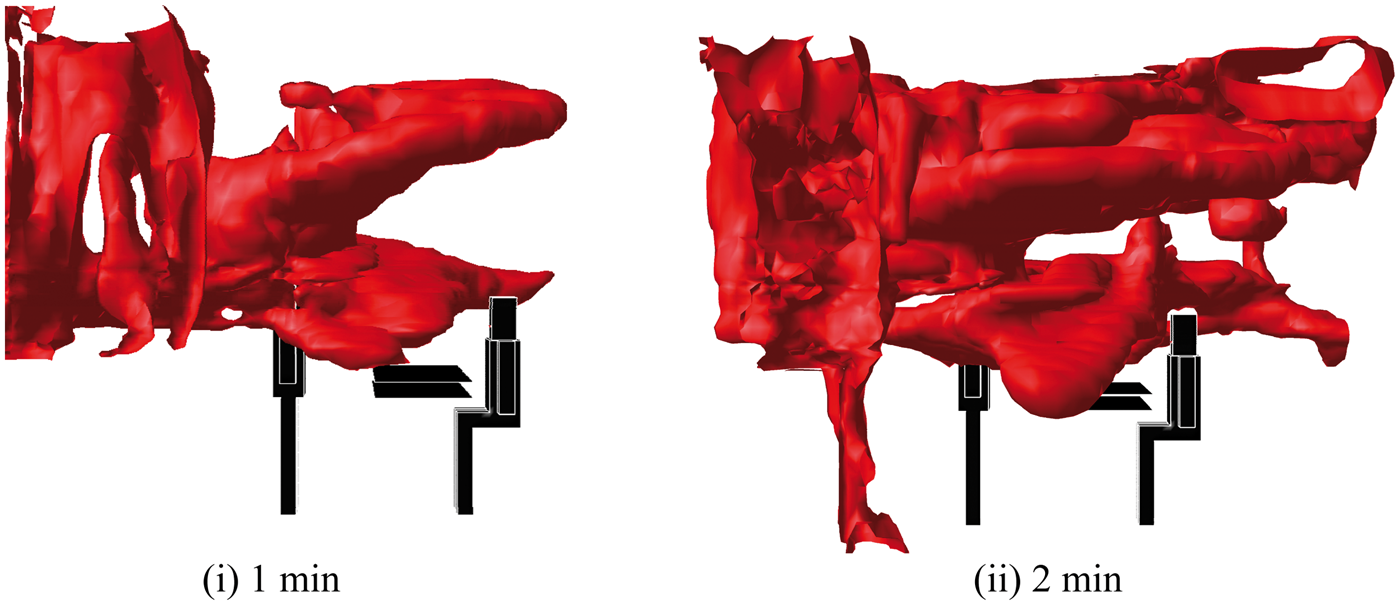
Figure 12(a) shows a continuous and smooth change of IF calculated by Equation (5) during the period of 2 h. A total 347 particles would be inhaled by the standing person and a fraction of 0.0024 was achieved at 1200 s. Figure 12(b) presents the dynamic IF within 120 s based on the CFD simulation and Equation (3), and its comparison with the calculation by Equation (5). There was a distinct discrepancy exist between these two results. The real fraction derived by the CFD simulation and Equation (3) demonstrated that a sharp increase would occur in a relatively short time after the cough and an IF of 0.0024 could be achieved at early 30 s. The real fraction also showed that 670 particles could be inhaled by the standing person at 7200 s, which would be about as 200% as the number calculated by Equation (5), which suggested that the well-mixing assumption for an episodic emission of particles in the room with UFAD could result in an unreasonable prediction of the IF. Thus, the numerical simulation was proved to provide detailed information on particle spatial concentration and its temporal variation; this would be a good and prerequisite approach for the further health-risk evaluation of indoor episodic particle pollutant.
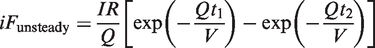
Dynamic IF for the standing person calculated using Equation (5) and its comparison with the real one predicted though combined CFD simulation and Equation (3): (a) iFunsteady by Equation (5), (b) iFunsteady by CFD and Equation (3).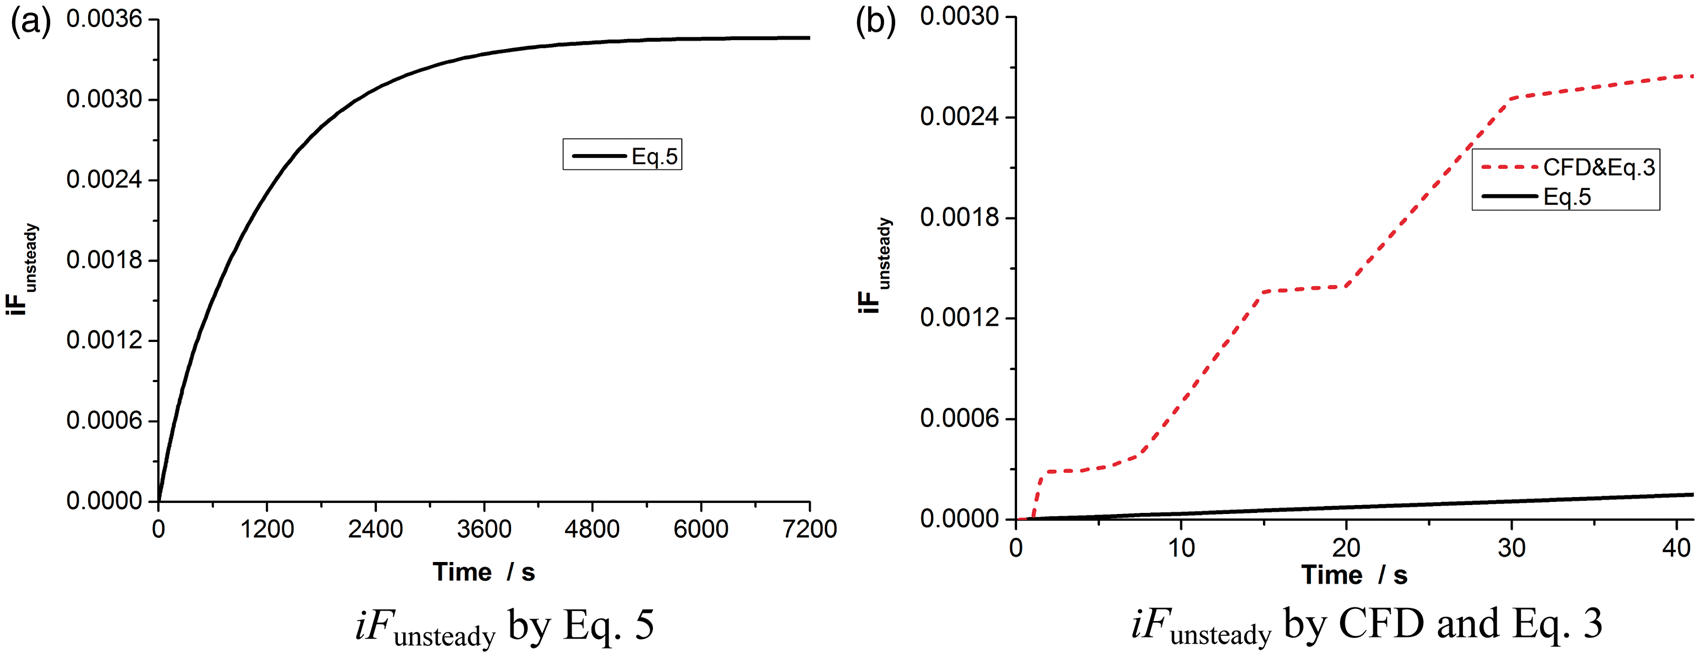
Conclusions
The present work focused on the evaluation of inhalation exposure to particles in rooms with UFAD system. Both steady and unsteady IF of particles from an indoor specified source were defined. Well-mixing assumption and detailed spatial distribution of indoor air were used to determine the particle concentration for evaluation, respectively. The CFD method with an improved turbulence model was adopted to predict the detailed information of particle concentration and its variation after its validation with experiments.
This method is effective to illustrate the IF of indoor particles from a specified source, while a measurement on site may be very difficult to complete such work. It is found that, in rooms with a continuous or an episodic (human cough) source of particles, personal exposure could be unreasonably evaluated if the well-mixing assumption is applied. Especially, under the case of episodic emission (a single cough), the IF calculated on the basis of well-mixing assumption demonstrates a distinct discrepancy with the real one derived by the CFD method. It means that it is prerequisite to use the temporal and spatial variation of particle concentration for the source-oriented health risk evaluation of indoor particle pollutants. Much work remains to be taken to directly relate the IF to the quantity of particles emitted from an indoor source under different patterns of air distribution. In the near future, it is of practical significance to assess the personal exposure to indoor particles under different airflow pattern and turbulent characteristics.
Footnotes
Acknowledgement
This work was supported by the National Natural Science Foundation of China (Grant No. 50908163) and State Key Laboratory of Pollution Control and Resource Reuse Foundation of China (Grant No. PCRRF09009), and partially sponsored by Shanghai Rising-Star Program (Grant No. 11QA1406800).
Authors are grateful to Prof. Chen Qingyan (Yan) at Purdue University who was generous to provide us the experimental data for the validation and the PSI-C source code for calculation of particle concentration based on the Lagrangian method in this paper.