






Abstract
As the UK and Scottish governments aim for zero-carbon housing, with tightly sealed building envelopes becoming paramount, indoor air quality (IAQ) and its implications for health has become a concern. This context relates to a 2008–2011 study, ‘Environmental Assessment of Domestic Laundering’, concerning the prevalence of passive indoor drying (PID). Assessment of PID impacts, shaped by built and social context including occupants’ habits and trends, draws on monitored data from 22 case studies out of a wider survey of 100 dwellings in Glasgow. The smaller group included analysis of air samples and provided scenarios for enhanced dynamic modelling via laboratory work on moisture buffering. The evidence suggests PID has important implications for energy consumption and IAQ; in the latter case because moisture levels are likely to boost dust mite populations and concentrations of airborne mould spores. Thus, findings indicate possible negative impacts on health, and the paper recommends amended standards allied to design guidance for improved practice, as well as further work related to volatile organic compounds.
Introduction
The overall research aim of ‘Environmental Assessment of Domestic Laundering’ (EADL) was to investigate the energy use and other potentially detrimental environmental impacts attributable to domestic laundering and to develop guidance to improve both aspects. The part played by laundering appliances in this regard has been addressed elsewhere. 1 This paper concentrates on compromised energy efficiency and indoor air quality (IAQ) by the common global phenomenon of passive indoor drying (PID) – especially urban flats in high-rainfall locations using a considerable range of airing devices. It also includes the issue of ironing. The research investigated several interactive strands: humidity, mould risk, PID influences and IAQ using CO2 to indicate ‘bad company’; air sampling and analysis of mould spores; moisture buffering potential of certain building materials, involving laboratory analysis; and dynamic computer modelling to determine moisture and energy impacts of PID. Potential health issues are explored, e.g. asthma (addressed theoretically relative to moisture and airborne mould spores). The issue of volatile organic compounds (VOCs) lay outside EADL’s scope.
Social rented housing in Glasgow was used as the main investigatory vehicle for two reasons. Firstly, it targets the greatest need and risk in terms of low income relative to laundering loads and corresponds with high intensity of occupation over daily and weekly cycles. Secondly, there was viable accessibility. Some private sector homes were included, and, despite the dominance of various types and ages of urban Glasgow flats over suburban forms, the demography and findings are deemed relevant and transferable to all housing sectors and beyond Scotland. 1
This paper confines itself to those aspects of the research objectives that relate primarily to the influences of PID on energy and IAQ and possibilities for mitigation:
To evaluate these influences in varied house types and demography, vis-à-vis the balance between energy efficiency and good IAQ, related problems such as condensation risk, and associated health implications. To measure and improve knowledge of transient, moisture-related properties of relevant materials, surface finishes, furniture, etc. To also augment (i) by analysis of air samples. To extract performance metrics for the design variables studied, based on scenarios from (i) and material tests in (ii) and to generate a theoretical framework enhancing the capabilities of ESP-r2 to dynamically model transient moisture transport. To influence housing procurement, aiming for improved statutory standards and disseminate a design guide detailing best practice.
a
The context for EADL was outlined by Porteous
3
who provided a historic review of IAQ and its influence on energy and health. Despite the lengthy build-up of knowledge between Dalton’s early 19th century work on dew point and mid-20th century capability to carry out a full constructional analysis of condensation risk, mould growth continues to be problematic within housing. This is in part due to the drive towards energy efficiency at the apparent expense of IAQ. The review also notes that the 19th century standard of 1000 ppm CO2 endures today as a desirable maximum indicator of IAQ, despite significant sociocultural changes. Similarly, the core method of air sampling and analysis dates from the 1880s
4
and remains a relevant precedent for equivalent data from EADL.
Twenty-first century research by Shove prior to EADL challenged the likelihood of effective intervention relative to changing human behaviour and lifestyle ‘outside the field of view’. 5 Shove documented long-term social changes concerning domestic laundering,6,7 e.g. citing scripts ‘written into…domestic washing machines and into the co-requisite sociotechnical arrangements (closed windows, machine washable clothing, etc.)’. Here, she relies on indirect data from Unilever interviewees, and appears to neglect PID, comparing tumble drying (TD) to external line drying only. Household habits, including those relating to domestic laundering, are also summarised in recent Swedish work, 8 using 31 dwellings of German Passivhaus standard. Contemporaneous UK work on patterns of domestic energy consumption argues that multi-disciplinary research is required to interpret and act on highly variable and context-dependent findings. 9 Another Swedish study relates three specific family circumstances to the efficiency and energy consumption of washing and drying, including PID. 10 Work on the health risk associated with Passivhaus-standard dwellings in the Netherlands 11 acknowledges PID as problematic and suggests alternative drying methods such as covered outdoor areas or special rooms.
The overall significance of occupants’ traits and habits with respect to IAQ and energy efficiency has been increasingly brought to the fore. Work in Denmark 12 highlights the issue of opening windows and adjusting set points on thermostats in response to perception of warmth and the perceived ambient environment. However, PID does not figure in this appraisal. Similarly, an earlier Danish study investigated IAQ via exposure–response relationships for emissions from building products, but not for portable items introduced through recurring events such as PID. 13 Work on perceived air quality and materiality (organic vs. synthetic building materials) suggests that a fragrance perceived as pleasant will give higher odour acceptability. 14 The latter raises a question as to whether fragrance from detergents and additives would raise or lower odour acceptability. Although such issues have been cited within larger reports, 15 PID and its influence on energy efficiency and IAQ remains under-investigated. This is the context that justified EADL, and within it, examination of PID – the reasons for its prevalence and its impacts.
Method
A survey of 100 households in Glasgow was conducted (S100). These embraced demographic and architectural variety, with an ‘interview-observe-measure’ survey process carried out in differing weather over a calendar year. This consisted of a comprehensive questionnaire, subject to observational checking and additional research by the investigator (e.g. architectural information), and measurements of temperature, relative humidity and CO2 (maximum 5000 ppm) in order to provide a ‘snapshot’ of found conditions during daytime, and for later comparison with continuous measurements over a 2-week period for a set of 22 dwellings (S22) from the main set. The three environmental parameters were recorded with an Eltek (Cambridge, UK) GENII Telemetry Transmitter GD-47, and vapour pressure (VP) was subsequently computed as a measure of absolute humidity (AH), mainly for comparison with CO2 readings.
The questionnaire was devised to capture contextual information together with specific laundering data. Some queries aimed to establish operational reasoning and perceived problems. Objective context included: type of dwelling, number of bedrooms, family make-up, intensity of occupation on weekdays and weekend; basic construction, floor finishes and furnishing; heating means and operation, methods of payments and estimated costs; and ventilation means and operation and any visual evidence of mould. Laundering data included: individual appliances for washing, drying and ironing, operational frequency, load settings, detergent types, etc. and reasons for use or partial use or non-use; use of communal appliances, reasons for this and location; special emphasis on means of drying – where, when and why for PID, passive outdoor drying (POD) and TD; individual and communal split, and, in the former case, associated heating and ventilating habits, and perceptions of indoor humidity.
Although EADL’s scope did not extend to health outcomes, it aimed to establish presence of indicators that other work has already shown to be relevant to aspects of health (e.g. humidity, dust mite population and asthma). The energy–IAQ balance is delicate, and the data acquisition and subsequent analysis explore the environmental vulnerability of increasingly airtight building envelopes coupled with relatively unstructured control of ventilation. In S100 the extent to which dwellings were insulated and airtight was not compliant with current standards, and airtightness depended mainly on double-glazed windows (not measured, but self-evident relative to age/type). User awareness of ventilation, and the means or lack of its control, was a key issue alongside that of heating and relevant habits and routines associated with laundering. The sociological context was also elicited, including economic and practical constraints and the motivations behind routines and habits that related to physical outcomes involving laundering processes.
S22 volunteers were representative of S100, 1 with statistically viable data collected in these over a 2-week period. This included the same environmental variables (equipment as for S100; with sensors located to avoid extraneous thermal influences), plus measurement of power consumption by appliances where possible. Householders’ diaries of laundering activity and other relevant habits augmented these data. Since findings relating to appliance use have been separately published, 1 this paper concentrates on measured and modelled consequences of PID relative to energy usage and humidity, and associations between IAQ and humidity.
Comparisons between CO2 and humidity were checked over daily cycles, and evidence sought of associations between humidity, relevant for dust mite populations, presence of PID and surface mould as a symptom of condensation. AH, given by a VP threshold,16,17 is an initial comparator for ‘critical equilibrium humidity’ (CEH) Dermatophagoides farinae (DF),18–20 common dust mite species in the United States, CEH Dermatophagoides Pteronyssinus (DP), 21 common in the United Kingdom, and ‘population equilibrium humidity’ (PEH). 22 Timing of PID after power consumption by washing machines, using information from diaries, and corresponding relative humidity (RH) and temperature levels were respectively crosschecked. As dust samples were not collected, the aim was to use moisture and temperature to indicate potentially large dust mite populations.
Key constructional finishes found in S100/S22 were subjected to laboratory analysis in order to quantify their ability to function as moisture ‘buffers’ in varying conditions. These findings then enabled an enhanced database of properties for use in dynamic computer modelling. Only summarised aspects of such test data and modelling are given here. Air sampling and microbiological analysis were also undertaken in S22 – firstly to determine the overall concentration of mould spores in the air in each main room/space, and secondly to analyse presence or absence of particular mould isolates in each dwelling. Both the overall concentrations and prevalence of isolates could then be compared with prevalence of PID in order to establish any indications of consistent associations.
Duplicate air samples, using SAS super 180™, one with malt extracts agar and the other with potato dextrose agar as the medium for microbiological identification, were taken in 5–6 spaces within each home when setting up sensors and equipment (living room, bedroom(s), hall, kitchen and bathroom between 9.0 a.m. and 12 p.m.). Occupants were advised to adopt normal indoor routines before and during the sampling. Plates were incubated at 23℃, the concentration of colony forming units (CFUs) per cubic metre of sampled air calculated and isolates later sub-cultured – in some cases to species level and in others only to genus level – all as described by Samson et al. 23
Thereafter, bearing in mind the size of S22, the CFU/m3 is considered as the dependent variable – firstly the arithmetic mean of all five spaces (six if two bedrooms); secondly, the arithmetic mean of living rooms and bedrooms, which were commonly used for PID. The independent variable (IV) was based on the presence or absence of PID, classified within four categories: TD dominant or only method used (IV1:TD), outside drying dominant (IV2:POD), PID dominant (IV3:PID) and a relatively equal mix of methods (IV4:mix). Paying due regard to a comparable study in France, 24 nine other ‘confounding’ variables were analysed: (a) season in 3-month periods (winter: December to February; spring: March to May; summer: June to August; autumn: September to November); (b) level of window opening (frequent opening, moderate opening and generally shut); (c) presence or absence of extract fan in kitchen; (d) ditto in bathroom; (e) main floor finish (carpet, laminate or timber); (f) presence or absence of house plants; (g) type of heating (electric or gas); (h) density of occupation (number of occupants ÷ number of apartments, where an ‘apartment’ is a bedroom or living room) and (i) floor level (ground up to 16th). The analysis then explores links between PID and non-PID and mould isolates – tertiary (hydrophilic, water activity aw > 0.90), secondary (mesophilic, aw 0.80–0.90) and primary (xerophilic, aw < 0.80).
Results
Housing provision
The varying characteristics of a wide range of housing types influence the diversity of drying methods adopted. PID was prevalent, but generally lacked effective means of isolating and exhausting moisture. Many of the S100 respondents perceived drying as a problem or issue.
There was a paucity of dedicated indoor drying spaces, utility rooms or other suitable places for PID. Only four S100 respondents had drying cupboards in use. Two of these had vents fitted and one mechanical extraction; a combination boiler and hot service pipes helped to heat another (naturally ventilated) and one respondent whose space had no vents and no heating perceived a build-up of smells inside it. The declared time for drying by each respondent was lengthy at 24 h, but this probably reflected the time clothing was left hanging rather than that necessary. Most of the dwellings surveyed could be adapted to provide a suitable drying cupboard, sometimes by restoration to original use. Five had conservatories or sunspaces used for drying. Only one respondent identified a designated utility room, 70 declaring ‘no’. No respondent had more than one such suitable indoor drying space, and the total number of cupboards, sunspaces and utility rooms was 10% of S100. Only half of the respondents declared access to outdoor or covered semi-indoor drying, and, of those, almost half indicated drawbacks including lack of security and lack of line space. Again, there is scope for improving existing provision.
Environmental context
The context as found militates against PID and ironing. The coexistence of poor air quality and high moisture levels indicates poor ventilation control relative to intensity of occupation, with high ambient humidity an added, partly seasonal, factor.
Spot data averages for S100 dwellings.

Note: Third column values in parenthesis (e.g. (24%<) for living room) indicate proportion of S100 dwellings where CO2 spot values were below 1000 ppm – remaining 76% of living rooms will be more than 25% above 1000 ppm; averaging 1355 ppm or 36% above the accepted maximum. Last column is proportion of S100 > Critical and Population Equilibrium Humidity (CEH and PEH).
Instances of CEH DF/DP and PEH exceeded due to PID in S22 dwellings.

CS = Case Study; (m) = windows moderately opened; (s) = windows shut; (o) = windows liberally opened; CEH/PEH as Table 1; DF = D. farinae (Arlian and Veselica, 1981),18 and DP = D. pteronyssinus (de Boer and Kuller, 1997),21 as cited in Crowther et al. 22
Notes: Columns 3 and 4 refer to specific PID events with a surge in RH following washing cycles; CS 2, 14 and 22 omitted as PID impact masked by other occupant related activities.
Air quality and moisture – numerical means.

CS = Case Study number, 1–22, of the S22 volunteers selected from the S100 households initially surveyed. This order was adopted to facilitate a coherent line of narrative research enquiry. Electric (e) and gas (g) heating in parenthesis after CS number.
CFU mean/m3 = mean number of ‘colony forming units’ found in each of five to six spaces by MEA (malt extract sugar) given in table.
Mould = visible mould on surfaces in: B = bedroom, K = kitchen, Ba = bathroom.
AQ-L/AQ-B mean ppm = mean CO2 in living room and bedroom(s); noting that 5000 ppm is the maximum instrument value; and where two bedrooms, highest value used.
VP-L/VP-B mean kPa = mean vapour pressure in living room and bedroom(s).
RH-L/RH-B/RH-K mean % = mean RH% in living room, bedroom(s) & kitchen.
The mean values for S22 RH (56.8%) and temperature (19.4℃) in bedrooms are above CEH DF and coincident with CEH DP, while those for living rooms with generally higher temperatures are below CEH DF (RH 51.4%, temperature 19.4℃). Individually, most instances above PEH were in autumn and those below CEH in spring or summer. However, overnight means in bedrooms during spring (mainly influenced by occupants, not PID) often exceeded PEH, e.g. 5 out of 14 nights for case study 4 (CS4) in spring. This also occurs during occupied evenings in living rooms, e.g. CS22 mean was well below CEH (RH 43.5%, 20.6℃), but for 3.5 h one evening it was well above PEH (mean RH 70.2%, temperature 23.5℃, CO2 2846 ppm). Although the absolute moisture benchmark of 1.13 kPa or 7 g/kg compares reasonably well with CEH, and even PEH, at a low temperature range (15–19℃), it is more useful as an indicator of occupancy – VP frequently tracking CO2.
Air quality and moisture – qualitative relativities.

CS = Case study number, 1–22, of the S22 volunteers selected from the S100 households initially surveyed. Electric (e) and gas (g) heating in parenthesis after CS number.
TD = tumble drier, including where in laundrette or other communal facility; where double-ticked indicates the dominant strategy where there more than one drying technique is used.
POD = passive outside drying, whether using communal or private space.
PID = passive indoor drying within the home, frequently employing more than one room or space.
CFU = colony forming unit (mould spores), expressed per m3 from analysis of air samples; where high = >1000, h-mod/l-mod. (high/low-moderate) 700–1000/500–700, low <500.
Mould = visible mould on surfaces in: B = bedroom, Ba = bathroom, K = kitchen.
AQ-L/AQ-B = air quality in living room and bedrooms; where good = CO2 mean < 1000 and max. <2000 ppm; mod = mean <1000, max. >2000; poor = mean >1000, max. >2000.
VP-L/VP-B = vapour pressure in living room and bedrooms, where high = max. >1.6 kPa; mod = mean <1.2 kPa, but max. >1.3 kPa; low = max <1.2 kPa; noting 1.6 kPa or ca. 10 g/kg gives RH levels above 70% for temperatures <19.7℃.
no d = no data available, in relation to AQ and VP above.
In cases where the RH, plotted as a function of temperature, remains consistently below CEH DF, e.g. CS17, there are other consequences – in this case liberal opening of windows while heating is still used. Indeed, it would appear that keeping below CEH is often reliant on this factor other than in summer – three cases for living rooms and four for bedrooms.
Such examples illustrate the inherent weakness of encapsulating arithmetic means (as Table 3), or other averages such as medians or geometric means. At some point, we need to investigate the particular, including maxima and minima at particular times of the day and varying relativity between temperature and moisture. Table 3 simply gives a sense of the range of averages, as does Table 4 in terms of what these signify in a subjective broad-brush manner.
The seasonal shift of emphasis from winter to summer, comparing initial S100 visits and S22 monitoring, is reflected in the latter’s lower mean CO2 values (living rooms 22% less; bedrooms 12% less); but S22 mean maxima are significantly higher than average S100 ‘snapshot’ values (living rooms 87% more; bedrooms 108% more) and bedroom maxima reflect poor IAQ overnight.
The association between high CO2 and high moisture was particularly evident in surges attributed to intense periods of occupation, accompanied by a rise in temperature, e.g. Figure 1, monitored bedroom in CS2. RH maxima usually correspond with maximum absolute moisture levels, and CO2, VP, RH and temperature can be high simultaneously, e.g. CS2 bedroom on 6th January during early evening: 4031 ppm, 2.5 kPa, 84.8%, 23.8℃, within a 10-min slot. Generally, moisture peaks occur during evenings in living rooms and overnight in bedrooms.
Typical moisture and CO2 relativity in a bedroom, also used for passive indoor drying.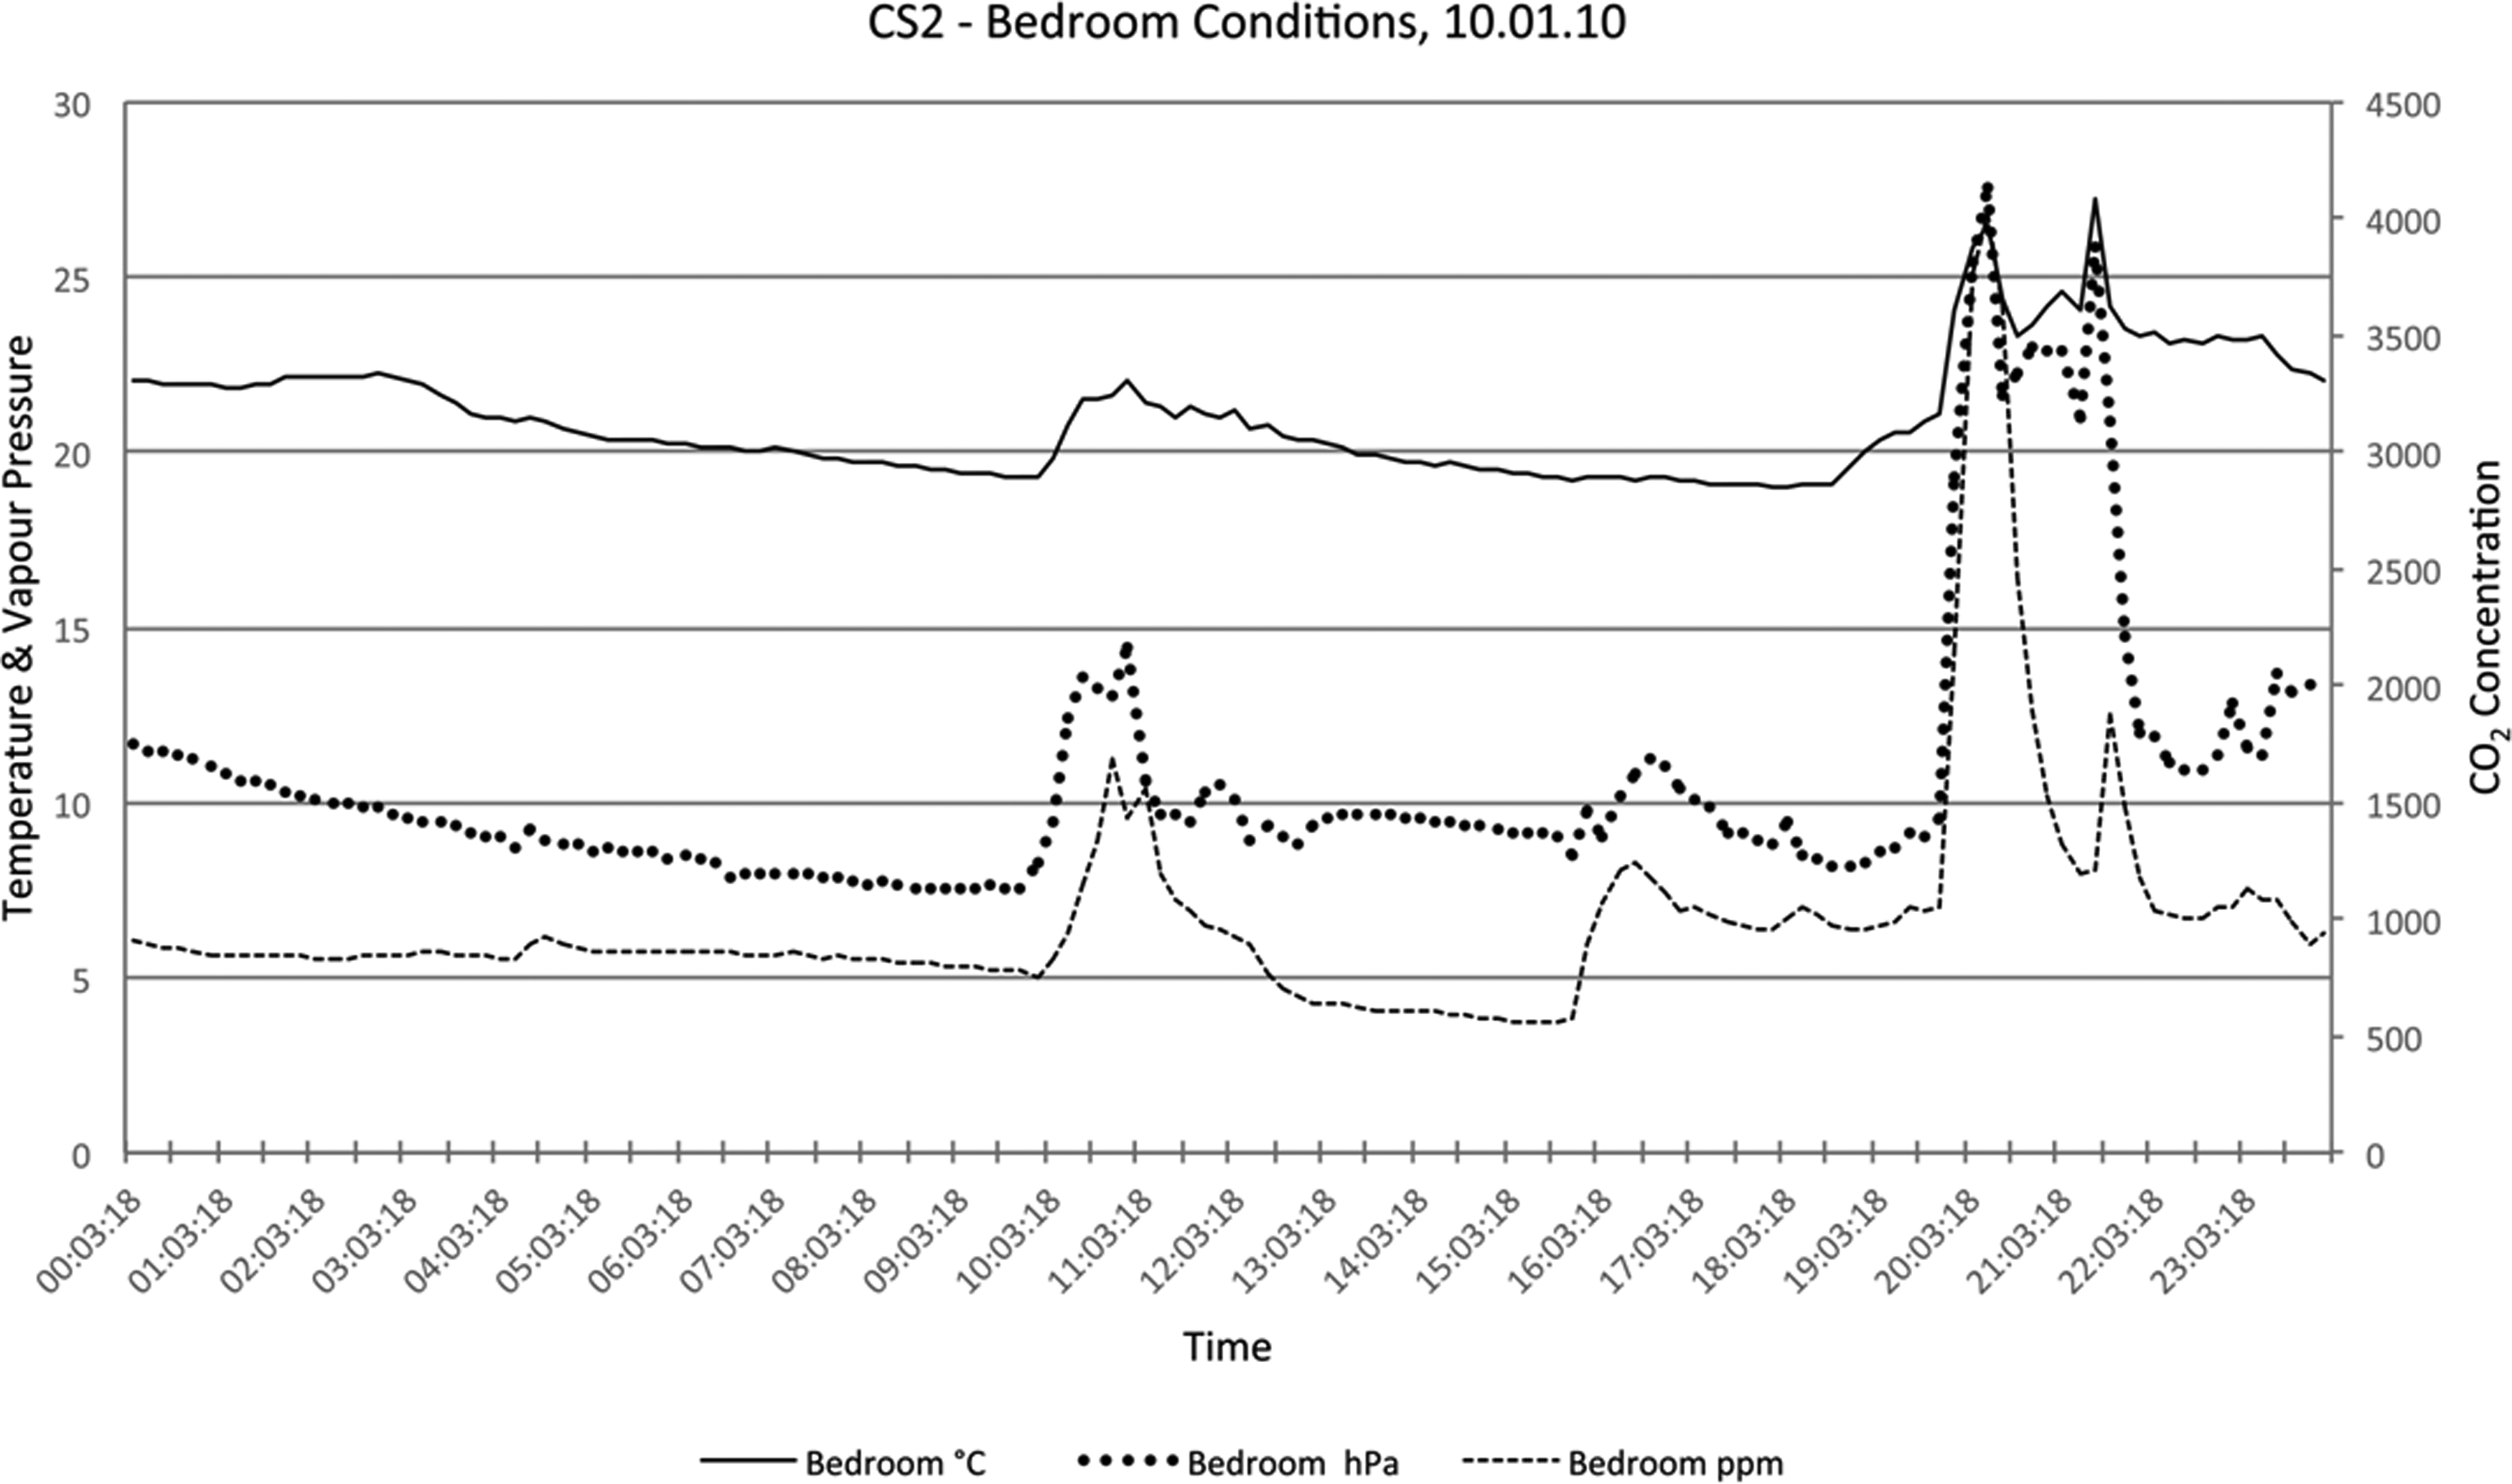
It is known that there may be significant variations of CO2 within a room, e.g. up to 400 ppm during an occupancy build-up in one field study; 26 and more in a controlled experiment in a naturally ventilated room, particularly vertically. 27 In S22 there was general consistency between CO2 levels in different rooms of dwellings. Since the emphasis is on CO2 as an indicator of ‘bad company’, rather than of stuffiness per se, and since occupancy surges during daily cyclical measurements over 2-week periods conform to expectations from field data, 26 any variations of CO2 within rooms above and below the measured values are unlikely to be misleading in terms of inferences.
Although the ability of PID to raise moisture levels was often masked or partly masked by quick-acting influences such as presence of occupants (Figure 1), the typical impact overnight in their absence was identified – indicated by falling CO2 contrasting with a PID-induced rise in VP of approximately 0.38 kPa and a rise in temperature due to the night-storage heating (Table 2 and Figure 2: living room). However, the level of moisture anticipated experimentally suggests that RH and VP should increase more significantly. The difference could be due to absorption within fabric and furnishing, higher air change rate, migration within the dwelling and/or less moisture initially released. The same would apply to the case of ironing, where tests indicated a lower rise in VP (0.15–0.2 kPa). Such increases, in particular due to PID, would not be overly consequential if it was not for the prevailing high levels, and an evident association with higher mould spore counts.
Overnight drying juxtaposition of moisture and CO2 compared with evening occupancy.
Those who passively dried indoors, with windows liberally opened during autumn, tended to have rather high absolute moisture levels, even though the air quality indicated by CO2 was reasonably good, at least on average, e.g. CS3 (Table 3), 19th October to 3rd November, with a living and two bedrooms mean VP of 1.31 kPa and CO2 of 719 ppm. This indicated that better control of ventilation was required, both to exhaust moist air at source and to limit ingress of damp ambient air at certain times of the year and/or in humid weather conditions.
Migration of moisture from one space to another indicates similarly poor control of ventilation. For example, in a kitchen-living adjacency in CS7, a peak of 2.4 kPa (83% RH) at 17.30 is reflected 20 min later by 1.9 kPa (73% RH) in the living room, where further moisture from PID would add to an already poor situation.
Seasonal influences and PID-related control decisions
Where perceptions lead to window opening while heating is still used, or even boosted, and PID is occurring, it will impact on energy for space heating. This section aims to move from broad PID-energy indicators (S100) to CS quantification (S22). Out of 34 S100 households interviewed in winter (December to February), 28 (82%) recorded PID, often in more than one space. Of these, 19 (68% of 28) located airers on/near heat emitters, and 6 (21% of 28) of these turned heat up to speed the drying process. In terms of moisture mitigation, 8 (31% of 26 applicable cases) said that a window was always open while drying, and a further 13 (50% of 26) occasionally opened windows. Some ‘occasional’ window openers coincided with heat-to-dry boosters, but none that ‘always’ opened windows also boosted heat. Similar tendencies were found in spring and autumn. Most of the ‘heat-boosted’ category occurred in spring (mean ambient temperatures lower than autumn by 1.64 K in Glasgow), while most with ‘window always open’ were in autumn.
Using the CS2 family size of seven as a winter example, with windows liberally opened, a Building Research Establishment Domestic Energy Model (BREDEM)-refined,
28
two-zone, steady-state analysis adjusted for January in Glasgow compared three scenarios. Dehumidification was by ventilation only for an intermediate terrace location, using TH07 Scottish Technical Handbooks
29
default U-value standards, and a floor area of 114.5 m2:
Mechanical ventilation with heat recovery (MVHR), and ‘all-day’ 16-h heating regime to 21℃ demand temperature (mean 20.4℃ in living room of CS2 for 10 wash days); zone 1 (living plus kitchen) and zone 2 (rest of house) respective values of 0.39 and 0.34 ac/h: 21 kWh/day. No heat recovery, but with the same heating regime and natural/mechanical air change rates of 1.00 and 1.07 ac/h in zones 1 and 2 respectively: 42 kWh/day. No heat recovery, ventilation rates doubled, demand temperature raised to 23℃: 88 kWh/day.
Broadly, the energy demand doubles moving from MVHR to natural/exhaust ventilation, and more than doubles again when the thermostat is raised by 2° as the ventilation rate doubles. Such differences would increase if the energy efficiency were below that assumed – i.e. below TH07 standard – and/or in an end-of-terrace or semi-detached location.
Dynamic computer modelling 30 of a notional semi-detached house for a winter week, with ventilation increased to approximate to CS2 PID conditions, compares reassuringly with the above BREDEM-based estimates. Modelling also examined the impact over a year for such a dwelling, washing at the relatively extreme rate of CS2 (2 adults; 5 children; all PID), with drying confined to 7-h spells in the living room, while thermostat setting was boosted by 3 K and windows left ajar (air change increased by 3.6 ac/h). The simulation predicted a rise of 3595 kWh from about 7000 kWh – more than 50%. Using the same notional area to that of CS2 for a seven-person family (114.5 m2), this suggests at least 30 kWh/m2 extra, partly or mainly due to PID. For a more typical five-person house envisaged in the model (89.9 m2) the increase would be approximately 40 kWh/m2.
Annual TD, at the same extreme frequency as the above CS2 PID scenario, is estimated to consume 1404 kWh or 16 kWh/m2. However, this is the electricity consumed at the point of delivery. With a generation and grid efficiency coefficient of 0.365 b , 31 primary consumption would be 3847 kWh or 43 kWh/m2 for an 89.9 m2 house. Assuming all additional modelled space heating of 3595 kWh is by gas and 85% attributable to PID, a primary to deliver efficiency of 0.9 and a boiler efficiency of 0.9, the primary PID addition to space heating is 3773 kWh. Approximate parity with TD is now evident. However, critically, both are unsustainably excessive. Additionally, appliances with flexible hoses to exhaust out of open windows (predominant in S22) may add to space heating demand in the same way as for PID, 1 and so comparison of TD consumption with PID-based simulations is not ‘like for like’. Moreover, the estimate, four times greater than the DEFRA average of 354 kWh, 32 is based on a large household with five children (CS 2). Given that volume of washing, had TD been employed, it is likely to have been only for some of the washing.
PID, visible moulds and mould spores
This section summarises findings that might connect PID to the presence of indoor mould or the airborne spore concentration (CFU/m3). As well as controlling humidity and affecting need for heat, variable ventilation impinges on spores and general IAQ indicated by CO2. In S22, autumn and winter have the highest CO2 and moisture levels are highest in autumn, followed by summer – ambient influence confirmed by analysis of particular cases. Indoor CFU/m3 is highest in winter and spring compared with summer and autumn, when one expects the highest values outdoors 33 – median values in an Austrian survey of 1000 CFU/m3 in summer cf. 360 in autumn, 250 in spring and 80 in winter. Respective summer and autumn indoor means for S22 were 752 and 638 CFU/m3, and those for winter and spring were 1068 and 1347 c .
Three issues are apparent. Firstly, there is no consistency between visible mould and spore count (Tables 3 and 4), noting the critical RH required for mould growth on various materials as a function of temperature and exposure time. 34 Secondly, there is a general lack of effective ventilation to avoid excessive RH spikes due to activities involving rapid moisture production. Thirdly, despite several confounding variables, the indications are that PID with slowly drying laundry has an association with both relatively high total spore concentration and a higher incidence of mould isolates, in particular ones classed as tertiary (hydrophilic). Depending on particular mould isolates, the third finding could constitute a potential health hazard for atopic occupants (see ‘Discussion: towards healthy, energy-efficient drying’ section). Finnish research stresses the ‘integral of the concentration over time’ and also the water activity (aw) range falls with rising temperature; for example, Aspergillus versicolor 0.87 at 12℃, but only 0.79 at 18℃. 35 This aligns with fuel poverty, where low temperatures and high RH provide more risk of mould growth.
Regarding ventilation control, more than half of S100 had mould in at least one room, with nearly 80% having at least one mechanical extract, but there was no convincing evidence that these mitigated presence of mould. More than one-fifth of S100 households passively dried indoors in the absence of any mechanical extract, with ventilation control reliant on window opening and operation of trickle vents (no dwellings with MVHR). However, these were not used in almost half the households in S100 and S22, indicating that they are a poor provision. Summarising, the prevalent high moisture levels and unsatisfactory IAQ relate to inadequate means, inappropriate usage and poor awareness of natural and mechanical ventilation control.
The lack of consistent association between total indoor airborne mould spore concentration (CFU/m3) and surface mould (Table 3) accords with work in Victoria, Australia. 36 However, this earlier study found that visible mould or condensation corresponded with Cladosporium spores, classed as secondary (mesophilic).37,38 They are also known to colonise on interior surfaces 39 even though spore levels indoors are generally driven by outdoor concentrations. 40 Conversely, Penicillium is a dominant indoor mould 40 and also secondary,37,38 with concentrations found in the Australian study to increase where walls and floors were not insulated. 36 The analysed sampling in Glasgow (20 out of S22) did not provide a similar association between airborne presence of Cladosporium and visible mould: 11 had both Cladosporium and mould present, 7 had Cladosporium present but no visible mould and 2 had neither Cladosporium nor mould is present. As Penicillium species are present in all but one of these homes, and Aspergillus, another dominant indoor species, 40 is present in all of them, it was self-evidently not possible to associate either of them with mouldiness.
However, S22 indicates a marked association between presence of PID and CFU concentration, which consistently tends to be higher when PID is present than absent. Figure 3 shows the ‘boxplot’ for four IVs: predominant use of tumble drying (IV1:TD), passive outdoor drying (IV2:POD), passive indoor drying (IV3:PID) and mixed methods (IV4:Mix).
Boxplot.
Means and standard deviations.

Means and standard deviations.

F tests comparing drying methods.

Cfu_all = CFU/m3 for all spaces: Living room, bedroom(s), kitchen, bathroom and hall
Cfu_liv/bed = CFU/m3 for Living room, and bedroom(s) only
Sig.(p) = significance (p-value)
Means and t-test for IV3:PID = 1.00 and IV1:TD, IV2:POD and IV4:mix all as IV:rest = O.

Note: Code 1 assumed for independent variable IV3:TID, where passive indoor drying is dominant method, and Code 0 for the other three dominant methods treated as one group IV:rest; equal variances not assumed for second row of figures, sixth and seventh columns.
Multiple regression of seven potential confounding variables.

Note: B and Beta, respectively, are conventional symbols for unstandardised and standardised coefficients, and t is the t-test value as in Table 8.
Tests were also done to establish whether intensity of occupation was significant: firstly, CFU/m3 for all spaces against the number of occupants; secondly, comparing homes with adults only to those with children; thirdly, the density of occupation taken as the ratio of all occupants to number of apartments (bedrooms + living room). Again this showed no significance for occupation factors, relative to IV1-4. While regression showed IV3:PID to be significant, p = 0.001, the coefficient for density, p = 0.093, was negative – i.e. higher densities and fewer mould spores, which has no evident logic other than a random paradox. Finally, no statistical significance was found for the independent variables IV1-4 relative to moisture variables (RH or VP).
Comparative presence of isolate types in cases above and below 1000 CFU/m3.

Note: Total 49 isolates (49 No.) identified, of which 19 are tertiary, 14 are secondary and the balance of which are primary; yeast isolate ignored as present in all case studies.
Taking all tertiary, secondary and primary isolates in the IV3:PID cases (total 49), the IV3:PID set of six case studies remains slightly higher than the remaining 14. Averages for 16 secondary isolates reverse this trend slightly. Nevertheless, in two cases where presence of specific isolates is high in both groups – e.g. Aureobasidium pullulans and Ulocladium chartarum37,38 – the IV3:PID set has a marginally greater proportion.
Proportions of specific tertiary isolates: sets above* and below** 1000 CFU/m3.

Note: Proportions given in number (No.) and percentage of specific isolates identified in set of six PID cases* above 1000 CFU/m3 (first row of values); and in set of 14 cases that are not PID dominated** below 1000 CFU/m3 (second row of values). For example, column 1 of the first row means 2 No. or 33% of a set of six PID cases; and column 1 of the second row means 2 No. or 14% of a set of 14 non-PID cases.
Hygrothermal role for lining materials – modelling a drying cupboard
Laboratory analysis in support of dynamic energy and moisture modelling overlapped with, and was informed by, the data collection and analysis stages of the fieldwork. One emergent aim was to establish whether hygroscopic materials could help to flatten RH profiles in small and discrete drying spaces, especially in the initial drying stage, and hence inhibit RH peaks for a given rate of extract. Another was to establish the same potential worth in terms of mitigating moisture-producing activities in larger rooms (e.g. sleeping overnight and ultimately responsible for a proportion of laundering).
A monitored PID exercise in a domestic setting was carried out in association with laboratory experiments to find absorption characteristics of various building materials. In the former, VP plateaus at approximately 1.2 kPa after 4 h having started at 0.97 kPa, while temperature rose from 18.5℃ to 22℃. The exercise indicated that a typical 15 item load, dry weight 3.76 kg, releases moisture at 285 g/h over 7 h, totalling approximately 2.0 kg or litres. Similarly, 17 items (two additional cord equivalents), dry weight 4.84 kg, release moisture at 355 g/h over 7 h totals approximately 2.5 kg or litres. One may compare this with the range 2.2–2.95 kg given for a 3.6-kg load in the late 1980s, 48 and more recently cited. 49 Given higher spin rates today compared with 1988, the PID test values appear realistic. Also, approximately 88% of the moisture is released in the first 4 h of drying in the test conditions – reasonably warm and well ventilated.
Initial laboratory tests indicated that differences in moisture buffering capacity between certain materials at 65% RH might justify their use as linings to a drying cupboard. However, long-term equilibrium moisture content of respective hygroscopic materials can be deceptive compared with the moisture absorption by the same set of materials over a short time period. In an equilibrium test (criteria include three weight measurements at least 24 h apart), at 65% RH, unsealed cork absorbs 37 g/kg, a proprietary clay board 24.5 g/kg and matt-painted plasterboard 4.5 g/kg. However, at 65% RH, short-term gain of 7.0 m2 of the same three materials (as in a 1.75 m3 drying cupboard) indicates clay board absorption rate of 61 g/h (0.9 g/kg h) compared with 7 g/h (0.7 g/kg h) for cork and 12 g/h (0.2 g/kg h) for plasterboard. Values also vary exponentially with RH. At the undesirably high moisture level of 90% RH, the clay board is calculated to absorb 262 g/h, plasterboard 112 g/h and cork 42 g/h; at 75% RH, approximately 117 g/h, 36 g/h and 16 g/h. Returning to 65% RH, this suggests that such moisture buffering could absorb 244 g of moisture over 4 h, or 14% of the first 4 h of drying for a washing load with moisture emission of 2.0 kg (88% of 2.0 kg = 1760 g ÷ 244 g = 13.9%).
However, dynamic modelling of a 1.75 m3 drying cupboard indicates greater complexity. 30 Damp washing initiates evaporative cooling whilst adding moisture. A series of simulations at 15 l/s, with simple extract and MVHR operating continuously showed better results than intermittent, humidistat-switched control, but still with RH maxima invoking risk of condensation and mould. Continuous extract lowered RH, but consumed considerably more energy than intermittent, whether with or without heat recovery, e.g. respectively 19 kWh cf. 12 kWh and 57 kWh cf. 22 kWh and for a winter week and unpainted plasterboard lining.
Further modelling at 30 l/s indicated environmental viability, with the extreme condition in summer having a period of 24 h with ambient RH averaging approximately 90%. This caused RH in the drying cupboard to exceed 70% for a 4-h period while a fan operated at 30 l/s. Research in the Netherlands explores the risk of intermittent spikes in RH causing mould growth.34,50–52 However, despite the cautionary note, the 4-h surge was for a non-hygroscopic lining, with moisture absorption in the surfaces not explicitly modelled. Simulations of specific moisture-absorbing materials such as clay board were ongoing at the end of the EADL study d . Since the laboratory experiments indicated that clay board would absorb 3.25 times more than painted plasterboard at 75% RH, the simulations may have some damping effect on occasional summer peaks. However, a confined space and rapid exhaust seem likely to militate against this.
Discussion: Towards healthy, energy-efficient drying
PID health implications
This section probes the results relative to health. As dust sampling was not resourced within EADL, the influence of PID on dust mite populations was difficult to isolate from other ‘wet’ activities in many instances. Nevertheless, the analysis shows that RH is frequently above accepted CEH/PEH thresholds, to which consequent allergen exposure and asthma exacerbation in sensitised individuals has been causally linked. 53
Asthma and allergic rhinitis are also linked to sensitivity to mould isolates, e.g. 6% to tertiary A. strictum, with lower sensitisation to S. chartarum at 3%, 54 aligning with other work;55–57 stressing and citing variability in allergen content as an issue, 58 and in tertiary species such as Alternaria alternata, A. fumigatus and secondary Cladosporium herbarum. 59 Similarly, tertiary A. fumigatus “causes invasive allergenic disease” to vulnerable immune systems.60,61 But even primary Aspergillus species, present in all S22 dwellings sampled, and Penicillium, in all but one, are considered to ‘contaminate indoor spaces biologically’ and ‘are important sources of allergens’. 33
Finnish research supplied ‘the direct link between exposure and health symptoms’, confirming a high dependence on the atopic status of subjects in terms of reaction.62–64 UK research 65 lays more stress on health risks from low concentrations of mould, viz. ‘Satratoxin H’ produced by S. chartarum in damp houses capable of causing ‘necrosis and haemorrhage’, and cites earlier and more recent work regarding health impacts.66,67 More recent work includes tertiary P. Herbarum, R. stolonifer and S. chartarum as ‘strongly associated with odds of respiratory illnesses’. 38 A cluster of cases of pulmonary haemosiderosis in infants in Ohio, led to the isolation M. echinata, closely related to Stachybotrys. 68 ‘Radioallergosorbent’ tests of airborne tertiary B. cinerea 69 found significant sensitivity in atopic subjects, e.g. 24% of suspected mould allergic children with asthma in Finland, and 52% with suspected mould allergic patients in the United States.
Hence there is variable health significance of mainly tertiary mould isolates found in S22. Associations exist between severity of asthma 70 and sensitisation to other mould species classed as secondary, such as A. pullulans.37,38 Also regarded as tertiary, 71 the lower classification is adopted in EADL. Another study 72 links Exophilia jeanselmei to bloodstream infection, normally of low virulence; but confirmation of the aw ratio for this species has proved illusive, and accordingly it has also been deemed secondary. U. chartarum is another species that appears to be mesophilic, but on the cusp of tertiary, aw ratio of 0.89.37,38 This species is also associated with type 1 hay fever. 73
The observations here are predicated on the taxonomy of isolates into their tertiary, secondary and primary categories, in particular the first. The tertiary group of a further nine isolates in addition to those already cited (total 19 tertiary isolates) comprises: Acremonium spp.; 42 Alternaria alternate; 47 Chaetomium globosum;38,42 Fusarium culmorum; 74 Fusarium sporotrichides; 75 Geostrichum candidum; 76 Mucor plumbeus;37,38,47 Mucor racemosus 42 and Phoma glomerata. 71 For isolates deemed secondary, the following 13, in addition to three cited above in connection with health risk, are Aspergillus flavus, A. ochraceous, A. versicolor; 37 Basidiomycetes,77,f Ascotricha chartarum, 78,f Cladosporium cladosporioides, C. herbarum, C. sphaerospermum, 37 Curvularia geniculata, g Epicoccum nigrum,37,38 Fusarium spp. h ; Fusarium solani 37 and Scopulariopsis brevicaulis.42,79
The review of the presence or absence of specific mould species validates the relevance of higher overall airborne spore concentrations associated with PID. This group had a proportionately greater presence of tertiary species in comparison to other forms of drying (both average for set of tertiary isolates identified, and proportion of specific isolates), approximate parity for the secondary species and a greater proportion of total isolates. It has long been recognised that CO2 is a useful IAQ indicator of ‘bad company’ and remains so today. 3 However, in this case CFU concentration is not necessarily recognised by CO2 since PID may occur in the absence of the occupants. Moreover, overall CFU/m3 cannot be easily or cheaply measured, let alone concentrations of mould isolates.
The literature reviewed suggests that health risk attributable to airborne spores varies considerably. Accepting this caveat, the range of values of CFU/m3 and isolates associated with the presence of PID is of a level whereby the health of atopic occupants (vulnerable to hay fever, asthma and eczema) could be adversely affected. Although not as relevant as presence or absence of specific species, the arithmetic mean total concentration is over 3 times a Finnish health limit of 500 CFU/m3, 80 in turn supported by earlier Danish research. 81 Further, the Institute of Medicine in the United States predicts that 6–10% of the population and 15–55% of atopics are sensitised to fungal allergens. 53 This range is commensurate with contemporaneous work, 82 indicating respectively up to 6% and 20–30%. Later commentary adheres to these broad estimates, and reports on skin-prick tests at 29 European allergy centres, which gave a range of 1.3–52% allergy and median of 18.8% for airborne B. cinerea, comparing this to a 40.5% median for allergic response to at least one fungal species. 69
An underlying hypothesis supported by the evidence is that damp textiles drying slowly over a period of several hours (up to a day or more in moist, cool conditions) tend to be more potent, in terms of fostering fungal spores, compared with other producers of moisture that are more concentrated but in shorter durations (also more convectively driven and often exhausted rapidly). The prevalence of washing cycles at or below 40℃ may also result in spores present in dirty laundry remaining active once clean.83–85. Virtually all – 95% (89 out of 94) in S100 – used 40℃ or 30℃ as the most frequent wash temperature, and 39% (37 out of 94) 30℃. In the S22 IV3:PID set exceeding 1000 CFU/m3 there are three at 30℃, three at 40℃ and one at 60℃, the last having the lowest CFU count of these seven households.
However, doubt can linger as to coincidence in the statistical analysis of a small sample. Geometric means help to correct the bias of outliers shown in the ‘boxplot’, Figure 3 (more representative than arithmetic means). In the eight IV1:TD case studies, the geometric mean for living rooms and bedrooms is 644 CFU/m3 (2.7% lower than arithmetic mean 662). For the nine IV3:PID homes, the geometric mean is 1398 CFU/m3 (8.5% lower than arithmetic mean 1528).
It is also reassuring to find a rationale for particular outliers masked in the averages above, but evident in Figure 3. For example, in CS6, with no significant surges in humidity corresponding to TD cycles, all rooms have very high RH/VP and poor IAQ, the latter suggesting that ambient influence is low. Means for VP, RH and CO2 are, respectively, 1.54 kPa, 73.6% and 2046 ppm for living room and bedrooms combined, and equivalent mean maxima are 2.01 kPa, 87.5% and 5000 ppm (instrument limit). But spore counts exceed 1000 CFU/m3 in all spaces apart from the kitchen. Nevertheless, the count of tertiary isolates is significantly lower than the average for the PID set (3.0 compared to 6.5), and even the number of secondary isolates is below average. Rather than simply being exceptions, knowledge of specific circumstances also helps to explain other outliers (e.g. CS7 and CS18 high; CS14 low), and some of the differences found between EADL in Glasgow 86 and the French study. 24 S22 is also representative of S100.1,86
There is a further issue in relation to PID, outside the scope of EADL while relevant for future work and a new generation of drying cupboards – that of water soluble VOCs increasing in concentration with increased humidity. 87 This will apply to any formaldehyde in timber particleboards and other common building or furnishing materials. Moreover, with specific regard to PID, acetaldehyde has been associated with fabric softeners in the United States.88,89
EADL found that many households used both biological detergents and softeners. Work in the United States established a level of reported irritation to scented laundry products vented outside by tumble dryers. 90 This supports the desirability for a specific UK study in that higher numbers may experience irritation from fabric softeners within the confines of their homes linked to PID.
Regulation and best practice
The analysis, including laboratory work and simulations, provides evidence that PID compromises energy efficiency and IAQ, the latter evidentially increasing airborne spore concentrations and potentially boosting dust mite populations. Regarding energy, open windows and/or augmented heating may add to fuel poverty, while excessive dust mites or airborne mould spores may adversely affect health, especially for atopic persons and notably including young children. Menon and Porteous 91 have summarised the regulatory status quo for PID and suggested minor changes to the wording of standards applicable to PID; these to require discrete heated and ventilated drying facilities in order to tackle the problems identified by EADL. This approach fits with that of tackling the bedroom in order to improve the environment in a bed.24,92 It also aligns with a DEFRA briefing that includes ‘an airing cupboard served by MVHR’. 93
However, the EADL simulations indicate that heating loads for dedicated drying cupboards remain significant. To offset these, fortuitous heat from internal sources and/or solar heat should be exploited. Examples of the former are transmitted heat from ‘main-space’ radiators sited on the outside of drying-cupboard partitions, or from a boiler, hot water cylinder or appliances (e.g. freezer) in the cupboard. Solar gains might be directly passive through glazing or indirectly from a solar air collector. Both are known to perform well in Scotland. 94 Direct passive solar gain can also be exploited externally together with protection from precipitation – transparent canopies – or again making use of active or hybrid solar techniques – communal facilities providing an opportunity to remove the drying cycle of laundering from the home.95,96
In addition to minor changes to UK and Scottish Government statutory standards to meet these aspirations, manufacturers of MVHR systems may have to modify their current practice and product range. Fan power would depend on designing the system to avoid excessive effective length and hence pressure drop. Since MVHR has been simulated as a superior option to simple extract, recently published information with respect to performance in practice is relevant.97,98
Completed work by others99,100 adds knowledge concerning moisture buffering and places dynamic moisture modelling in context. Given the stated emphasis of this paper, the intention at this stage is to point towards simple architectural solutions to the environmental and health risks brought to light by current PID custom and practice.
Conclusions
The combination of inadequate indoor and outdoor drying provision, coupled with prevalent poor control of ventilation and moisture migration within dwellings, means that the occupants’ ad hoc use of PID in various rooms and circulation spaces has two identified and potentially undesirable environmental consequences:
Moisture contributes to excess dust mite growth, with a known causal association with asthma. Association with higher concentration of airborne mould spores (CFU/m3 > 1000), and greater prevalence of hydrophilic/tertiary isolates; attributable to slow release of moisture and possibly partly to low-temperature washes and potentially adding to health risk for atopic occupants. Since CFUs are not simple or economic to regularly measure, the only way to ensure levels are reasonably low is to remove known sources of the problem – in this case PID and very high indoor humidity for other reasons such as inadequate ventilation with intense occupation. Although epidemiological data already exists in the case of 1(a), this study indicates a case for specific work to identify associations between CFU concentrations that are at least partly attributable to PID, and potential health effects, in particular to those who are prone to allergies. PID is also inherently energy profligate due to accompanying ventilation and heating habits. As it could use as much as full reliance on TD in primary energy terms, as well as diminishing quality of life, there is a strong case for healthy, energy-efficient forms of PID and TD. The first four conclusions point to the need for independently heated and ventilated drying spaces, i.e. ‘isolated’ to improve both health safety and energy efficiency. This would require changes to current statutory standards of a minor nature (including larger minimum volume than presently designated), but with a potentially large economic impact. Laboratory work has indicated limited potential for moisture buffering in minimal drying spaces of this kind, especially during moist summer periods. But this could be more useful in larger, less rapidly ventilated, spaces. There are also many ‘best practice’ options for environmentally ‘safe’ PID, especially ones that exploit fortuitous heat gain and/or solar energy – thermal or electrical; the key criterion being that exhaust air does not circulate into inhabited spaces. These may be individual or shared, the latter in enhanced outdoor, semi-outdoor or fully indoor situations, including within communal laundries with low-energy or renewably powered appliances. Given the evidence of poor ventilation, there is a case for further work to study concentrations of VOCs associated with domestic laundering, including fabric softeners during a PID process. The case for this in the United Kingdom relates to work in northwest United States, which found chemicals such as acetaldehyde (classed as carcinogenic) emitted from drying involving softening products, as well as to moisture from PID adding to concentration of other water-soluble VOCs in various materials.
Footnotes
Acknowledgements
The team from all three research units, MEARU, RICH and ESRU, wishes to express thanks, firstly for the financial support from the Engineering and Physical Sciences Research Council (EPSRC grant reference EP/G00028X/1), and secondly for the co-operation of numerous housing associations, and the individual householders who agreed to the survey, and especially to the two-week monitoring. The team also thanks Dr Colin Hunter, Glasgow Caledonian University, for his valuable advice concerning water activity classification, Dr Vivien Swanson, Stirling University, for additional statistical guidance, and respective institutional librarians for their valuable assistance regarding the literature search for previous data and insights relevant to this study.