
Abstract
The aim of this work was to study the performance of a novel coaxial nozzle for personalized ventilation that can be used as an add-on to ceiling diffuser. The coaxial nozzle minimizes air entrainment between the central fresh air stream and the room air. It allows effective delivery of clean air to the breathing zone while the recirculated conditioned air is supplied to the space by the associated ceiling diffuser. Detailed 3-D Computational Fluid Dynamics (CFD) simulations were performed and numerical results on velocity, temperature, and CO2 concentration fields agreed well with experimentally measured values. The effect of the jet flow rate, temperature, and inclination angle on air quality at the breathing zone of the occupant was then investigated. The proposed coaxial personalized ventilation achieved high air quality in the breathing zone demonstrated by a personal exposure effectiveness of 32% at fresh airflow rate of 10 L s−1 per person. It contributed also to the attainment of temperature differences up to 2℃ between the occupant’s microenvironment and the rest of the room air leading to considerable energy savings compared to the mixed convection air conditioning.
Keywords
Introduction
The concept of zoning environmental conditions in an open space has been applied in different air conditioning systems. The engineering work in this field varied from dividing open spaces into separate thermal air zones to the ability to control the microclimate environment conditions in the direct vicinity of the occupants. Displacement ventilation (DV) air-conditioning system 1 – 3 and under floor air distribution system4,5 mitigate contaminants in the breathing zone by creating a lower fresh air zone and an upper mixed zone. In both air conditioning systems, the fresh lower air zone extends over the entire occupied area but requires a large amount of fresh air in comparison to personalized ventilation systems, which restrict the supply of fresh air to the vicinity of each occupant. 6 The concept of using personalized ventilators (PVs) revolves around directing the cool fresh air to the upper region of the human body. The overall comfort of the occupant could be improved without the need of having homogenous cool air temperature in the occupant microclimate permitting the use of elevated supply air temperature. 7 – 11 Researchers have reported that the use of low turbulent PVs could reduce Heating Ventilation and Air-conditioning (HVAC) system energy consumption. 12 – 16 A high efficiency personalized ventilation system performs well (no draught discomfort) at room temperatures between 23℃ and 26℃ with a PV jet temperature that is lower by 3℃ to 4℃ than room air while ensuring the penetration of the jet into the occupant thermal plume.12,13,17,18,19 PVs are typically installed in reachable places near the occupant (desk, furniture). They can be supplied with fresh air via ducts installed under a raised floor or just rely on fresh air drawn from supply air at the floor level using ductless PV.6,21,22 Nielsen et al. 23 reported that personalized ventilation could improve the protection of occupants by increasing the personal exposure index. PVs are also reported to improve thermal comfort for individual occupants and increase the productivity of workers at lower energy cost. 24
Thermal comfort states reported in the literature on usage of personalized ventilation showed acceptable comfort levels and any eventual thermal draft or local discomfort sensations were limited and were overcome by improved overall comfort. 25 – 27 Zhang 7 developed predictive empirical models of local thermal sensation and comfort for 19 body parts in transient and non-uniform environments. The model of Zhang uses segmental skin temperatures and their rate of change to evaluate local and overall comfort 8 – 11 over a 9-point scale. Several multi-node segmental bioheat models were used in the literature to predict segmental thermal response and coupled the response with Zhang comfort model to assess thermal performance of PV devices.13,28– 34
Personalized ventilation devices can be integrated with different types of air distribution systems including DV 35 or mixing ventilation.18,19,36 Yang suggested the usage of ceiling-mounted single core jets integrated with the conventional mixing ventilation systems 36 where the personalized ventilation module supplies fresh air and the conventional diffuser handles the recirculation of the space air. Using CFD simulations and experiments, Yang 36 investigated the performance of ceiling PV with respect to thermal comfort, air quality and energy consumption. In particular, PV with ceiling-mounted air terminal devices was shown to improve occupant’s thermal sensation and perceived air quality for a range of ceiling jet flow rates and combination of temperatures of the PV jet and mixed secondary diffuser supply air.18,19 Although the ceiling single jet PV with secondary recirculated mixed ventilation was found to provide comfort, its effective operation was rendered limited due to the relatively short length of the potential fresh air core region of single jet nozzles. Yang 36 reported only 12% of personal exposure effectiveness (PEE) with a high fresh airflow rate at 16 L/s. If there are means to extend the potential fresh air core of the PV jet through some innovative nozzle design, then the PV effectiveness can be enhanced and a higher jet temperature might be used to provide thermal comfort.
Khalifa et al.37,38 introduced a low-mixing coaxial horizontal PV nozzle that can greatly lengthen the clean air core of a PV jet while maintaining low PV clean airflow rates. The nozzle comprises a primary nozzle delivering fresh clean air surrounded by a concentric annular secondary nozzle providing recirculated air at the same velocity. The same or nearly equal velocities of the supplied air at the primary and secondary nozzles help diminishing the shear stress at the boundary of the primary jet and thus allow for a longer clean air region. However, the performance was assessed for horizontally mounted nozzles directed towards the occupant’s face. Khalifa et al. 38 have not investigated the performance of the coaxial nozzle if mounted above the occupant in combination with conventional mixing diffusers. The performance of the co-axial PV in delivering high quality air would significantly be altered for downward jet compared to horizontal jet due to the naturally rising thermal plume of the occupant. The enhancement of ventilation effectiveness of the ceiling-mounted co-axial PV device has not been reported in literature in this context for this type of application.
In this study, a ceiling-mounted low-mixing coaxial PV nozzle was investigated to assess its ability in providing the necessary amount of fresh air directly to the breathing zone of the occupant while ensuring that overall thermal comfort was sustained. In addition, the extent to which localized conditions are created around the human body was studied when the co-axial nozzles were integrated with typical four-sided slot recirculated air diffuser. The performance of this new PV design was evaluated using experimentation and CFD simulations. The co-axial PV nozzle parameters that can provide acceptable air quality at the breathing zone were determined while ensuring that comfort conditions were maintained. In addition, the performance was compared with that of a single core jet nozzle.18,19
Methods
An experimental setup was prepared to test the effectiveness of the proposed ceiling-mounted coaxial PV nozzle and diffuser. The experiments were conducted using a heated cylinder placed inside a controlled climatic room. Three-dimensional detailed numerical simulations were performed using commercial software such as ANSYS Fluent. 39 The flow and thermal fields were obtained in addition to the concentration field of carbon dioxide. The findings of the numerical model were validated by measurements obtained from the experiments on velocity, temperature and concentration of CO2. The validated numerical models were then used to perform a parametric study to determine best performance operating parameters of system and compare performance to single core jet. The nozzle operating parameters that were investigated include jets’ flow rates, temperatures, and diffuser angle.
Nozzle geometry
Figure 1 shows schematics of (a) the ceiling co-axial nozzle and diffuser and (b) the conditioned workspace with the occupant in seated position below the diffuser. The air distribution system was composed of three elements: a primary nozzle, a secondary nozzle, and a peripheral diffuser. The primary central nozzle for fresh air delivery has a diameter of 9 cm. The secondary annular nozzle has a diameter of 15.6 cm which delivers recirculated room air while surrounding the fresh air core region to reduce shear and mixing. The peripheral angled diffuser delivers air at a 45° angle to form a canopy for localizing the flow around the occupant and maintain the room macroclimate temperature. The distance separating the breathing zone level from the nozzles supply was 1.4 m similar to the selected distance by Yang
39
while using single core PV jet in which the jet clean core was shown not to reach the breathing zone but resulted in significant improvement of air quality in the breathing zone. The vertical downward clean core of the single jet was 3–6 times the nozzle diameter due to occupant rising plume.
39
Schematic diagram of (a) the frontal and top views of the proposed ceiling diffuser and (b) the computational domain.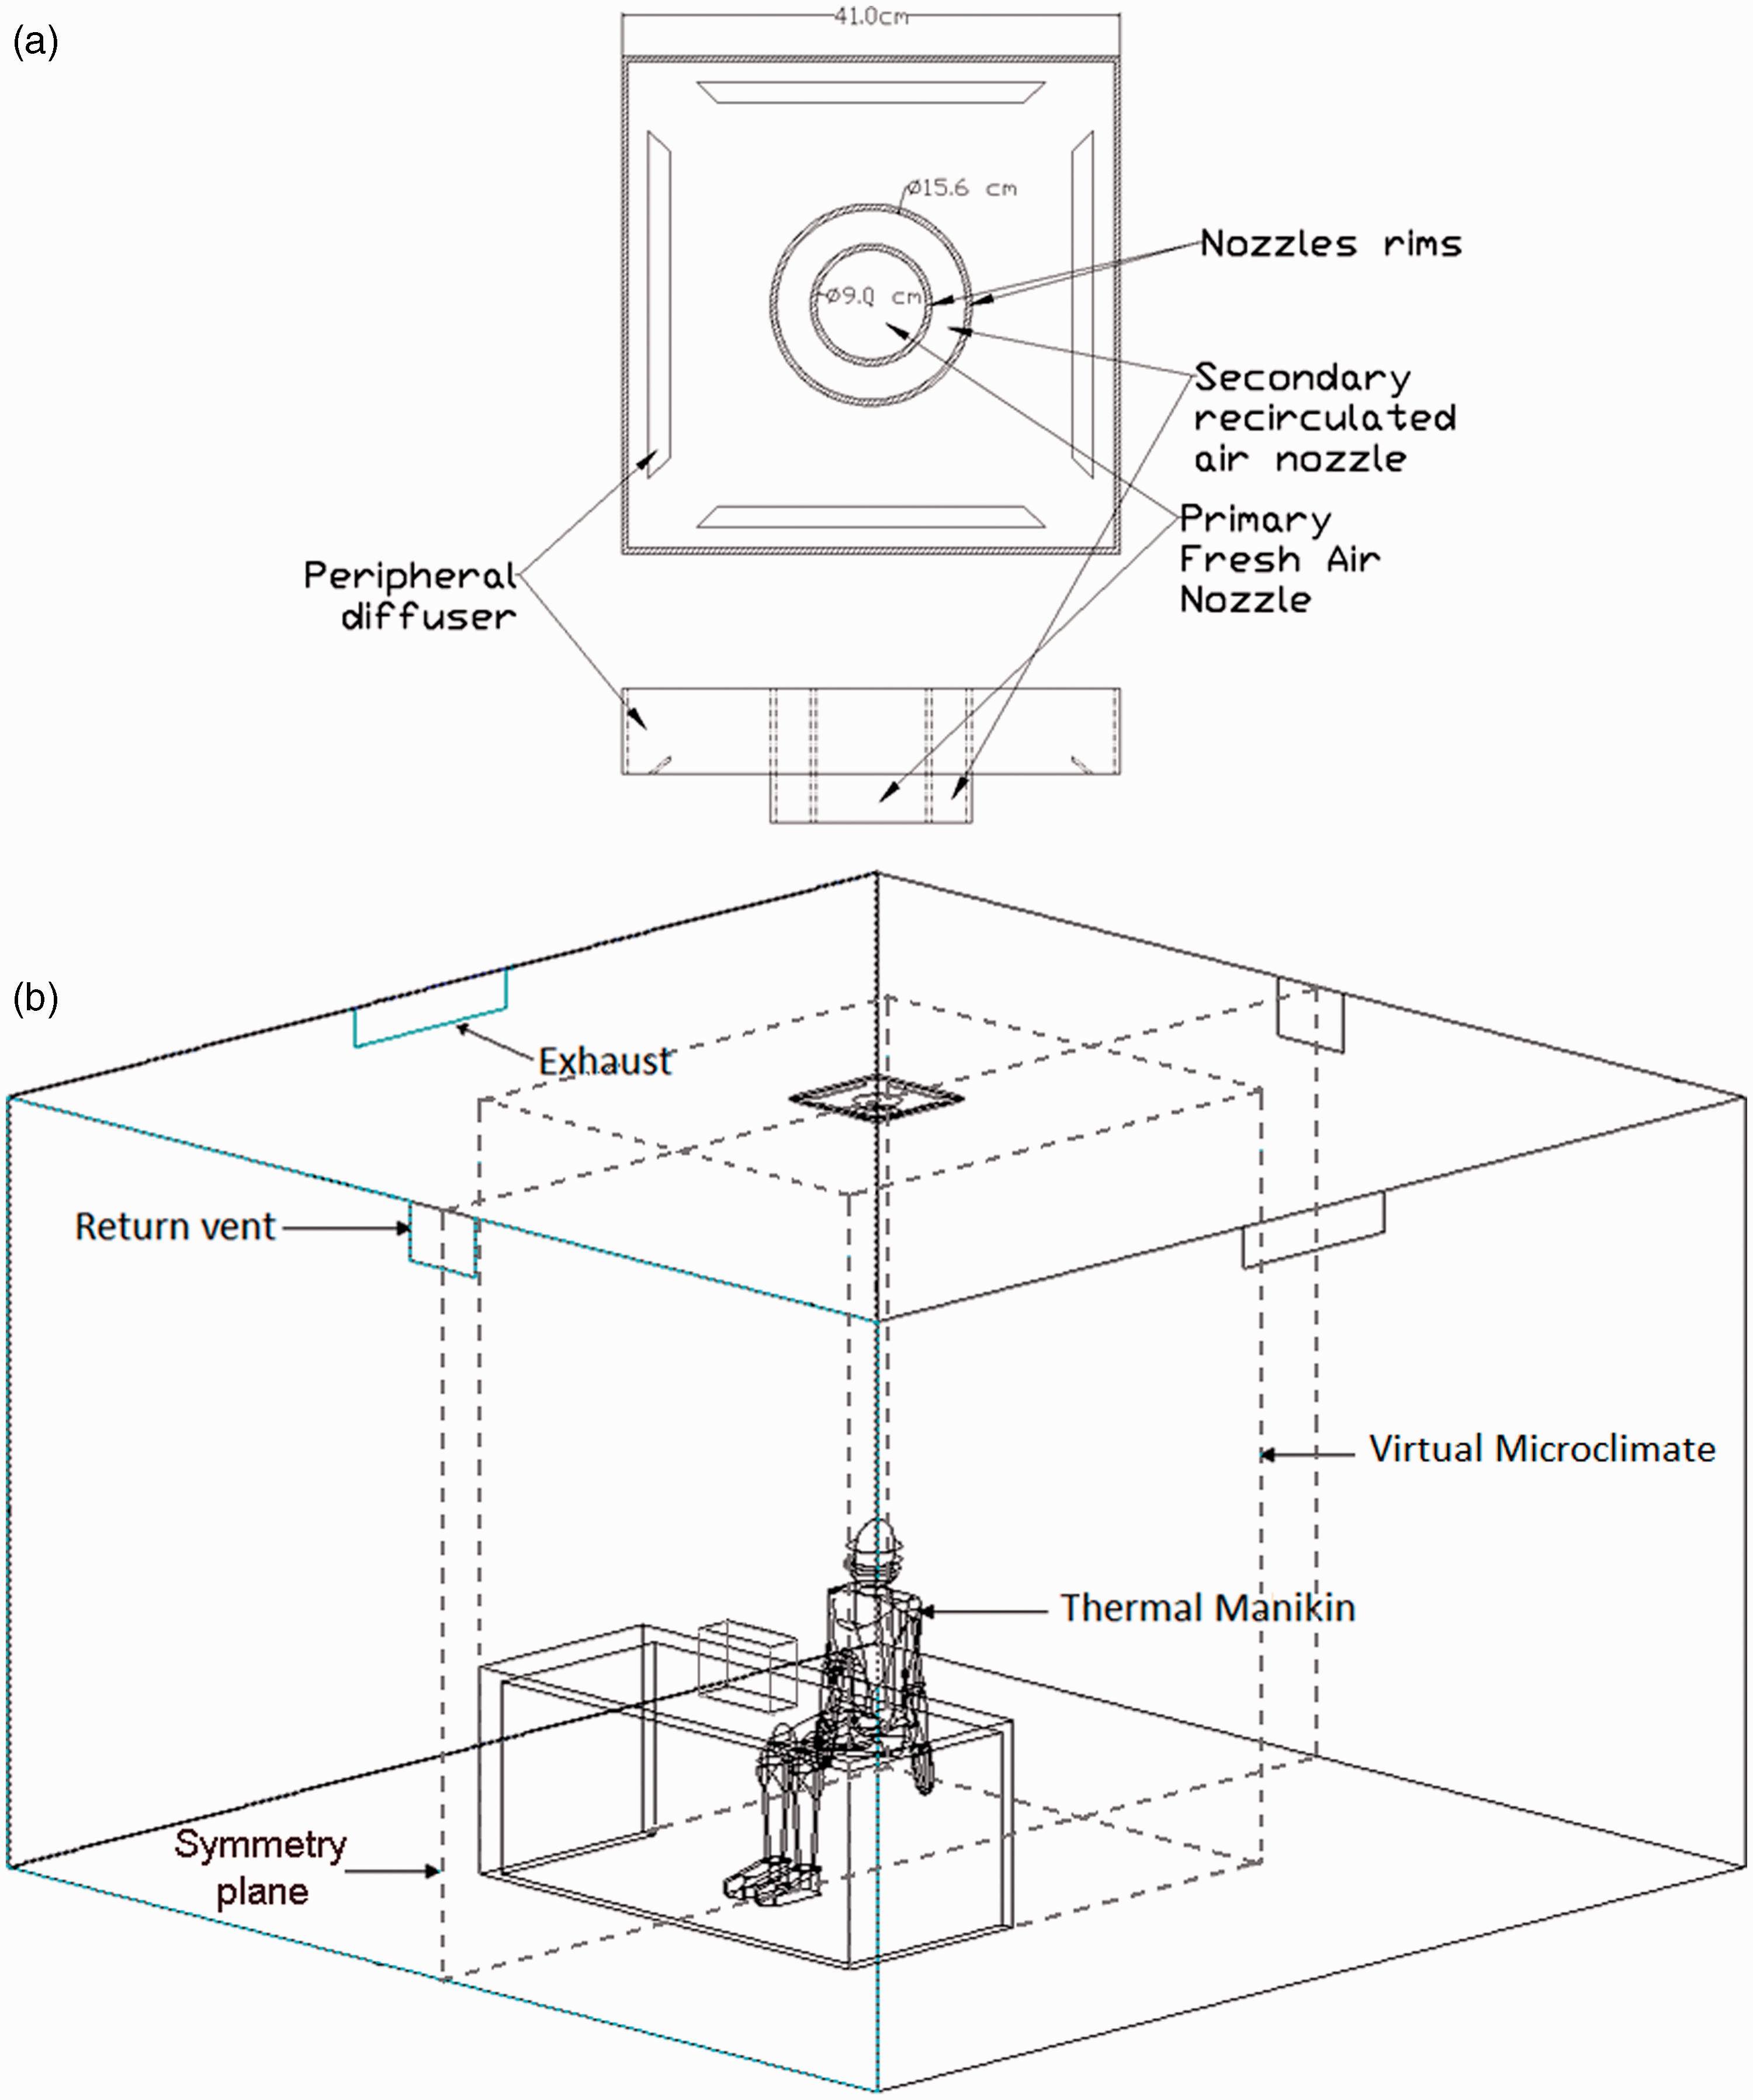
Equal velocities were maintained at the outlet of the primary and secondary jet in order to reduce the mixing at the jets’ interface and extend the downward distance travelled by the fresh air primary core nozzle. The dotted lines shown in Figure 1(a) define the boundaries between the room’s macroclimate and microclimate. The room air was recirculated through the return vents and cooled to the desired temperature before it was supplied by the secondary nozzle and the peripheral diffuser. The room was ventilated by supplying fresh air through the PV jet and exhausting the room air through the exhaust vents at a flow rate equal to that of the fresh air supply.
Room geometry
Since this study was targeting the indoor air quality (IAQ), a full-scale computational domain representing a typical office chamber measuring 3.4 m × 3.4 m × 2.6 m was adopted (see Figure 1(b)) which was equal in dimensions to the experimental room setup to test the co-axial PV nozzle and associated diffuser. Once the CFD model was validated experimentally using a heated vertical cylinder, a detailed multi-segment manikin was considered for the CFD simulations as part of the parametric study. The seated non-breathing thermally heated manikin was included in the middle of the room in the workspace. The use of non-breathing manikin was considered in order not to affect air quality results based on recent study conducted by Mazej et al. 40 in which they reported that breathing in CFD simulations had no significant impact on the PEE. In fact, the fraction of re-inhaled air was less than 3% when breathing was considered.
The manikin has a height of 1.2 m and a total surface area of 1.78 m2 and the dimensions of each segment were determined according to the data provided by Gagge et al. 41 The ceiling-mounted nozzle integrated with a slot diffuser was centred over the manikin’s head in addition to the two symmetrically installed return vents and exhausts. A desktop computer generating 93 W 42 was placed on a desk in front of the manikin representing an occupant performing light office work which was generating 70 W 42 of sensible heat. In addition, a typical lighting load of 12 W/m2 was used. 43 The remaining load was assumed to be distributed equally as heat flux through the walls so that the total room load was around 60 W/m2 of room area.
Physical measurements
The performance evaluation of the proposed coaxial nozzle and diffuser for the effective localization of thermal comfort and IAQ was investigated experimentally. A heated cylinder of 0.5 m diameter and 1 m height was used to represent the human body with an approximate surface area of 1.8 m2. The aims of the experiments were (1) to provide measurements on the boundary conditions at the outlet of the nozzle to be used in the numerical CFD simulations and (2) provide measurements on velocity, temperature, and CO2 concentration around the heated body subject to the ceiling cold jet to validate numerical model predictions. Extensive measurements were recorded of the flow characteristics in the vicinity of the nozzle outlet and around the heated cylinder.
The validation process took place in the space area of an experimental room (3.4 m × 3.4 m × 2.8 m) constructed of highly insulated walls with an internal layout for one working office station as shown in Figure 2. The cooling load of the experimental space was mainly due to internal loads such as lighting (12 W/m2) and the heated cylinder (70 W) in addition to the external load through the walls exposed to an outer air temperature of 32℃ representing typical outdoor summer conditions. The air conditioning of the space was served by two (2.6 kW) air-handling units: one conditioning the recirculated air and the other supplies conditioned fresh air. The recirculation air-handling unit delivered the conditioned recirculated air to the peripheral ceiling diffuser and to the secondary nozzle of the personalized coaxial PV nozzle. The control of the recirculation airflow was accomplished via motorized dampers.
Schematic diagram of (a) the frontal and (b) top view of the experimental setup for the validation process.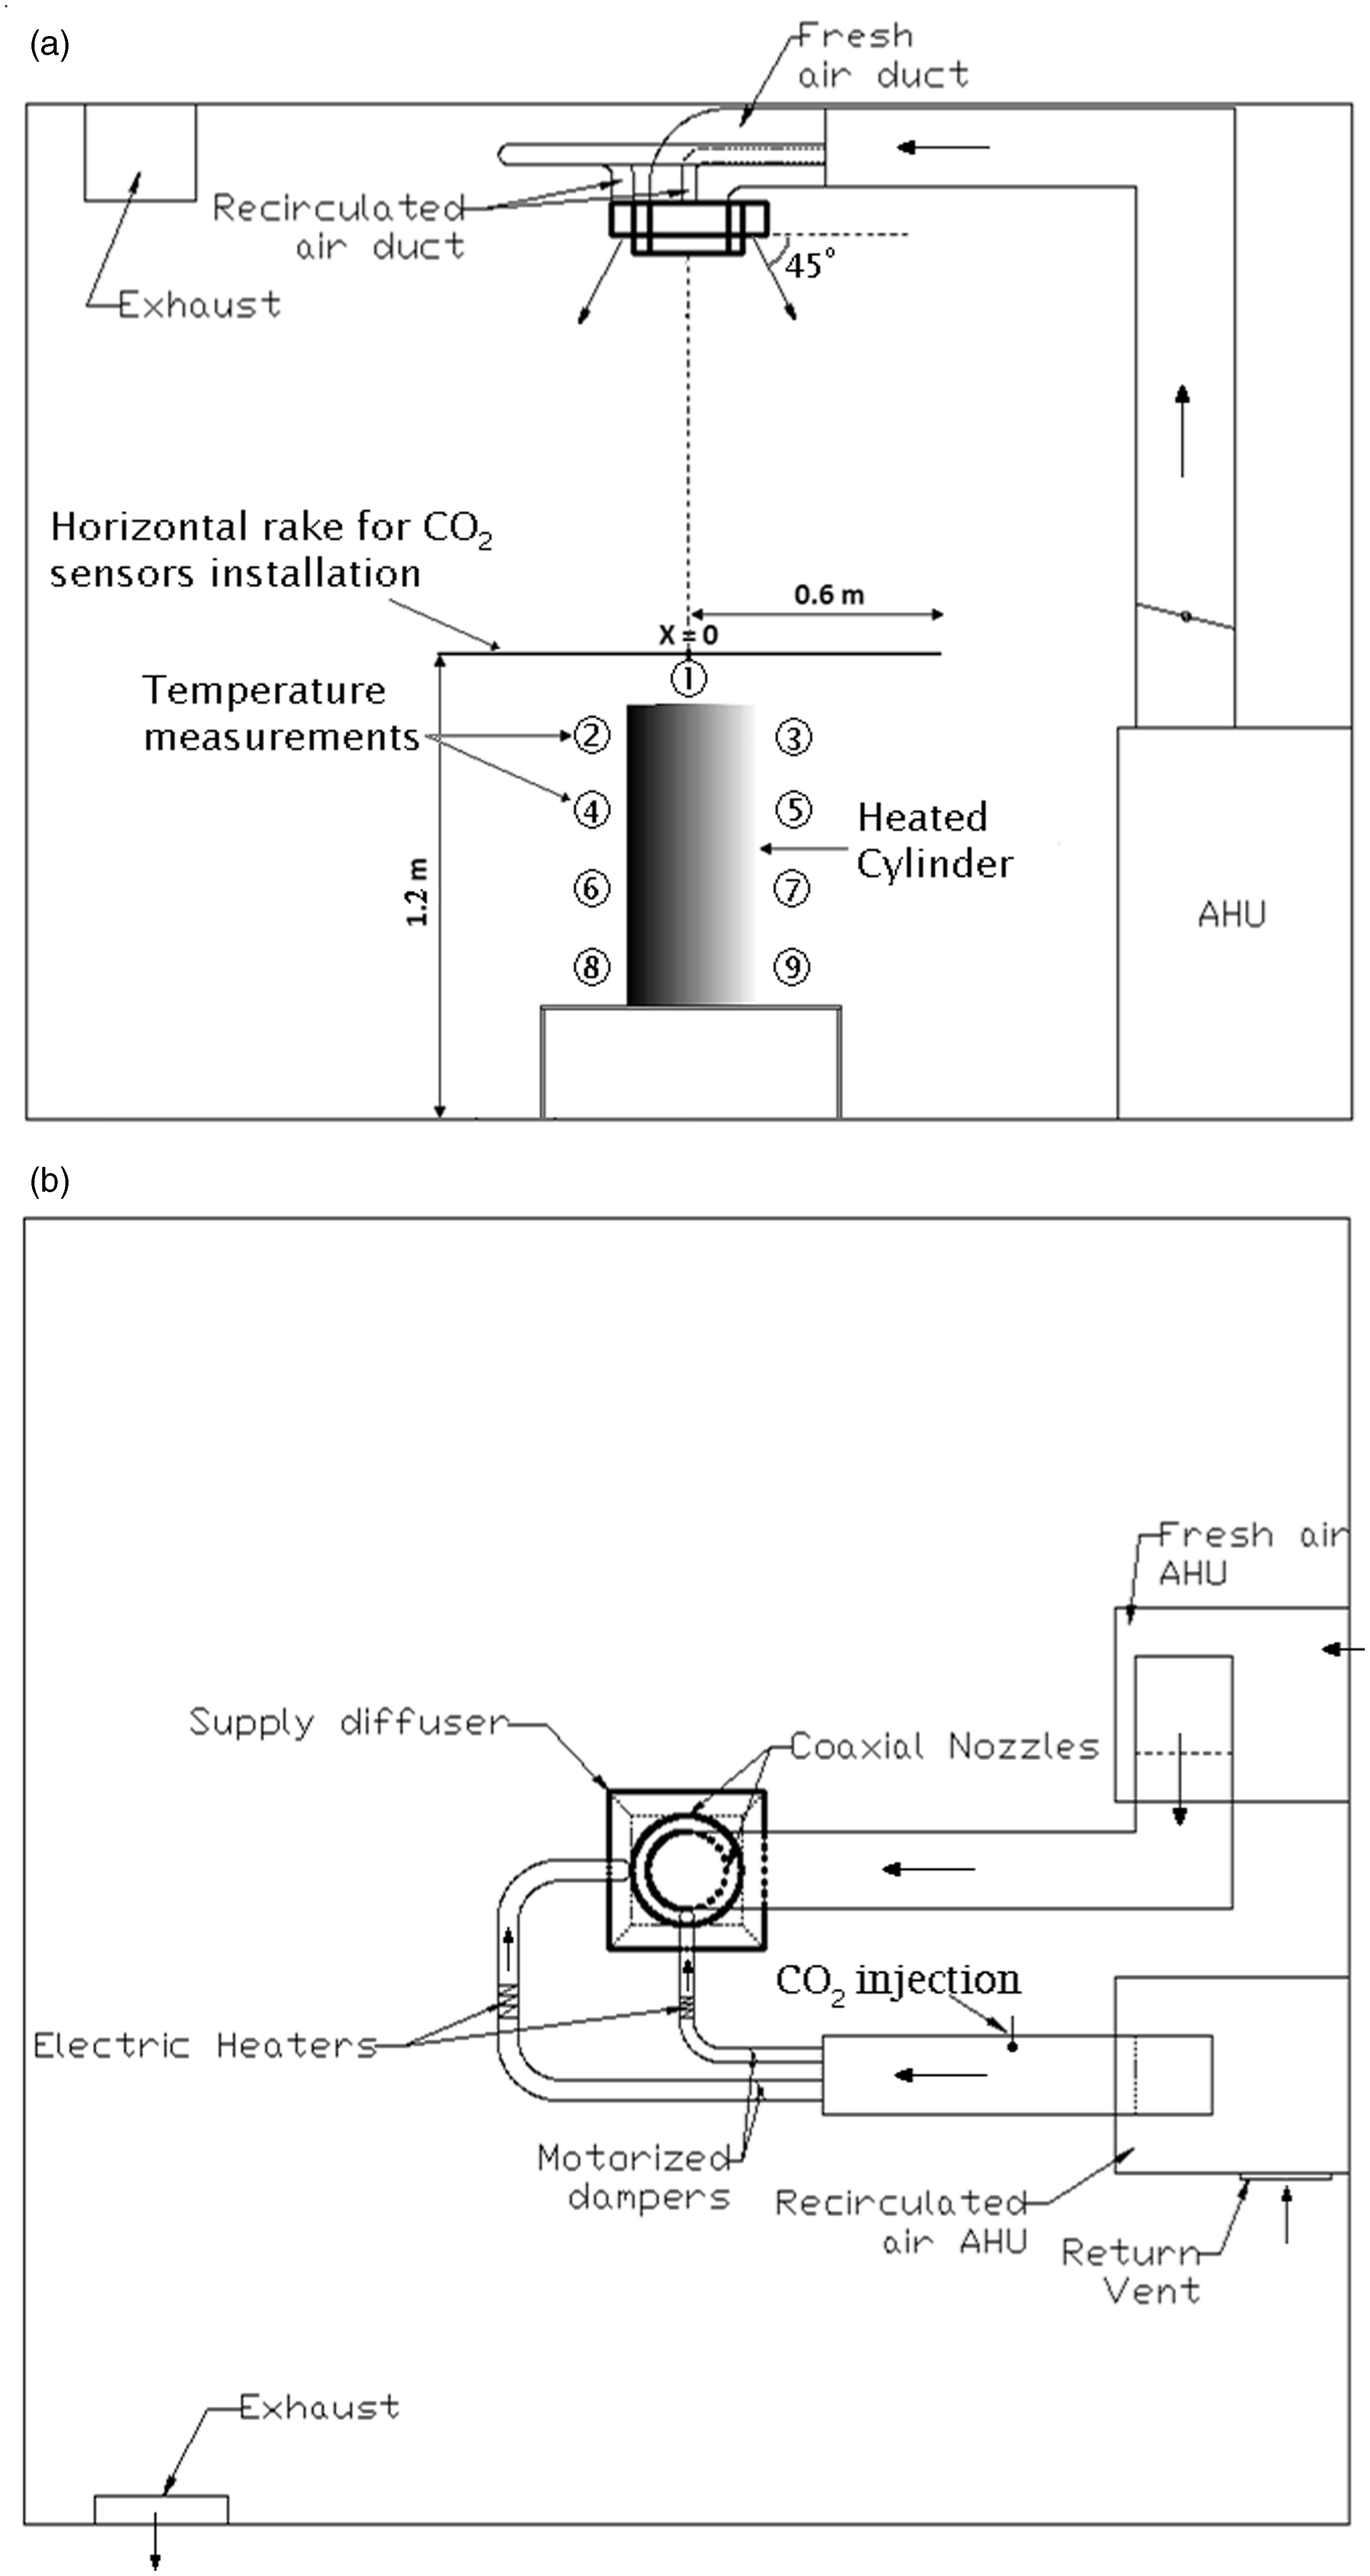
The proposed ceiling nozzles were designed according to the results obtained from the preliminary CFD simulations. The primary nozzle of the coaxial PV was supplied from the fresh air-handling unit while the secondary coaxial nozzle and the peripheral diffuser nozzle were supplied with recirculated conditioned air (see Figure 2). The temperatures and supply flow rates were controlled by installed dampers and in-flow electric heaters. To reduce the flow turbulence intensity and airflow mixing, both the primary and secondary nozzles were fitted with honeycomb flow straighteners and two screens. The honeycomb holes diameter was 4 mm while their thickness was 30 mm such that the thickness over diameter ratio (t/D) was equal to 7.5, which was within the recommended range for optimal results. 44 Two screens with 60% porosity were installed upstream and downstream of the honeycombs. The cylinder surface was heated using electric heaters generating 70 W (≈39 W/m2) of heat, which was equivalent to the average sensible heat generated by a sitting person. 43 The base of the cylinder was insulated to prevent any heat dissipation through the floor. It was placed below the PV nozzle and at 10 cm away from the desk. The heated cylinder permitted testing the ability of the fresh airflow of the coaxial nozzle to penetrate the buoyant cylinder plumes.
The experimental setup allowed for variations in the room temperature, fresh air temperature of the primary PV coaxial nozzle, airflow rates and the issue angles for the coaxial PV and angled flow peripheral diffuser. The velocity and turbulence measurements at the outlet of the PV nozzle were taken using omni-directional hot-wire anemometers manufactured by TSI Incorporated©. The anemometer’s sensing head diameter was 3 mm, has a ± (3% + 2d) accuracy and was calibrated for low-velocity range measurements (<2 m/s). They were placed on a horizontal rod directly at the outlet of the nozzles (with ± 1 mm positioning accuracy) and were triggered to measure the air velocity and turbulence intensity every 5 mm from the centre of the primary nozzle to the external wall of the secondary concentric nozzle (see Figure 3). In order to prevent jet disturbance and obstruction, the measurements were implemented in two staggered stages. Half of the sensors were installed at distances of 10 mm from centre to centre in the first stage and then displaced horizontally 5 mm in the second stage while keeping the separation distance of 10 mm. For validation purposes, the peripheral diffuser jet velocities were measured at nine different locations on the jet profile at different levels. The velocity and turbulence intensity measured at the outlet of the PV nozzle were later used as inputs to the CFD model to define the nozzle’s boundary conditions.
A plot showing the positions of the hot-wire anemometers and the validation of the CFD diffuser jet profile with experimental data.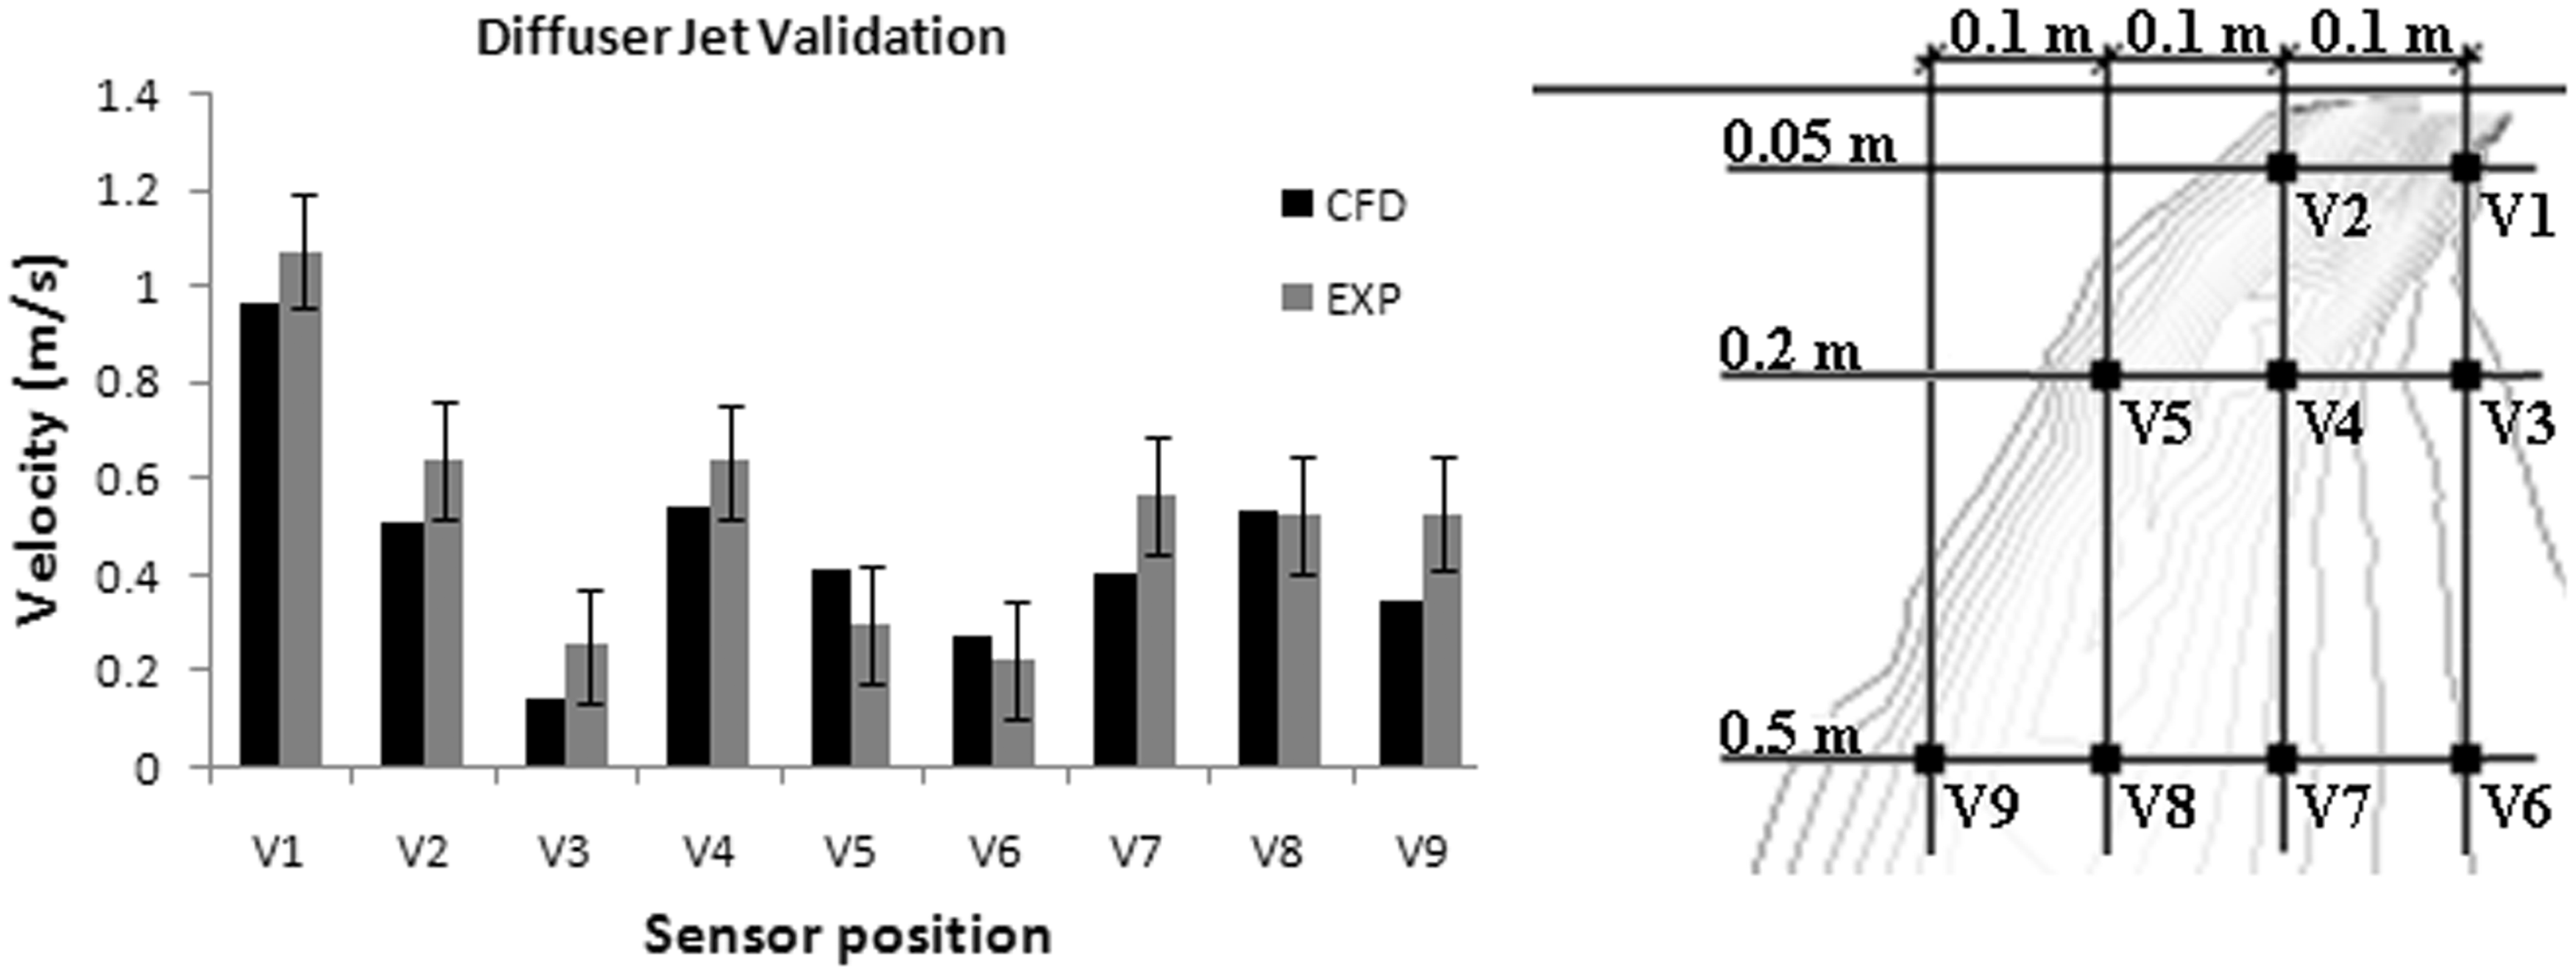
In addition, CO2 sampling tests were performed. The CO2 concentration was measured using 21 CO2 sensors installed at a rake passing over the heated cylinder. The heated cylinder was placed underneath the nozzles while the return duct was seeded with 0.0035 L/s flow rate of CO2 to mimic indoor pollutants (see Figure 2). Since response time of the CO2 sensor was less than 30 s, and since only steady state results were sought, the CO2 sensors were triggered to measure the CO2 concentration every 40 s. The CO2 sensors were calibrated at the outdoor conditions before starting the data sampling. The difference in the CO2 concentration between the breathing zone and the macroclimate was required to assess the IAQ. The distance separating the inhaled air quality measurements from the nozzles supply was 1.4 m.
Since this study focused on the inhaled air quality while maintaining acceptable comfort conditions, it was important to validate the thermal flow field around the thermal cylindrical manikin by taking temperature measurements. A set of 9 T-type thermocouples with ± 0.3℃ accuracy were distributed around the cylinder as shown in Figure 2(a) to monitor the variations in the temperature field. These thermocouples were connected to a data logger to store the data. The measurements were taken at steady state, which was assumed to be reached when the monitored temperatures reach nearly constant values with variation within ± 0.3℃. Since this study was not concerned with the far flow field, its values were not crucial for the validation of the obtained IAQ and microenvironment conditions. According to Chen et al. 45 and Srebric et al., 46 validating the flow properties was obtained at the boundaries (diffusers and nozzles outlets) which would be the most important for accurate predictions in ventilation problems. For that reason, the velocities at the outlet of the diffuser and PV nozzle were experimentally obtained. In addition to the near body field temperature measurements, the PV jet velocity at different distances from the PV outlet were recorded using the hot-wire anemometers, at 11 points aligned at three distances (0.4 m, 0.8 m and 1.2 m) away from the PV nozzle outlet. For these velocity measurements, the room temperature was maintained at 26℃ and the diffuser supplied flow rate was 53 L/s. The PV flow rate and temperature were maintained at 7.5 L/s and 20℃, respectively.
Boundary conditions for the experimental measurements.
CFD simulations
Airflow modelling
It is important to use a detailed CFD model that can accurately predict the entrainment and mixing between the ceiling-mounted PV nozzle and the surrounding air and can capture the interaction between the nozzle jet and the rising thermal plume from the manikin representing the human body. Consequently, proper modelling of flow physics is critical: turbulence models, buoyancy effects, and boundary layers. Besides, the grid resolution in some critical areas is important to capture accurately the shear-layer entrainment process and the different thermal plumes as well as the fluid/thermal boundary layers around the heated manikin.
The commercial CFD solver, ANSYS Fluent, 39 was used for numerical modelling to solve for the airflow, thermal, and species concentration fields in the room. The symmetry in room as shown in Figure 1 was considered, where a plane passes through the centre of the manikin, nozzles, and the return vent, thus allowing consideration of one-half of the room when being numerically modelled.
To develop a CFD model that can capture the air jet properties accurately, several methods can be considered such as the box and momentum methods that rely on describing the diffuser’s resulting airflow. Since the primary concern of this study is the resulting airflow delivered by the diffuser away from its outlet, the momentum method was selected. In addition, the velocity profile and turbulent intensity of the primary and secondary nozzles are of great importance for accurate modelling of the mixing rate between the two jets. The velocity and turbulence intensity data were obtained from experimental measurements of the flow characteristics at the outlet of the co-axial nozzle shown in Figure 1(a). The experimentally obtained nozzle jet characteristics provided the necessary boundary conditions to the CFD model.
The experimentally obtained nozzle’s jet exit characteristics were incorporated into the computational domain that represented the typical office. A tetrahedral unstructured grid was generated using different element sizing for the boundary faces, and an element size of 5 mm was chosen for the nozzles resulting in 9000 elements. In order to resolve the boundary layer, the surface grid for the manikin was created with elements of 1 cm. The total number of elements on the half surface of the manikin was around 20,000 as shown in Figure 4. An inflation boundary layer was created around the manikin with a first layer thickness of 1.5 mm, a growth rate of 1.2 and a total number of four layers. The corresponding y+ values ranged between 0.8 and 4 on the manikin’s surface. In order to limit the number of cells and reduce the computational time, a grid independence test was performed for the mesh until the grid independent limit was reached. The resolution of the mesh in the critical regions was refined until the CO2 concentration in the breathing zone, chosen as the criteria for the test, was stabilized. This led to a total number of 1,210,000 cells for the entire domain and the corresponding mesh was considered for the final simulations.
The generated grid at the symmetry plane.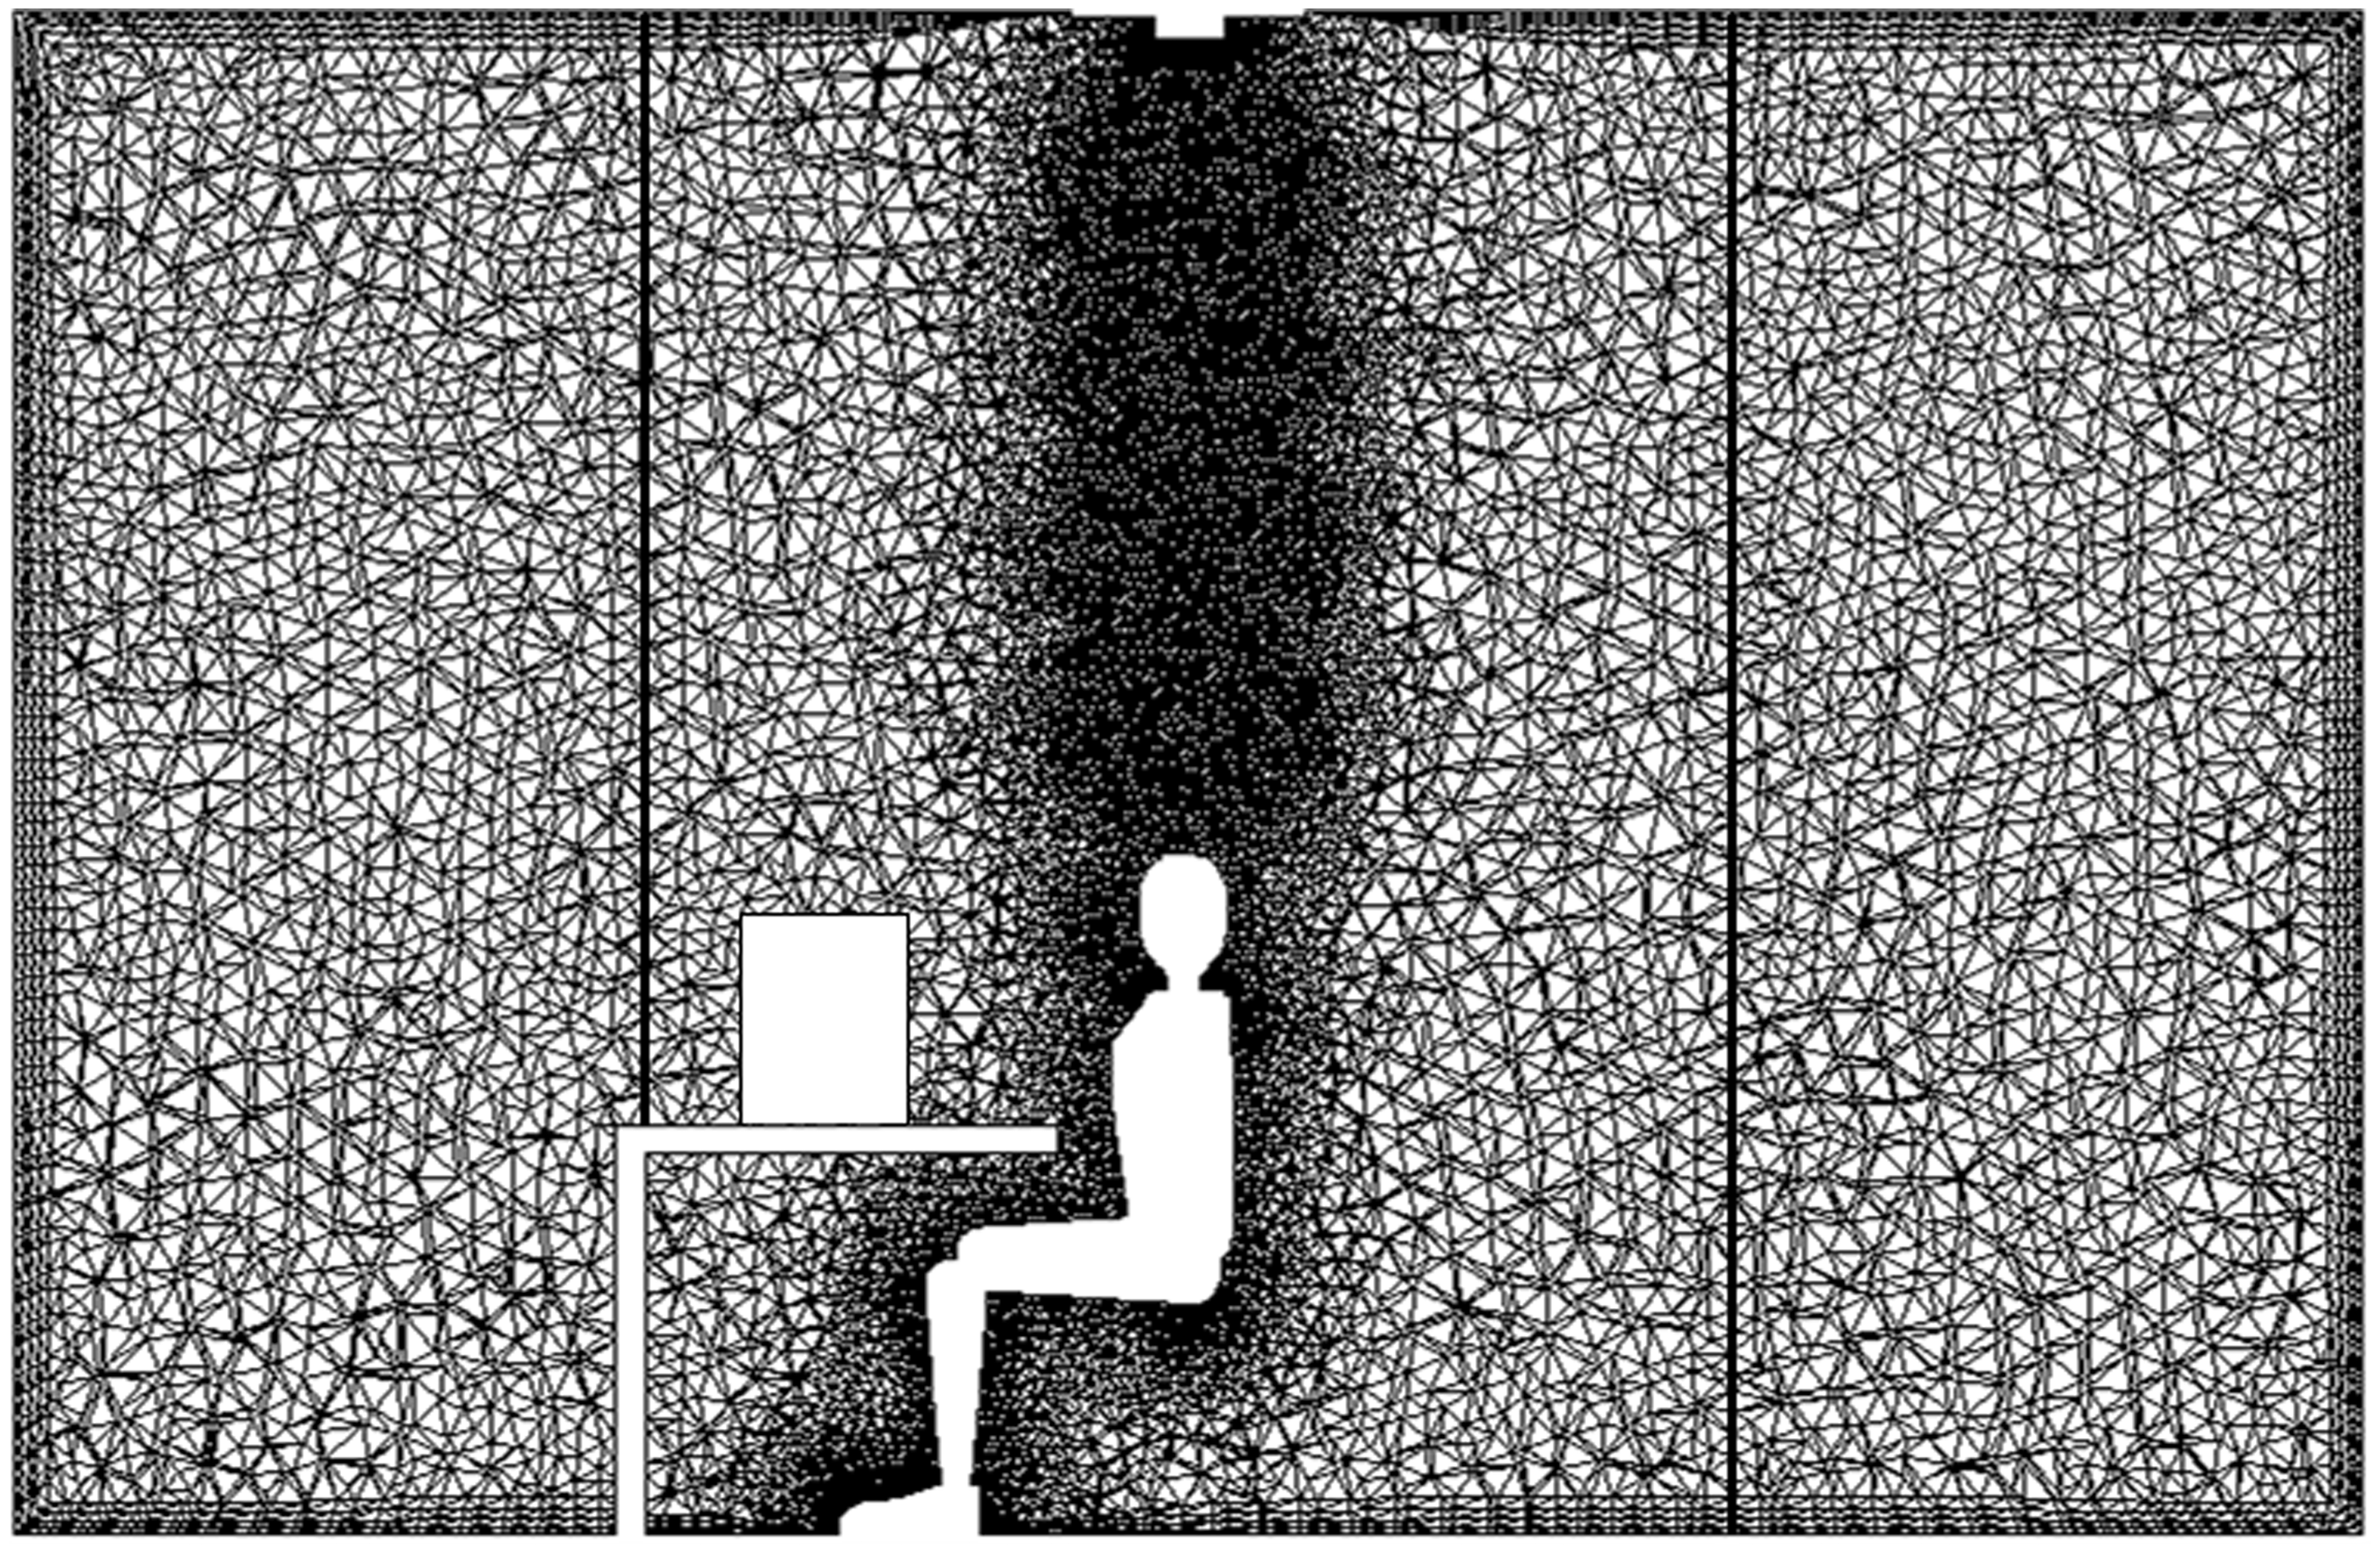
In order to capture the entrainment process between the fresh air jet and the polluted air from the surrounding nozzles, a clustered grid at the interface of the two jets would be necessary. However, since buoyancy effects were involved and jet deflections could occur, the trajectory of the jet would be unpredictable. For this reason, four spheres of influence of 1 m diameter were integrated between the nozzles and the thermal manikin. The grid was clustered in this region and the size of the elements was chosen to be 2 cm. For the rest of the domain, an unstructured grid was used (see Figure 3). It is important to note that the total number of cells was controlled by the grid size in the mixing region and not by the manikin’s surface grid or the size of the domain.
Methods of coupling the bioheat model with the CFD model were described and reported in several research works. 28 – 34 For this study, the model of Salloum et al. 28 was selected, which is a multi-node model that consisted of 11 body segments and predicts segmental skin temperature, sweat rate, and the sensible and latent heat losses for a given metabolic rate and clothing ensemble in uniform and non-uniform environmental conditions. The CFD model was coupled with the bioheat model 28 to assess overall thermal comfort of the occupant based on the segmental skin temperatures that in turn influence the rising thermal plume. The model would simulate the physiological responses of each of the 11 body segments (head, chest, back, abdomen, buttocks, upper arm, lower arm, hands, thighs, calves and feet) for predicting its thermal state of comfort based on Zhang’s model 7 – 11 in a non-uniform thermal environment. The thermal comfort was assessed using the 9-point scale ballot ranging from −4 for very uncomfortable to +4 for very comfortable. This interdependence between Fluent and the bioheat model was important to capture accurately the flow characteristics and the human thermal response. Initial segmental skin temperatures were estimated for the manikin and the corresponding convection coefficient and air temperature taken from Fluent were used to update the skin temperatures using the body model, as described in Refs. 31 – 33 This procedure was repeated until convergence was achieved and the corresponding results were considered converged.
The commercial solver, ANSYS Fluent 39 has several options for the turbulence model. Among them, the Realizable k–ɛ model was selected along with the enhanced wall treatment and the full buoyancy effect options. One of the main advantages of the Realizable k–ɛ model is that it predicts more accurately the spreading rate of planar and round jets, and it provides superior prediction for flows involving separation and recirculation.47,48 The enhanced wall treatment option would allow switching between the two-layer model and the enhanced wall functions according to the grid size. In regions where y+ was of the order of unity, the two-layer model was used and the laminar sublayer was resolved. However, in regions where the boundary layer was not fully resolved (3 < y+<10), an enhanced wall function was used. Besides, the full buoyancy effect option enables to include the turbulence generation due to buoyancy on the ɛ term.
To account for the buoyancy effects, the incompressible ideal gas law was used for the density. The species transport equation was also enabled to compute the concentration of the CO2 and assess the IAQ in the domain. In addition, a second-order upwind discretization scheme was employed to solve for the momentum, k, ɛ, and energy equation as well as the species transport equation, and the ‘PRESTO!’ scheme was used for the pressure. Numerical convergence was judged using several criteria: (1) scaled residuals reported by Fluent should reach a minimum value of 10−5; (2) the net heat flux of the computational domain should be below 1% of the total heat gain; and (3) the CO2 concentration in the breathing zone was stabilized.
Since this was a mixed convection problem, the ratio of Grashof number (Gr) to Reynolds squared (Re2) determines which form of convection dominates. Given the dimensions of the cylindrical manikin were 1.2 m height and 0.54 m diameter and the flow velocity at the outlet of the PV nozzle was 0.78 m/s for the lowest flow rate, Gr and Re numbers could be estimated. It can be then verified whether natural convection unsteadiness could affect the simulated steady state results.
Air quality modelling
In addition to solving for the velocity, pressure, density, turbulence, and temperature fields, the convection–diffusion species transport equation was also solved for distribution of carbon dioxide. Analysing the species transportation and air mixing in this study would provide information on the effectiveness of the proposed system to reduce CO2 concentration in the breathing zone and to provide better IAQ.
The PEE was determined by using CO2 as a tracer gas. The method provides an indication of the level of mixing between the supplied fresh air and the contaminated (recirculated) room air. For the species transport, a source delivering 3.5 × 10⁻³ L/s of CO2 was placed in the middle of the wall parallel to the symmetry plane at a height of 1 m from the floor. The fresh air nozzle in the ceiling has a CO2 concentration of 400 ppm while the air supplied by the secondary nozzle and the peripheral diffuser has the same CO2 concentration as the return vent air. The amount of fresh air supplied to the room was equal to the amount of room air exhausted, thus preventing the build-up of CO2 in the space.
There are several indices available in the literature for assessing air quality, and among them is the ‘pollutant exposure reduction index’ which is defined as the pollutant concentration reduction in the inhaled air from the average room air. Gao et al.
49
defined another index called ‘ventilation coefficient’ and reported that both the pollutant exposure reduction index and the ventilation coefficient are numerically equal to the PEE defined by Melikov et al.
50
For that reason, the PEE was used in this study as it reflects the percentage of the personalized air in the inhaled air and is widely used in the literature.
36
The PEE at the breathing zone is defined by Melikov et al.
50
as
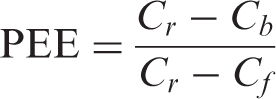
Results and discussions
Validation of the CFD model
It is important to ensure that the numerical results are stable and converged and do not exhibit transient behaviour due to instabilities in the buoyant flows. The dimensionless ratio of Gr/Re2 ratio was calculated and a value of 0.209 was found. Since the resulting Rayleigh number was less than 108 and the magnitude of Gr/Re2 was less than 1, the steady state calculations were performed. To obtain a valid steady state solution in presence of buoyancy forces, the under-relaxation factors were manipulated to dampen the flow oscillations that may arise. In addition, a transient simulation was run using the steady state solution as initial conditions and no further changes were observed in the flow and thermal results.
Since the momentum method was used to model the diffuser’s jet numerically, experimental measurements of the diffuser’s velocity profile below the jet were necessary to validate the predicted numerical values. Figure 4 shows the velocity measured at several points within the jet and compares the data with the predicted CFD values. The results show good agreement between the measured and predicted values since most of the noticed differences were within the instrument uncertainty. The considered diffuser with the corresponding geometry and grid density were shown to be accurately modelled and can be used with confidence in the simulation of the jet behaviour in the space.
Figure 5 shows the velocity and turbulence intensity measured at the outlet of the PV nozzle, which were later used as inputs to the CFD model to define the nozzle boundary conditions. The velocity measurements showed steady amplitude at the nozzles outlet that decreased when approaching the walls representing a ‘top hat’ profile as seen in Figure 5. The zero velocity at the nozzles walls indicates a no-slip condition regarding the airflow movement in the viscous sublayer. In addition, Figure 5 shows that the turbulent intensity increases close to the nozzle walls. This was due to the decrease in the velocity in the wall boundary layer where the ratio of the velocity fluctuations to the mean flow velocity was comparatively high. Values of the turbulent intensity varied between 2.4% and 3%, which resulted in adopting the value of 2.7% for the CFD simulations.
A plot of the velocity and turbulence intensity measurements at the PV nozzles outlet.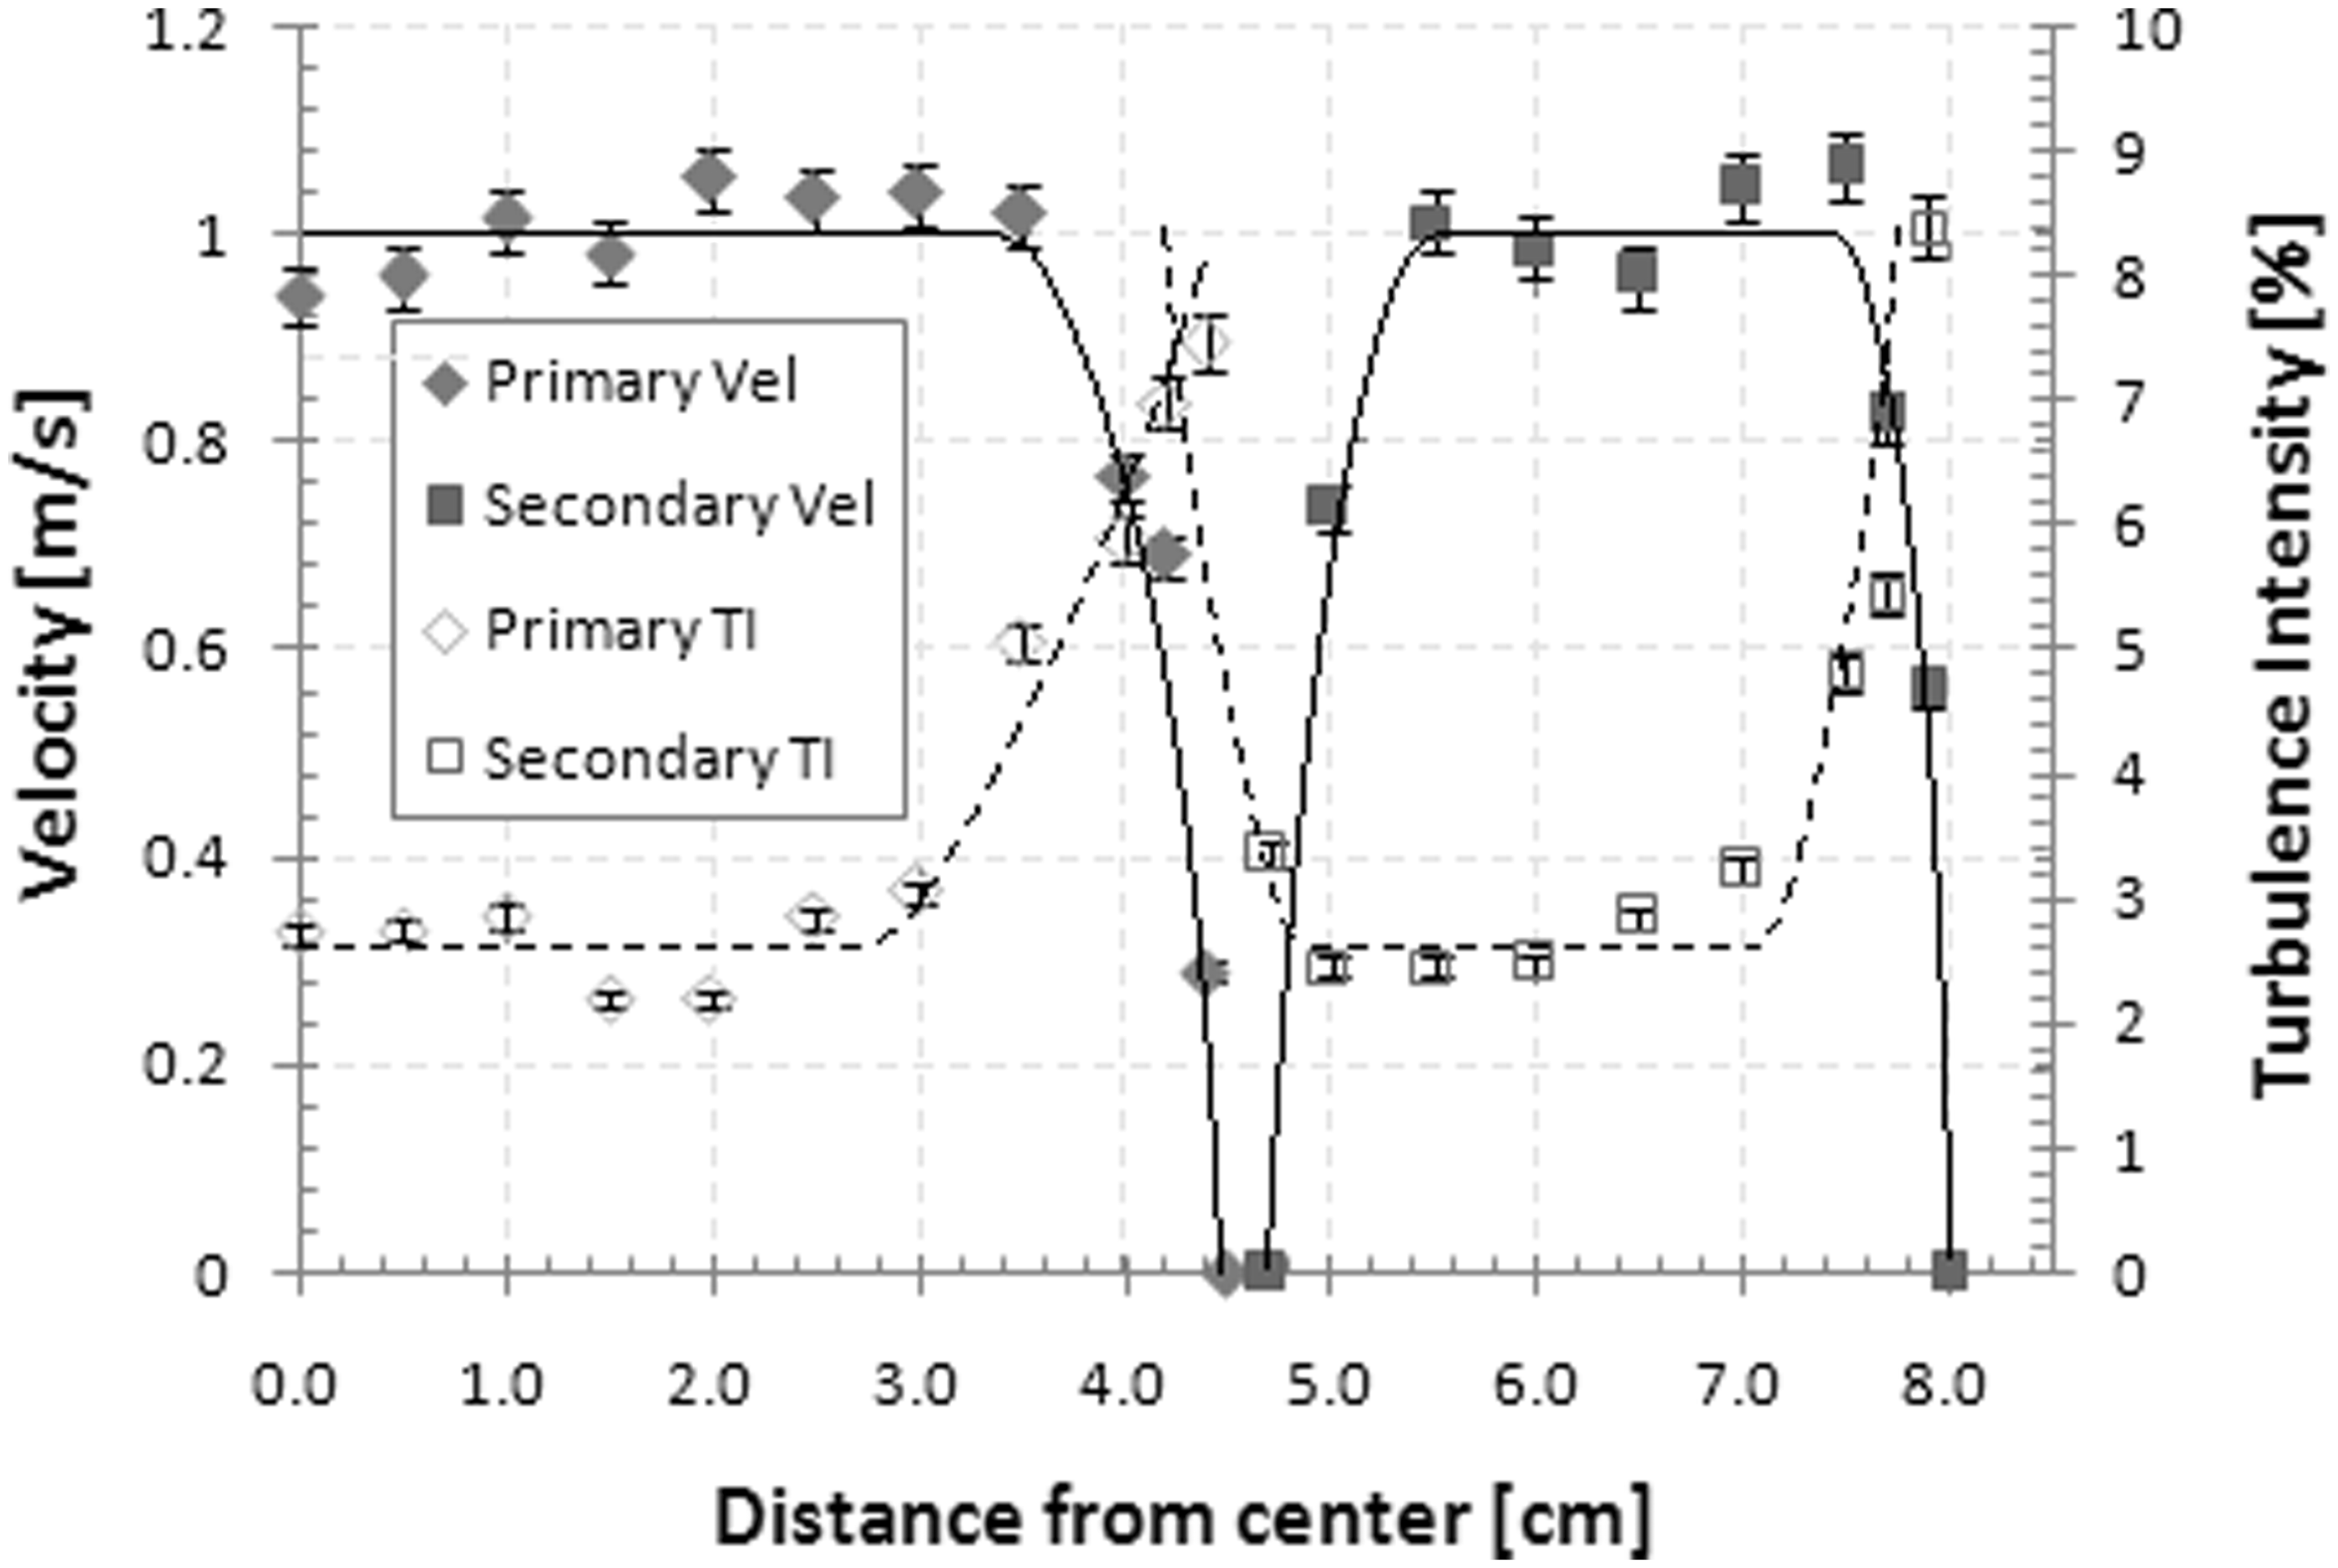
The PEE was calculated for the three fresh airflow rates of 5, 7.5, and 10 L/s at the fresh air temperatures of 24℃, 20℃, and 16℃. The PEE values for each PV fresh flow rate were independent of temperature. Figure 6 shows the numerically predicted and experimentally determined PEE variation versus the horizontal distance from the breathing level centre point along a line in the symmetry plane at PV flow rate of (a) 5 L/s, (b) 7.5 L/s, and (c) 10 L/s. The centre point X = 0 represents the centre of the line located directly above the centre of the heated cylinder. The PEE was observed to increase with an increasing flow rate. The PEE reached a value of 0.44 for a PV flow rate of 10 L/s. In addition, the experimental results showed good agreement with the CFD data and the matching was better for higher flow rates especially for the case of 10 L/s. The difference between the predicted and the measured value for the peak PEE did not exceed 0.05, which was slightly above the instrument uncertainty. For some other points, the difference reached 0.11 and which might be due to errors in the sensor positioning due to the large sensor head (diameter of 2.5 cm). Actually, the sensor head measures the average CO2 concentration perceived by the sensing part. This might lead to errors in the measurements when compared with predicted CFD results. At the lower flow rate of 5 L/s, the PEE was less evident which was due to the jet having a low momentum to overcome the rising thermal plume.
The measured and predicted PEE for a PV fresh air flow rate of (a) 5 L/s, (b) 7.5 L/s and (c) 10 L/s.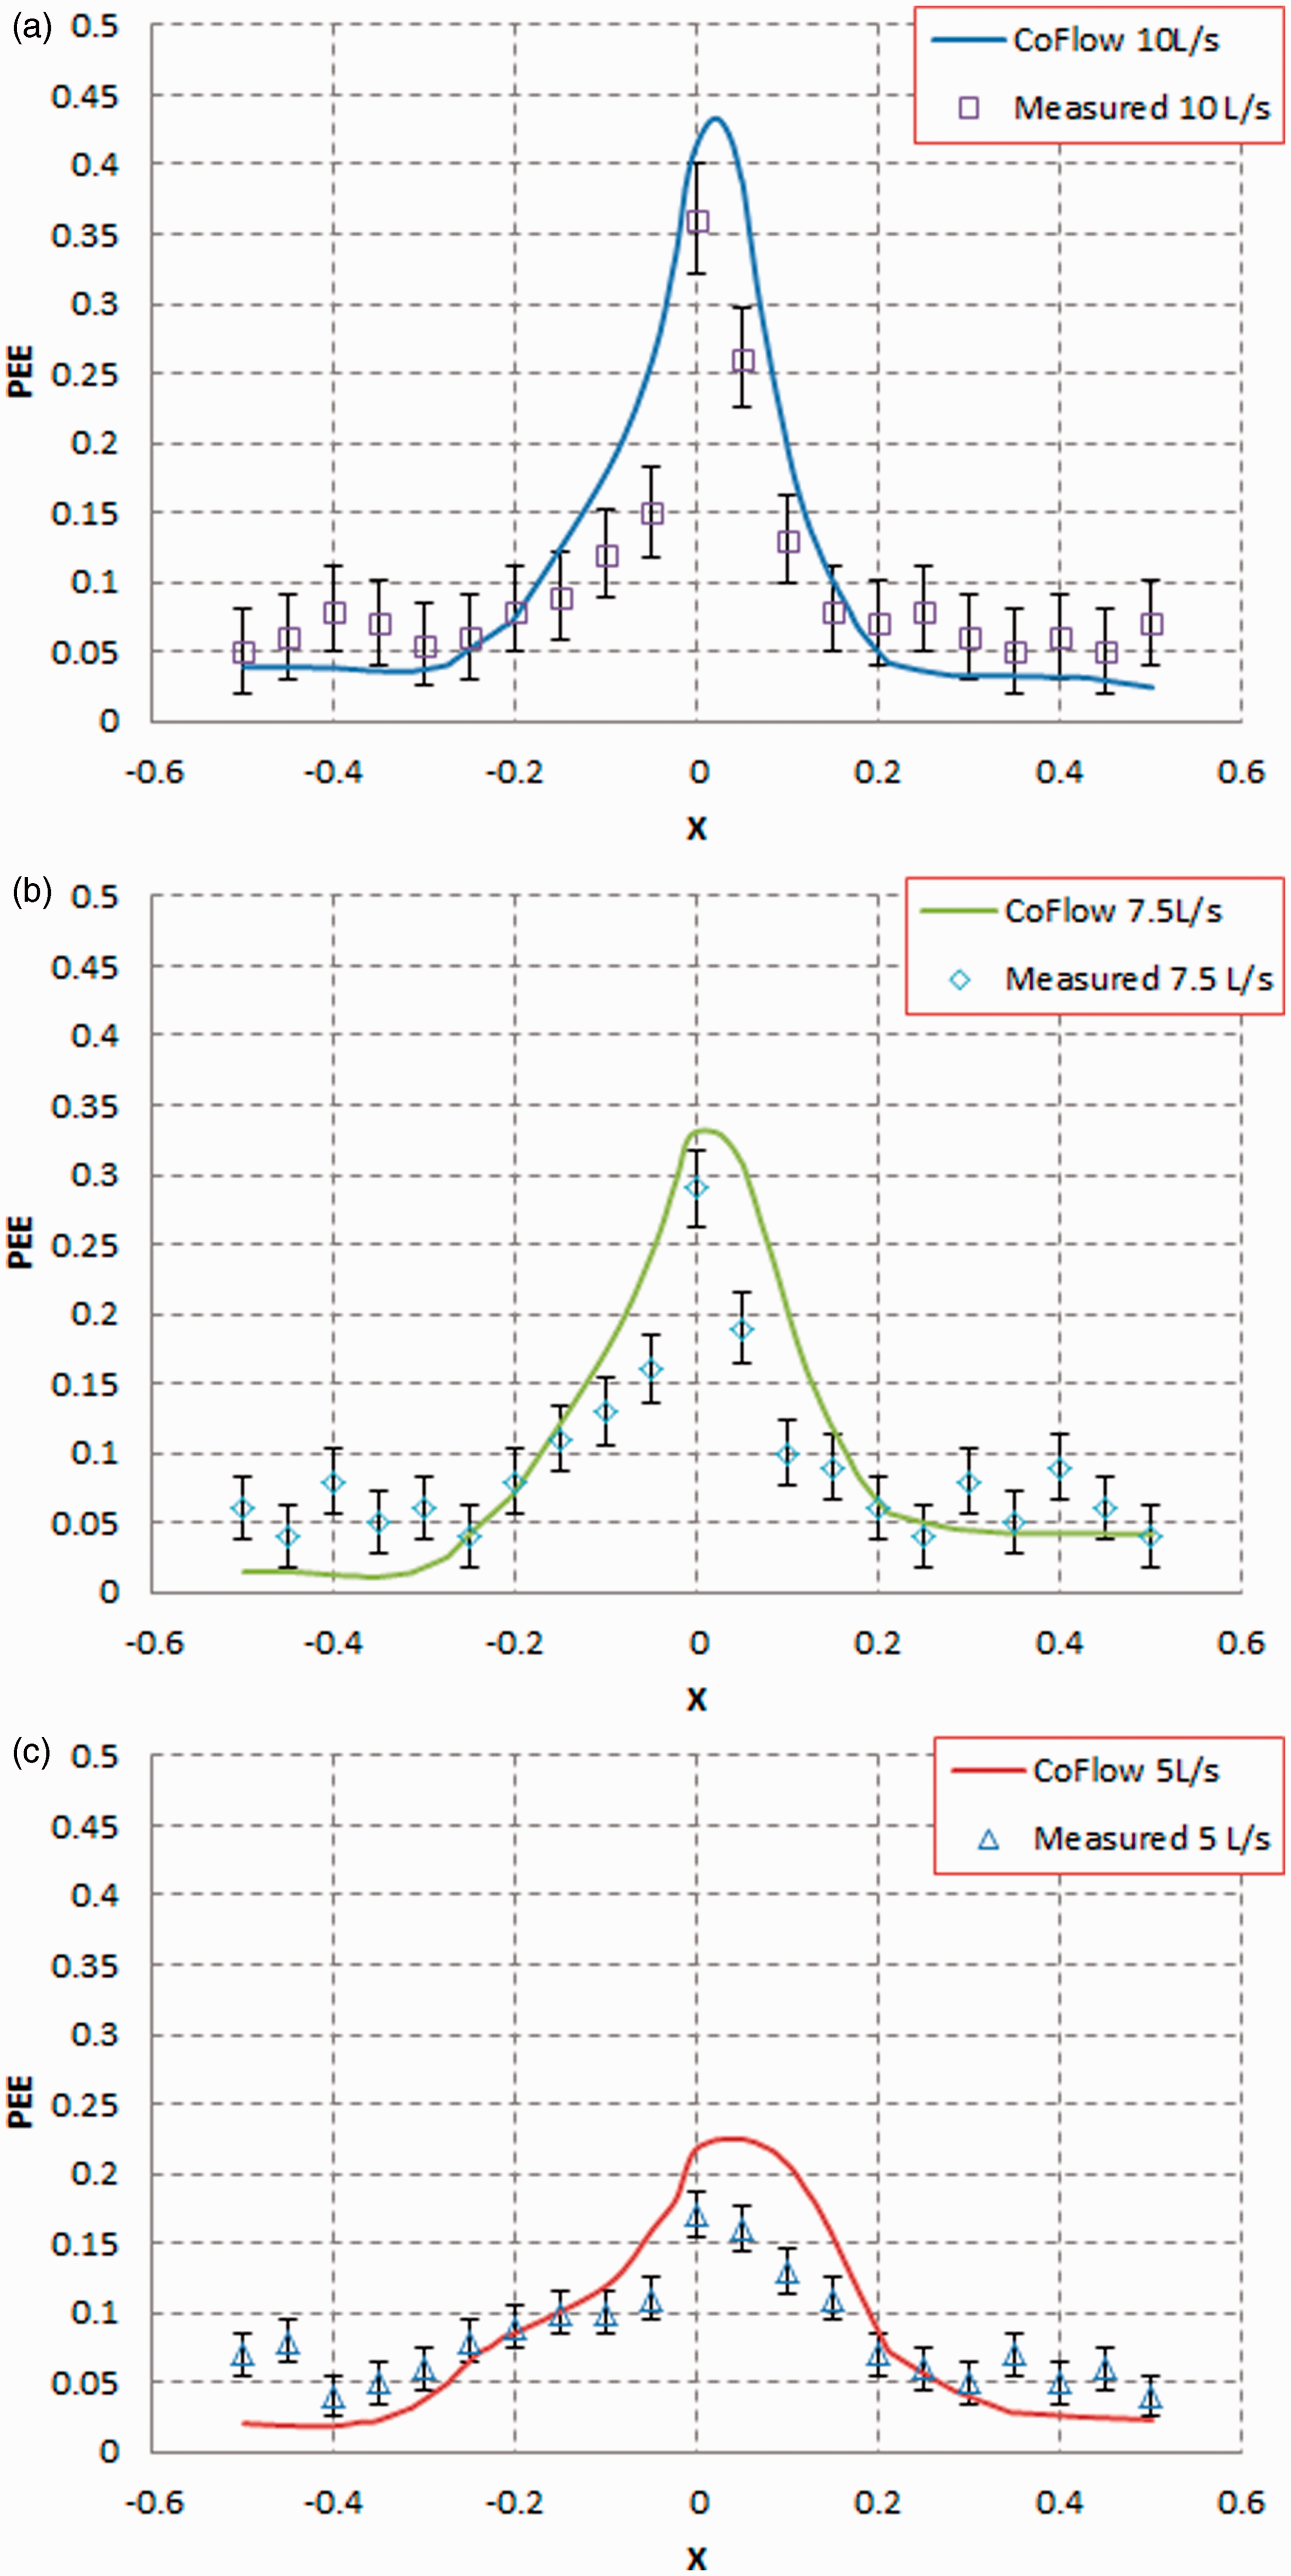
The temperature field validation was performed against temperature measurements of the case where the macroclimate temperature was maintained at 26℃ at fresh air flow rate of 7.5 L/s and temperature of 20℃. The comparison of values predicted by the numerical simulation to values obtained by measurement is shown in Figure 7. The experimental and predicted values of temperature at the specified locations around the heated cylinder agreed well and the noticed error did not exceed the instrumentation uncertainty.
A plot showing the validation of temperature profile in the vicinity of the heated cylinder with experimental data.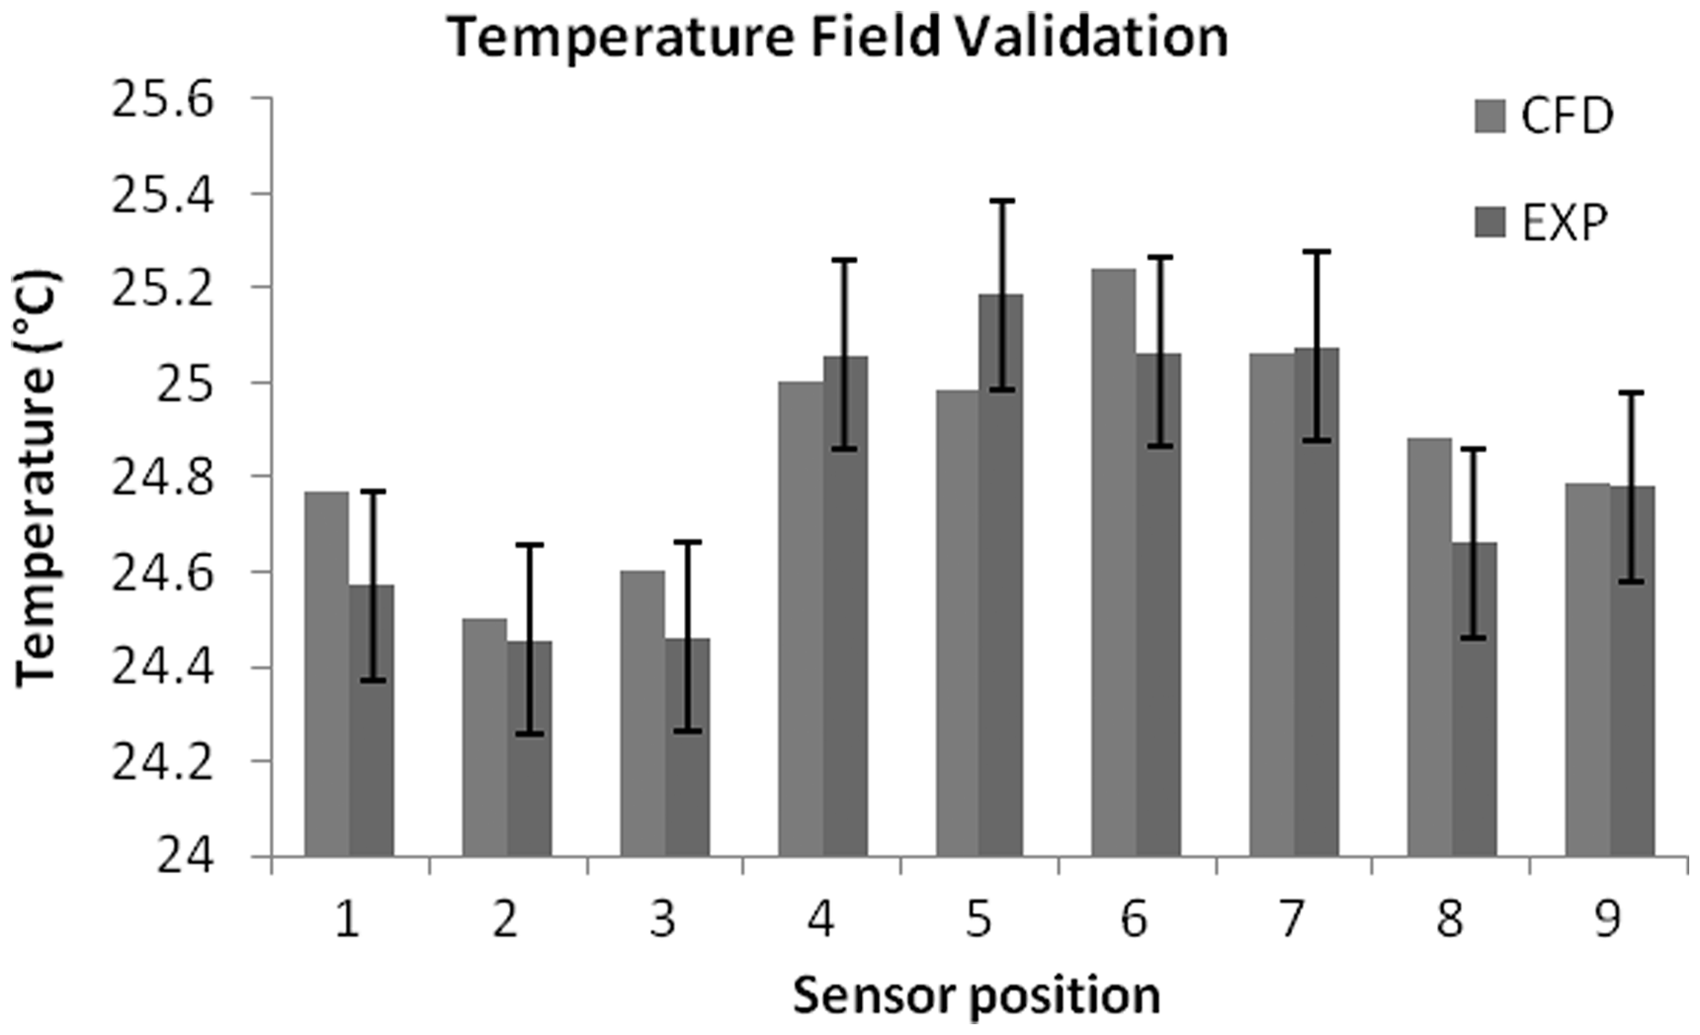
To compare the co-axial and single core PV performance, additional simulations were performed for single PV nozzle at same exit velocity. Figure 8 (a) and (b) shows the predicted and measured velocity at three different distances away from the PV nozzle’s outlet (0.4 m, 0.8 m and 1.2 m) for (a) the coaxial jet and (b) the single core jet. At vertical distances ranging between 0.4 m and 0.8 m, the variation in the jet velocity of the coaxial nozzle shown in Figure 8(a) was much smaller compared to that observed with a single core nozzle. This was due to the fact that the low-mixing effect of the coaxial nozzle was still highly effective in this region close to the nozzle’s outlet. At further distances (1.2 m), the jet velocity of the single core nozzle decreased to 0.4 m/s, whereas in the case of the coaxial PV, the jet velocity did not go below 0.96 m/s because of the improved nozzle effectiveness. The quality of the air at this distance was better due to the reduced mixing with the stagnant polluted air and it was still at a significant velocity capable of penetrating the body plumes and reaching the breathing zone of the occupant. It was also observed (see Figure 8) that measured values were very close (within 4%) to those predicted numerically and all measurements were within the instrument uncertainty.
Plots of the velocity magnitude at three different distances away from the PV nozzle’s outlet for (a) coaxial jets and (b) single core jets.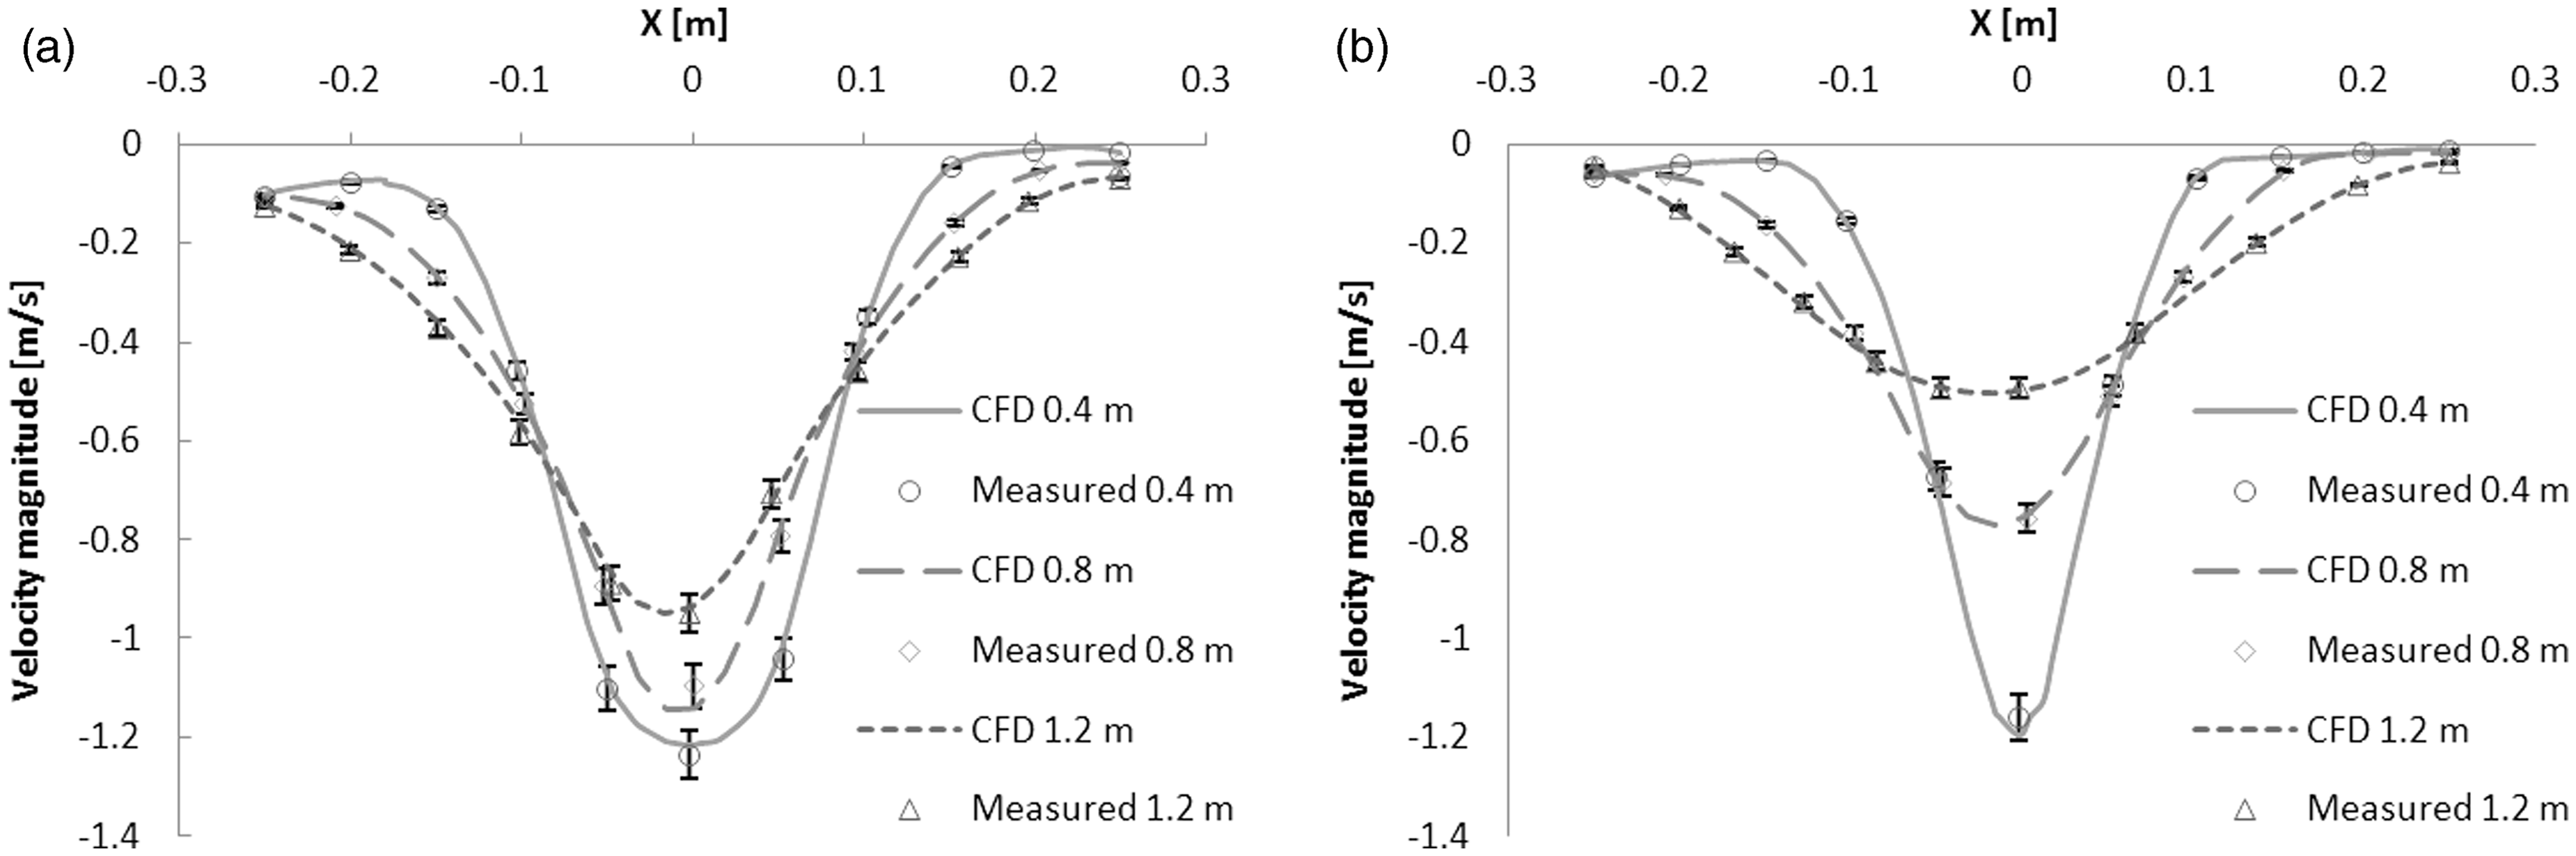
Parametric study
The simulation strategy for the parametric study was to:
perform simulations of the system for a human positioned directly underneath the PV nozzle and perform simulations for the case where the human was not directly positioned under the ceiling mounted PV. Matrix of simulations applied for the two human positions (aligned and inclined) and the three room macroclimate temperatures (26℃, 27℃ and 28℃).
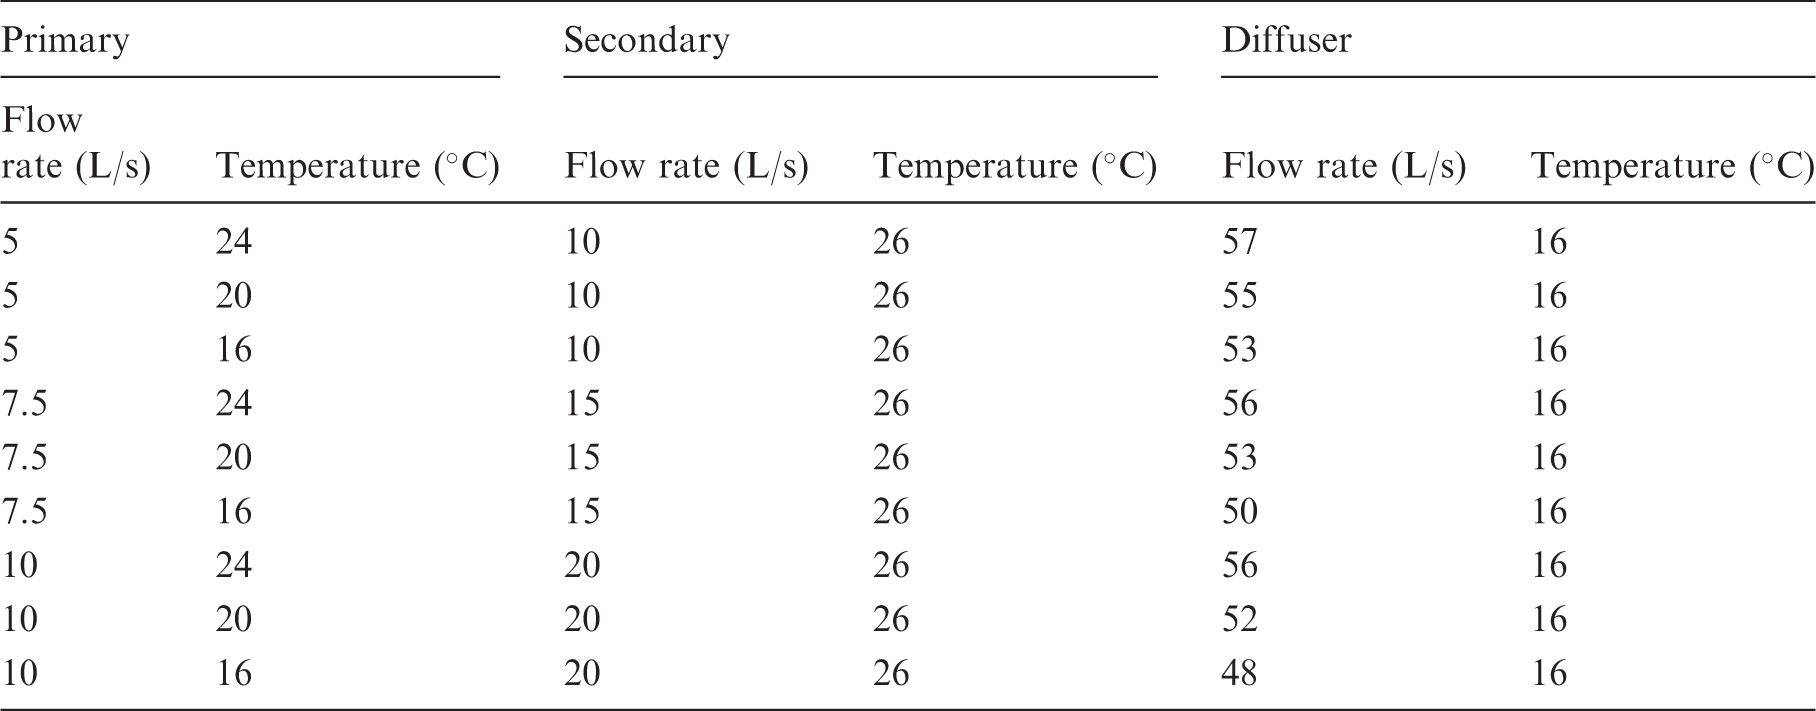
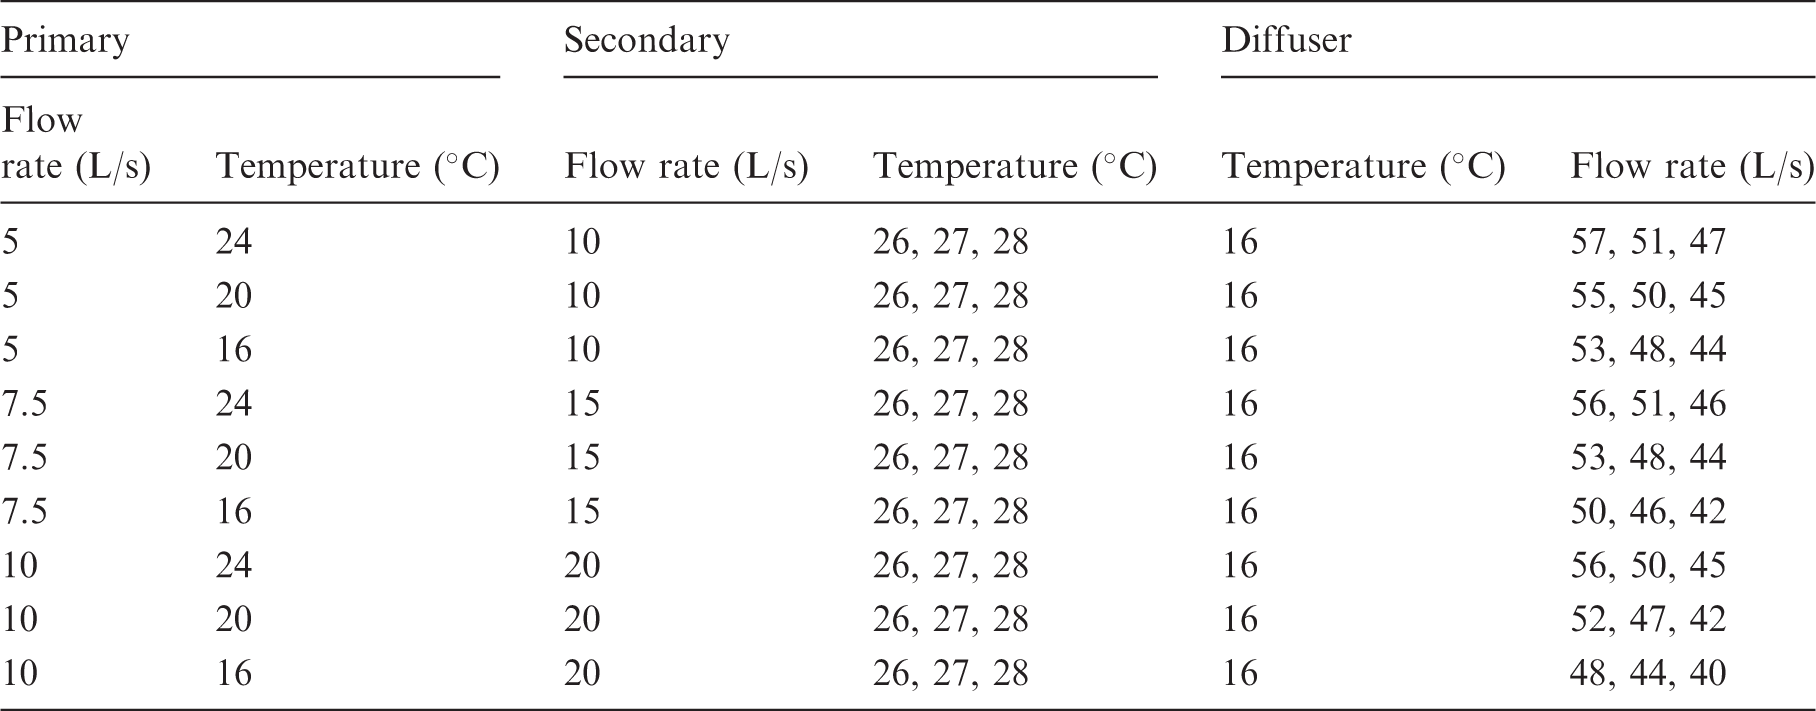
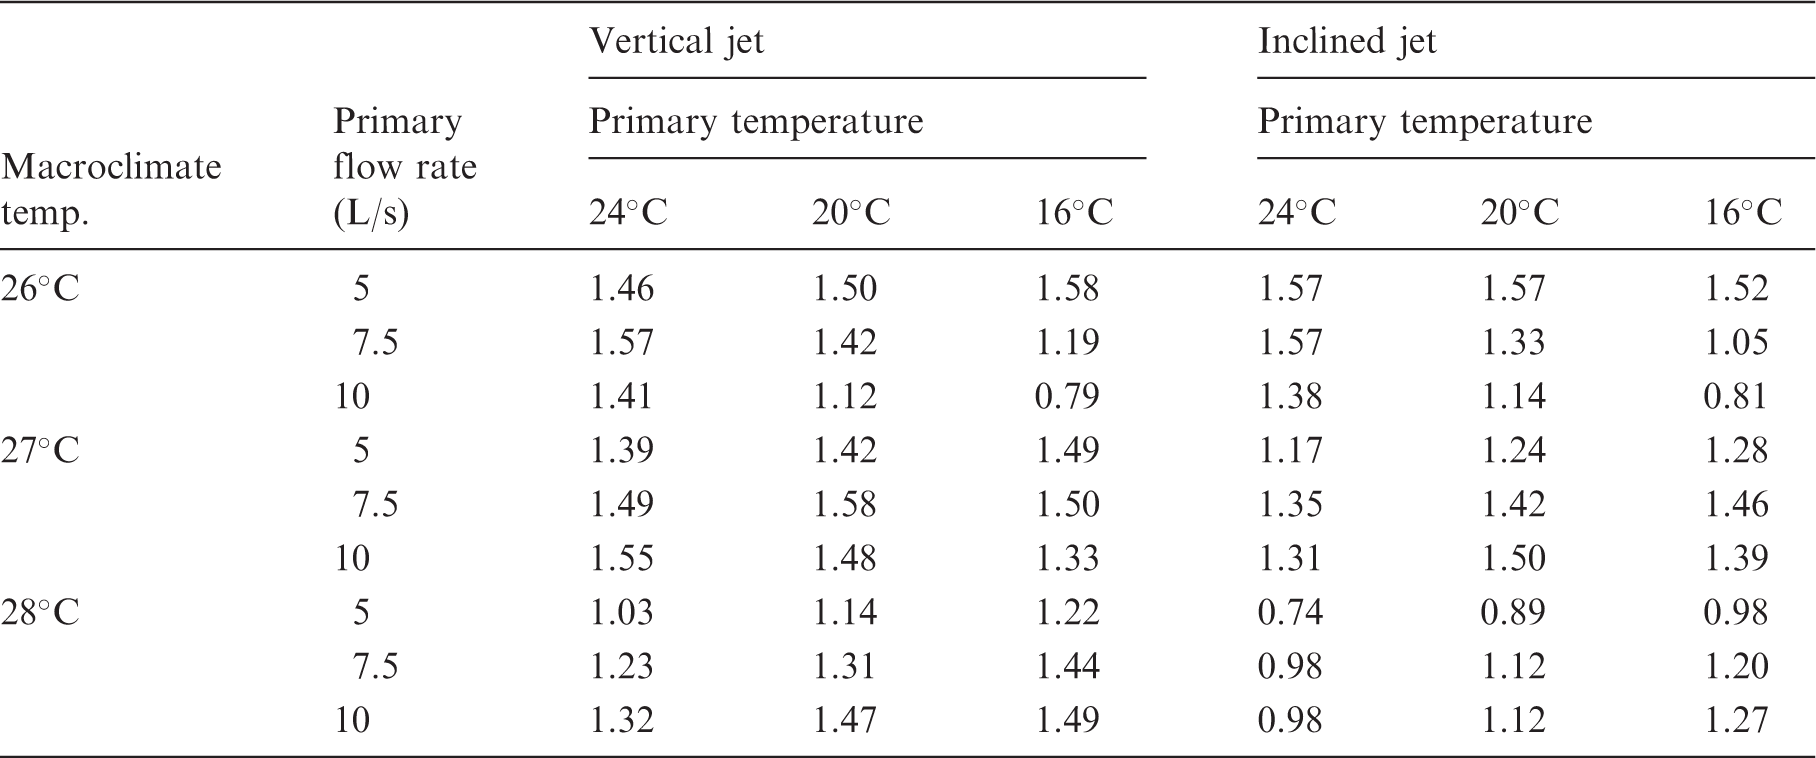
The performance of the nozzles was assessed by observing the air quality in the breathing zone as well as the extent of flow localization estimated using the zonal temperature difference. Different parameters affected the performance of the nozzle and the most prominent were the PV airflow rate and temperature. Many simulations were performed for a typical office load of 60 W/m2 at three different fresh airflow rates in addition to three associated temperatures as listed in Table 2. This procedure was repeated for each room set macroclimate temperature of 26℃, 27℃, and 28℃. The room set temperature was attained by varying the peripheral diffuser flow rate while maintaining the temperature of the air that was delivered at 16℃. The relatively low peripheral diffuser temperature of 16℃ was used to ensure removing the base thermal load of the room. For each simulation case, the room was divided into two zones: the microclimate and the macroclimate. The boundary between the two zones was represented by the dotted lines (see Figure 1).
Vertical PV jet
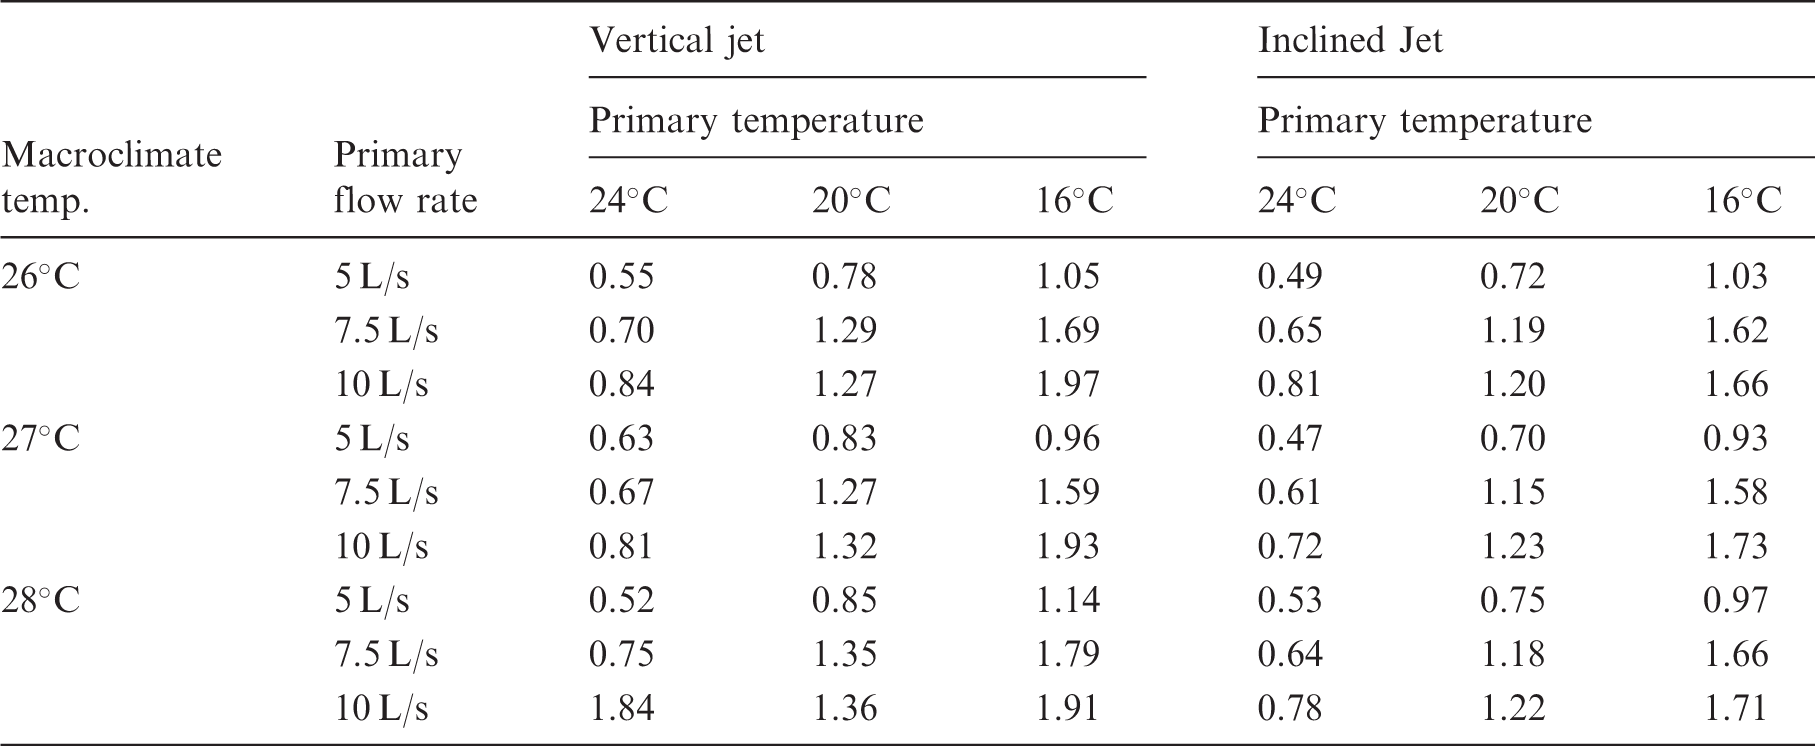
One of the main advantages of the proposed system is its ability to localize the flow and restrain the cooling to the occupied regions of the office. In order to evaluate this capability, Table 3 presents the averaged-temperature difference between the two zones; namely the occupant microclimate and the occupant macroclimate. A temperature differences of the order of 2℃ was achieved at the highest PV flow rate of 10 L/s associated with a PV temperature of 16℃. Note that this temperature difference decreased with increasing PV temperature and/or decreasing PV flow rate. The minimum achieved temperature difference between the occupied and unoccupied regions was 0.52℃ corresponding to a PV jet flow rate and temperature of 5 L/s and 24℃, respectively. The flow localization could be visualized in Figure 9(a) and (b) that show the temperature and velocity contours. The importance of this flow localization was that it would allow attainment of considerable energy savings by creating a thermally comfortable zone, which would be the occupant’s microclimate, thus allowing for higher air temperatures in the rest of the space. The CO2 concentration contours for a 10 L/s fresh air flow rate case with a macroclimate temperature of 26℃ are shown in Figure 9(c). The calculated PEE for the inhaled air reaching the manikin’s breathing zone was 0.32. In order to assess the performance of this system in terms of air quality, the PEE results were compared with reported values by Yang.
36
He conducted a similar study but with a ceiling-mounted single jet (without the secondary nozzle) using similar room height of 2.6 m and a fixed macroclimate temperature of 26℃. The separating distance between the nozzles and the measurement location was similar for both studies.
36
Yang reported his results using the PEE with different combinations of jet air temperatures and room air temperatures. The results of a single jet nozzle were not very promising in terms of inhaled air quality. The highest flow rate of 16 L/s delivered by the nozzle achieved an PEE of 0.13 which was about 40% of the PEE achieved using the coaxial PV nozzle at a lower flow rate of 10 L/s.
36
At a similar flow rate of 10 L/s, the PEE achieved by a single core jet was around 0.09. Therefore, the coaxial ceiling-mounted PV could deliver a 3.5 times better inhaled air quality than a single core jet.
Plots of (a) temperature, (b) velocity, and (c) CO2 contours for the vertical jet with 10 L/s fresh air flow rate and 26℃ macroclimate temperature. Average temperature difference between the two zones for macroclimate temperatures of (a) 26℃, (b) 27℃, and (c) 28℃.
The predicted thermal comfort for different fresh air flow rate and temperature combinations.
Inclined PV jet
A similar parametric study was performed for the inclined jet where the human was moved a distance of 0.5 m backwards from its original position: the distance separating the nozzles from the occupant’s breathing zone became 1.49 m. This selected distance was found to be the limiting distance beyond which interaction would occur between the PV jet and the angled peripheral diffuser jet of 45°. This study permitted to test the ability of the jet to penetrate the thermal plume from an inclined position.
The effectiveness of the system in localizing the flow around the occupant was evaluated using the average temperature difference between the occupied and unoccupied zones. As given in Table 3, the temperature difference was highly dependent of the fresh air flow rate and temperature: a higher flow rate and a lower temperature imply a larger temperature difference. However, this temperature difference was independent of the macroclimate temperature, since it was expressed in terms of the difference between the two zones, i.e. a higher macroclimate temperature accompanied by a higher microclimate temperature but the difference between the two was nearly steady. Temperature differences of the order of 1.73℃ could be achieved at a flow rate of 10 L/s which indicates that the system was still effective in providing a localized flow even in the inclined PV jet position. This gives the system more flexibilty when it comes to the occupants positioning inside the space with respect to the PV nozzle’s outlet.
One of the main advantages of supplying the jet in an inclined way is that it reaches directly the breathing zone of the occupant without first spreading over the head. However, mixing between the fresh and recirculated air increases with the longer distance the PV jet has to travel to reach the human breathing zone. Therefore, when examining the CO2 concentration of the inhaled air, a very similar air quality was observed for the inclined jet cases when moderate and high flow rates were used (Figure 10(c)). However, for the lower momentum jets corresponding to the low flow rates of 5 L/s where the rising thermal plume has a larger effect on obstructing the jet, the inclined jet has an advantage over the vertical one since it avoids most of the vertical plumes. Therefore, a slightly higher inhaled air quality by 12% (PEE = 0.24) was observed when fresh air flow rates of 5 L/s were supplied with an inclined jet.
Plots of (a) temperature, (b) velocity, and (c) CO2 contours for the inclined jet with a 10 L/s fresh airflow rate and 26℃ macroclimate temperature.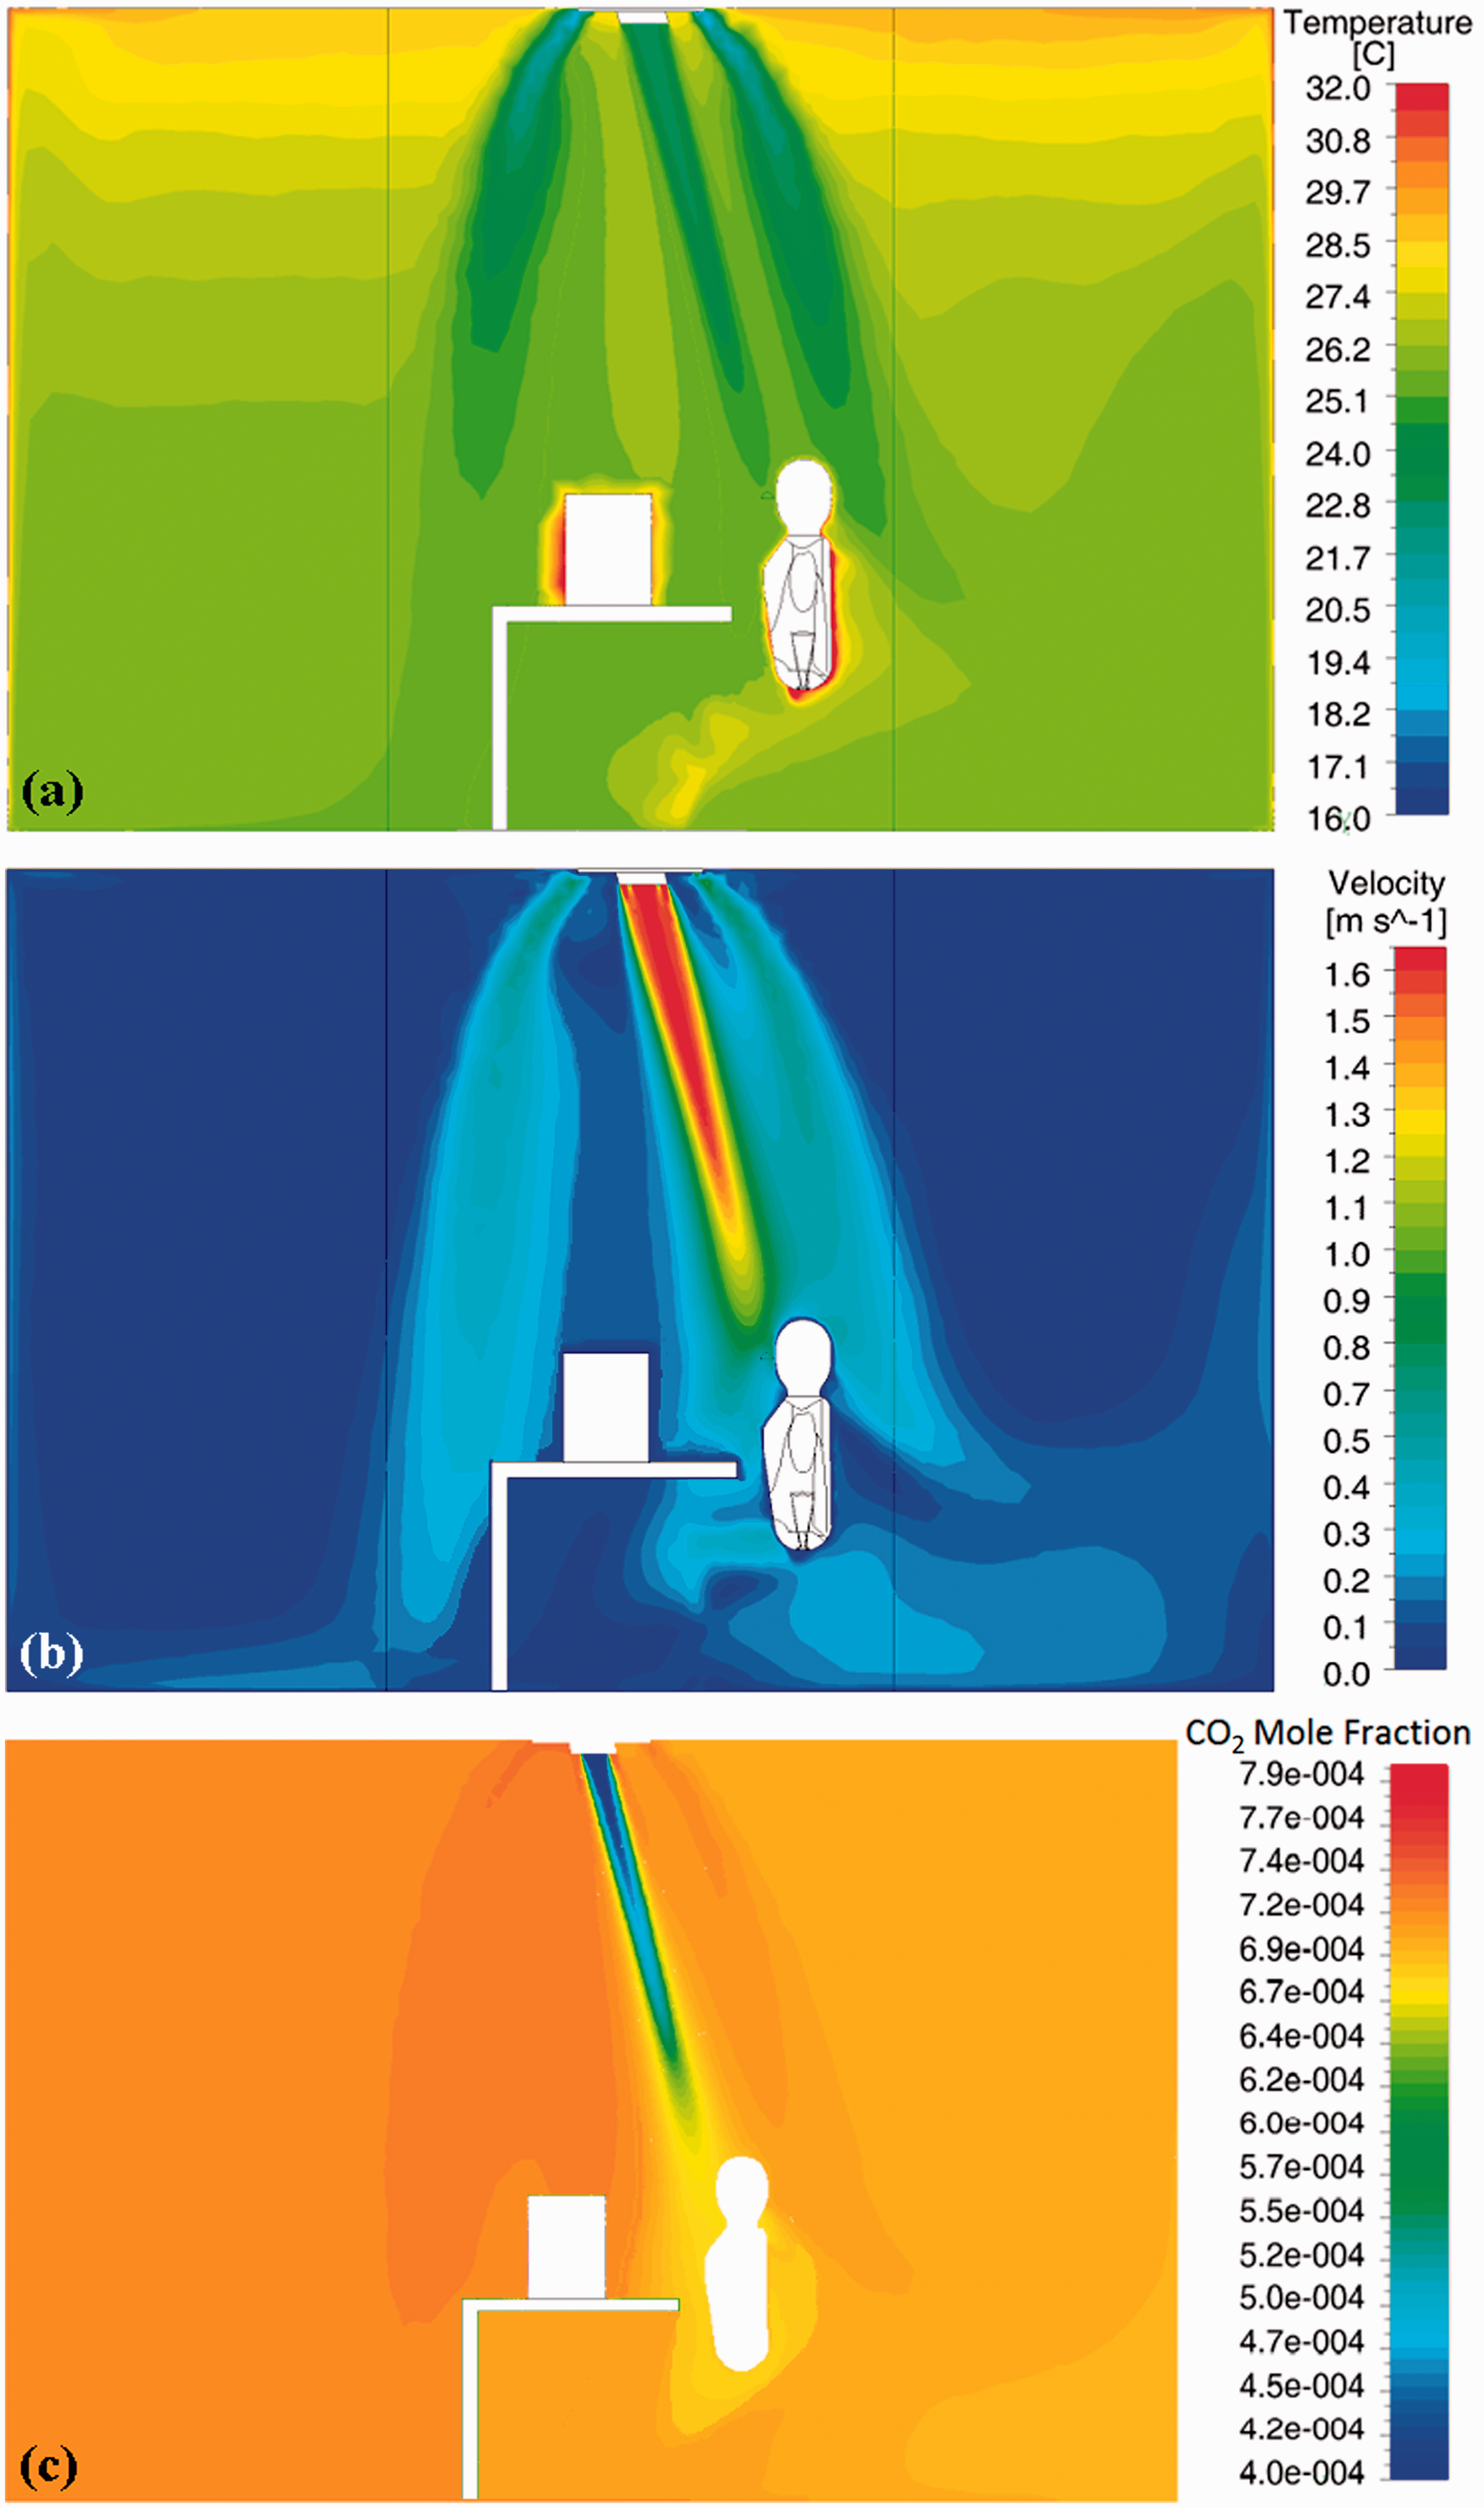
The thermal comfort indicators are summarized in Table 4 for the three considered macroclimate temperatures of 26℃, 27℃, and 28℃. A similar phenomenon to the vertical jet was observed where the human body would prefer lower jet velocities and temperatures when the macroclimate temperature was maintained at its lower limit of 26℃. At the intermediate level, for a temperature of 27℃, the human body shows preference for a fresh airflow rate of 7.5 L/s. A higher flow rate of 10 L/s could be tolerated but with a temperature not lower than 20℃ where the comfort starts dropping afterwards. Finally, for a macroclimate temperature of 28℃, the human body shows tolerance for higher fresh air flow rates and lower temperatures: the maximum comfort of 1.27 was achieved at a fresh air flow rate of 10 L/s and temperature of 16℃.
The importance of the studied PV coaxial nozzle was in its improved effectiveness while providing comfort to the upper part of the body that governs the overall thermal sensation and comfort of occupants. Any discomfort due to the low temperature jet directed to the upper body parts can be minimized when surrounding macroclimate climate of the human body is at higher temperature than the usually recommended operative temperature of 24℃. 7 – 11
Conclusions
A new ceiling-mounted coaxial PV nozzle was designed and integrated with a modified ceiling diffuser supplying cool air at a predefined issue angle. A numerical and experimental study of the system was performed to assess its performance in terms of IAQ and thermal comfort. The system proved to be nearly three times more effective in providing clean PV air into inhalation with PEE values up to 32% compared to values up to 12% obtained using single core jets mounted in the ceiling. This improved IAQ was mainly due to the reduced entrainment at the fresh air and the return air jet interface. The system was also able to localize the cool air around the occupant surroundings, thus allowing for a higher macroclimate air temperature. The ‘degree of localization’ was quantified using the macroclimate–microclimate temperature difference index and which attained values up to 1.97℃. Although the system relies on increased room temperature for improved energy savings, it permits maintaining acceptable thermal comfort conditions using the suitable combination of PV flow rate and temperature.
Footnotes
Acknowledgements
The authors would like to thank the Lebanese National Council for Scientific Research (CNRS) for their financial support. The support of the University Research Board (URB) at the American University of Beirut is also acknowledged.