
Abstract
Design of visual environment is a complex issue involving lighting sources, luminous properties of surfaces, brightness and glare. Digital image processing software can simulate lighting designs to ensure the right amount of light and luminous quality of the visual environment. Even though there are several means about how to determine the quality of the visual environment, this study adopted high dynamic range (HDR) images captured in real-life environment. The HDR imaging has been used for research purposes to analyse discomfort glare and extract luminance on the scene. However, numbers of previous researches reveal that the capacity of HDR imaging technology for luminance acquisition might be dependent upon types of camera and the exposed ranges of images. This paper aims to verify the accuracy and pragmatic reliability of HDR image tools such as LMK and Photolux. The reflectance percentages measured by LMK and Photolux were compared to the absolute values presented by Pantone hue, value and chroma. A series of Pantone colour, yellow, warm red, rubine red, rhodamine red, purple, reflex blue, process blue and green were adopted and with varying the mixture ratio of whiteness. A variation on this type of analysis can be used to validate the design and address visual problem areas such as the detection of potential glare sources.
Introduction
Since a few years ago, there has been an incessant interest in high dynamic range (HDR) imagery. HDR image information is widely available in today’s consumer products such as medical imaging equipment in hospitals, computer graphics and so forth.1,2 HDR is also being integrated in our casual everyday gadgets. The likes of these gadgets include mobile phones, personal digital cameras and so forth. Certain forms of HDR come incorporated into the recent versions of these electronic products mainly for the mere purposes of enhancing their photographic capabilities.
In reality, a wide range of luminance intensity is exhibited in the real field. The nature of the human eye, however, is only able to perceive scenes ranging from five orders of magnitude to over nine orders of magnitude as it accustoms to the scene. Techniques such as radiosity have been developed in the past aimed at enhancing the reality of the scenes seen by an observer. Such techniques were previously used by different kind of medias either as video displays or hard copy imagery. However, these techniques cannot replicate the exact luminance displayed in real scenes nor can they span the luminance to more than a few orders of magnitude. On the other hand though, the continuous studies on image synthesis have indicated that it is possible to depict the original appearance of a scene by mapping it to a set of luminance that can actually be recognized by the display medium being utilized. This is theoretically possible but the technology to exactly transform real-world luminances into display mediums is yet to be put in place. The idea of converting real-world luminances into luminances that are able to be displayed is referred to as tone mapping. 1
It is of great importance to replicate the exact feeling that arises with being in a certain atmosphere rather than just producing a photograph of that same atmosphere. When dealing with lighting design, it is difficult to tone map a given scene by using either both photographs and computer graphics image software. A human observer located in a given space is able to see almost all objects inside the same space as well as those located on the outside. This is due to the ability of the human eye to adapt local imagery as it scans the different regions of a scene. Current computer technologies being utilized in tone mapping are only able to produce the same results as those of a human eye or produce a scene that is totally not identical to the one that we are able to see. 2
Although the development on new HDR display systems is still in progress, 3 the current systems being used have insufficient dynamic ranges. Multi-scale image processing techniques, which are the most commonly applied techniques when it comes to image processing, have been criticized for leading to nimbus monuments when used for range compression. 4
Tone mapping operators are not only to preserve the contrast, but also brightness and visibility of a given scene. Suggestions from Tumblin and Rushmeier 5 on tone mapping operators focused mostly on the problem of maintaining the effect of brightness on the viewer. The correlation between brightness and luminance changes as the amount of light that the eye accustoms to in a scene changes.
Nakamae et al. 6 and Spencer et al. 7 came up with a method to simulate the effects caused by glare. These methods fabricate and depict the diffusion in the eye by scattering the effects of a bright source present in an image. Ferwerda et al. 8 suggested a method to deal with alterations in colour sensitivity and spatial keenness in relation to the level of light. To achieve a successful operation, we must not only focus on maintaining visibility and brightness but we must also consider the effects caused by glare, spatial keenness as well as colour sensitivity.
In order to capture an authentic display of a given scene, imaging and rendering systems use physically defined lighting information in the form of HDR images, textures as well as environmental maps. If low dynamic range imaging systems can obtain a definite prediction in the differences of very dim and bright light conditions, there exist possibilities that they may fail for the images that are very dark or very bright. On the other hand however, HDR images are able to accommodate a whole scale of colours and luminance that are perceivable by humans. 9 HDR imaging can be achieved by the use of cameras using multi-exposure techniques. 10 These techniques include the accumulation of several pictures and then combining them into one HDR image. HDR data can also be acquired through image synthesis software, which utilize physical values of luminance to assume the role of displayed images. Due to their constrained luminance range, it becomes impossible to directly display HDR images on conventional screens; as a result, mechanisms of tone mapping and gamut mapping are needed.11–13
In the evaluation of the quality of light and lighting control, accurately defined light measurements are of paramount importance. It is not an easy task for lighting professionals to obtain accurate measurements of non-uniform luminance of a lit surface using a luminance meter. With the HDR photography approaches being discovered, we might be able to overcome the difficulties and limitations of the past.14– 17 Our work is largely inspired by these papers, and we borrow heavily from Cai, in particular. 17
This paper investigates the efficiency of HDR mapping tools by considering different Pantone colours. It assesses the effect of different light spectrums, differing brightness as well as the combination ratio of white colour to the basic colours in regards to the accuracy of HDR mapping tools when measuring luminance. This paper also determines the errors that may arise.
HDR image
Dynamic range
In the 1980s when physically defined illumination methods were being developed for image synthesis, is when the HDR issue first arose. Prior to that, methods of image generation that were being used could only produce dimensionless values more or less equally spread in the range 0–1 or 0–255. These values could be easily mapped onto a displaying medium. It was not until after the breakthrough of the radiosity and Monte Carlo path tracing techniques that people started to compute images in terms of real units with the real dynamic range of physical illumination. The main purpose of image synthesis is to come up with results that resemble the exact appearance of the actual scene. However though, scholars have found out that a variety of generated images can be got by inputting same luminances. 1
HDR imaging
New imaging and rendering systems utilize defined lighting data as HDR images. HDR imaging is efficient when trying to predict the contrast visibility in HDR images; this is because it is possible for a given high dynamic image to contain dimly lighted interior as well as steady sunlight. As the endeavours to develop HDR visual techniques progress, a defined visual quality assessment to analyse the acquired HDR image results becomes a necessity. 9
For many years now, HDR imaging has been applied in research projects and recently it has become a common practice, as it is now being integrated into digital cameras as well as computer software. In HDR imaging, a number of photographs of a lit scene are captured from a same point of observation. These images are then fed into software which in turn produces luminance maps. 18
HDR image formats are undoubtedly useful for authentication purposes, as they can store data of the actual scenery with accurate precision rather than that of the displayed scenery. However, the initial purpose of developing HDR imaging was not specifically to deal with measurements of light. Nevertheless, specific algorithms and software have been in place for the mere purposes of light measurements.2,3
Studies in day lighting metrics and progression in certified HDR photography techniques have shown that luminance-based lighting controls are much able to deliver occupant satisfaction compared to the traditional illuminance-based lighting controls. In a previous study, 19 occupant acknowledgements as well as preference towards the patterns of luminance displayed by HDR imaging are fully analysed.
Research design for the verification of HDR image processing
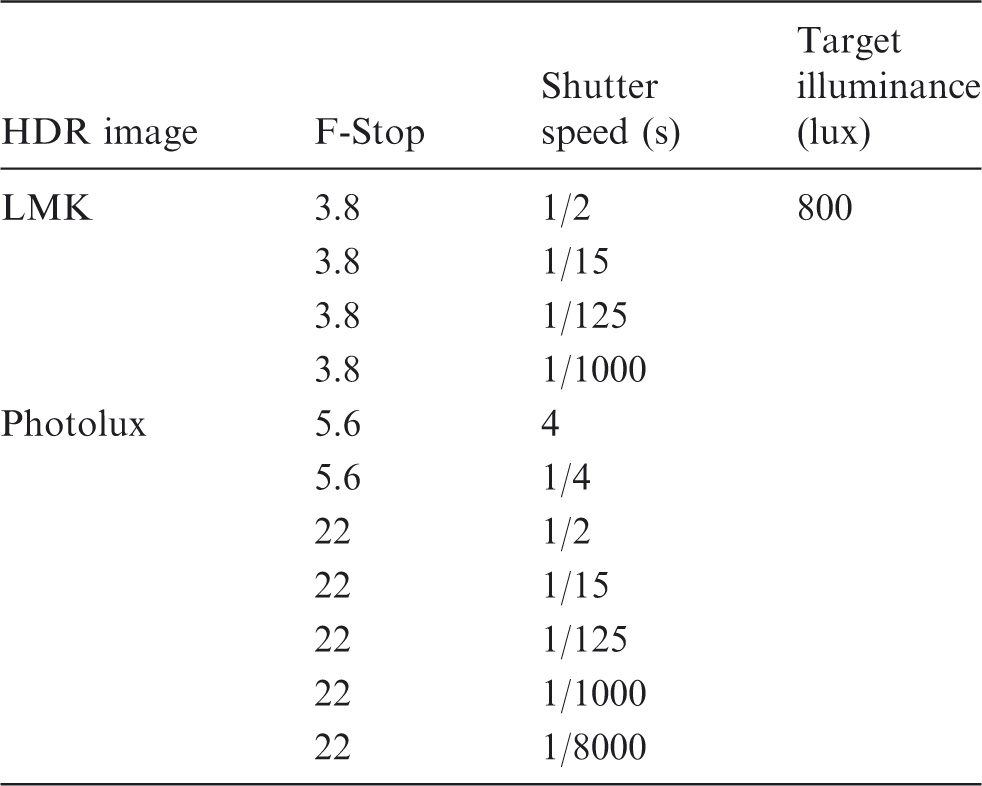
As described previously, HDR image processing technique synthesizes a set of low dynamic images so that the luminous difference between the real image as seen by a human eye and images captured by cameras can be obtained. The reliability and accuracy of luminance values produced by the image mapping technique can be verified with the use of the standard colour chart. Cai and Chung 15 used a Canon 350D camera fitted with a Sigma 10–20 mm lens to record the luminance data of 54 grey and 18 colour targets plus a light source in a windowless classroom lit by fluorescent lighting. Six apertures (f/4–f/22), three focal lengths (10, 14, 20 mm), two ambient light levels and four ranges of exposure values were used for generating 128 HDR images in photosphere. After vignetting correction and physical calibration, these HDR images were compared with each other for the quality of luminance acquisition. 17
The luminance range is subject to changes based on the capability of the camera and the luminance of HDR images can be changed by altering the context of the surface or colour of the light. To eliminate the potential effect of factors that may affect reflectance, the verification was performed using an uncoated Pantone colour chart. The luminance values produced by the HDR image mapping were compared to those of colour surface reflectance and Bar Code Graphics, Inc., which show the accuracy of the image processing technique.
Method used in setting up the LMK and Photolux to capture HDR images.
Equation (1) shows the correlation between luminance and illuminance, where L is measured luminance and E indicates the illuminance values on the surface subjected to artificial lighting. Additionally, ρ means the reflectance values of the Pantone colours and π is known as the mathematical constant that represents the ratio of a circle’s circumference to its diameter.
The reason why the measurements were performed within a darkroom is to eliminate not only the ambient light which might affect the value of illuminance but also to prevent the possibility of incoming reflected light from adjacent objects. The effect of colour rendering index and colour temperature of the light source was considered in the errors obtained in HDR image programs

The luminance values produced by the HDR image mapping were converted to measure ρ by the use of equation (1) and then the difference was calculated in percentage by comparing the measured values with real values. Equation (2) was used to calculate the error percentage between actual ρ and measured ρ

The luminance values produced by HDR image mapping can be changed by altering brightness, chroma and the hue. 20 The target variables in this study are the luminance values of basic colours suggested by Pantone and reflected luminance with different ratio of contained whiteness.
Figure 1 shows the process of measurement that was utilized in this study and measured examples of a Pantone colour chip. The chip of basic colours consists of yellow, warm red, rubine red, rhodamine red, purple, reflex blue, process blue and green. No. 101, 102 and 103 are the colours determined by the mixture ratio of whiteness. The ratio of No. 1 is 3% of basic yellow and 97% of whiteness. In turn, No. 102 is the mixture of 13% basic yellow and 87% of whiteness, while No. 103 is the mixture of 50% basic yellow and 50% of whiteness.
Experimental set-up and Pantone colour chip.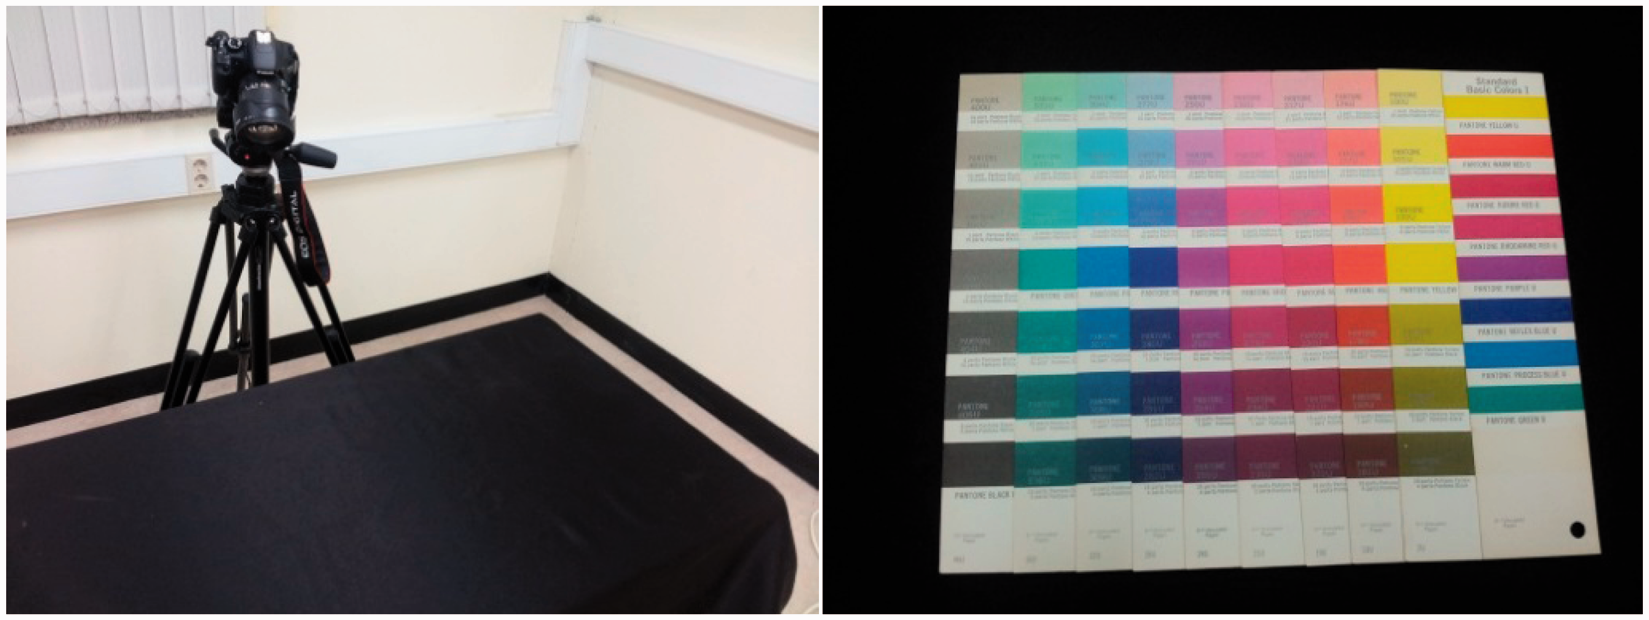
No. 176 is the mixture of 3% warm red and 97% of whiteness. Also, No. 177 is the mixture of 13% warm red and 87% of whiteness, which is the mixture ratio that is identical to No. 102. In turns, No. 178 is the mixture of 50% warm red and 50% of whiteness, which is the mixture ratio that is identical to No. 103.
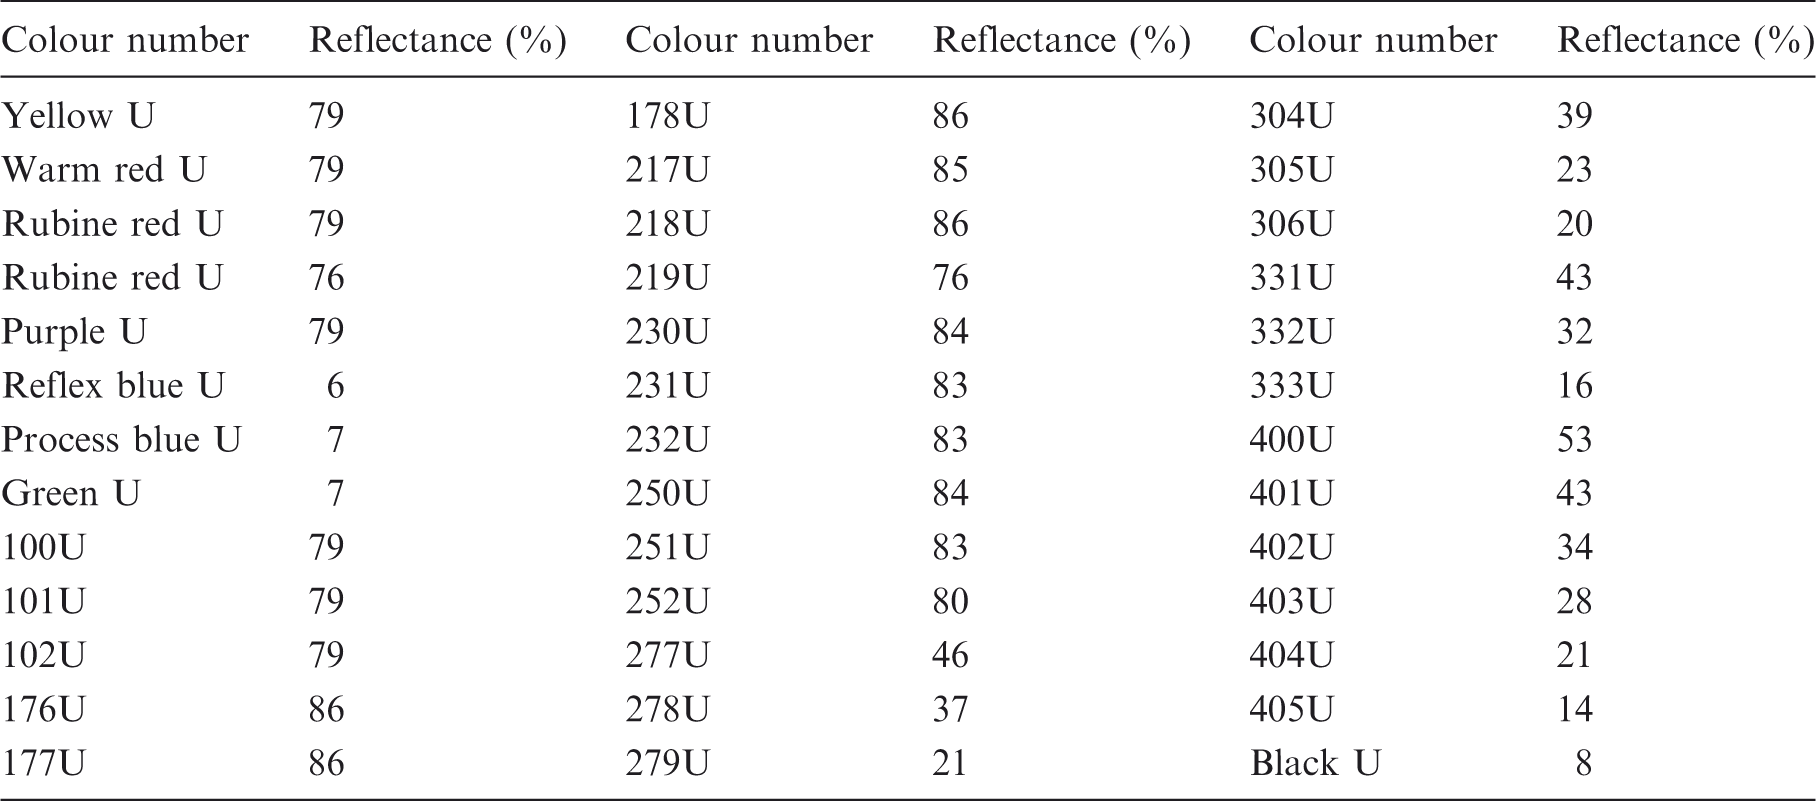
A series of colours were selected in this study. If the first two digits were 10, the colour depicted was yellow. If the first two digits were 17, the colour represented was warm red and the annotation of 20 became rubine red. Consequently, the annotation of 23 represented rubine red and 25 portrayed purple. The annotation of 27 meant reflex blue and if the first two digits were 30 the colour depicted became process blue and finally, 33 meant a colour of the green series. No. 401–405 are the mixed colour of black and white and each mixture ratios is 2:98, 3:97, 6:94, 13:87, 25:75, 50:50. The annotation numbers and reflectance values of the colours selected in this study are described in Table 2, respectively. Figure 2 shows an experimental set-up for the acquisition of the image and an example image of Pantone colour chip.
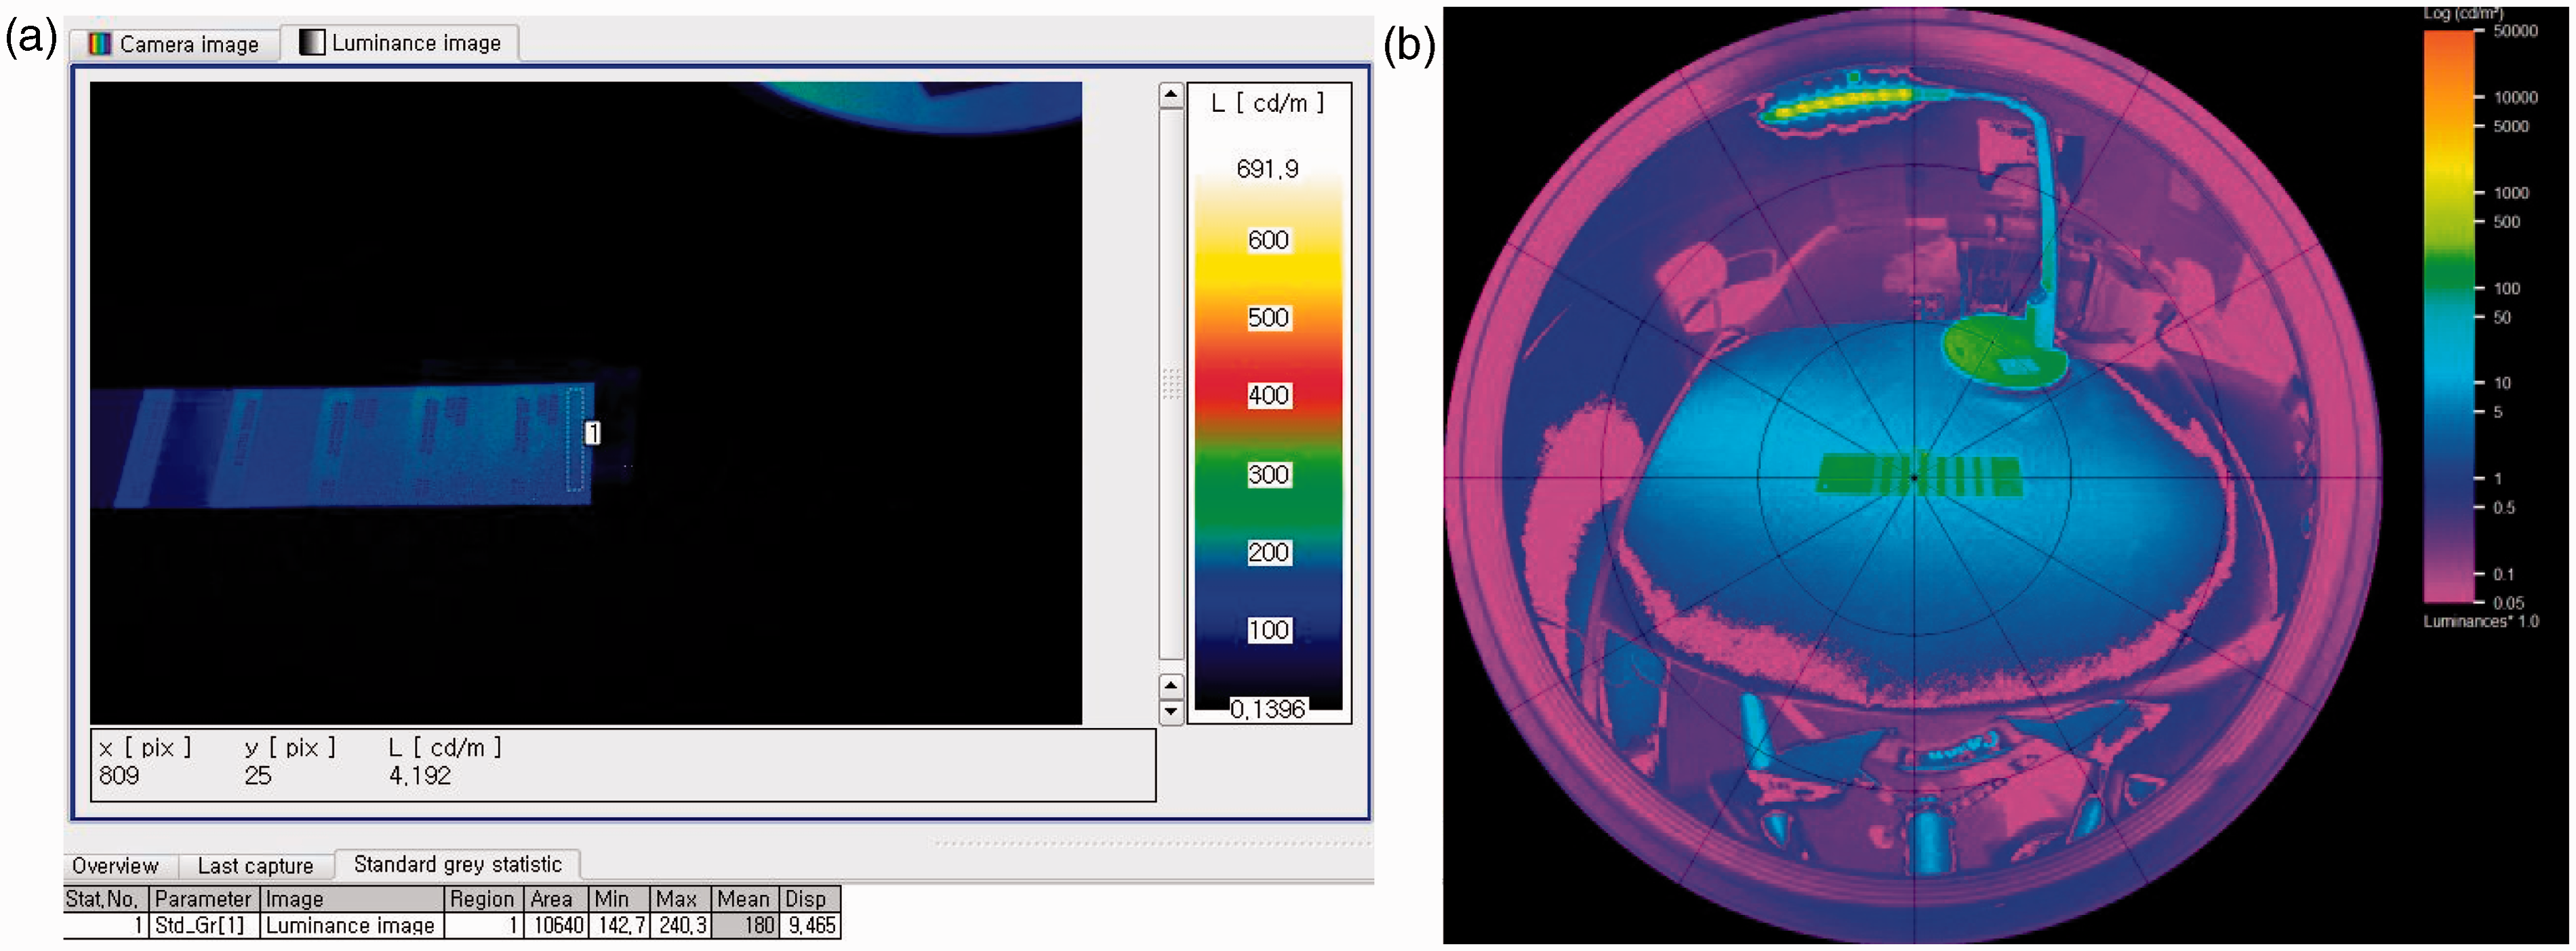
Luminance mapping by HDR image processing tools. (a) LMK, (b) Photolux. Reflectance chart of Pantone colours
21
Analysis of accuracy of luminance with HDR mapping tools
Accuracy of HDR mapping for light sources
For the tool verification of HDR mapping system, the luminance values of a daylit window and a metal halide lamp within a dark room were measured by both Prometric system and HDR processor. Figure 3 shows the positions of luminance measurement on the window surface and the HDR mapping values by Photolux or LMK were described in a tabular format. For the No. 3 surface, the luminance values were measured with a Venetian blind system and surfaces no. 1 and 2 have an outdoor obstruction which might affect the luminance values. As expected, the luminance values of surfaces No. 1 and No. 2 were different since they were subjected to a different kind of obstruction. For surface No. 3 with a blind system, the measured luminance values were changed by taking measurement at different positions. According to the obtained results, surface No. 2 produced less error, but an error of more than 10% was detected for surfaces No. 1 and No. 3.
Comparison of luminance of window surface by HDR tools.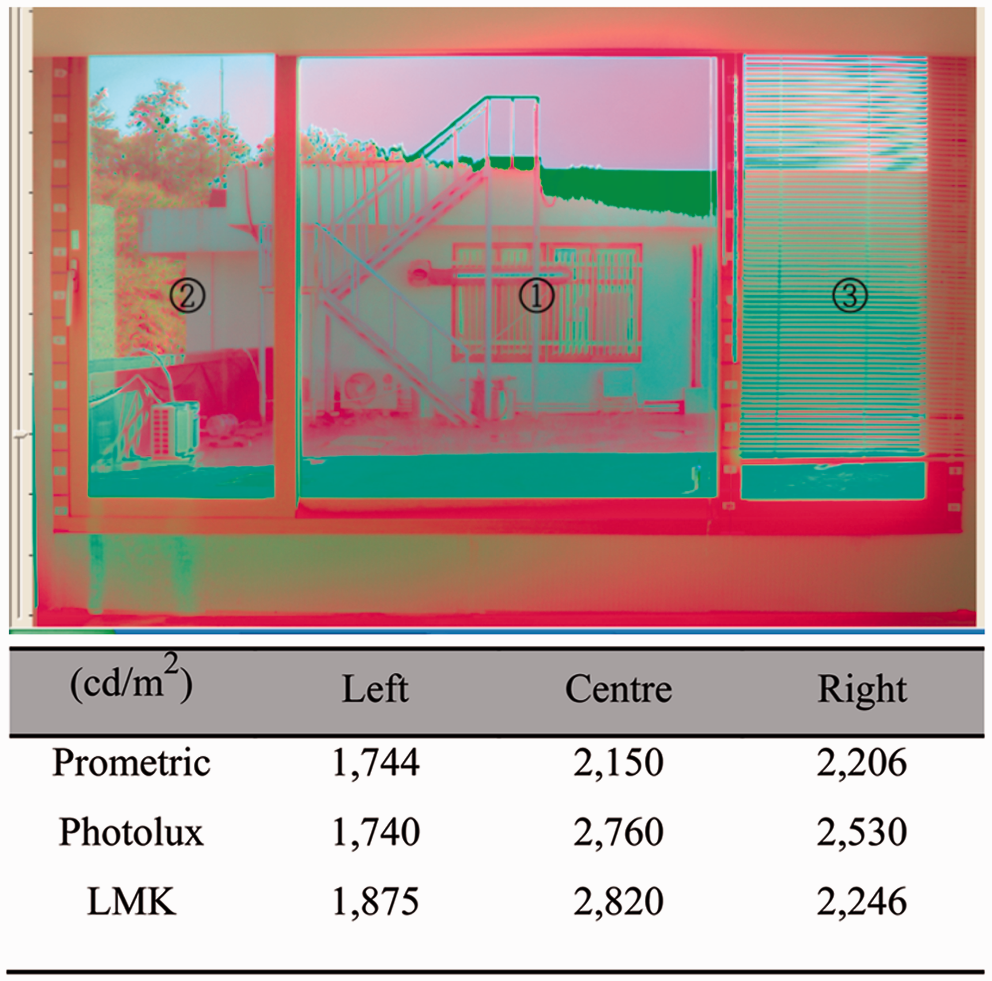
Figure 4 shows mean and peak luminance produced by HDR mappings with an identical source of light. Photolux cannot produce higher than 400,000 cd/m2 but LMK covered a wide range of luminance up to 987,500 cd/m2. Due to the optical characteristics of two technologies, it is not possible to get identical values of luminance in daylit environment or electric lighting. Direct measurement of daylight or electric light is not an appropriate way to verify an instrument’s possible errors when measuring luminance values.
Mean and max. luminance by HDR mappings with light identical source.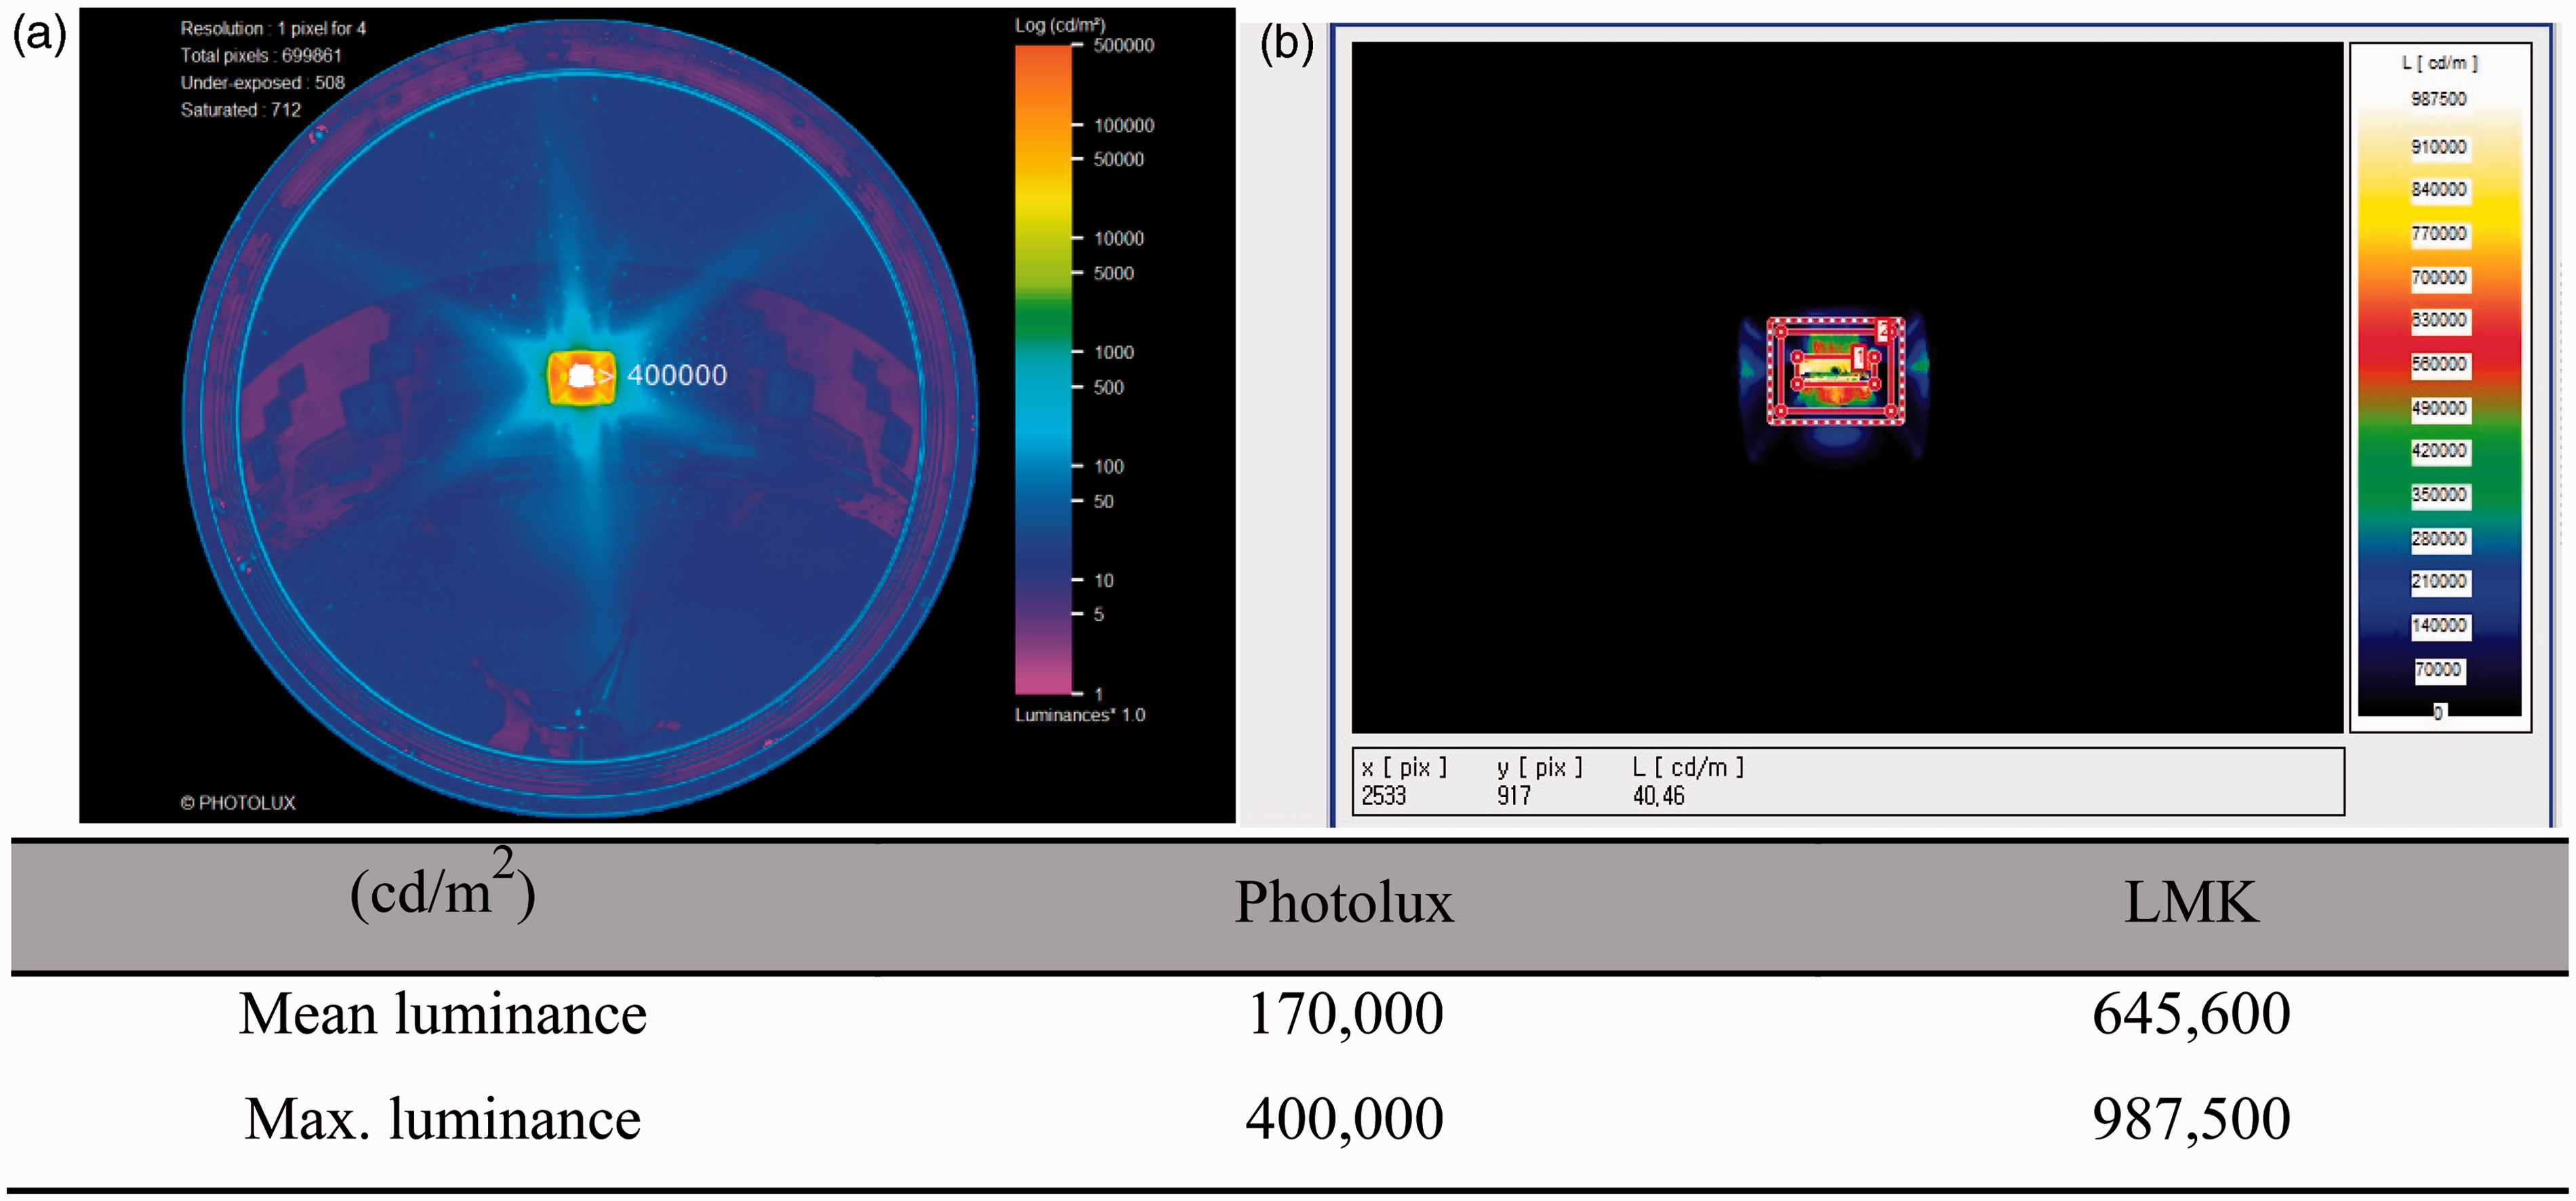
Accuracy based on colour of change
In a situation when daylight bounces on the wall, ceiling and floor surfaces, the reflectance of the surface can be changed according to the colour of change and as a result, daylighting performance can be affected. When measuring luminance values using LMK and Photolux, errors were estimated with colour of change. When a luminance of electric lighting was analysed, in addition, the accuracy might be affected by the colour of change. The error must be compensated according to its colour temperature. For acquisition of accurate luminance value with HDR images, the error based on the colour of change of interior surfaces was estimated.
Figure 5 shows the error rate when Pantones basic colours were measured by LMK and Photolux. The set of analysed colours consists of yellow, red, purple and blue. When luminance of yellow surface was measured using Photolux, the error rate was found to be less than 7% and LMK for yellow surface promises an affordable error of –9%. Even in the family colour of red such as warm, rubine, rhodamine red, their error rates were different. Mean error rate for the family colour of red was 32% with Photolux and 38% with LMK, illustrating a consistent trend in error rates. In turn, darker family colours like purple, blue and green were found with the error rates of over 100%. The measured luminance values of the family colours of blue were about 40–50 cd/m2, which is relatively small and could largely affect the amount of error percentage. Meanwhile, the surface luminance of yellow was about 180 cd/m2 and the luminance of the family colours of red was about 70–90 cd/m2. When looking into the overall error rates, the different instruments showed a similar trend with various colours as targets.
Trend of error rate on colour variation of the image by HDR tools.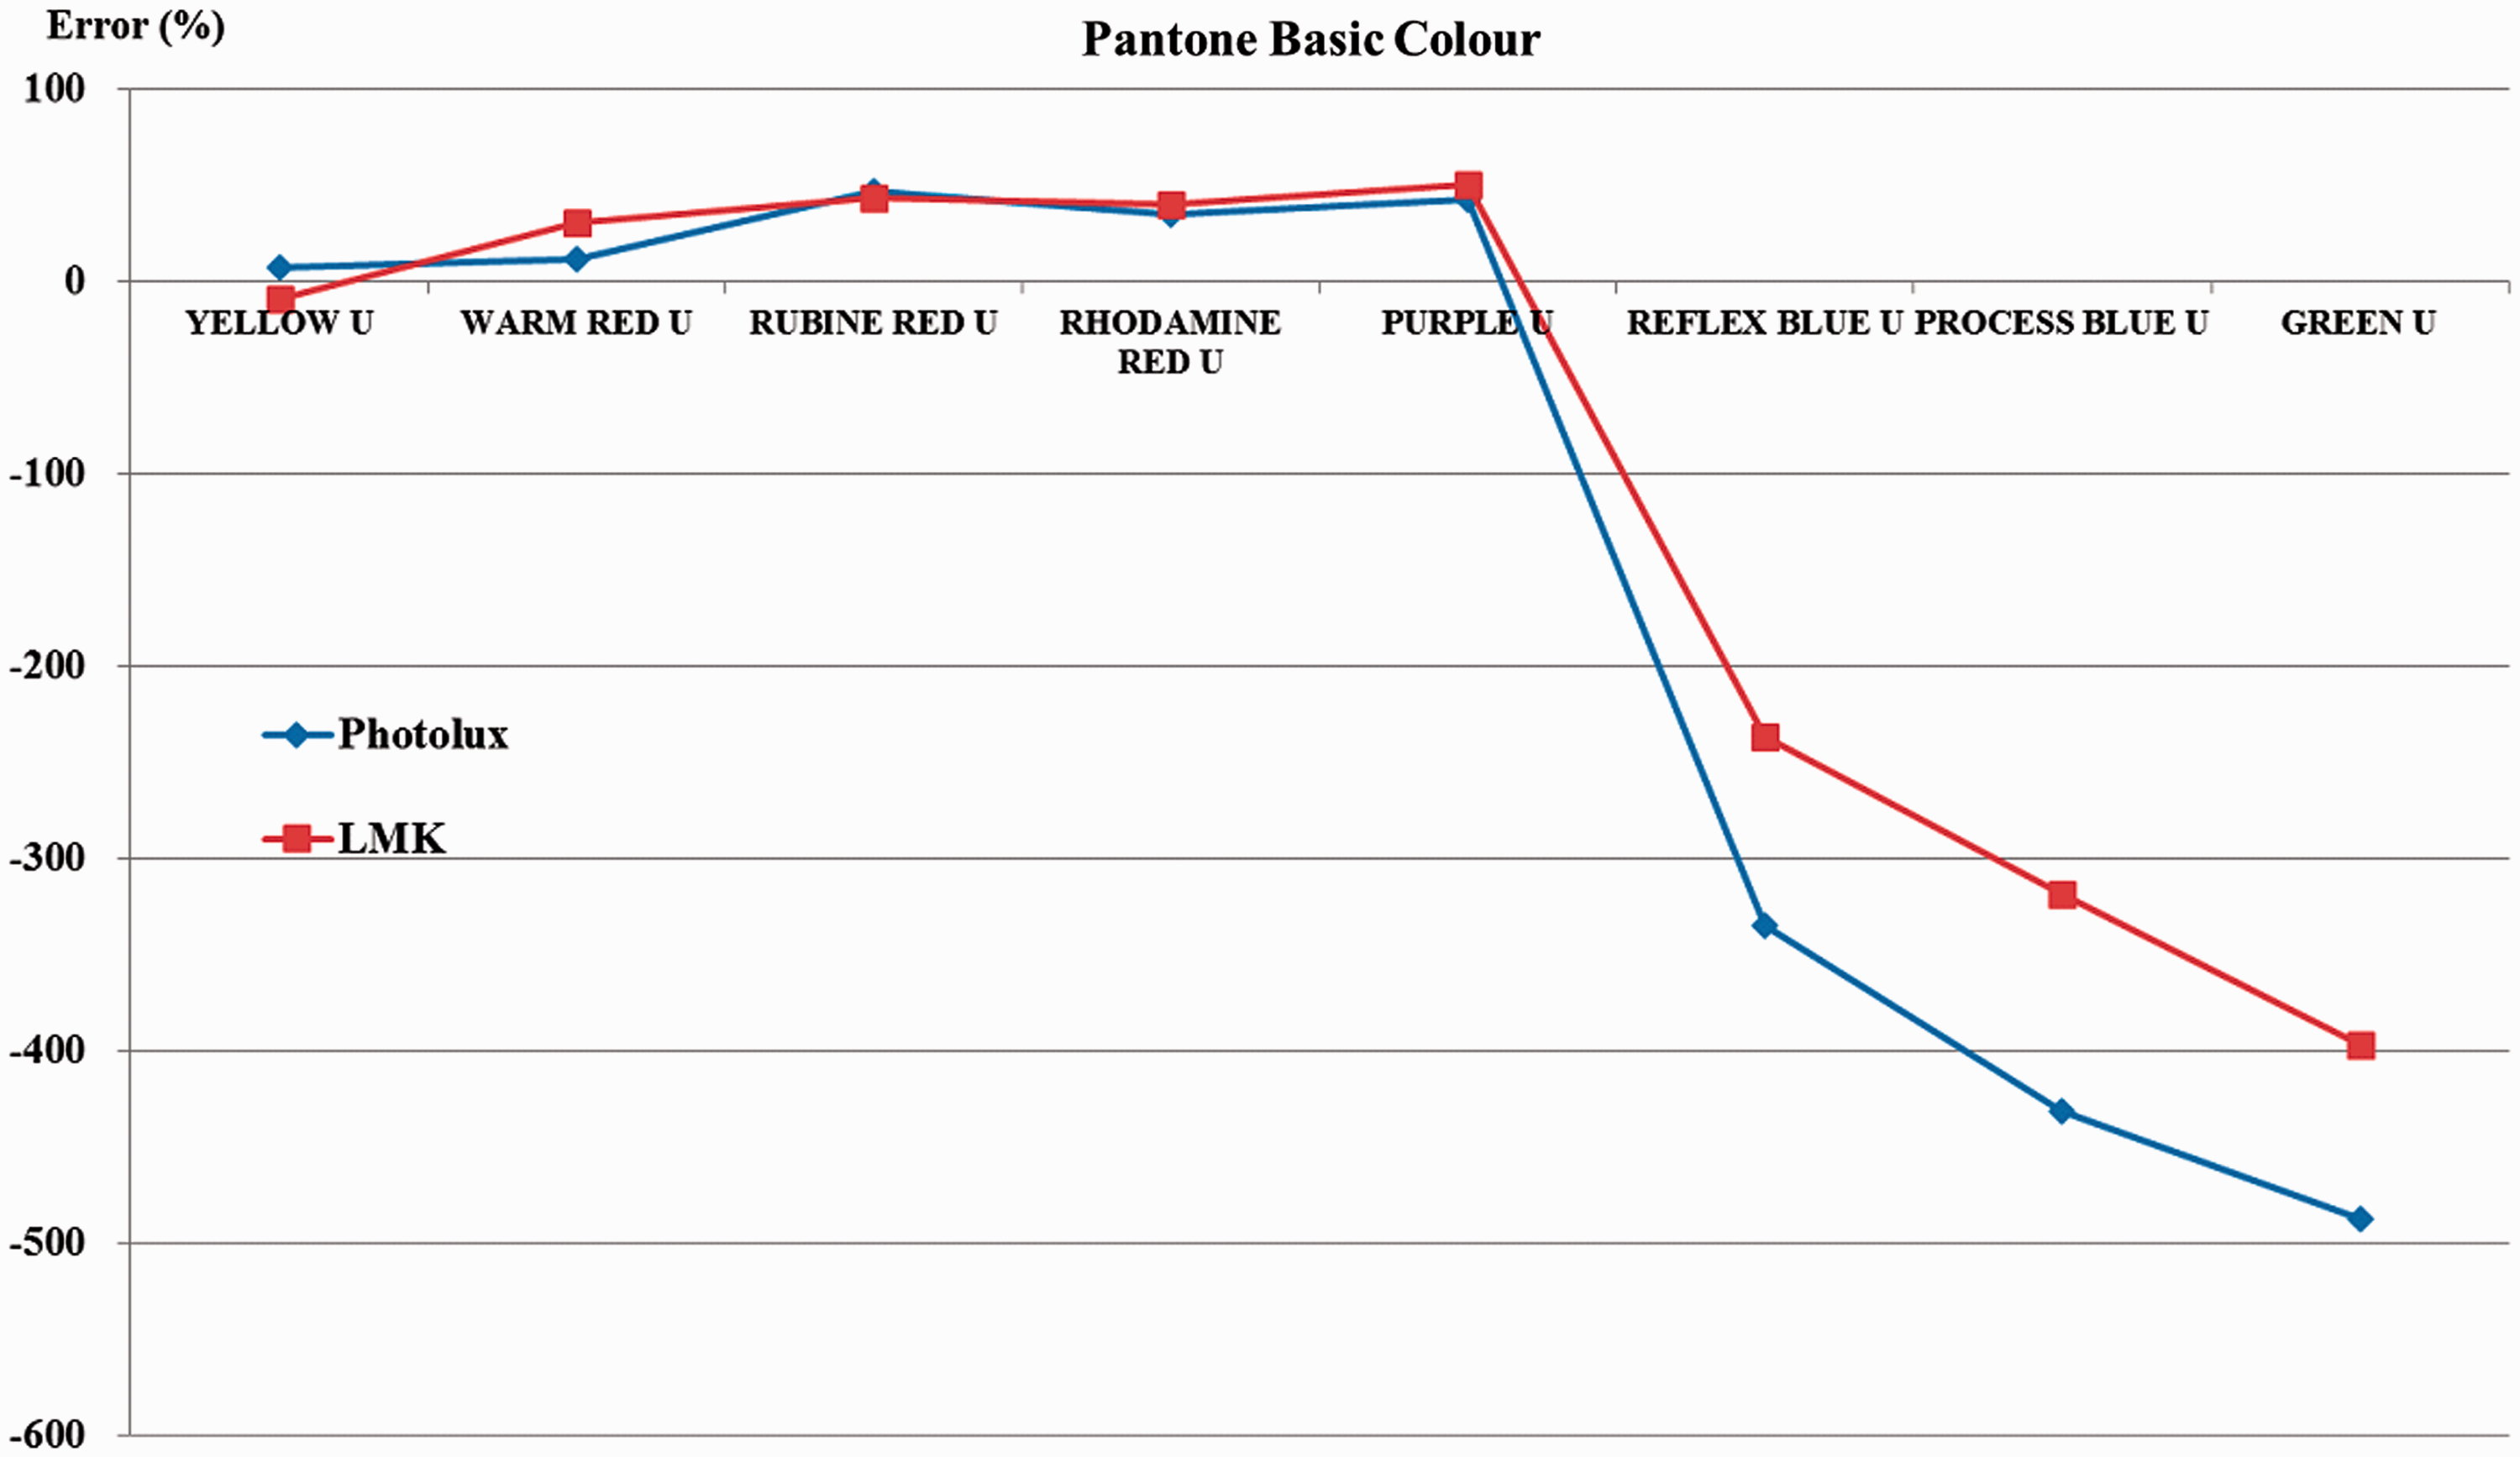
Figure 6 shows the trend of error rates with various colours by HDR mapping when the combination ratio of white and basic colour is 97:3. 100U and 400U represent the yellow and black, respectively. X-axis is the arrangement of colours in a similar way to Figure 5. As shown in Figure 6, few differences were detected on the instrument but in the case of brightest colours, the HDR imaging programs produced different results in luminance. With Photolux, in 100U of yellow, 230U of red and 250U of purple, the error rates were in the range of –9 to 1%, which is relatively good in accuracy. LMK was shown to have an error rate between 20 and 30% in the family colours of red and purple. The error rates by HDR imaging instruments showed a similar trend in 277U of blue and 400U of green. The error rates of 400U were generally between –30 and –40% over –50% in the family colour of blue. As a result, the luminance measurements of the blue family colour obtained using HDR imaging programs become questionable.
Trend of error with various colours by HDR mapping (white: basic colour = 97:3).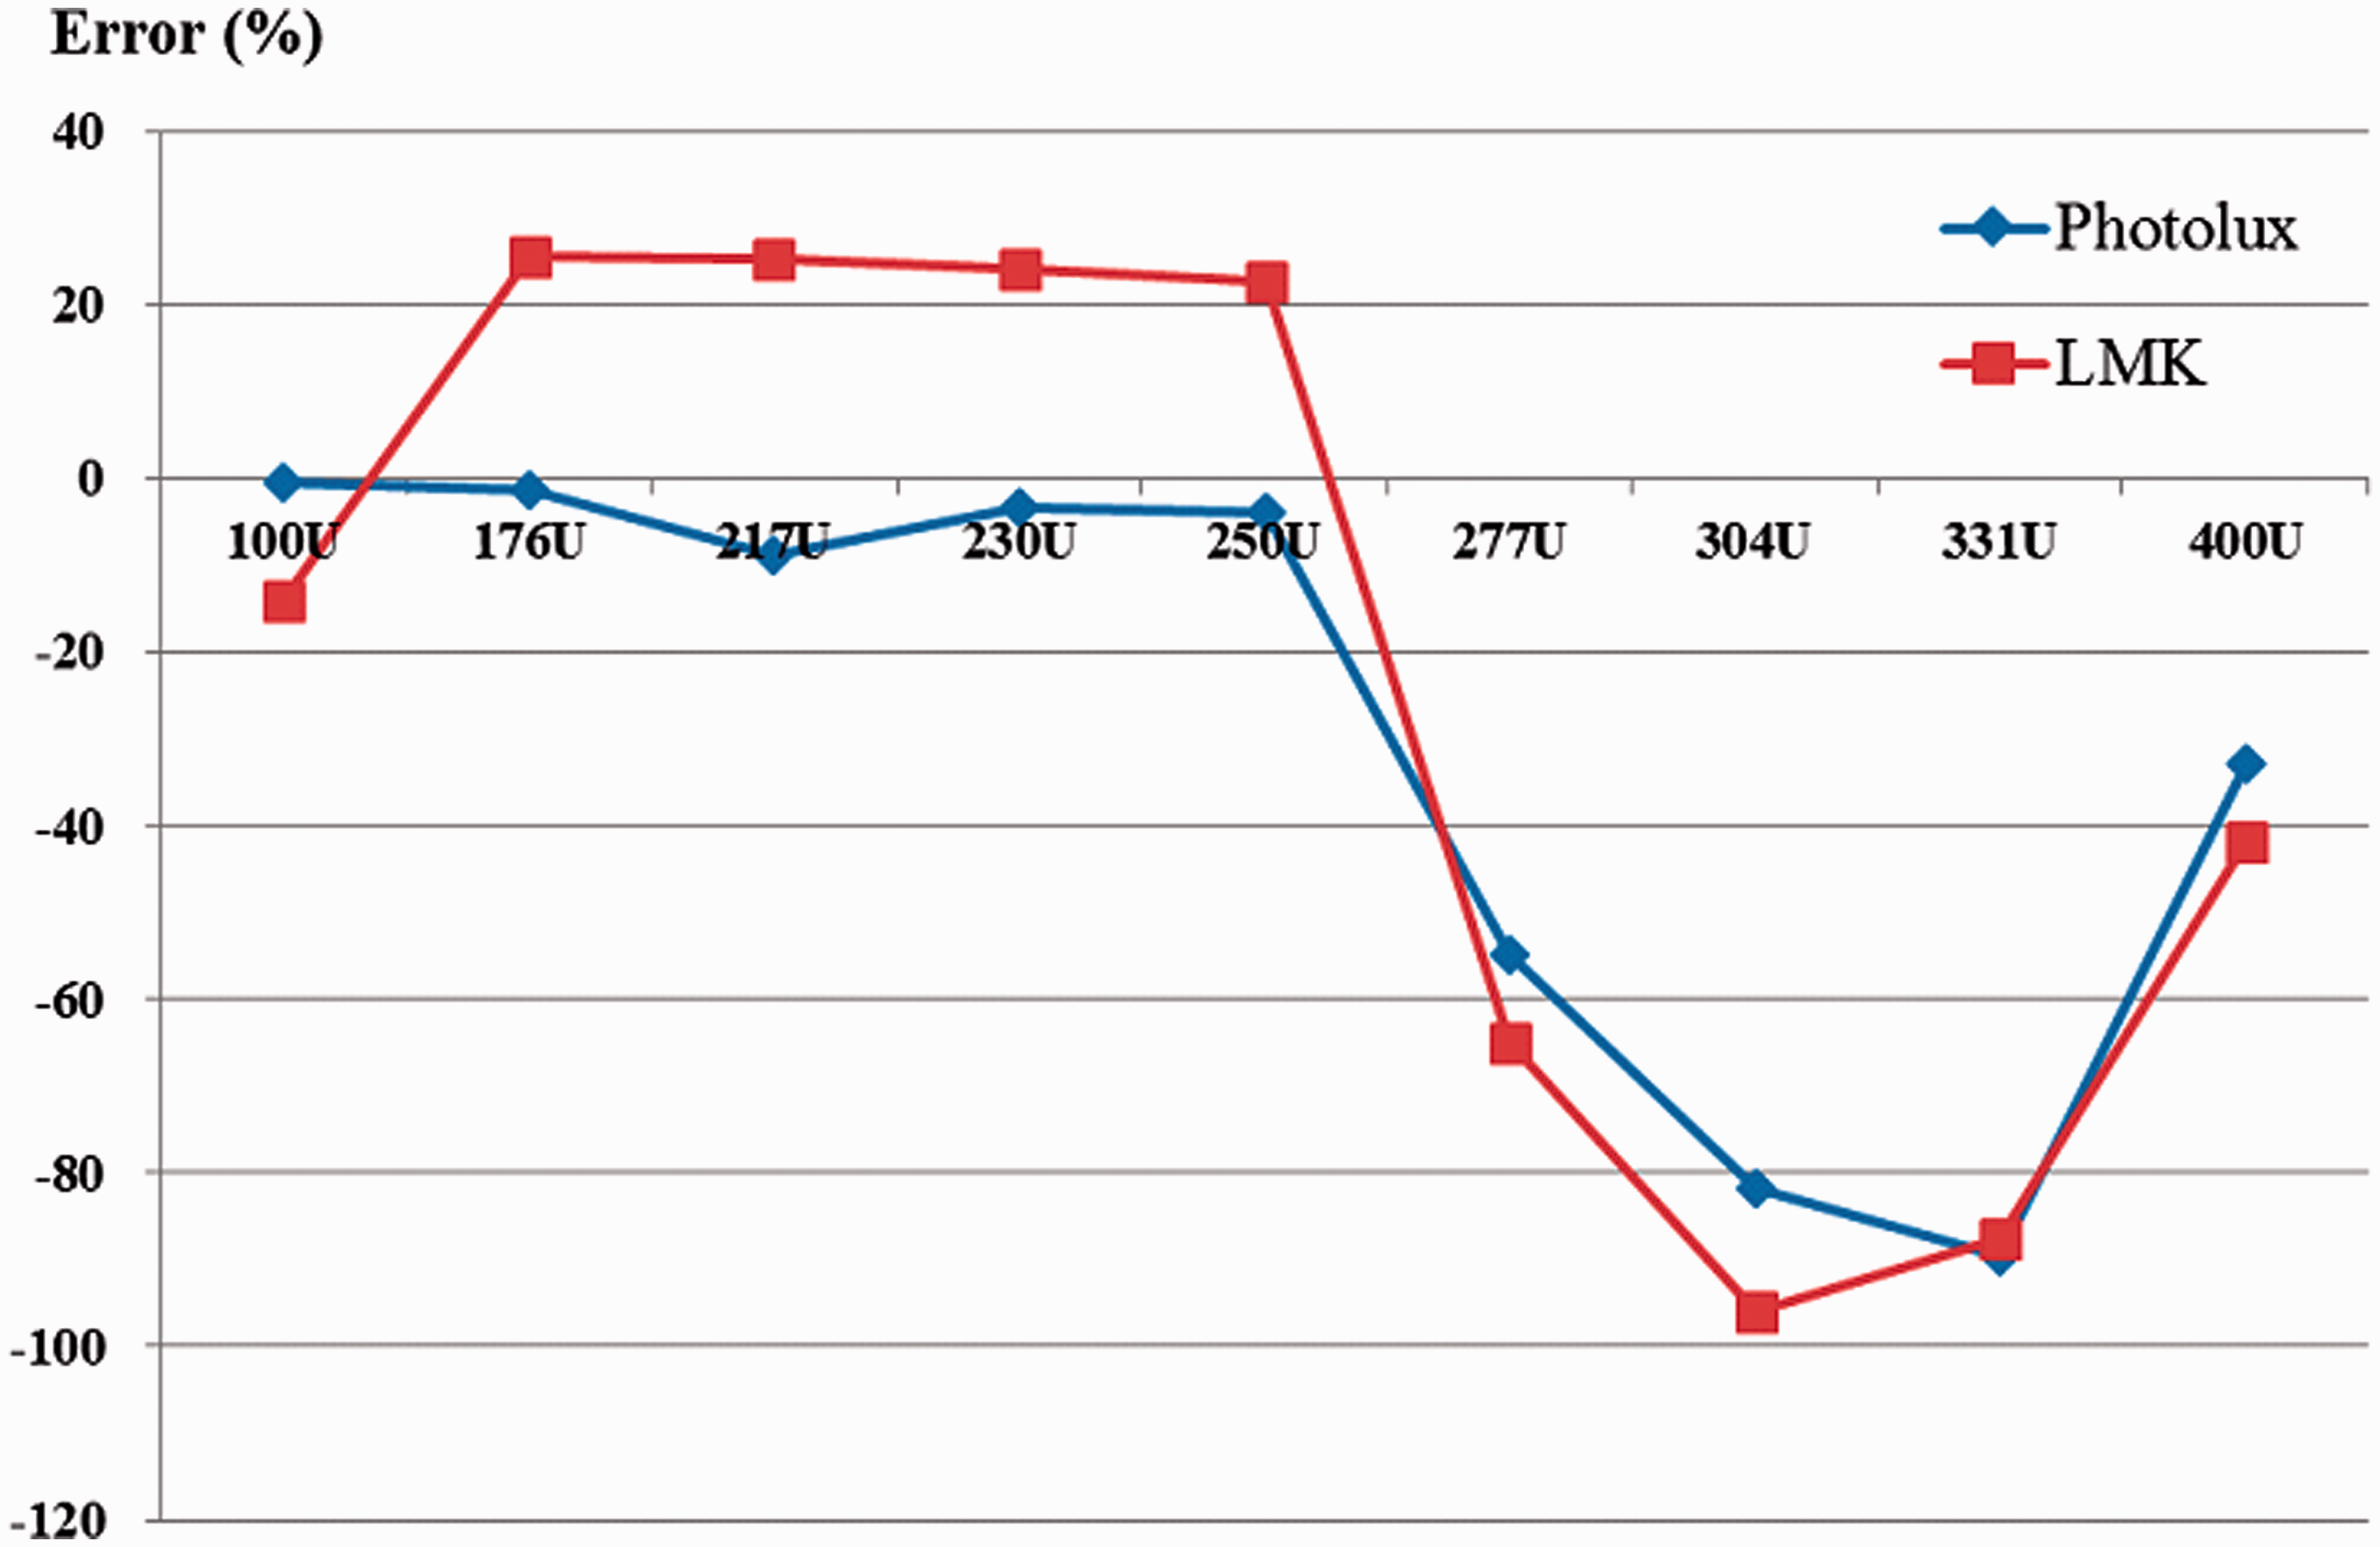
Accuracy based on combination ratio of colour
When the colour combination ratio of white in basic colour was changed, the accuracy of the measurement was analysed. Figure 7 shows the trend of error rates in the family colour of red with different combination ratios of white. The error rates produced by the HDR imaging programs seemed to be getting attenuated as the amount of white colour increased. In case of Photolux, the error rates did not exceed 10% but LMK showed relatively higher error rates of 25–50%.
Trend of error rates in the family colour of red.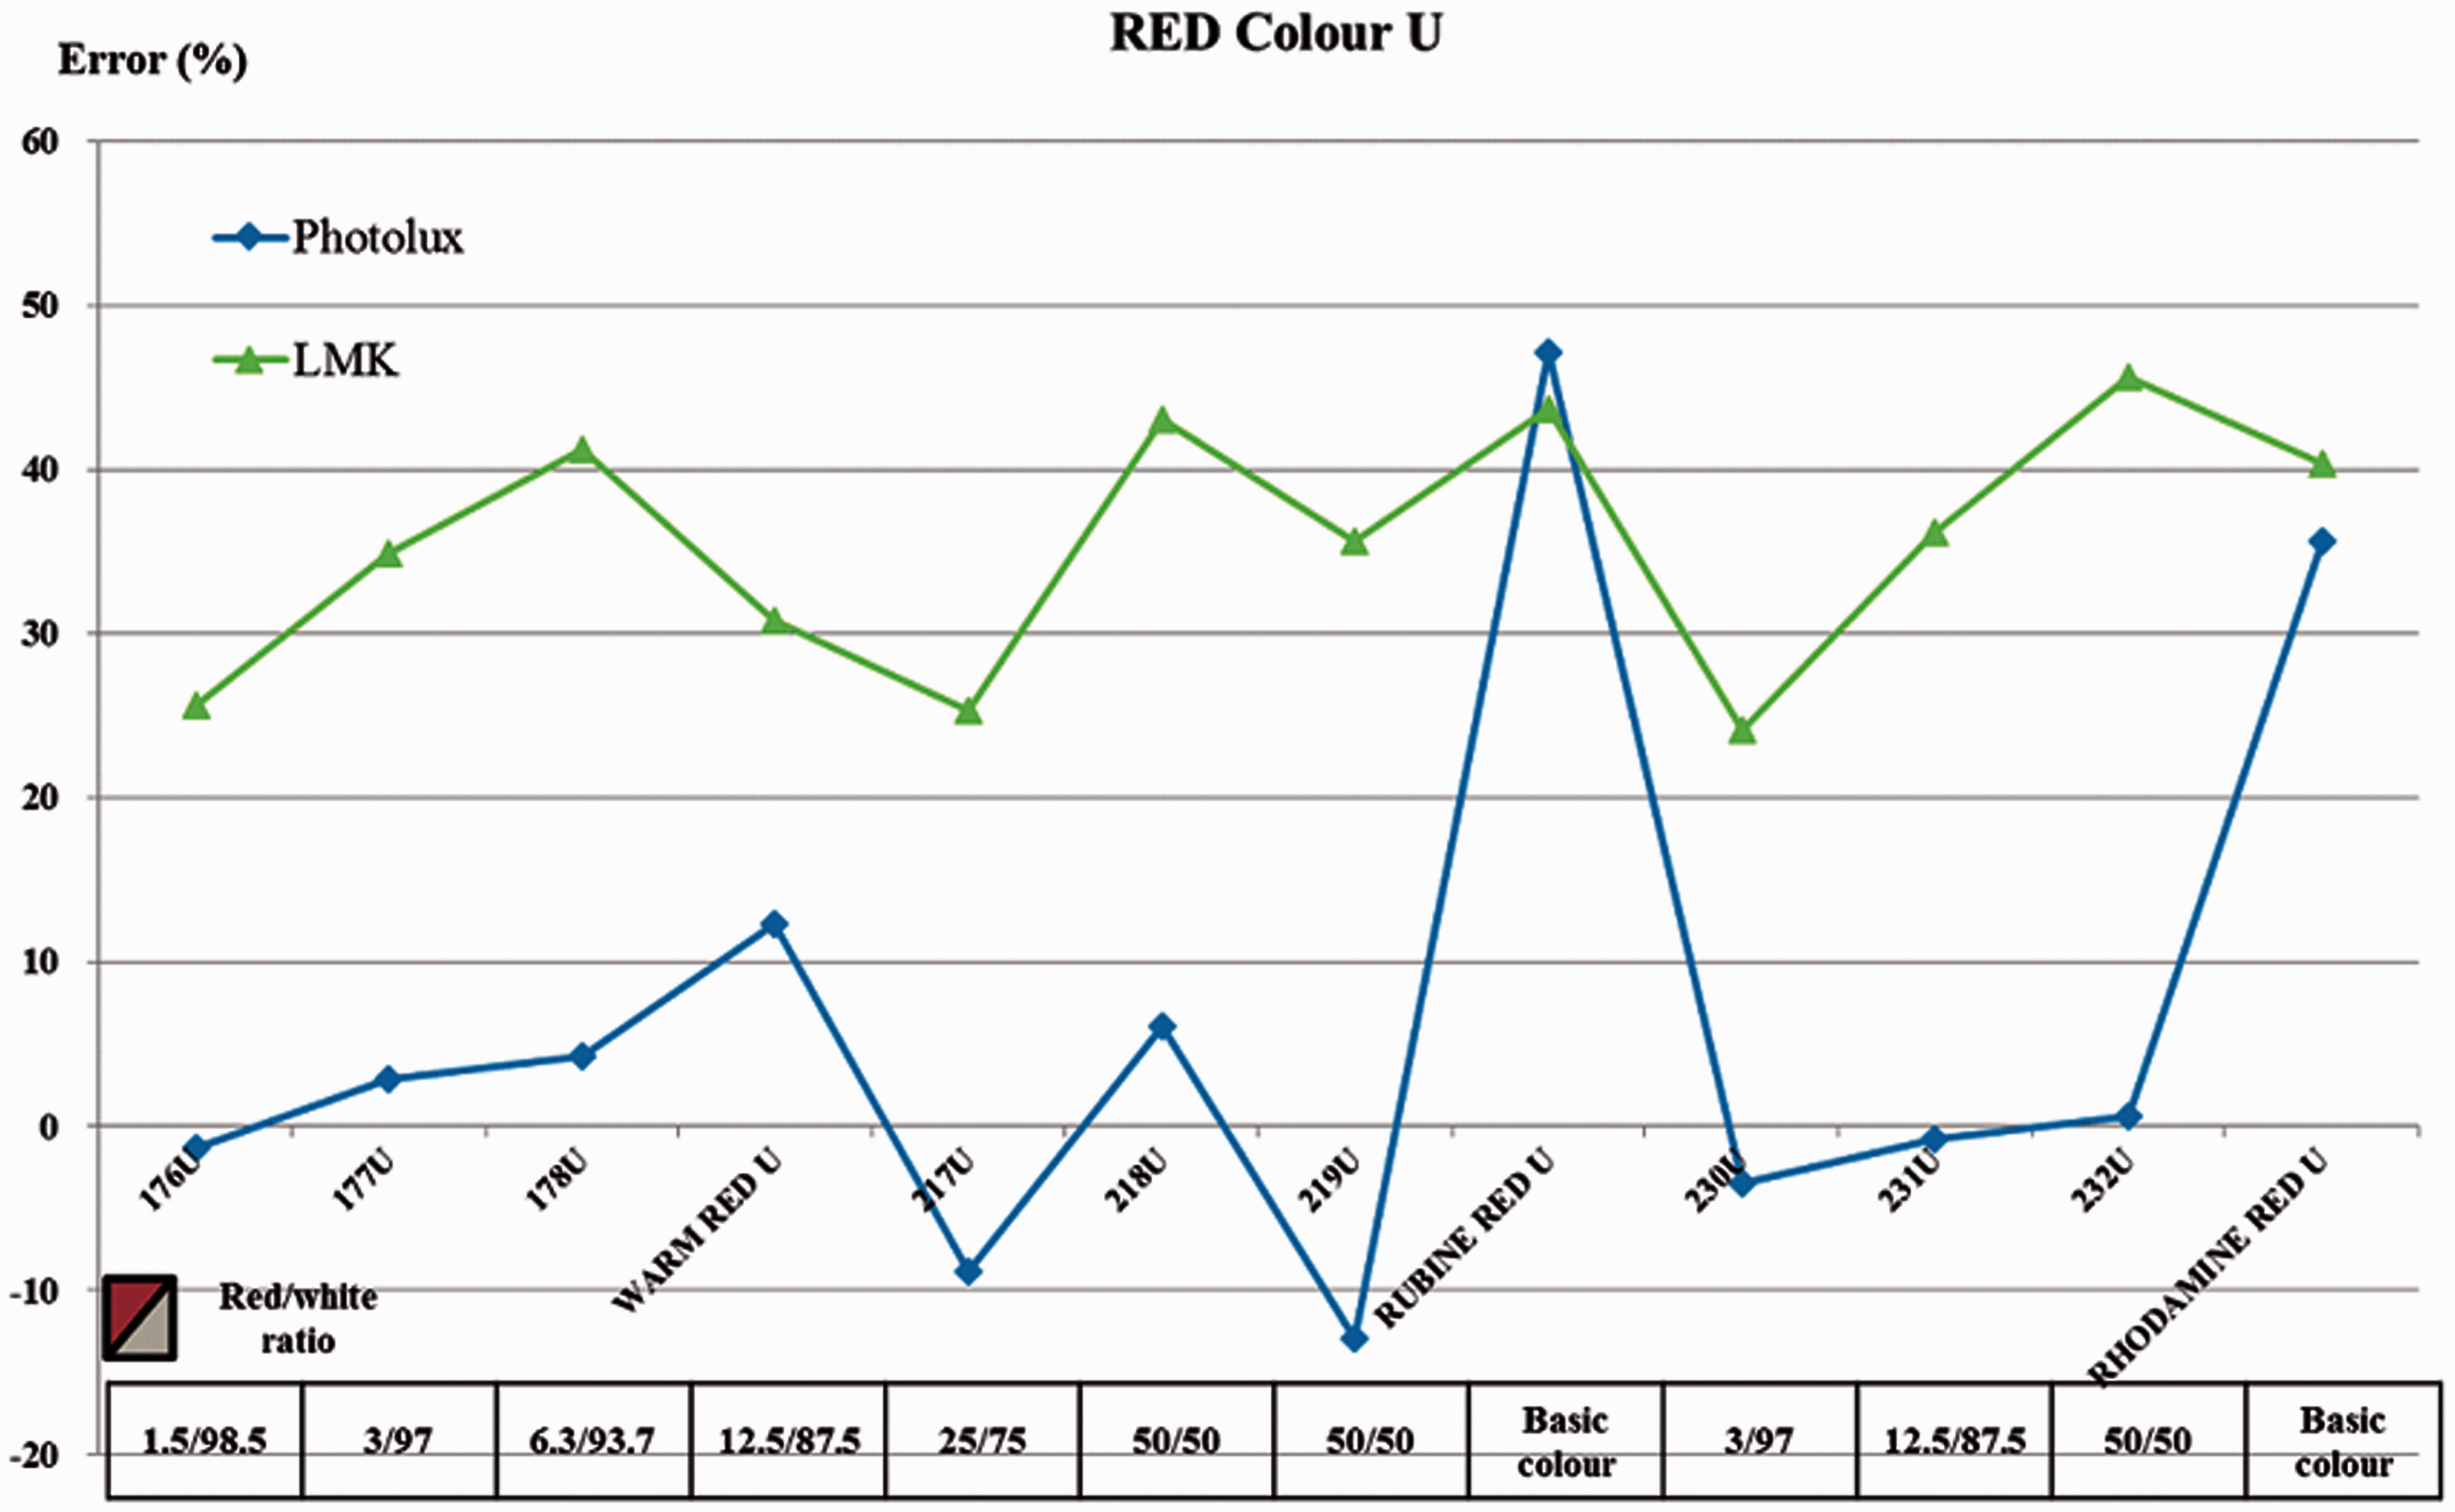
Although the HDR image mapping programs showed almost similar error rates in case of purple, as shown in Figure 8, LMK produced a little higher error rates in luminance measurements which was over 20%. It is concluded that the colour combination ratio of white in basic colour is a major factor when determining the accuracy of image mapping programs.
Trend of error rates in the family colour of purple.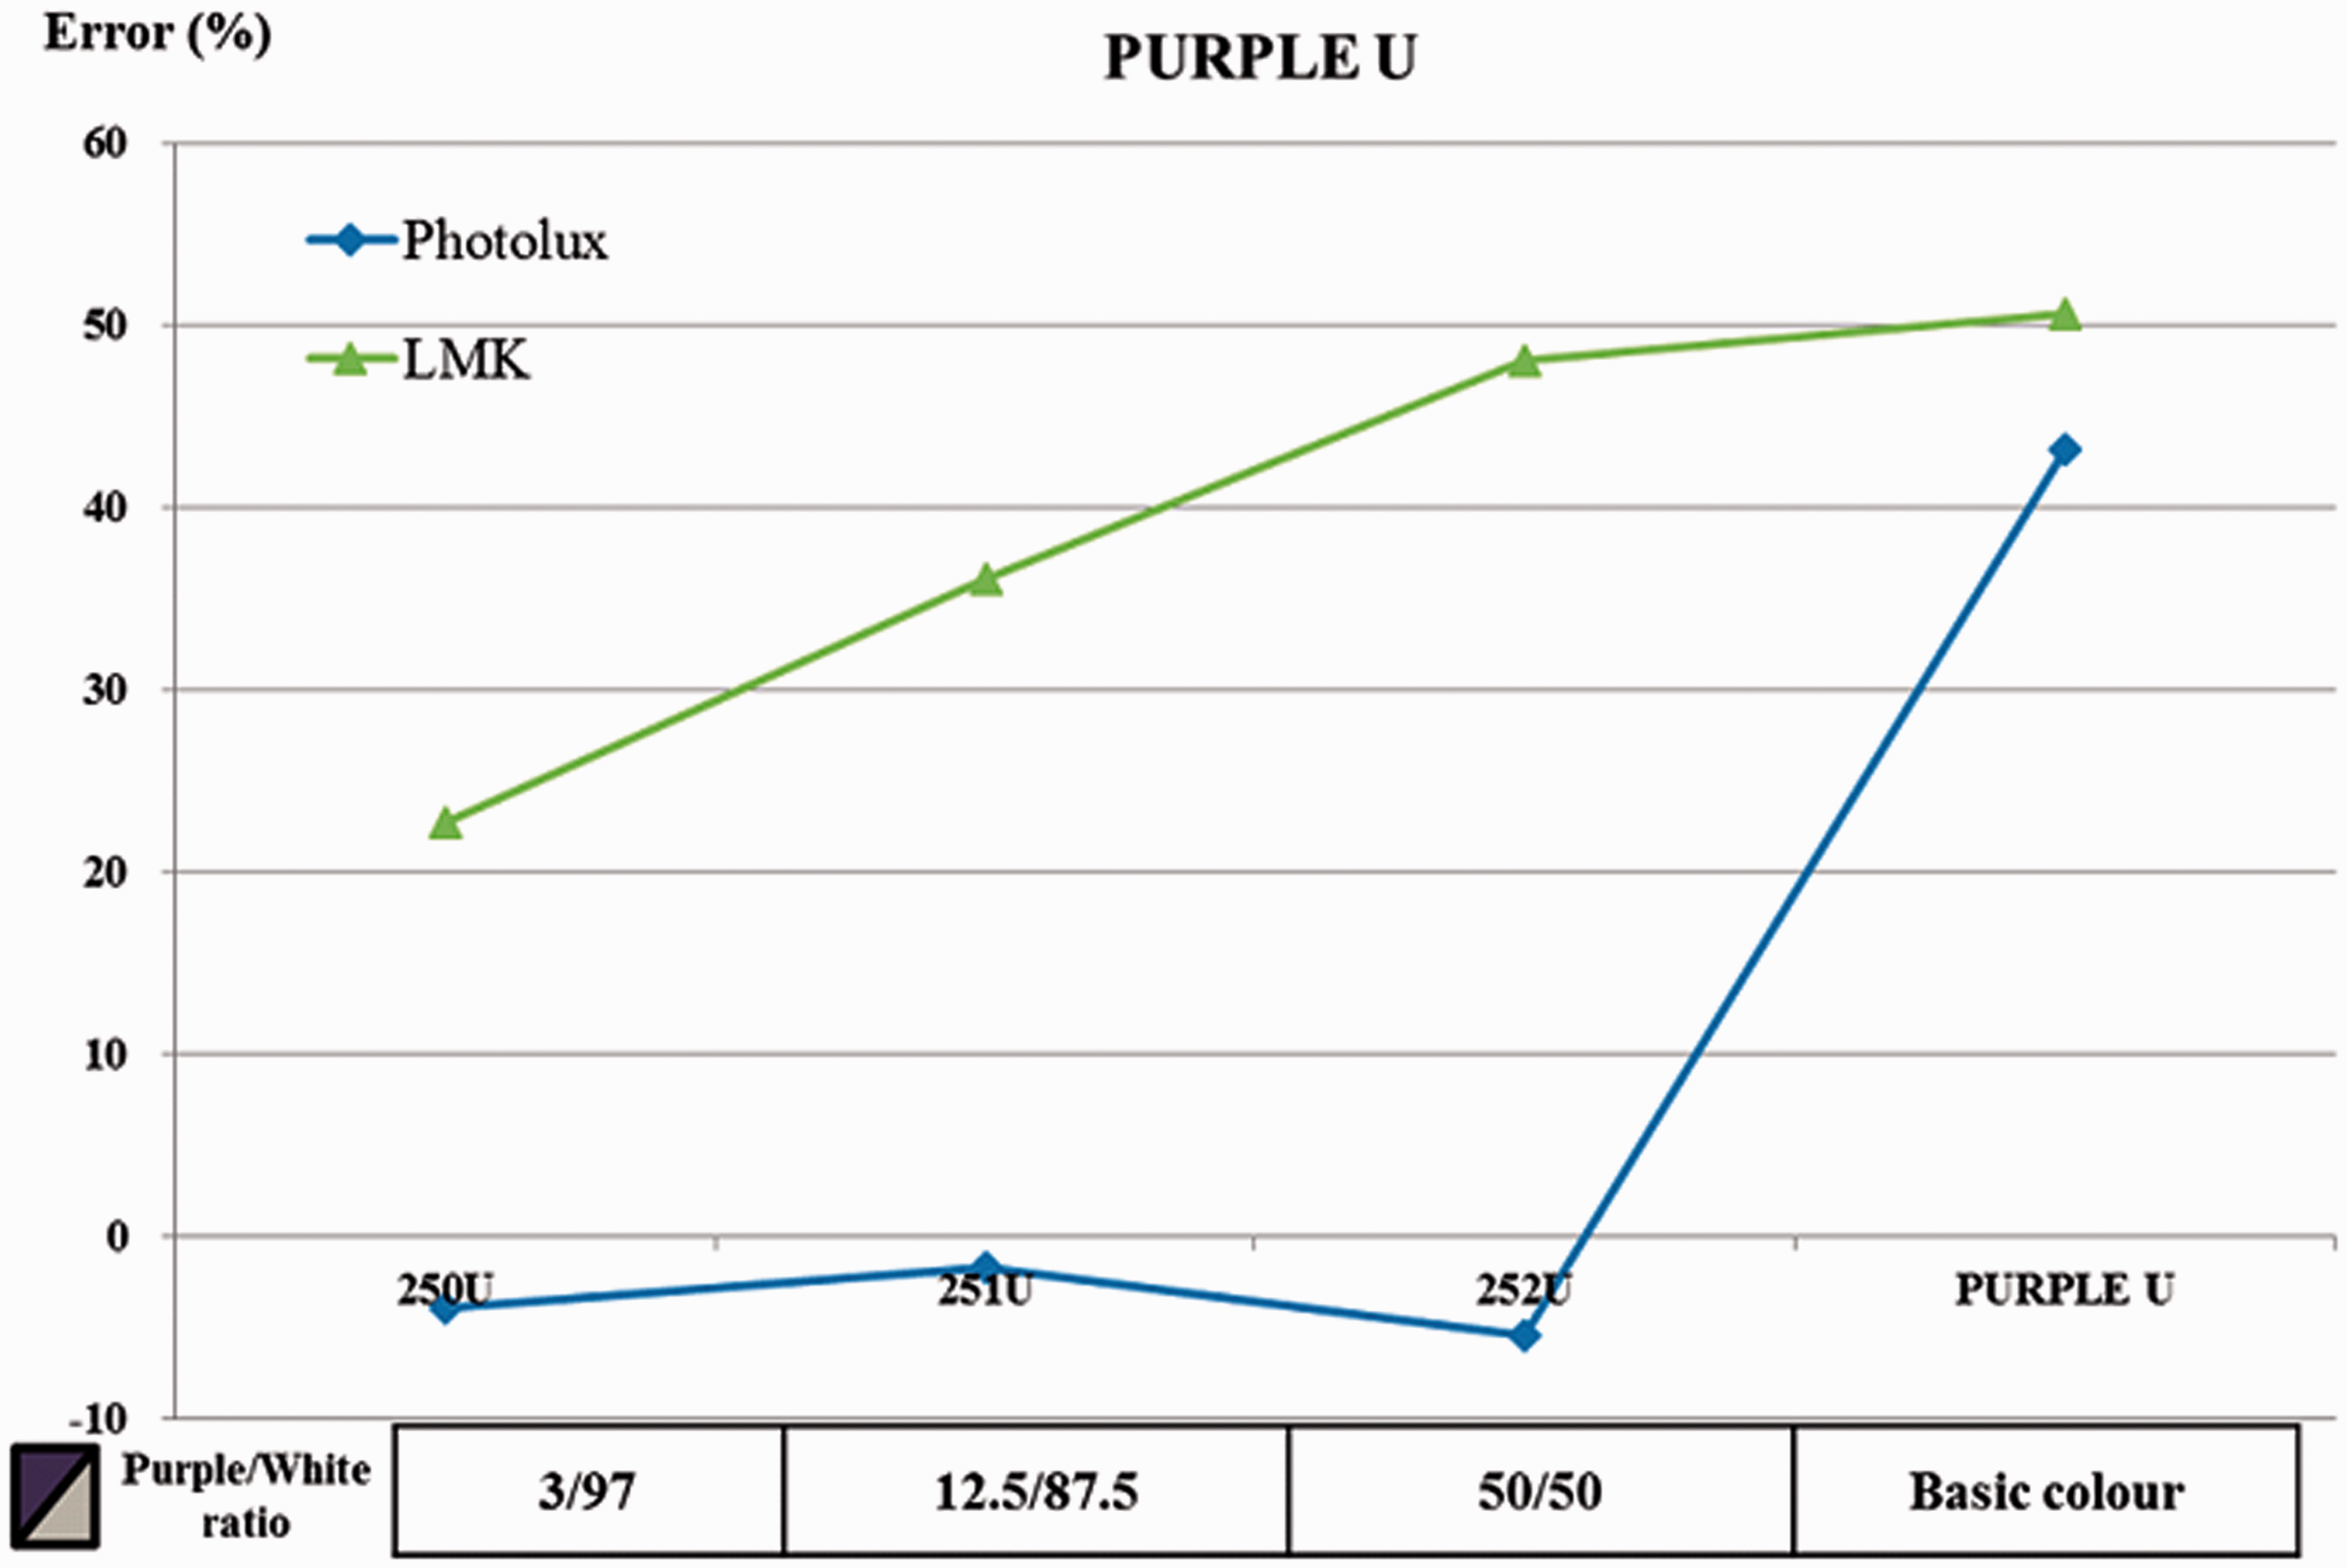
In general, as shown in Figure 9, the HDR image mapping programs showed similar error rates over 100% for the family colour of blue. The trend seemed almost identical with other colours but the error rates kept getting attenuated as the amount of white colour increased.
Trend of error rates in the family colour of blue.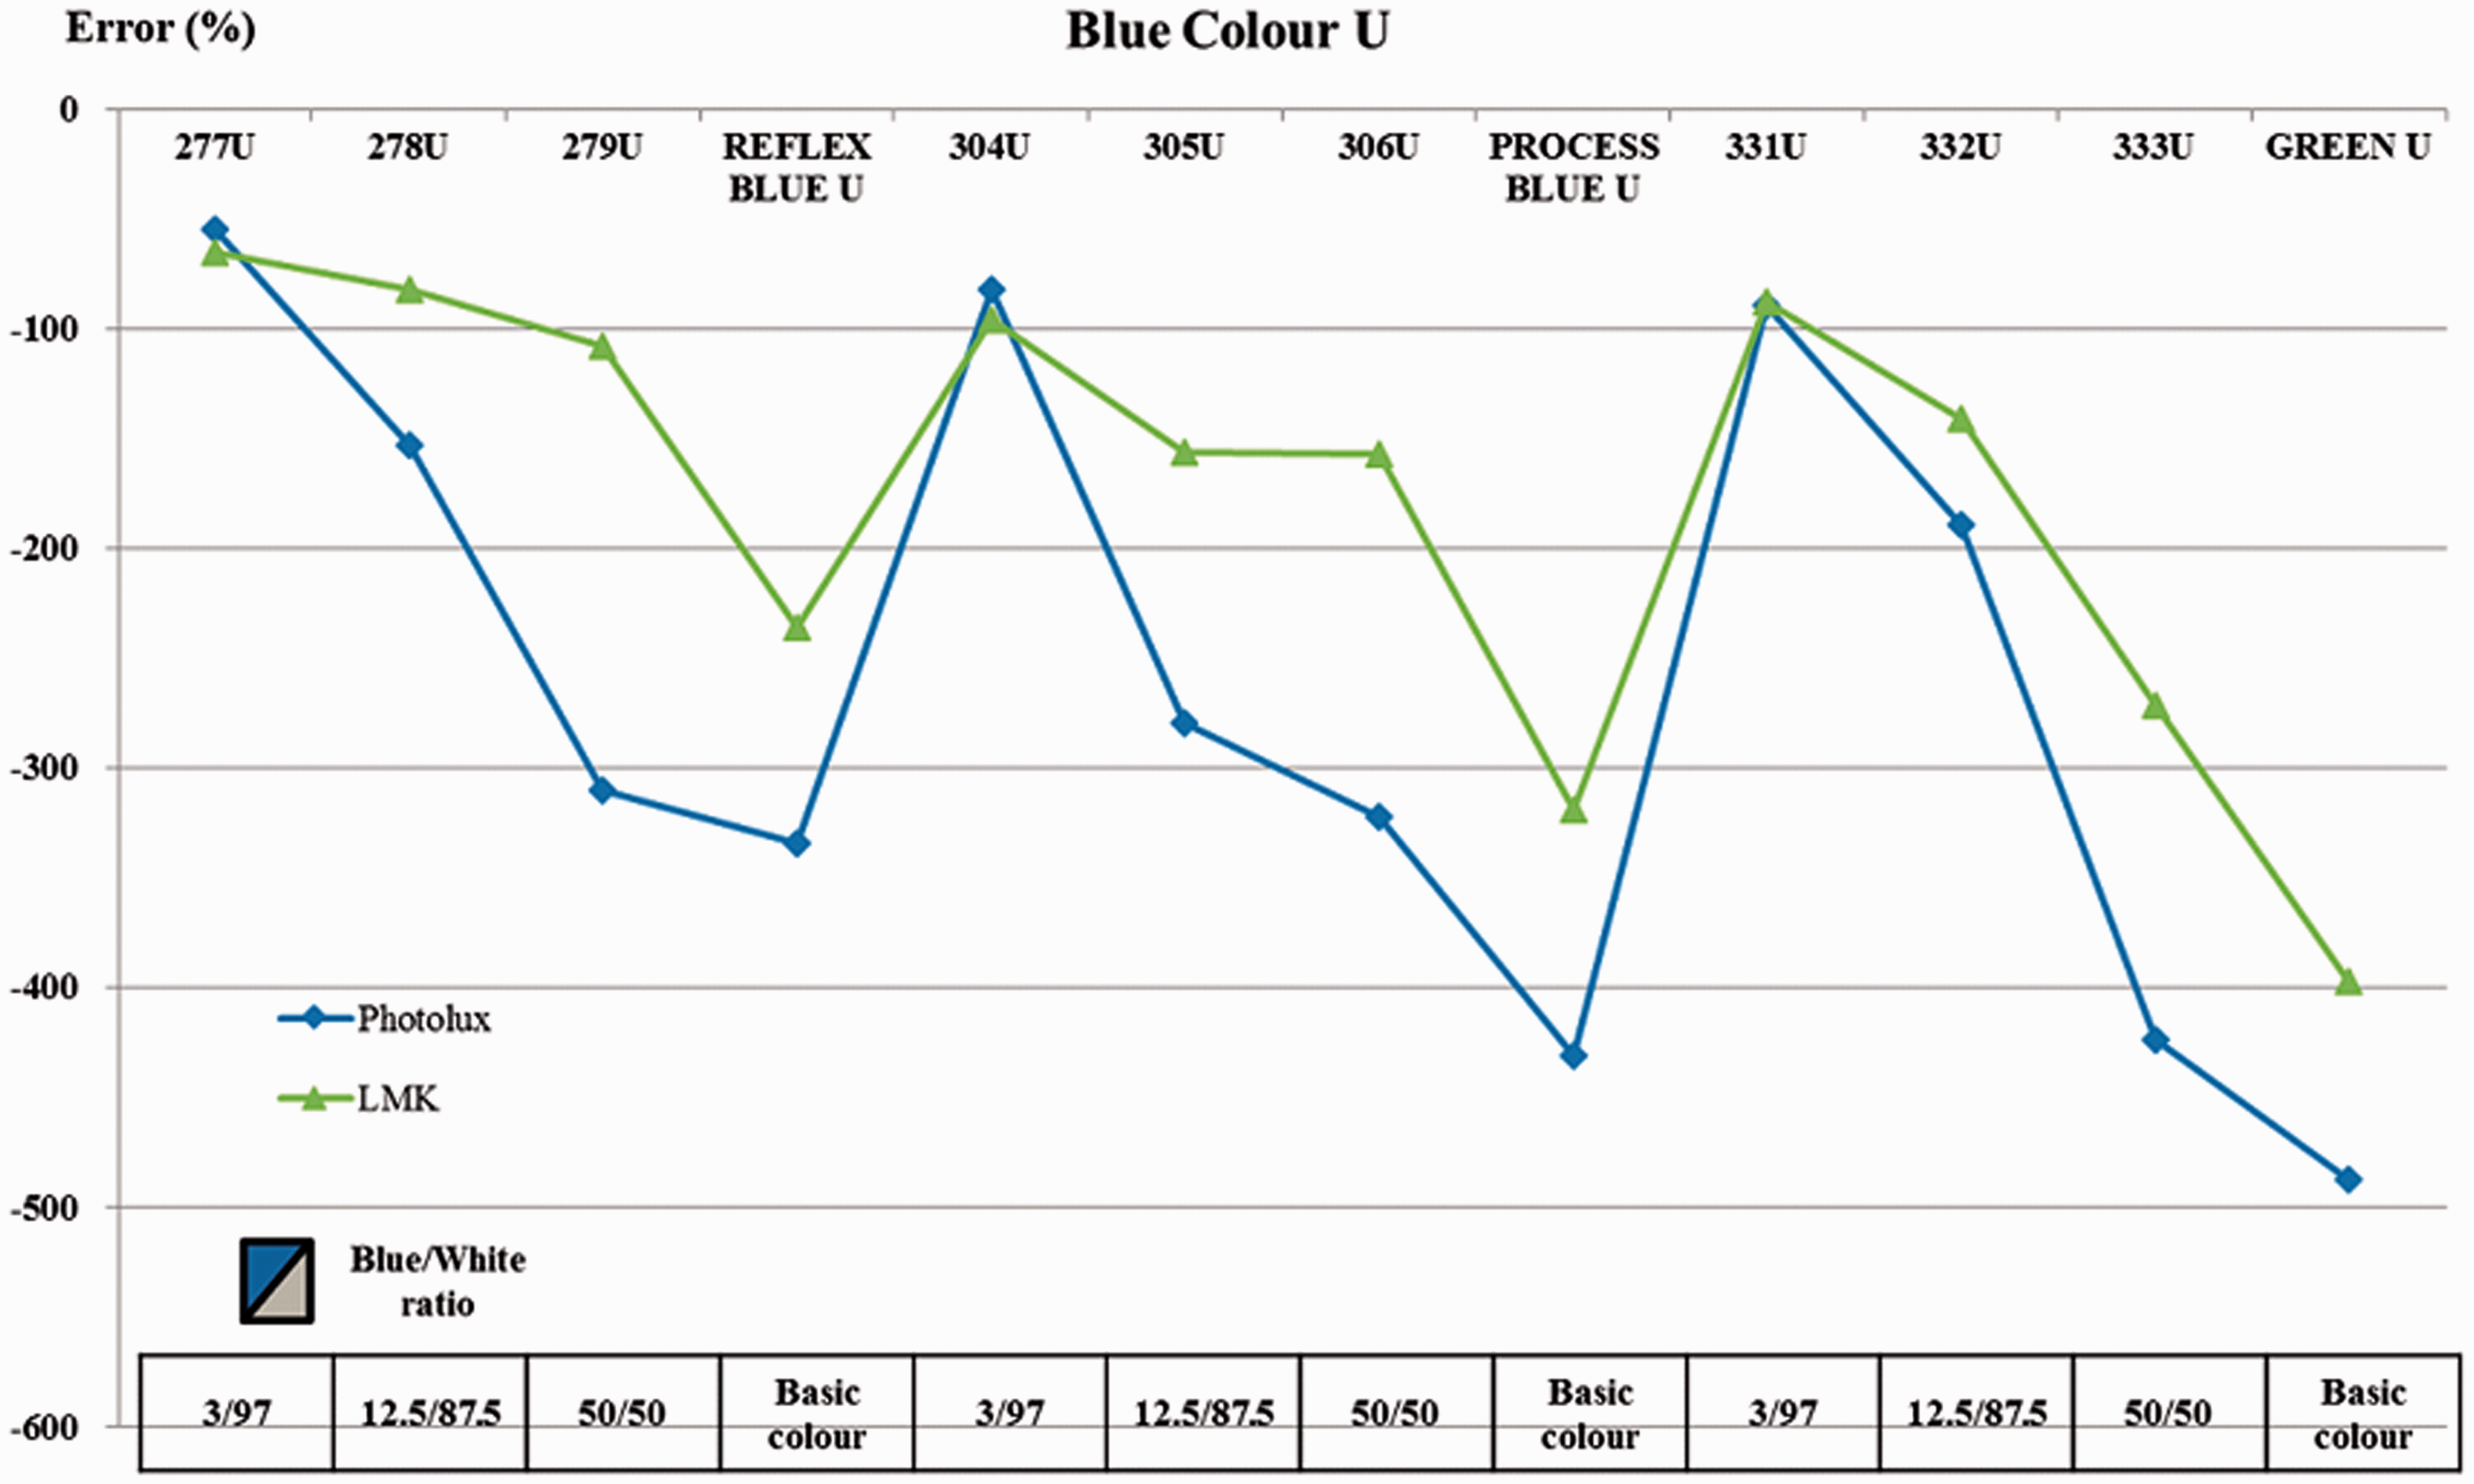
Figure 10 shows the trend of error rates on the various combination ratio of black and white. The ratio begins from 1.5 (white): 98.5 (black) to basic colour with double increment. The set of colour ratio means the optical variation of brightness since the colours are made of black and white. As a result, the error rates of luminance measurements were over 100% when the ratio of white colour was set to 25%. Meanwhile, the error rates seemed to be increasing as the target colour became darker.
Trend of error rates in the family colour of black.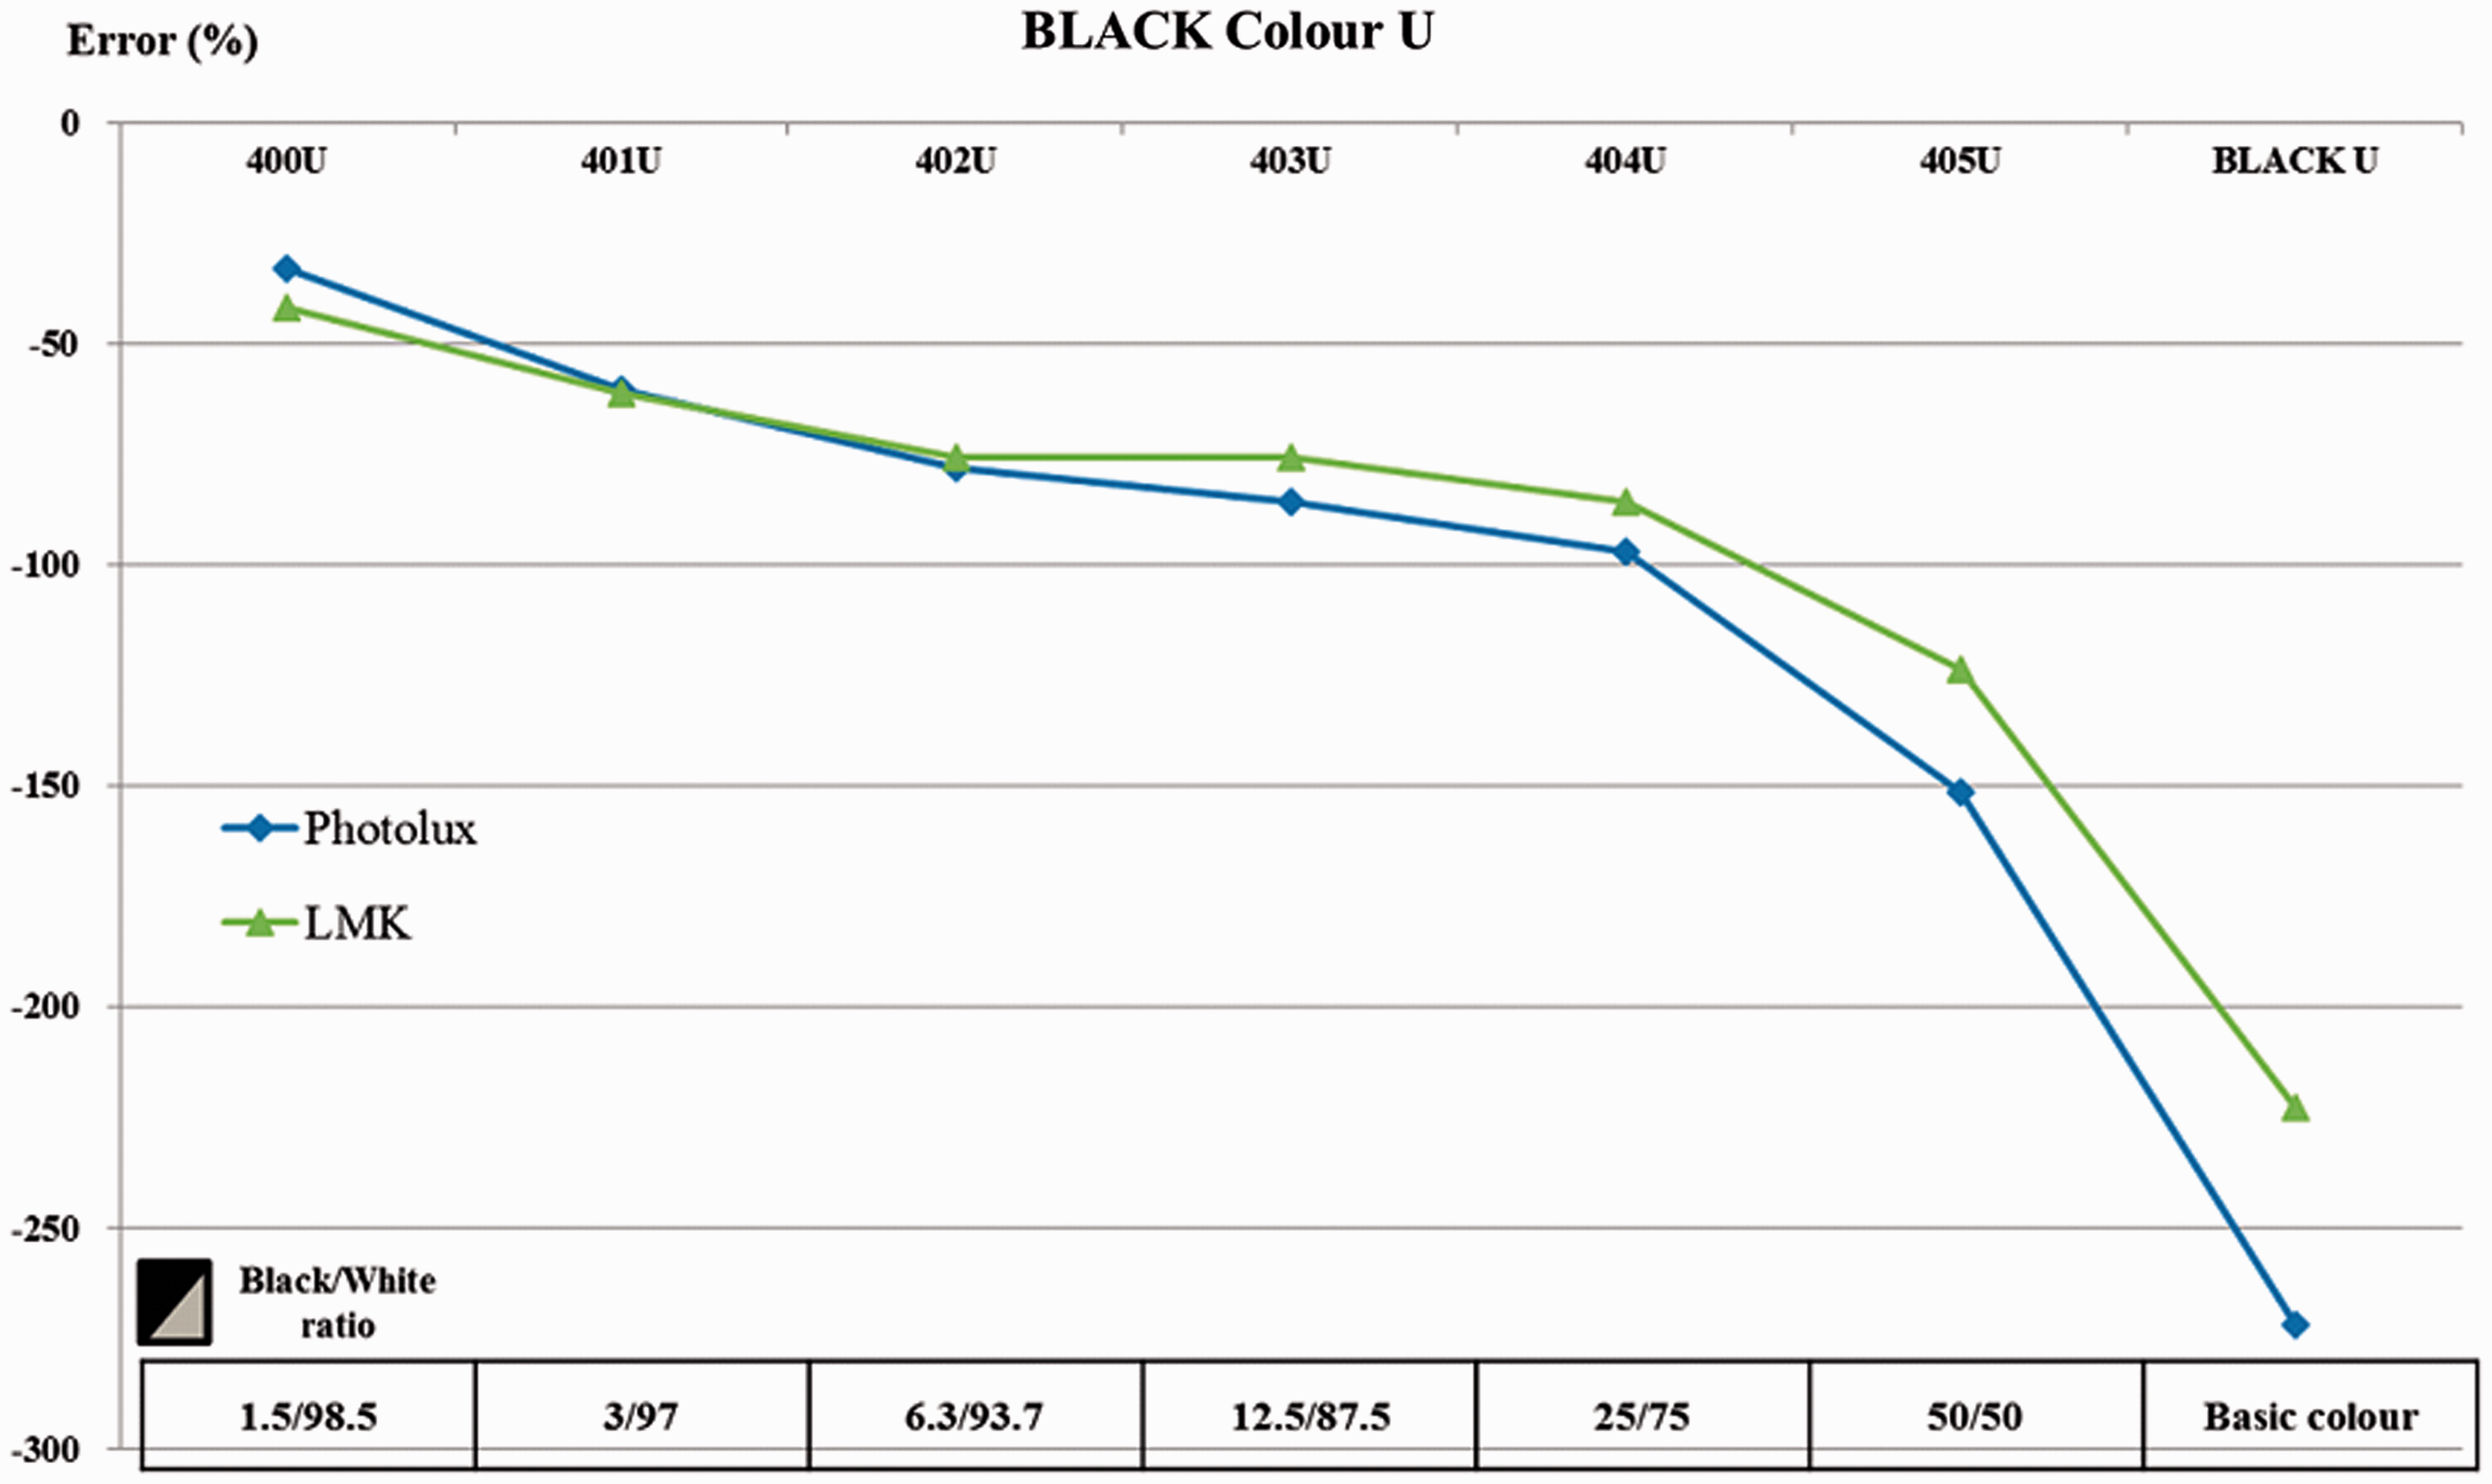
Conclusion and discussion
For decades, lighting professionals have been looking for a quick and practical method for luminance measurement of non-uniform scenes, other than a hand-held luminance meter. This study derives an extension to the conventional evaluation method of a visual environment so that high dynamic range images can be adapted to architectural lighting evaluation, providing accurate luminance.
For this purpose, this study looked into the quality of HDR images generated with representative tools for luminance mapping of their own surfaces of Pantone colours. After comparing field measured luminance data using Minolta LS-100 and Prometric system with those retrieved from the HDR images, error rates were found.
Due to the optical characteristics of mapping tools, it is not possible to get identical values of luminance in daylit environment or electric lighting. As reviewed in literature,16,17 direct measuring of daylight or electric light is not an appropriate as a target light source for the verification of luminance mappings.
The change of colour affects the accuracy in luminance mapping with HDR tools. The different tools showed a similar trend with various colours as targets. The accuracy of the mapped luminance of the blue family colour by using HDR imaging tools becomes questionable. The colour combination ratio of white in basic colour plays a key role in the determination of the accuracy of the luminance measurement in a specific family colour. The error rates produced by the HDR imaging programs seemed to be getting attenuated as the amount of white colour increased.
It is concluded that the colour combination ratio of white in basic colour is a major factor when determining the accuracy of image mapping programs. The error rates of luminance mappings were over 100% when the ratio of white colour was set to a quarter and the error increases with darker colour of the target. Yet error percentages were found much smaller in a certain spectrum and the amount of white colour in the target colour of Pantone. Thus, HDR images may be used for luminance measurement of light sources with enhanced accuracy. Of overall light sources, different colour spectrum and combination of white colour may have an impact on the accuracy of HDR images for luminance mapping.
In the future, we would like to further extend the research to manufacture the HDR image capturing hardware and realistic image synthesis software in a similar way as it was done in previous works in literature but also take into consideration of extending the application to be used for the judgment of light pollution risk as perceived by a human observer.
Footnotes
Acknowledgements
Data acquisition and literature review were carried out by Hongsoo Lim, analysis of the data and post-processing of the outcomes were done by Gon Kim, and Jeong Tai Kim did the outlining of the framework of the study and verified the conclusion.
Authors' contribution
All authors contributed equally in the preparation of this manuscript.
Funding
This work was supported by the National Research Foundation of Korea (NRF) grant funded by the Korea government (MSIP) (No. 2008-0061908).